72
NAVIGATING NON-TARIFF MEASURES INSIGHTS FROM A BUSINESS SURVEY IN THE EUROPEAN UNION
NAVIGATING NON-TARIFF MEASURES
INSIGHTS FROM A BUSINESS SURVEY IN THE EUROPEAN UNION


NAVIGATING NON-TARIFF MEASURES
INSIGHTS FROM A BUSINESS SURVEY IN THE EUROPEAN UNION
NAVIGATING NON-TARIFF MEASURES: INSIGHTS FROM A BUSINESS SURVEY IN THE EUROPEAN UNION
ii MAR-16-66.E
Abstract for trade information services
ID= 43216 2016 C-50 000 NAV
International Trade Centre (ITC) European Commission (EC) Navigating Non-Tariff Measures: Insights From A Business Survey in the European Union Geneva: ITC/EC, 2016, xi,53 Doc. No. MAR-16-66.E
The paper examines how non-tariff measures (NTMs) applied by the European Union’s major trading partners impacts EU exporters of goods – results are based on a survey of 8,100 companies from across 26 sectors in the EU’s 28 member states – describes the survey methodology; presents the main results obtained in terms of impact on EU companies, by type of NTM, effects on companies of different sizes, particularly micro, small and medium-sized enterprises; draws conclusions on the importance of the role of the EU’s negotiating agenda and implementation work to facilitate international trade. It includes survey data statistics and bibliographical references.
Descriptors: European Union, Non-Tariff Measures, Market Access, Exports, SMEs, Trade Policy.
For further information on this technical paper, contact Ursula Hermelink ([email protected])
English
The International Trade Centre (ITC) is the joint agency of the World Trade Organization and the United Nations.
ITC, Palais des Nations, 1211 Geneva 10, Switzerland (www.intracen.org)
More information on the European Commission is available on the Internet (http://europa.eu).
Digital image on the cover: © Fotolia
© International Trade Centre and European Commission, 2016
ITC and EC encourage the reprinting and translation of this publication to achieve wider dissemination. Short extracts of this technical paper may be freely reproduced, with due acknowledgement of the source. Permission should be requested for more extensive reproduction or translation. A copy of the reprinted or translated material should be sent to ITC.
NAVIGATING NON-TARIFF MEASURES: INSIGHTS FROM A BUSINESS SURVEY IN THE EUROPEAN UNION
MAR-16-66.E iii
Foreword European Commission
To be successful, EU exporters need to make a substantial effort to understand and comply with all trade formalities and regulations that apply to their products in the European Union (EU) and in third country markets. The EU, and the European Commission in particular, supports these efforts by promoting transparency of rules, coherence of international regulations and standards, and mutual recognition in full respect of the right of governments to pursue their legitimate public policy objectives. The EU has an ambitious agenda cutting across several policy areas. It aims to promote international agreements for better cooperation, and convergence or harmonization of legislation. The Commission’s Market Access Database also helps clarify export conditions for EU companies by providing product-specific information on tariffs, import requirements and statistics for over 100 partner countries.
Becoming a successful exporter, however, still requires a lot of effort, particularly for small and medium-sized enterprises (SMEs). The Commission carried out this comprehensive pan-European survey of exporting companies in close cooperation with the International Trade Centre, a United Nations agency well-known for their work in this field. The survey and this report highlight the challenges firms face and bring new evidence on how non-tariff measures the EU’s major trading partners apply affect actual EU exporters.
The report offers a wealth of detailed information and confirms the essential role of our negotiating agenda and implementation work to facilitate international trade. It also confirms the Commission's approach to accessing third country markets and the compelling need to further focus the efforts by EU Member States, business and the Commission on the most important barriers that hamper market access for our companies. Our continuous efforts to support EU exporters, in particular SMEs, will achieve maximum impact if they allow businesses to find their way through the variety of trade rules and regulations described in this report.
Our work is further enhanced through initiatives such as the Market Access Strategy and its Trade Database, and the Intellectual Property Rights and Trade Defence Helpdesks for small and medium-sized firms. In particular, where EU exporters face unjustified trade obstacles, the Commission, together with Member States and business, will identify and pursue appropriate strategies to remove them. This report also highlights how important is that trade infrastructure functions well, both at home and in the importing countries. Aside from tackling trade hurdles in partner countries, further streamlining of export formalities could also help EU exports. The report highlights, in particular, opportunities for further improvement in the area of rules of origin and customs procedures, as well as access to information for existing and potential exporting firms. It also points to the critical role EU Member States have to play in managing and implementing the EU’s customs regime, in making it easier to get various certificates and supporting documents, and in streamlining their trade and investment promotion activities.
This report also reconfirms how important it is for the EU, its Member States and stakeholders to work together under the ‘Enhanced Market Access Partnership’. It is vital they cooperate in implementing existing regulations and agreements, in supporting EU exporters overcome non-tariff barriers, in tackling trade barriers and in streamlining procedures.
This should save EU exporters time and money, thus making their products more competitive on world markets and helping them to participate more successfully in global value chains. Such joint efforts should ultimately help to ensure growth and jobs: on average every billion euros worth of EU exports supports more than 14000 jobs in the EU.
The report demonstrates how lowering barriers to trade can also help developing country partners. It is not only EU exporters who benefit, but also traders in developing and emerging economies. Lower barriers enable more firms to integrate within global and regional value chains, bringing knock-on benefits of inclusive growth and sustainable development. In this way, international trade can deliver in its role as a way to help countries achieve the United Nations’ Sustainable Development Goals.
Jean-Luc Demarty Director-General for Trade, European Commission

NAVIGATING NON-TARIFF MEASURES: INSIGHTS FROM A BUSINESS SURVEY IN THE EUROPEAN UNION
iv MAR-16-66.E
Foreword International Trade Centre
Trade in the 21st century faces fewer traditional tariffs, but has seen a proliferation of rules and regulations that affects the movement of goods and services. These non-tariff measures (NTMs) can play an important role in addressing safety and environmental issues. Yet, many small and medium-sized enterprises (SMEs) are unable to recognize or meet many of these standards. By enhancing the transparency of these measures, we can go a long way in helping businesses to navigate this new global trade landscape.
This report provides valuable insights about NTMs, as experienced by European exporters. The report is based on 8,100 company interviews in all 28 European Union (EU) countries, most of them SMEs, and covers their perception of NTMs as they
source from and export to non-EU markets. It is a meaningful complement to ITC’s NTM Survey work since 2010, which focuses on companies in developing countries exporting to and from the European Union.
This survey shows that EU businesses report regulatory obstacles much as businesses in developing countries do. Their main concerns are technical regulations, conformity assessment procedures and rules of origin. They share the view that the burden is entirely or partially due to procedural obstacles, rather than to the stringency of the regulations themselves.
Many barriers arise due to local capacities and facilities. Market access begins at home, but ends in the destination market. There is scope to work with partner authorities on streamlining processes, harmonizing regulations and providing consistent, transparent and timely information – especially for smaller companies and first-time exporters.
Access to trade and market intelligence is critical to export success. However, many SMEs struggle to find information about requirements in destination markets, particularly in developing economies. ITC has developed programmes to provide critical market intelligence and is at the forefront of advocating transparency in trade.
With EU support, ITC provides intelligence to companies and policymakers on non-tariff regulations imposed by more than 90 countries. ITC ensures that SME concerns about regulatory and procedural trade obstacles are brought to policymakers and other stakeholders for action in countries, regions and multilateral organizations. Recently, ITC, the World Trade Organization (WTO) and the United Nations Department of Economic and Social Affairs (UNDESA) launched an ‘e-Ping’ alert system for technical barriers to trade and sanitary and phytosanitary measures notified at the WTO.
These initiatives are part of ITC’s ongoing dialogue with exporters and importers, in order to monitor the constantly changing trade challenges, and tailor policy responses accordingly. The solutions are sometimes much closer to home than one might expect.
This report shares concerns of European exporters, often in their own words. Unprecedented in scope, we hope that this report will serve as a springboard to integrate the voice of European business in trade negotiations and policymaking. We also hope that this report will serve as a benchmarking tool for trade-related technical assistance, so that developing countries improve their capacity to trade with the EU. I look forward to collaborating with EU partners on this important effort.
Arancha González Executive Director, International Trade Centre

NAVIGATING NON-TARIFF MEASURES: INSIGHTS FROM A BUSINESS SURVEY IN THE EUROPEAN UNION
MAR-16-66.E v
Acknowledgements
This paper is based on data from the International Trade Centre’s (ITC) business survey on non-tariff measures (NTMs) in the European Union (EU) conducted with the support of the European Commission in 2015 and 2016.
We thank Mondher Mimouni and Lucian Cernat for their vision, leadership, continuous guidance and various contributions to the survey implementation and analysis.
We thank Ursula Hermelink, Katya Ivanova and Jonas Markgraf for their contribution to the design, implementation and analysis of the survey across the 28 EU countries. Abdellatif Benzakri and Lionel Fontagné contributed to developing the sampling method and questionnaires. We thank the ITC’s NTM team as well as other ITC colleagues who helped us to implement the survey and process the results.
ITC expresses appreciation to the representatives of enterprises and experts who agreed to be interviewed and shared their experiences on the issue of trade obstacles. We thank the European Commission for its trust and support. We extend our gratitude to all national partners, including survey companies, research institutes and national experts, for their contribution to the surveys and data analysis.
This paper was compiled by Alessandra Tucci and Mathieu Loridan. The authors thank the various ITC and European Commission colleagues, in particular Ursula Hermelink, Federica Mustilli and Ann Rutgeerts for their valuable comments and feedback.

NAVIGATING NON-TARIFF MEASURES: INSIGHTS FROM A BUSINESS SURVEY IN THE EUROPEAN UNION
vi MAR-16-66.E
Contents Foreword European Commission ............................................................................................................... iii
Foreword International Trade Centre ......................................................................................................... iii
Acknowledgement ......................................................................................................................................... v
Acronyms .................................................................................................................................................... viii
Executive Summary ...................................................................................................................................... ix
Chapter 1: Context and rationale .................................................................................................................... 1 Chapter 2: Survey methodology and implementation .................................................................................... 3
2.1. Methodology ................................................................................................................................ 3 2.2. Survey implementation ................................................................................................................ 4
Chapter 3: Key findings .................................................................................................................................. 5 3.1. The impact of NTMs on the private sector .................................................................................. 5 3.2. NTM-related obstacles by type ................................................................................................... 6
Source: ITC business survey in the EU, 2015-2016. .................................................................. 7 Complex certification procedures ................................................................................................ 8 Strict labelling requirements ........................................................................................................ 9 Problems with compliance with rules of origin regulations ....................................................... 10 Bureaucratic export requirements ............................................................................................. 13 More information and transparency are needed ....................................................................... 15
Chapter 4: Findings for micro, small and medium-sized enterprises ........................................................... 17 Chapter 5: Findings for developing countries ............................................................................................... 19 Chapter 6: Conclusion and way forward ....................................................................................................... 23
Annex A. Survey methodology and implementation ..................................................................................... 25 Annex B. Survey results – detailed figures ................................................................................................... 40 Annex C. European Union Member States tables ........................................................................................ 52

NAVIGATING NON-TARIFF MEASURES: INSIGHTS FROM A BUSINESS SURVEY IN THE EUROPEAN UNION
MAR-16-66.E vii
Tables and Figures
Table 1. Issues with burdensome regulations raised by EU exporter, by type ........................................ 7 Table 2. Type of NTM-related obstacles for rules of origin and export-related measures ..................... 10 Table 3. Types of procedural obstacles related to rules of origin – preferential and non-preferential ... 11 Table 4. Export-related measures by type and implementing authority................................................. 13 Table 5. Types of procedural obstacles related to export measures ..................................................... 14 Table 6. Procedural obstacles by type of regulation .............................................................................. 15 Table 7. Firms’ transactions and incidences of NTMs by size ............................................................... 17 Table 8. Average number of NTMs and procedural obstacle per transaction, by destination ............... 19 Table A1. Estimated sample size by sector and company size ............................................................... 26 Table A2. Estimated sample size by country ........................................................................................... 27 Table A3. Survey database description .................................................................................................... 29 Table A5. Procedural obstacles ................................................................................................................ 32 Table A6. Survey sectors ......................................................................................................................... 34 Table A7. The NTM Survey process ........................................................................................................ 34 Table A8. Business register (BR) by EU Member States ......................................................................... 35 Table A9. Sector composition of companies interviewed by telephone, by company size ...................... 36 Table A10. Destination markets of companies interviewed by telephone, by company size ..................... 37 Table A11. Sector composition of companies interviewed in face-to-face ................................................. 37 Table A12. Destination markets of companies interviewed face-to-face, by company size ...................... 39 Table B1. Face-to-face interviews – share of companies facing burdensome NTMs by destination ...... 41 Table B2. Product certification issues by sector and company size ........................................................ 44 Table B3. Labelling issues by sector and size class ................................................................................ 45 Table B4. Type of burdensome NTM according to who applies the measure ......................................... 46 Table B5. Burdensome NTM’s by type of measure.................................................................................. 49 Table B6. Procedural obstacles by type and NTM chapter ...................................................................... 50 Table C1. Distribution of issues by NTM chapter by country ................................................................... 52 Table C2. Reasons for burdensome NTMs and applications of NTMs by country .................................. 53
Figure 1. Share of companies affected by burdensome NTMs at export, by main sector ........................ 5 Figure 2. Geographical distribution of exports (top 20 destinations) ......................................................... 6 Figure 3. Share of companies and transactions affected by NTMs, by size ........................................... 17 Figure 4. Share of EU exporters and transaction affected by NTMs, by partner regions ....................... 19 Figure 5. Type of procedural obstacles encountered in partner countries by EU exporters ................... 20 Figure 6. Challenges to sourcing from developing countries .................................................................. 21 Figure A1. Number of companies interviewed ........................................................................................... 35 Figure A2. Characteristics of companies interviewed by telephone .......................................................... 36 Figure A3. Characteristics of companies interviewed face-to-face ........................................................... 37 Figure B1. Share of companies affected by NTMs when exporting, by sector ......................................... 40 Figure B2. Share of companies affected by NTMs when exporting, by destination .................................. 40 Figure B3. Type of burdensome NTM by company size ........................................................................... 48 Figure B4. Type of burdensome NTM by destination market .................................................................... 49

NAVIGATING NON-TARIFF MEASURES: INSIGHTS FROM A BUSINESS SURVEY IN THE EUROPEAN UNION
viii MAR-16-66.E
Acronyms
Unless otherwise specified, all references to dollars ($) are to United States dollars, and all references to tons are to metric tons.
EC European Commission
EU European Union
FAO Food and Agricultural Organization of the United Nations
FTA Free Trade Agreement
GSP Generalized System of Preferences
HS Harmonized System
IMF International Monetary Fund
ITC International Trade Centre
MAST Multi-agency support team
NTB Non-tariff barrier
NTM Non-tariff measure
OECD Organisation for Economic Co-operation and Development
SIC Standard Industrial Classification
SME Small and medium-sized enterprise
SPS Sanitary and phytosanitary measures
TBT Technical barriers to trade
UNCTAD United Nations Conference on Trade and Development
UNIDO United Nations Industrial Development Organization
WTO World Trade Organization

NAVIGATING NON-TARIFF MEASURES: INSIGHTS FROM A BUSINESS SURVEY IN THE EUROPEAN UNION
MAR-16-66.E ix
Executive Summary
Tackling NTM-related trade cost – today’s key challenge in world trade
With the fall of tariffs in many markets around the world, especially in OECD countries, the focus of trade policymakers has gradually shifted to tackling unnecessary costs associated with non-tariff measures (NTMs). A large body of evidence suggests that NTMs have become relatively more important in trade policy. These measures are mostly non-discriminatory regulations aimed at preserving legitimate interests such as protection of security and health of consumers or the environment. Non-tariff barriers (NTBs) are a subset of NTMs and are defined as measures that have a protectionist and discriminatory intent, for example when they are excessive, dissimilar and unjustifiably unrelated to equivalent measures elsewhere or simply poorly implemented.
The dividing line between an NTM and an NTB is not always clear, often requiring complex legal and economic analysis. Nevertheless, even NTMs, which have been put in place without any trade-restrictive intent, can sometimes be more burdensome on exporting and importing firms than required, especially when information about applied measures and related procedures is lacking, cost of compliance is unjustifiably high or they are simply poorly implemented. In those circumstances, non-tariff measures become trade obstacles, which are experienced differently across countries, sectors and types of companies, such as micro, small and medium-sized enterprises (MSMEs). Understanding the impact of NTMs is important to determine where further corrective action is needed.
Bringing the voice of EU exporters into the debate: The ITC survey on NTMs
This report contributes to this objective by presenting the perceptions of EU companies engaged in exporting to major markets. It presents the results of an unprecedented survey conducted by the International Trade Centre (ITC) on the incidence of NTMs. It documents the experiences of EU exporters aimed at gaining a deeper understanding of firm-level perception of NTMs and their associated costs, which by their nature are hard to quantify.
The NTM Survey carried out in 2015 and 2016 used a state-of-the-art methodology that has been successfully implemented in more than 35 developing countries worldwide. A sample of EU exporters, representative by sector and size, was drawn from the legally registered exporting companies of all sizes and types of ownership within the EU. This is the first NTM survey carried out in Europe on a representative sample of EU companies.
Over 8,000 interviews across 28 countries and 26 sectors
More than 71,000 companies were contacted and 8,100 participated in the telephone interviews, which served to identify whether the firm had experienced over the past 12 months any problems related to trade regulations other than tariffs (NTMs) when selling to foreign markets.
Out of 2,840 firms that reported issues with NTMs, 1,383 accepted to share, in individual face-to-face interviews, comprehensive details on the trade obstacles they experienced. This second stage allowed capturing for every firm information about all products (HS6 level) traded and all partner countries (export destinations), the type of regulatory burdens and related procedural obstacles experienced in each of these combinations of products and partner countries, detailed accounts of time and cost related to these trade obstacles as well as company characteristics and recommendations for overcoming the issues faced.
8,100 Phone
Interview
1,383 Face-to-
Face

NAVIGATING NON-TARIFF MEASURES: INSIGHTS FROM A BUSINESS SURVEY IN THE EUROPEAN UNION
x MAR-16-66.E
The compilation of data gathered during the two rounds of interviews led to a unique database covering goods exported from all 28 EU Member States, by companies of all sizes, in 26 agricultural and industrial sectors. The majority of them (82%) produce the goods they export and have been operating for more than 20 years.
Top 3 markets captured: United States, the Russian Federation and China
The structure of the EU exports also influenced the distribution of interviews by destination market. Interviewed companies reported selling to about 150 foreign markets. Random sampling within each sector led to a good coverage of the main EU export destinations, such as the United States, China and other Asian countries.
One-third of exporters face NTM-related trade obstacles
The exporters' replies give a broad, albeit complex, picture of the issues associated with NTMs, as seen through the eyes of EU companies that export to extra-EU markets. In a period when global trade flows are growing at a historically low pace, one encouraging finding of the report is that 64% of respondents reported no major regulatory obstacle in their main markets.
Only 36% reported facing restrictive regulations or related obstacles that act as important impediments to their exporting activities. This percentage is lower than the one recorded by ITC for developing countries, which on average amounts to 50%. The problems can derive from the stringency of the
regulations, from bureaucratic complexities but also from lack of information on the measures and the procedures.
Top 3 NTMs reported: SPS measures, TBT and rules of origin
EU exporters report difficulties meeting technical and conformity assessment requirements related to technical barriers to trade (TBT) and sanitary and phytosanitary measures (SPS) imposed by their respective partner countries. They raise issues regarding compliance procedures with EU or home country regulations (export-related measures), as well as with the procedures to obtain certificates of origin.
Exporters face procedural rather than regulatory obstacles
Another key finding of this report is that, in the majority of cases, the burden is entirely or partially due to procedural obstacles: these are linked to the way in which companies need to prove compliance with a given regulation (e.g. approval of procedures or information and transparency issues), rather than to the stringency of the regulations themselves. The process of obtaining the necessary certificates often ends up being long and burdensome.
Businesses’ experience helps trade negotiation and facilitation
These results confirm the essential role of the EU negotiating agenda and implementation work in order to facilitate international trade through regulatory cooperation and approximation, trade facilitation, and promotion of transparency. It also confirms the importance of the European Commission's and ITC’s continued efforts to support exporters, in particular SMEs, in finding their way in the variety of NTMs that apply across markets, through initiatives such as the Market Access Database and ITC’s Market Access
Procedure
Interviews with
26 sector
Exports to
150 countries
NAVIGATING NON-TARIFF MEASURES: INSIGHTS FROM A BUSINESS SURVEY IN THE EUROPEAN UNION
MAR-16-66.E xi
Map which provides data on tariff and non-tariff regulations imposed by more than 90 countries. More recently, ITC, with the World Trade Organization (WTO) and the United Nations Department for Economic and Social Affairs (UNDESA), launched the ‘e-Ping’ alert system, which gives timely TBT and SPS-related information notified by WTO members.
The survey suggests the need to enhance efforts of the European Union and its Member States, including in the context of its Market Access Partnership, to make information more available, to better publicize existing information and to further simplify procedures.
This survey provides insights into making trade easier between developing countries and the EU. This is important, especially in light of the dominance in trade of global and regional value chains.
Finally, the survey complements existing findings from ITC NTM surveys in developing countries. It brings new evidence from developed economies that can serve as a benchmarking tool to for trade policies and development assistance.

NAVIGATING NON-TARIFF MEASURES: INSIGHTS FROM A BUSINESS SURVEY IN THE EUROPEAN UNION
MAR-16-66.E 1
Chapter 1: Context and rationale
In a global context of increasing economic liberalization, the importance of trade barriers resulting from non-tariff measures (NTMs) has risen in recent decades. Non-tariff measures refer to government regulations that affect exports and imports.1 For the most part, these are non-discriminatory regulations aimed at preserving security and health of consumers or the environment.2 While such regulations are most often perfectly legal and legitimate, compliance with differing requirements across countries might be complex and costly for companies seeking to export, particularly for small and medium-sized enterprises (SMEs).
As a result, multilateral rules in the World Trade Organization (WTO) and most regional and bilateral trade agreements (already implemented or under negotiation) include provisions on NTMs. The objectives of these rules are to facilitate regulatory convergence, promote transparency and prevent and address trade frictions resulting from NTMs without challenging their legitimate objectives. In this context, it is important to better understand the impact of NTMs. This presents the experiences of EU companies.
The European Commission has been negotiating NTM provisions in multilateral and bilateral free trade agreements (FTAs). Where NTMs constitute trade barriers, for example because they are discriminatory or disproportionate, they become non-tariff barriers to trade (NTBs). The Commission tackles these NTBs, together with Member States and business, under the Market Access Partnership.3 In addition, the European Commission is actively engaged in research aimed at advancing the knowledge and quantification of the impact of these measures.
The International Trade Centre (ITC) is joint agency of the United Nations and the World Trade Organization. ITC is a founding member of the Multi-Agency Support Team on NTMs (MAST)4 since its creation in 2008. Under its development mandate, ITC has developed a programme that aims to increase the transparency and understanding of NTMs and their impact on trade. ITC’s Market Access Map5 programme collects and maps more than 18,000 regulations applied by 90 countries. To identify which of these many regulations represent a trade obstacle and why, ITC has developed a methodology to survey exporting and importing companies to capture at the most detailed product and partner country level the NTM-related trade impediments they face. This methodology has been successfully implemented in 35 developing countries.
ITC’s business surveys are a recognized mechanism for gaining a deeper understanding of the firms’ experiences with NTMs. Building on ITC experience and knowledge, the European Commission financed6 a unique business survey of EU exporters and importers.
The NTM Survey carried out by ITC in 2015 and 2016 – the EU Survey – aimed to identify perceived obstacles companies face in exporting from and importing into the EU at the product and partner country level. The resulting comprehensive database serves as an important source of information on NTMs that EU companies consider burdensome. This private sector perspective is a meaningful contribution to reviews of legislation and administrative processes related to exporting and importing. 1 NTMs studied in this report include technical requirements, conformity assessment requirements; pre-shipment inspections and other entry formalities; trade remedies; quantity control measures; charges, taxes and price control measures; finance measures; anti-competitive measures; trade-related investment measures; distribution restrictions; restrictions on post-sales services; subsidies; government procurement restrictions; intellectual property requirements; preferential rules of origin and related certificates of Origin; Non-preferential rules of origin and related certificates of origin; and export-related measures. 2 These measures might also be discriminatory and/or non-proportionate but these cases are less frequent. 3 In the framework of the Market Access Strategy (http://trade.ec.europa.eu/doclib/html/134591.htm), the Market Access Partnership brings together the European Commission, EU Member States and business representatives on a regular basis, both in Brussels and locally, to identify trade barriers and define a common strategy to removes barriers, which can range from soft actions (diplomacy) to enforcement in the context of WTO/FTAs. 4 FAO, IMF, ITC, OECD, UNCTAD, UNIDO, World Bank, and the WTO. 5 ITC’s Market Access Map, available at www.macmap.org, can be accessed free of charge for developing country users. 6 Grant Contract SI2.696415.
NAVIGATING NON-TARIFF MEASURES: INSIGHTS FROM A BUSINESS SURVEY IN THE EUROPEAN UNION
2 MAR-16-66.E
The exporters' replies to quantitative and qualitative questions give a complex picture of the companies' perception of NTMs when selling in extra-EU markets. Reported hurdles derive from perceived stringency of regulations, bureaucratic complexities, but also from lack of information on applicable measures and procedures.
The companies' replies have been processed in this report ‘as such’. They have not been changed when these replies did not represent the most accurate description of the actual regulatory setting. This was done to maintain the ‘perception element’ of the responses.7
This report explains how the EU Survey was implemented and the type of information that was gathered. It also gives an overview of key findings. It is meant to be an opening step towards deeper analysis of survey results, for example for specific sectors, partner countries or types of NTMs, and comparison with results from countries covered by other ITC NTM surveys.
7 The ‘trade barriers’ section of the European Commission's Market Access Database (http://madb.europa.eu/madb/indexPubli.htm) provides a repository of the majority of the trade barriers, which are reported to the Commission. Many of those relate to NTMs. The systematic and representative EU Survey is meant to complement this information.

NAVIGATING NON-TARIFF MEASURES: INSIGHTS FROM A BUSINESS SURVEY IN THE EUROPEAN UNION
MAR-16-66.E 3
Chapter 2: Survey methodology and implementation
2.1. Methodology
ITC’s NTM Surveys are based on a global methodology. The basis of the NTM Survey is identical across all surveys and enables ITC to create cross-country analyses and comparisons. It defines the basic sampling methodology, the NTM Survey process and modalities.8 The NTM Survey’s country-specific process is developed with local stakeholders9 and defines the sectors covered and the survey population, as well as the questionnaires.
Scope and coverage of the EU Survey
The NTM Survey covers legally registered exporting companies of all sizes and types of ownership within the EU. The final sample frame consists of more than 250,000 exporting companies from the 28 EU Member States. Sampling is random and representative at the EU level for each of the 26 export sectors covered, which allows for the extrapolation of survey results. The survey covers trade in goods only. The definition of the 26 sectors is based on the Standard Industrial Classification (SIC), with slight deviations to better reflect the share of trade and number of companies within each group.
Companies trading arms and minerals are excluded. The sample is defined to ensure interviews in all 28 Member States (covering the most important export sectors in each) and representativeness across different company sizes. The sampling method is described in Annex A and is elaborated in further detail in a dedicated note, which is available on ITC’s website: www.ntmsurvey.org/eu.
Interviews and database
The NTM Survey process consists of two steps. First, telephone interviews are conducted with the sampled firms. Second, face-to-face interviews are undertaken with the subset of companies that report difficulties with NTMs during the telephone interviews and are willing to participate.
At the telephone interview stage, the representatives of the surveyed companies, generally export specialists or senior-level managers, are asked whether their company has experienced, in the preceding year, trade-related problems other than tariffs (NTMs) when selling to extra-EU markets. In addition, these interviews capture the main HS6 product10 exported (sector of activity), the destination markets11 as well as firm characteristics such as the number of employees (firm size) and the firms’ experience (number of years in operation).12
Firms that face NTM-related trade obstacles and are willing to share their experiences in greater depth and detail are invited to face-to-face interviews. The NTMs that are perceived as burdensome are further investigated and more information is collected on the type of regulatory burdens they create for companies and the aggravating role of related procedural obstacles. This information is captured for each pair of product and export destination.
The interviews are conducted face-to-face due to the complexity of issues related to NTMs and the sensitivity of information. Face-to-face interactions with experienced interviewers, trained by ITC on the survey methodology and questionnaires, ensure that respondents correctly understand the purpose and
8 For more details see The Invisible Barriers to Trade – How Businesses Experience Non-Tariff Measures, ITC technical paper 2015. Available at www.ntmsurvey.org. 9 European Commission, DG Trade, Trade Analysis and Chief Economist Unit. 10 HS6 product means that the product is classified at the 6-digit level of the harmonized commodity description and coding system. 11 The destination/origin markets have been defined in collaboration with the European Commission and include the following 11 categories: United States, Canada, Latin America, China, Japan, Other Asia, Africa, Middle East, Russian Federation, Other Eastern Europe and Others. 12 The telephone interviews were recorded either by a Computer Assisted Telephone Interview (CATI) system, an ITC online capturing system, computer spread sheets, or on paper.

NAVIGATING NON-TARIFF MEASURES: INSIGHTS FROM A BUSINESS SURVEY IN THE EUROPEAN UNION
4 MAR-16-66.E
the coverage of the survey, and that reported issues are accurately captured according to predefined categories.13
The compilation of the data gathered during the two rounds of interviews lead to a unique database that combines four sets of information: company information (firm characteristics), trade information (the pairs of products and partner countries), NTM information (burdensome regulations and related procedures), and other types of information (problems related to sourcing from developing countries). The four sets of information are interlinked by the company ID which allows redrawing the full interviews and details the NTM-related obstacles. Annex A contains a more detailed description of the database.
2.2. Survey implementation
At the telephone interview stage, more than 71,000 companies were contacted, with 8,100 exporters responding to the full questionnaire, implying a participation rate of 11% in the first stage of the NTM Survey. Among the companies surveyed by telephone, 2,840 reported facing NTM-related obstacles of which 1,383 (approximately 49%) participated in face-to-face interviews. The participation rate was slightly higher for medium-sized enterprises than for small and large ones.
Telephone interviews
All companies interviewed by telephone are exporting goods. In addition, almost half are also importers, primarily of intermediate inputs. Regarding the size of the sampled companies, about half are micro or small (i.e. less than 50 employees), 28% medium-sized and 19% large (i.e. more than 250 employees). Small companies are generally less export-oriented than large companies. On average across all company sizes, exports represent 35% of the total value of sales. The larger companies are more experienced. The majority (82%) of them are producing the goods they export and most have been operating for more than 20 years.
A representative sample of companies was interviewed in each of the 26 sectors. The structure of the export sector also influences the distribution of interviews by destination market. The main export destinations of interviewed companies are the United States, China and other Asian countries.
Face-to-face interviews
Overall, 1,383 exporters participated in the in-depth face-to-face interviews. The face-to-face sample is by design driven by the degree of companies’ affectedness by burdensome NTMs, with a higher number of interviews held in sectors with high affectedness. Similarly, the distribution of interviews across company types and destination markets is influenced by the telephone interview results – companies with a high number of products and markets affected are more strongly represented. In the face-to-face interview stage, 43% of respondents represented micro or small firms, 32% medium-sized and 23% large firms.
13 The face-to-face interviews were recorded on paper and then compiled in computer spread sheets.

NAVIGATING NON-TARIFF MEASURES: INSIGHTS FROM A BUSINESS SURVEY IN THE EUROPEAN UNION
MAR-16-66.E 5
Chapter 3: Key findings
3.1. The impact of NTMs on the private sector
Out of the 8,100 exporters interviewed by telephone, 36% reported facing restrictive regulations or related procedural obstacles to trade while exporting or importing goods. The hurdles are faced while exporting rather than importing. There is significant variation across sectors. For example, almost half of companies exporting agri-food products report NTM-related trade obstacles when exporting compared with 33% in the manufacturing sector (see Figure 1 and, in more detail, Figure B1 in Annex B). It is important to note however, that the agri-food sectors represent only about 13% of the exporters interviewed and less than 10% of exports.
Figure 1. Share of companies affected by burdensome NTMs at export, by main sector
Source: ITC business survey in the EU, 2015-2016.
According to the methodology, a company is considered to be ‘affected’ if it declares that at least one of its products is adversely affected by a regulation applied by one of its partner countries, its home government or the EU.
In terms of sectors, agri-food products are particularly impacted by sanitary and phytosanitary standards (SPS) and the related certification or control procedures as these products are generally highly perishable and fragile. Furthermore, most countries are very vigilant about consumer safety and put special emphasis on the control of food products.
In comparison to the agri-food sector, companies from the manufacturing sector are relatively less affected by NTMs (25-40%). Surveyed exporters of chemicals, instruments and industrial machinery declare to be more affected, while exporters of the paper, printing and wood industry as well as metal products are relatively less affected (Figure B1 in Annex B).
The experience with NTMs also differs according to the destination markets. Figure 2 shows, per destination market, the number of exported products that are reported to face burdensome NTMs and the number of exported products that are not. In particular, surveyed companies declare to be more affected when exporting to developing countries and economies in transition than to developed partners (Table B1 in Annex B).14
The countries with the highest number of reported NTM issues are not necessarily the countries with the highest incidence of problems. The random sampling by sector implies that exports to important partner countries are captured more frequently than less important export destinations, implying a higher probability to capture NTM issues. Rather than the absolute number of NTM issues reported, it is important to compare the share of affected transactions across destinations. For example, of the 1,025 captured
14 Only in Iran, State of Palestine, Turkmenistan, Cayman Islands, Liberia, Afghanistan, Lao People's Democratic Republic, Papua New Guinea, Aruba, Tajikistan, Timor-Leste exporters declare that they have issues with 80% or more of their exports.
48%
33%
12% 10%
0%
10%
20%
30%
40%
50%
60%
Agro-food sectors Manufacturing sectors
Share of companies affected byburdensome NTMs whenexportingShare of companies affected byburdensome NTMs whenimporting

NAVIGATING NON-TARIFF MEASURES: INSIGHTS FROM A BUSINESS SURVEY IN THE EUROPEAN UNION
6 MAR-16-66.E
export flows to the United States, 455 were reportedly associated with specific burdens, implying that in 570 cases, the EU companies did not encounter a significant hurdle worth reporting, resulting in a 44% incidence.
In countries such as Saudi Arabia or Brazil, although the total number of reported transaction with burdensome NTMs is lower, the complaints recorded have a much higher incidence, in the range of 70% (235 products affected out of 335 products exported) and 60% (217 products affected out of 369 products exported) respectively, which indicates the perceived problematic nature of these countries when it comes to NTMs.
Figure 2. Geographical distribution of exports (top 20 destinations)
Source: ITC business survey in the EU, 2015-2016
To allow for a better understanding of the nature of problems faced by the EU exporters, ITC separates difficulties faced by the companies according to two broad categories: burdensome NTMs (or regulatory obstacles) and procedural obstacles. NTMs are official – mostly legitimate – regulations implemented by competent authorities in the exporting or importing country that traders must comply with (see Section 1). Procedural obstacles are hurdles that companies face in complying with these regulations, for example costs or delays related to obtaining necessary certificates.
Any given regulation may be considered burdensome by exporters because of the related procedural obstacles rather than the regulation itself. These procedural obstacles can occur either in the destination countries or in the EU, irrespective of which country applies the NTM. In the following section, the nature and type of problems are discussed in detail.
3.2. NTM-related obstacles by type
The 1,383 EU exporters that participated in the face-to-face interviews reported about 7,200 issues as defined by unique combinations by company, product, regulation and partner country (Box 1).
The vast majority of issues (81%) declared by EU exporters are faced in partner or transit countries. Fewer than 20% are issues that exporters need to solve in the EU or in the Member States before shipping goods abroad.
0 200 400 600 800 1000 1200
United States of AmericaRussian Federation
ChinaJapan
SwitzerlandUnited Arab Emirates
CanadaBrazil
AustraliaSaudi Arabia
TurkeyNorwayUkrain
IndiaEgypt
MexicoSouth Africa
Republic of KoreaBelarus
Iran
Number of products exported to this destination facing burdensome regulationsNumber of products exported to this destination facing no burdensome regulations

NAVIGATING NON-TARIFF MEASURES: INSIGHTS FROM A BUSINESS SURVEY IN THE EUROPEAN UNION
MAR-16-66.E 7
Table 1 shows the distribution of reported issues according to the NTM classification used for the ITC NTM Surveys. The regulations that exporters most often experience as a burden are conformity assessments and procedures and technical requirements, which refer to both technical barriers to trade (TBT) and sanitary and phytosanitary measures (SPS). These regulations include product certification and registration imposed by partner countries, labelling and marking requirements, as well as import authorizations for SPS or TBT reasons, fumigation requirements and regulations on product characteristics. The high incidence of SPS and TBT measures found in this survey confirms findings of previous investigations and the widely perceived problematic nature of these measures.15
Table 1. Issues with burdensome regulations raised by EU exporter, by type Number of issues
(product/destination/partner) Share of Total (%)
A. Technical requirements 1,229 16.9 B. Conformity assessment 2,314 31.9 C. Pre-shipment inspections and other entry formalities 582 8.0 D. Trade remedies 41 0.6 E. Quantity control measures 215 3.0 F. Charge, taxes and price control measures 193 2.7 G. Finance measures 103 1.4 H. Anti-competitive measures 33 0.5 I. Trade related investment measures 10 0.1 J. Distribution restrictions 24 0.3 K. Restrictions on post-sales services 12 0.2 L. Subsidies 1 0.0 M. Government procurement restrictions 29 0.4 N. Intellectual property 13 0.2 O1. Preferential rules of origin and related certificates of origin 580 8.0 O2. Non-preferential rules of origin and related certificates of Origin 594 8.2 P. Export related measures 1,291 17.8 Total 7,264 100
Source: ITC business survey in the EU, 2015-2016.
15 This is reflected in previous investigations such as European Commission (2015) Small and Medium-Sized Enterprises and the Transatlantic Trade and Investment Partnership (http://trade.ec.europa.eu/doclib/docs/2015/april/tradoc_153348.pdf), ITC work (http://www.intracen.org/itc/market-info-tools/non-tariff-measures/, www.ntmsurvey.org), WTO disputes, as well as in the Commission's Market Access Database (http://madb.europa.eu/madb/indexPubli.htm) that records all burdensome trade barriers (NTBs) reported to the Commission, a large portion of which relate to TBT/SPS measures.
Box1. Unit of analysis of NTM indicators The statistics in this report are based on the count of NTM issues, the most disaggregated data unit of the NTM Survey. Each NTM issues is multidimensional, taking into account the reporting company, the product, the type of NTM, the partner country and, if relevant, the related procedural obstacles, which would be counted separately.
For example, if three products are affected by the same NTM applied by the same partner country and reported by the same company, the results would include three NTM issues. Similarly, if two companies report the same measure imposed on the same product by the same destination country, it would be counted as two different NTM issues. This applies to all the indicators presented in this report.

NAVIGATING NON-TARIFF MEASURES: INSIGHTS FROM A BUSINESS SURVEY IN THE EUROPEAN UNION
8 MAR-16-66.E
Complex certification procedures
In 66% (1,531) of all 2,314 issues reported in relation to conformity assessments, the problem is linked to obtaining some sort of product certification.16 This problem constitutes the largest share of all NTM issues recorded during the survey – more than 20%. More than 90% of these reported product certifications were (partially or entirely) deemed problematic because of the procedural obstacles linked to certification process rather than the strict certification requirements themselves.
In 30% of the issues, the problem lies with time constrains such as delays related to certification, this is followed by high payments (27%), various administrative burdens (17%), information/transparency issues (9%), limited or inappropriate facilities related to the reported certificate (almost 8%), lack of recognition/accreditation (6%), and discriminatory behaviour of officials (2%).17
One aspect raised on product certification is the need for companies to refer to an independent entity (mostly private but also sometimes public) designated by the regulator to perform the certification, which in turn may trigger subsequent procedural obstacles, such as delays (often due to the limited/inappropriate facilities related to the reported certificate in the home country), additional costs, or excessive administrative burdens.
For example, an Italian exporter of lamps reports: ‘When exporting lamps and lighting fittings to the United States, we have to obtain a Certificate of Conformity, which can only be issued by SGS in Switzerland. This makes the procedure more burdensome and costly, since we have to first send all the prerequisite documents to Switzerland and then wait for up to 14 days to receive the certificate and prepare the shipment.’18
16 These are of various types and have been grouped. 17 This latter aspect is quite interesting and will require further investigation because according to the WTO TBT Agreement also the procedures need to be proportionate and non-discriminatory and specific disciplines are foreseen also with regard to fees. 18 This is to comply with the United States CFR regulations in Title 10 – Energy; (Part 429 - Certification, Compliance, And Enforcement For Consumer Products And Commercial And Industrial Equipment) and in Title 16 - Commercial Practices; (Part 305)
‘To export to Saudi Arabia, we must obtain a Halal certificate for our products. Due to the lack of a certifying authority in Greece, we have to refer to an independent private organization in Austria, which results in additional costs of €60,000 per year.’ 9
A Greek exporter of a mix for frozen yogurt to Saudi Arabia
‘We are required to obtain a technical product certification, which is only implemented by one public certifying authority in the Russian Federation – Rostechnadzor. Because the certifying authority does not respond to direct queries, we need to hire intermediaries and consultants to establish a contact. The process is very expensive and time-consuming. We estimate the costs associated with this measure to be up to 33% of the value of the product.’
A Lithuanian exporter of fabricated structural metal products to the Russian Federation
‘We have to certify our products with the China Compulsory Certificate (CCC), which can only be obtained after the products have been tested in China. This is burdensome because there is an unusually high fee of about €2,000 per product variety, but also because the testing requirements are not revealed by the Certification and Accreditation Administration of China (CNCA)’
A Bulgarian exporter of wooden windows to China

NAVIGATING NON-TARIFF MEASURES: INSIGHTS FROM A BUSINESS SURVEY IN THE EUROPEAN UNION
MAR-16-66.E 9
In this situation, having to rely on a non-EU company for certification makes it difficult to comply with the United States certification requirements.’19
Companies face similar burdens when having their products certified by the relevant public authorities in their home countries. A Dutch company exporting malt extract to Indonesia reported that ‘a health certificate is required to ensure that the product is safe for human consumption. The Food and Commodity Authority (NVWA), which requires a very detailed and precise product description, issue the certificate.20 Sometimes an application is rejected because of a minimal deviation of the description. The process takes up to five times as long in case of an extra-EU order compared to an EU order.’ In a number of cases where product certification is entrusted to the relevant government authorities of the partner country, for example, the United States Food and Drug Administration (FDA), Certification and Accreditation Administration of China (CNCA), or the Russian Federation’s Federal Environmental, Industrial and Nuclear Supervision Service (Rostechnadzor), different additional obstacles are raised such as information/transparency issues, or other procedural obstacles to compliance.
A small number of cases pertaining to product certification were deemed burdensome by the companies interviewed for reasons of the requirements being too strict or difficult to comply with. One such case is illustrated by a British exporter of lamb to Ghana, whose ‘company has to provide a Health Certificate issued by a vet. The certificate has to be immaculate, as even a small typo could result in the goods being rejected despite there being no threat to human life. There is no possibility to amend the error, and we are given two options – either destroy the goods or return them, both of which cost roughly the same. It is a hit or miss situation, and it can be arbitrary.’21 This problem mirrors similar exporter testimonies recorded through ITC NTM Surveys in other countries.
Product certification issues, such as those discussed above, were reported by companies across all size groups (Table B2 in Annex B). The main sectors affected by complex certification procedures, include food products, apparel and leather.
Strict labelling requirements
With 390 issues recorded, labelling requirements are the most frequently occurring type of technical regulations reported as burdensome.22 In more than 25% of these issues, the problem relates to strict labelling requirements. For instance, when exporting plastic tubes, pipes and hoses, and fittings to Saudi Arabia, a Dutch company reports that it is required to ensure that the country of origin appears on the label of each item, as well as on the packaging and the pallets. To comply, the company would have to adjust its moulds, which would be
19 Corresponding to the Saudi regulation: Regulation No. 1 on December 13, 2014 about the food systems 20 Corresponding to the Indonesian regulation: The National Agency of Drug and Food Control regulation No. 28 of 2013 concerning Importation Control of Drug Material, Traditional Medicine Material, Health Supplement Material, and Food Material into the Territory of Indonesia. 21 Matching regulation: Destination Inspection Department of GSA, FDA Guidelines For The Registration Of Pre-packaged Foods, Ghana Standards Authority Act. 22 Under the TBT agreement, technical regulations lay down product characteristics, including applicable administrative provisions such as labelling requirements.
‘When exporting to the United States, we have to obtain a certificate of label approval. Labelling requirements are very strict and include warnings to pregnant women, drunk driving, health issues, etc., and labels also have to reflect content. For example, there used to be a picture of a pumpkin on the label of one of the company’s beers but its flavour was not pumpkin, so we were asked to change the picture. Some of the states also have their own additional requirements.’25
A United Kingdom beer exporter reports
NAVIGATING NON-TARIFF MEASURES: INSIGHTS FROM A BUSINESS SURVEY IN THE EUROPEAN UNION
10 MAR-16-66.E
very expensive considering it is only required by just one partner country. The company estimates that around 80% to 90% of its shipments are checked by customs and every time the company exports to Saudi Arabia, it is given penalties for not having all the required labels.23 24
In 75% of cases concerning labelling requirements, compliance is difficult due to various procedural obstacles, such as time constraints (21%), information/transparency issues (21%), costs related to compliance (14%), difficulties with translation (12%), or other obstacles.
An Irish company finds that interpretation of labelling legislation for seafood differs from port to port in China. The company has to send details of the product labelling in advance of the shipment to the customs authority in the port.
This is a very cumbersome process that takes three-to-four weeks as the company may have to re-print its product labelling to satisfy the customs authority even though the old labelling might be acceptable in another port.25
Most issues were reported in Food and Beverage, Chemical products and Machineries sectors, which together account for more than 50% of the complaints (Table B3 in Annex B).
Problems with compliance with rules of origin regulations
Exporters reported two other types of regulations perceived to be burdensome NTMs: rules of origin and related certificates of origin, both preferential and non-preferential, as well as export-related measures.26
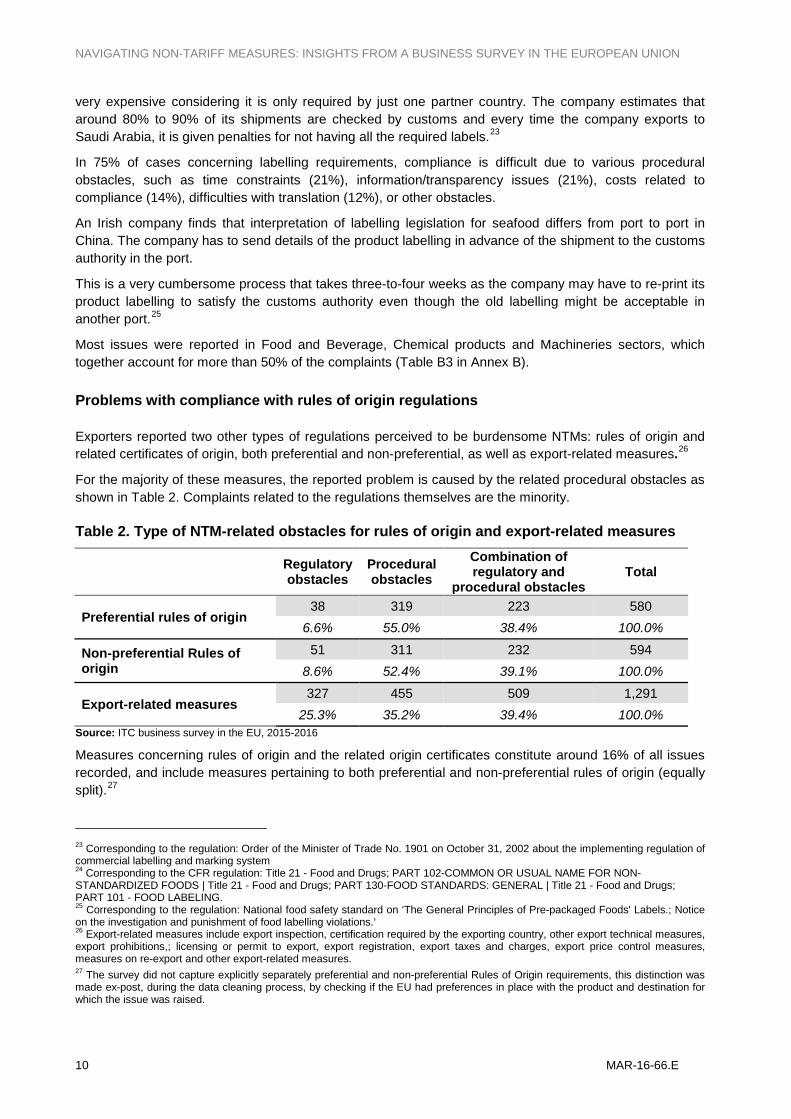
For the majority of these measures, the reported problem is caused by the related procedural obstacles as shown in Table 2. Complaints related to the regulations themselves are the minority.
Table 2. Type of NTM-related obstacles for rules of origin and export-related measures Regulatory
obstacles Procedural obstacles
Combination of regulatory and
procedural obstacles Total
Preferential rules of origin 38 319 223 580
6.6% 55.0% 38.4% 100.0%
Non-preferential Rules of origin
51 311 232 594 8.6% 52.4% 39.1% 100.0%
Export-related measures 327 455 509 1,291
25.3% 35.2% 39.4% 100.0% Source: ITC business survey in the EU, 2015-2016
Measures concerning rules of origin and the related origin certificates constitute around 16% of all issues recorded, and include measures pertaining to both preferential and non-preferential rules of origin (equally split).27
23 Corresponding to the regulation: Order of the Minister of Trade No. 1901 on October 31, 2002 about the implementing regulation of commercial labelling and marking system 24 Corresponding to the CFR regulation: Title 21 - Food and Drugs; PART 102-COMMON OR USUAL NAME FOR NON-STANDARDIZED FOODS | Title 21 - Food and Drugs; PART 130-FOOD STANDARDS: GENERAL | Title 21 - Food and Drugs; PART 101 - FOOD LABELING. 25 Corresponding to the regulation: National food safety standard on ‘The General Principles of Pre-packaged Foods' Labels.; Notice on the investigation and punishment of food labelling violations.’ 26 Export-related measures include export inspection, certification required by the exporting country, other export technical measures, export prohibitions,; licensing or permit to export, export registration, export taxes and charges, export price control measures, measures on re-export and other export-related measures. 27 The survey did not capture explicitly separately preferential and non-preferential Rules of Origin requirements, this distinction was made ex-post, during the data cleaning process, by checking if the EU had preferences in place with the product and destination for which the issue was raised.

NAVIGATING NON-TARIFF MEASURES: INSIGHTS FROM A BUSINESS SURVEY IN THE EUROPEAN UNION
MAR-16-66.E 11
In more than 90% of these cases, the burden is caused by related procedural obstacles, including delays (48%), high payments (21%), administrative burdens (14%), information/transparency issues (almost 10%), and to a limited extent, issues related to lack of recognition and discriminatory behaviour of officials.
Regarding high fees and payments, companies report this issue for certificates to prove the origin for both preferential and non-preferential cases. While for non-preferential cases the institution that issues the certificate (for example, a chamber of commerce) might require payment of fees, this should not be the case when certificates are issued by custom authorities (usually preferential).
These findings call for further analysis, which should take account of the differing practices in issuing certificates in Member States.
Table 3. Types of procedural obstacles related to rules of origin – preferential and non-preferential
No. of PO issues raised % of total
Administrative burdens related to regulations
A1. Large number of different documents 116 7.3%
A2. Documentation is difficult to fill out 41 2.6% A3. Difficulties with translation of documents from or into other languages 11 0.7%
A4. Numerous administrative windows or organizations involved, redundant documents 69 4.3%
Information/ transparency issues
B1. Information on selected regulation is not adequately published and disseminated 57 3.6%
B2. No due notice for changes in selected regulation and related procedures 3 0.2%
B3. Selected regulation changes frequently 22 1.4% B4. Requirements and processes differ from information published 69 4.3%
Discriminating behaviour of officials
C1. Arbitrary behaviour of officials regarding classification and valuation of the reported product 5 0.3%
C2. Arbitrary behaviour of officials with regards to the reported regulation 45 2.8%
Time constraints
D1. Delay related to reported regulation 761 47.9% D2. Deadlines set for completion of requirements are too short 5 0.3%
Unusually high payment
E1. Unusually high fees and charges for reported certificate/regulation 310 19.5%
E2. Informal payment, e.g. bribes for reported certificate/regulation 16 1.0%
Lack of sector-specific facilities
F1. Limited/inappropriate facilities for testing - 0.0% F2. Limited/inappropriate facilities for sector-specific transport and storage, e.g. cold storage, refrigerated trucks - 0.0%
F3. Other limited/inappropriate facilities, related to reported certificate/regulation 43 2.7%
Lack of recognition/ accreditations
G1. Facilities lacking international accreditation/recognition 0.0%
G2. Other problems with international recognition, e.g. lack of recognition of national certificates 5 0.3%
Other H1. Other procedural obstacles, please specify 12 0.8% Total 1,590 100.0%
Source: ITC business survey in the EU, 2015-2016
Important procedural obstacles occur in the surveyed companies’ home countries, which is to be expected given that origin certificates are issued by domestic institutions.

NAVIGATING NON-TARIFF MEASURES: INSIGHTS FROM A BUSINESS SURVEY IN THE EUROPEAN UNION
12 MAR-16-66.E
The following examples illustrate common burdens raised relating to rules of origin and related certificates of origin.
An Italian company reports that it is required to provide a non-preferential certificate of origin but it usually needs to wait up to 30 days for it to be issued from the Chamber of Commerce, especially if it needs to obtain several certificates at the same time. To facilitate that process, the company would like to be able to retrieve the certificate online, which is currently not possible. Moreover, while it only costs €5, the company needs to obtain 1,000 certificates each year, which amounts to €5,000 annually, about 2% of the value of the exported product.
Some cases involving rules of origin and related certificates are deemed burdensome because the rules/procedures applied in the third country are too difficult to comply with. For example, an approved United Kingdom exporter under the Free Trade Agreement between the EU and the Republic of Korea is allowed to provide a preferential origin declaration for its exports in lieu of a certificate of origin. However, when the company sells via its remote office in Singapore, Customs of the Republic of Korea does not accept the preferential origin declaration, even though the goods originate from the EU. Because of this, the company has been unable to claim back duties. Her Majesty's Revenue and Customs has re-issued the documents, but this is still being challenged by the authorities of the Republic of Korea. So far, this has caused the company to incur costs of about €1.2 million and a delay of five months.
A number of cases involve the practices of acceptance by partner (importing) countries of the EUR.1 movement certificate.28 While NTM issues concerning EUR.1 movement certificate often share the same burdensome procedural obstacles (i.e. time constraints, additional costs and excessive administrative burden in the home country) as the cases concerning non-preferential certificate of origin illustrated above, there are also some differences in terms of the nature of the burden and where it occurs.
28 To claim preferential treatment under the Generalized System of Preferences or a free trade agreement, traders must justify their claim by requesting a movement certificate named EUR.1 or EUR-MED or Form A (to import under GSP). It is essentially a proof of origin requested by the customs authorities of the importing country and released by the competent national authorities according to the EU regulation. The certificate can occasionally be replaced by other declarations made out by exporters that must be first approved by the customs authorities. (http://ec.europa.eu/taxation_customs/sites/taxation/files/resources/documents/customs/customs_duties/rules_origin/preferential/guidelines_movements_certificates_en.pdf)
“It is burdensome to prepare a non-preferential certificate of origin for our products because, after it is issued by the Chamber of Commerce and Industry, it needs to be translated into Arabic and notarized by the Ministry of Foreign Affairs as well as the Embassy of Egypt in the country. The process takes up to seven days.
A Bulgarian exporter to Egypt
‘We need to provide EUR.1 certificate for each shipment. Israeli Customs requires the original, and a copy will not be accepted. The certificate has to be signed by the Chamber of Commerce and it costs €50, which is not burdensome per se. Furthermore, there is an additional cost if the original certificate is lost/misplaced by the customs officials in the partner country, which happens often.’
A British firm exporting to Israel
‘We have an authorization to put an origin declaration EUR.1 stamp on our invoices instead of sending a EUR.1 certificate with our shipments. However, Dominican Republic Customs officials still wanted to see the EUR.1 certificate, and it took 14 days for them to accept the authorized origin declaration EUR.1 stamp on the documents.’
A Belgian exporter to Dominican Republic
NAVIGATING NON-TARIFF MEASURES: INSIGHTS FROM A BUSINESS SURVEY IN THE EUROPEAN UNION
MAR-16-66.E 13
A Germany-based wood products exporter reports, ‘Swiss Customs behave rather arbitrarily when dealing with the acceptance of the EUR.1 certificate. The processing time is always different and it is not possible to predict when the goods will reach the customer. It may take up to several weeks and as a result, the customer is displeased and suffers losses.’
Bureaucratic export requirements
For EU exports, while rules of origin measures are applied exclusively by partner (importing) countries, export measures are applied by the EU and home country (EU Member States). The survey results on where the measures are applied by type are presented in table B4 in Annex B.
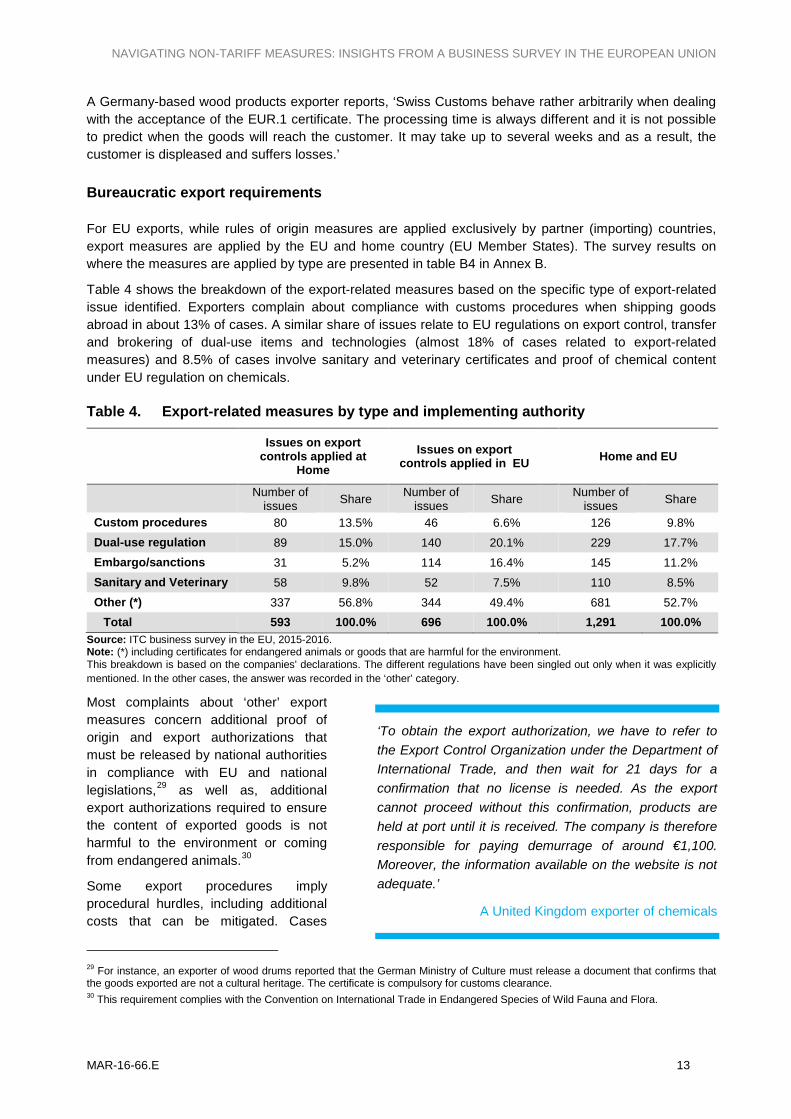
Table 4 shows the breakdown of the export-related measures based on the specific type of export-related issue identified. Exporters complain about compliance with customs procedures when shipping goods abroad in about 13% of cases. A similar share of issues relate to EU regulations on export control, transfer and brokering of dual-use items and technologies (almost 18% of cases related to export-related measures) and 8.5% of cases involve sanitary and veterinary certificates and proof of chemical content under EU regulation on chemicals.
Table 4. Export-related measures by type and implementing authority Issues on export
controls applied at Home
Issues on export controls applied in EU Home and EU
Number of issues Share Number of
issues Share Number of issues Share
Custom procedures 80 13.5% 46 6.6% 126 9.8% Dual-use regulation 89 15.0% 140 20.1% 229 17.7% Embargo/sanctions 31 5.2% 114 16.4% 145 11.2% Sanitary and Veterinary 58 9.8% 52 7.5% 110 8.5% Other (*) 337 56.8% 344 49.4% 681 52.7%
Total 593 100.0% 696 100.0% 1,291 100.0% Source: ITC business survey in the EU, 2015-2016. Note: (*) including certificates for endangered animals or goods that are harmful for the environment. This breakdown is based on the companies' declarations. The different regulations have been singled out only when it was explicitly mentioned. In the other cases, the answer was recorded in the ‘other’ category.
Most complaints about ‘other’ export measures concern additional proof of origin and export authorizations that must be released by national authorities in compliance with EU and national legislations,29 as well as, additional export authorizations required to ensure the content of exported goods is not harmful to the environment or coming from endangered animals.30
Some export procedures imply procedural hurdles, including additional costs that can be mitigated. Cases
29 For instance, an exporter of wood drums reported that the German Ministry of Culture must release a document that confirms that the goods exported are not a cultural heritage. The certificate is compulsory for customs clearance. 30 This requirement complies with the Convention on International Trade in Endangered Species of Wild Fauna and Flora.
‘To obtain the export authorization, we have to refer to the Export Control Organization under the Department of International Trade, and then wait for 21 days for a confirmation that no license is needed. As the export cannot proceed without this confirmation, products are held at port until it is received. The company is therefore responsible for paying demurrage of around €1,100. Moreover, the information available on the website is not adequate.’
A United Kingdom exporter of chemicals
NAVIGATING NON-TARIFF MEASURES: INSIGHTS FROM A BUSINESS SURVEY IN THE EUROPEAN UNION
14 MAR-16-66.E
involving application of sanctions and embargos for political reasons (reported by 11% of companies that faced export related measures, Table 4) are more difficult to overcome.31
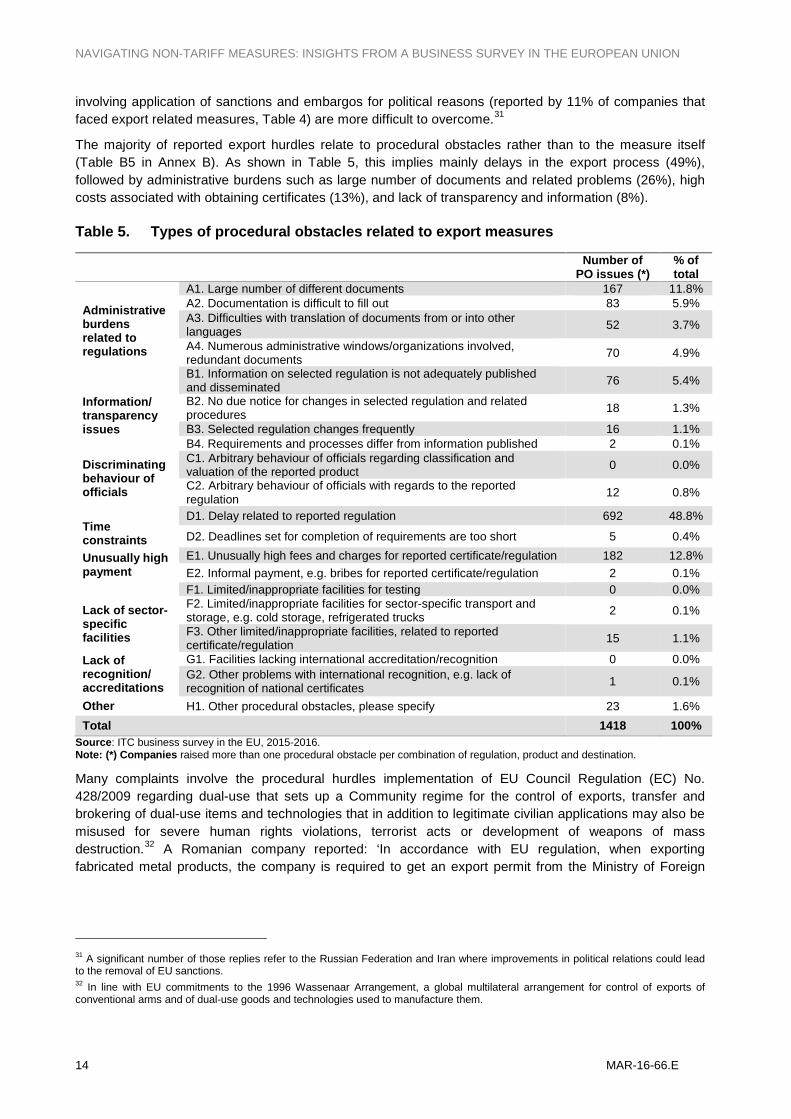
The majority of reported export hurdles relate to procedural obstacles rather than to the measure itself (Table B5 in Annex B). As shown in Table 5, this implies mainly delays in the export process (49%), followed by administrative burdens such as large number of documents and related problems (26%), high costs associated with obtaining certificates (13%), and lack of transparency and information (8%).
Table 5. Types of procedural obstacles related to export measures
Number of PO issues (*)
% of total
Administrative burdens related to regulations
A1. Large number of different documents 167 11.8% A2. Documentation is difficult to fill out 83 5.9% A3. Difficulties with translation of documents from or into other languages 52 3.7%
A4. Numerous administrative windows/organizations involved, redundant documents 70 4.9%
Information/ transparency issues
B1. Information on selected regulation is not adequately published and disseminated 76 5.4%
B2. No due notice for changes in selected regulation and related procedures 18 1.3%
B3. Selected regulation changes frequently 16 1.1% B4. Requirements and processes differ from information published 2 0.1%
Discriminating behaviour of officials
C1. Arbitrary behaviour of officials regarding classification and valuation of the reported product 0 0.0%
C2. Arbitrary behaviour of officials with regards to the reported regulation 12 0.8%
Time constraints
D1. Delay related to reported regulation 692 48.8%
D2. Deadlines set for completion of requirements are too short 5 0.4%
Unusually high payment
E1. Unusually high fees and charges for reported certificate/regulation 182 12.8% E2. Informal payment, e.g. bribes for reported certificate/regulation 2 0.1%
Lack of sector-specific facilities
F1. Limited/inappropriate facilities for testing 0 0.0% F2. Limited/inappropriate facilities for sector-specific transport and storage, e.g. cold storage, refrigerated trucks 2 0.1%
F3. Other limited/inappropriate facilities, related to reported certificate/regulation 15 1.1%
Lack of recognition/ accreditations
G1. Facilities lacking international accreditation/recognition 0 0.0% G2. Other problems with international recognition, e.g. lack of recognition of national certificates 1 0.1%
Other H1. Other procedural obstacles, please specify 23 1.6% Total 1418 100%
Source: ITC business survey in the EU, 2015-2016. Note: (*) Companies raised more than one procedural obstacle per combination of regulation, product and destination.
Many complaints involve the procedural hurdles implementation of EU Council Regulation (EC) No. 428/2009 regarding dual-use that sets up a Community regime for the control of exports, transfer and brokering of dual-use items and technologies that in addition to legitimate civilian applications may also be misused for severe human rights violations, terrorist acts or development of weapons of mass destruction.32 A Romanian company reported: ‘In accordance with EU regulation, when exporting fabricated metal products, the company is required to get an export permit from the Ministry of Foreign
31 A significant number of those replies refer to the Russian Federation and Iran where improvements in political relations could lead to the removal of EU sanctions. 32 In line with EU commitments to the 1996 Wassenaar Arrangement, a global multilateral arrangement for control of exports of conventional arms and of dual-use goods and technologies used to manufacture them.
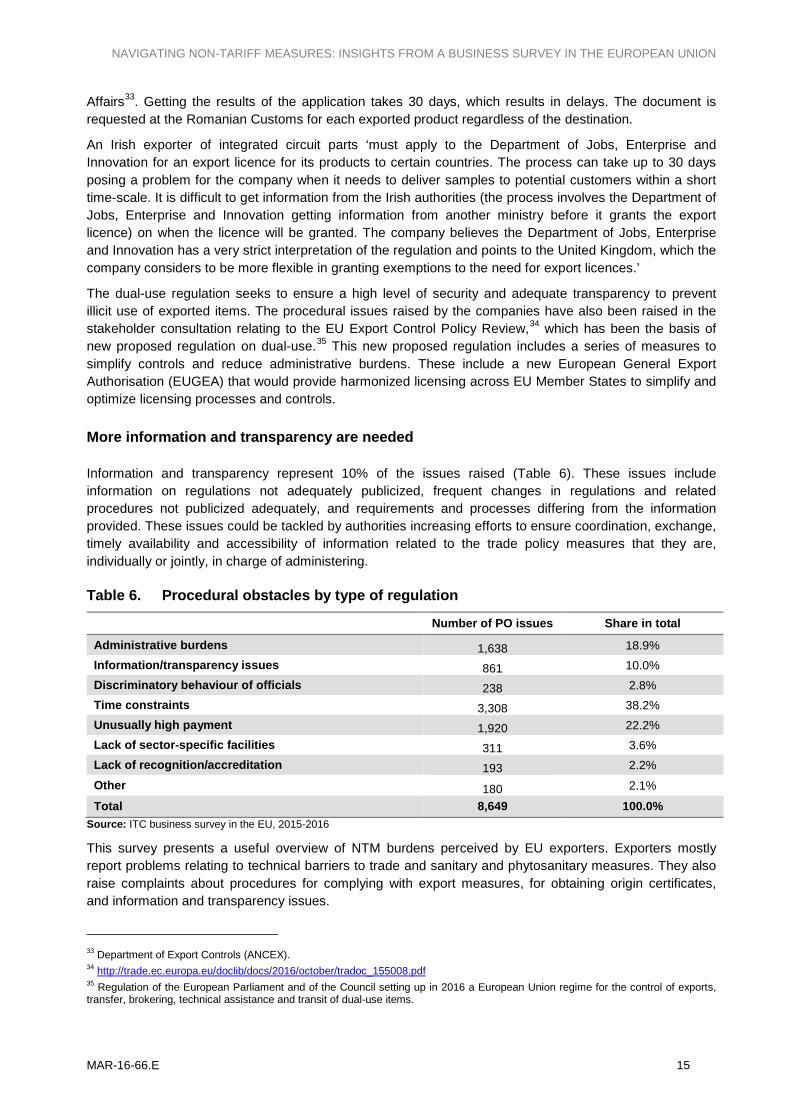
NAVIGATING NON-TARIFF MEASURES: INSIGHTS FROM A BUSINESS SURVEY IN THE EUROPEAN UNION
MAR-16-66.E 15
Affairs33. Getting the results of the application takes 30 days, which results in delays. The document is requested at the Romanian Customs for each exported product regardless of the destination.
An Irish exporter of integrated circuit parts ‘must apply to the Department of Jobs, Enterprise and Innovation for an export licence for its products to certain countries. The process can take up to 30 days posing a problem for the company when it needs to deliver samples to potential customers within a short time-scale. It is difficult to get information from the Irish authorities (the process involves the Department of Jobs, Enterprise and Innovation getting information from another ministry before it grants the export licence) on when the licence will be granted. The company believes the Department of Jobs, Enterprise and Innovation has a very strict interpretation of the regulation and points to the United Kingdom, which the company considers to be more flexible in granting exemptions to the need for export licences.’
The dual-use regulation seeks to ensure a high level of security and adequate transparency to prevent illicit use of exported items. The procedural issues raised by the companies have also been raised in the stakeholder consultation relating to the EU Export Control Policy Review,34 which has been the basis of new proposed regulation on dual-use.35 This new proposed regulation includes a series of measures to simplify controls and reduce administrative burdens. These include a new European General Export Authorisation (EUGEA) that would provide harmonized licensing across EU Member States to simplify and optimize licensing processes and controls.
More information and transparency are needed
Information and transparency represent 10% of the issues raised (Table 6). These issues include information on regulations not adequately publicized, frequent changes in regulations and related procedures not publicized adequately, and requirements and processes differing from the information provided. These issues could be tackled by authorities increasing efforts to ensure coordination, exchange, timely availability and accessibility of information related to the trade policy measures that they are, individually or jointly, in charge of administering.
Table 6. Procedural obstacles by type of regulation
Number of PO issues Share in total
Administrative burdens 1,638 18.9% Information/transparency issues 861 10.0% Discriminatory behaviour of officials 238 2.8% Time constraints 3,308 38.2% Unusually high payment 1,920 22.2% Lack of sector-specific facilities 311 3.6% Lack of recognition/accreditation 193 2.2%
Other 180 2.1%
Total 8,649 100.0% Source: ITC business survey in the EU, 2015-2016
This survey presents a useful overview of NTM burdens perceived by EU exporters. Exporters mostly report problems relating to technical barriers to trade and sanitary and phytosanitary measures. They also raise complaints about procedures for complying with export measures, for obtaining origin certificates, and information and transparency issues.
33 Department of Export Controls (ANCEX). 34 http://trade.ec.europa.eu/doclib/docs/2016/october/tradoc_155008.pdf 35 Regulation of the European Parliament and of the Council setting up in 2016 a European Union regime for the control of exports, transfer, brokering, technical assistance and transit of dual-use items.


NAVIGATING NON-TARIFF MEASURES: INSIGHTS FROM A BUSINESS SURVEY IN THE EUROPEAN UNION
MAR-16-66.E 17
Chapter 4: Findings for micro, small and medium-sized enterprises
Because larger companies generally have bigger portfolios of goods and larger numbers of trading partners compared to smaller companies, they are more likely to face hurdles in at least one of these transactions. Smaller companies tend to trade fewer products with fewer partners. This implies a lower likelihood to experience NTM-related problems: 42% percent of large companies experience NTM obstacles compared to 36% of medium-size companies, 33% of small companies and 28% of micro-enterprises (Figure 3). 36
The impact of NTMs is likely to be much higher for smaller than for larger firms, as the share of transactions in which they encounter problematic NTMs is higher for smaller companies. More than half of micro-enterprises report that more than half of their transactions are by NTMs, compared to 47% for small companies, 48% for medium-sized companies and 46% for large firms.
Figure 3. Share of companies and transactions affected by NTMs, by size
Source: ITC business survey in the EU, 2015-2016.
The number of NTM-related obstacles is higher for micro companies, which encountered an average of 1.27 NTMs and 1.51 POs per transaction, while large firms face an average of 1.24 NTMs and 1.49 POs per transaction (Table 7). For a small firm, the burden of an obstacle in one or more of its few markets is much higher relative to its total costs than for a large firm. A more diversified large company can compensate for difficulties in some markets with other established business partners.
Table 7. Firms’ transactions and incidences of NTMs by size Average number of
transactions per company* Average number of NTMs
per transaction Average number of POs
per transaction Large 12.08 1.24 1.49 Medium 8.95 1.21 1.42 Small 7.47 1.26 1.56 Micro 5.56 1.27 1.51 Source: ITC business survey in the EU, 2015-2016 Notes: (*) A transaction is a pair of exported product (at HS6 level) and partner country for a company.
There appears to be no relationship between a company’s size and the types of NTMs that it faces (Figure B3 in Annex B). The share of micro, small, medium-sized and large firms that report the same issues is very similar across different types of NTMs. Nevertheless, small companies are more susceptible to NTMs
36 Firms are divided into size categories according to the number of employees: Micro companies have less than 10 employees, small companies between 10 and 50, medium-size companies between 50 and 250 and large companies more than 250.
28% 33%
36% 42%
51% 47% 48% 46%
0%
10%
20%
30%
40%
50%
60%
Micro Small Medium Large
Share of companies affected byburdensome NTMs
Share of transactions affectedby burdensome NTMs
NAVIGATING NON-TARIFF MEASURES: INSIGHTS FROM A BUSINESS SURVEY IN THE EUROPEAN UNION
18 MAR-16-66.E
because of their limited capacity to overcome procedural obstacles. The three main procedural obstacles faced by companies remain primarily administrative.
In Malta, a small family-run business, exporting volcanic stone tables to the United States reports that it is required to have a US address, or else it must grant a Customs power of attorney to its shipping agent. ‘This presents an additional administrative burden, as it must be done in person and requires a large number of documents.’
Micro companies are more prone to information/transparency issues, such as difficulties in obtaining information or keeping up with changing regulations. A small German company exporting musical instruments to India was not aware that a compulsory inspection takes place at the Indian Customs due to lack of information. According to the company ‘the inspection officials work slowly, causing the goods to be delayed for up to 105 days without any information about the status or outcome of the inspection.’ The company estimates the total cost of this measure to be 50% of the value of the product.
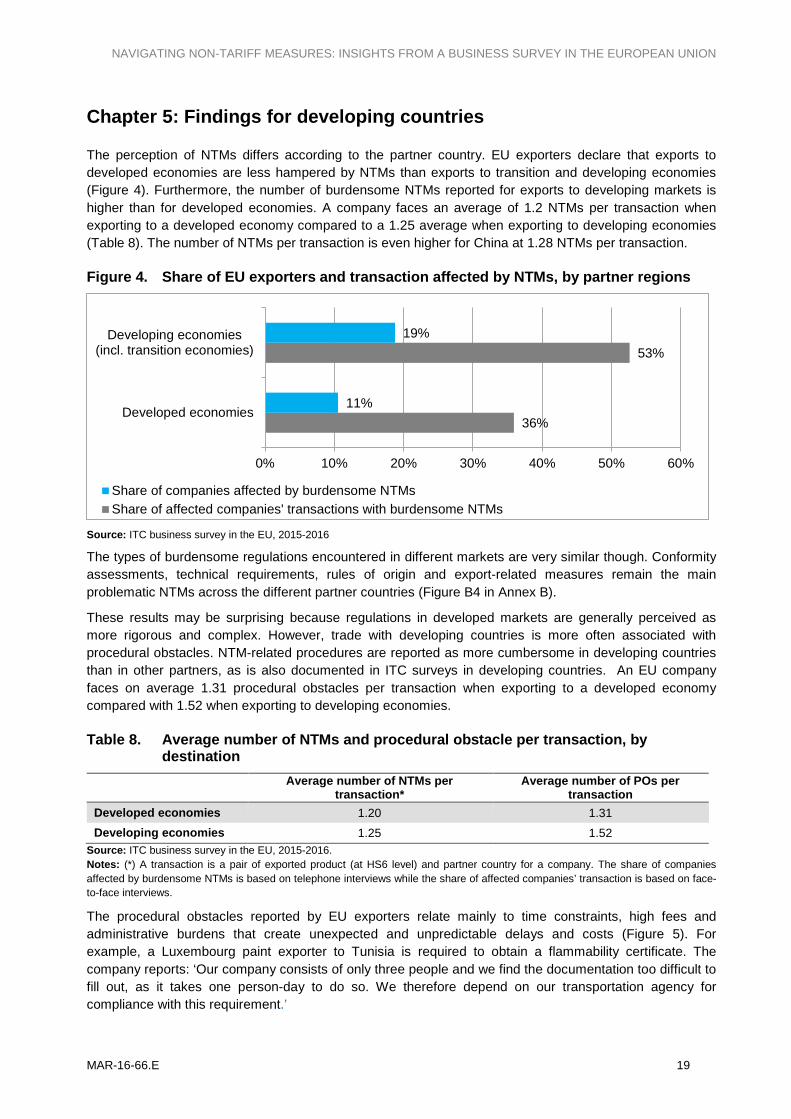
NAVIGATING NON-TARIFF MEASURES: INSIGHTS FROM A BUSINESS SURVEY IN THE EUROPEAN UNION
MAR-16-66.E 19
Chapter 5: Findings for developing countries
The perception of NTMs differs according to the partner country. EU exporters declare that exports to developed economies are less hampered by NTMs than exports to transition and developing economies (Figure 4). Furthermore, the number of burdensome NTMs reported for exports to developing markets is higher than for developed economies. A company faces an average of 1.2 NTMs per transaction when exporting to a developed economy compared to a 1.25 average when exporting to developing economies (Table 8). The number of NTMs per transaction is even higher for China at 1.28 NTMs per transaction.
Figure 4. Share of EU exporters and transaction affected by NTMs, by partner regions
Source: ITC business survey in the EU, 2015-2016
The types of burdensome regulations encountered in different markets are very similar though. Conformity assessments, technical requirements, rules of origin and export-related measures remain the main problematic NTMs across the different partner countries (Figure B4 in Annex B).
These results may be surprising because regulations in developed markets are generally perceived as more rigorous and complex. However, trade with developing countries is more often associated with procedural obstacles. NTM-related procedures are reported as more cumbersome in developing countries than in other partners, as is also documented in ITC surveys in developing countries. An EU company faces on average 1.31 procedural obstacles per transaction when exporting to a developed economy compared with 1.52 when exporting to developing economies.
Table 8. Average number of NTMs and procedural obstacle per transaction, by destination
Average number of NTMs per transaction*
Average number of POs per transaction
Developed economies 1.20 1.31 Developing economies 1.25 1.52
Source: ITC business survey in the EU, 2015-2016. Notes: (*) A transaction is a pair of exported product (at HS6 level) and partner country for a company. The share of companies affected by burdensome NTMs is based on telephone interviews while the share of affected companies’ transaction is based on face-to-face interviews.
The procedural obstacles reported by EU exporters relate mainly to time constraints, high fees and administrative burdens that create unexpected and unpredictable delays and costs (Figure 5). For example, a Luxembourg paint exporter to Tunisia is required to obtain a flammability certificate. The company reports: ‘Our company consists of only three people and we find the documentation too difficult to fill out, as it takes one person-day to do so. We therefore depend on our transportation agency for compliance with this requirement.’
36%
53%
11%
19%
0% 10% 20% 30% 40% 50% 60%
Developed economies
Developing economies(incl. transition economies)
Share of companies affected by burdensome NTMsShare of affected companies' transactions with burdensome NTMs

NAVIGATING NON-TARIFF MEASURES: INSIGHTS FROM A BUSINESS SURVEY IN THE EUROPEAN UNION
20 MAR-16-66.E
In addition most problems relating to lack of information and discriminatory behaviour of are higher in developing countries than anywhere else. For instance, a United Kingdom exporter has been required to obtain a Tax Residency Certificate and show it has an office in India, which it does not. The company is not able to find information on the regulation in order to understand its purpose and assess the potential costs.
Figure 5. Type of procedural obstacles encountered in partner countries by EU exporters
Source: ITC business survey in the EU, 2015-2016
These findings mirror ITC NTM Surveys in developing countries that revealed that many obstacles related to NTMs reported by importers from the EU in developing countries come from lengthy and expensive procedures in their home countries.37 For example, an Arab importer of motor vehicle brakes from the EU reported: ‘The testing required by our national standardization organization at the central chemistry lab (ensuring that the pads are asbestos free) takes very long’, leading to unpredictable delays and potential loss of business.’38
Conformity assessment procedures are among the most frequent problems reported by companies located in developing economies, together with entry formalities and taxes. Developing country imports from the EU are mainly affected by product certification requirements, inspections and import authorizations. Problems arising with conformity assessment procedures depend on local capacities and facilities that are often perceived as inadequate, inefficient and expensive. Problems encountered by developing country importers of goods from the EU add to the costs of obstacles experienced by EU exporters on the other side of the transaction.
On the EU import side this survey mirrors insights from developing country exporters. The main challenges for sourcing from developing countries are product quality, food safety and conformity with European standards. As an EU importer said: ‘Enterprises in developing countries must understand the necessity for their products to comply with the exact standards of EU medical device companies, which operate in a very stringent regulatory environment.’
When it comes to the challenges to sourcing from developing countries, nearly two third of the EU companies interviewed that reported NTM issues relating to imports from developing countries identify product quality as a major challenge. Other common challenges to sourcing from developing countries are shown in figure 6.
37 See ‘The Invisible Barriers to Trade – How Businesses Experience Non-Tariff Measures’, ITC technical paper 2015. 38 See ‘Making regional integration work - Company perspectives on non-tariff measures in Arab States’, ITC Book 2015.
0%
5%
10%
15%
20%
25%
30%
35%
In developed economies In developing economies
Time constraints
Unusually high payment
Administrative burdens related toregulationsInformation/transparency issues
Lack of sector-specific facilities
Discriminating behaviour ofofficialsLack of recognition/ accreditations
Other

NAVIGATING NON-TARIFF MEASURES: INSIGHTS FROM A BUSINESS SURVEY IN THE EUROPEAN UNION
MAR-16-66.E 21
Figure 6. Challenges to sourcing from developing countries
Source: ITC business survey in the EU, 2015-2016.
When asked for suggestions to companies from developing countries to better supply their products to the EU market, most EU interviewees identified improvements in technical aspects such as product quality and conformity with EU standards as a top priority. They also recommended improved business and management training.
0% 20% 40% 60% 80%
Product qualityProduct conformity with EU standards
Transporation costsOn-time receipts and delays
Business customs and practicesProduct price
Communication infrastructureDelivery damage
Accurate quantity and selection of shipmentsSecure payment procedures
Production capabilityInformation system capability
Accurate invoiceSafety stock levels
Share of companiesreporting this challenge


NAVIGATING NON-TARIFF MEASURES: INSIGHTS FROM A BUSINESS SURVEY IN THE EUROPEAN UNION
MAR-16-66.E 23
Chapter 6: Conclusion and way forward
This ITC NTM Survey presents a broad, albeit complex, perspective of the challenges faced by EU exporters. They report difficulties meeting technical and conformity assessments requirements related to TBTs and SPSs imposed by partner countries. They raise numerous issues regarding procedures for compliance with EU or home country regulations (export-related measures), as well as with procedures for obtaining certificates of origin.
EU exporters say the majority of NTMs they encounter are burdensome due to, entirely or partially, the procedural obstacles encountered when trying to demonstrate compliance with a given regulation rather than the regulation itself being too strict.
These burdens are not strictly non-tariff barriers (NTBs) in the WTO sense (i.e. measures with a trade-distorting intent), as they are non-discriminatory and do not violate international regulations.
NTBs are tackled by the European Commission through appropriate channels (including the WTO, FTAs and diplomacy) based on a barrier removal strategy defined jointly with business and EU Member States in the context of the Market Access Partnership.
For many of the burdens reported by exporters, it is necessary to negotiate rules that facilitate regulatory convergence, mutual recognition and transparency. This is part of the European Commission's efforts in its FTA negotiations and implementation and in the context of the WTO TBT and SPS Agreements.
The reported burdens show the need for regulatory and procedural streamlining by the EU and Member States.39 Simplification of procedures is high on the European Commission's agenda under its Regulatory Fitness and Performance Programme (REFIT). In this context, reference should be made to the recent revision of the dual-use export control rules, aimed at regulatory simplification and burden reduction, while continuing to ensure the necessary high level of security. Member States should participate in such efforts, supported by the enhanced Market Access Partnership.
The EU strives to create a level playing field for all sizes of companies to enable SMEs to compete globally at similar costs per unit as large companies. For example, the EU intends to introduce an SME chapter in all new trade agreements to ensure that SMEs can benefit from new market opportunities, including by requiring more transparency on NTMs. The Commission's Market Access Database40 provides product-specific information on tariffs, import requirements, including applicable NTMs, and statistics for over 100 partner countries to clarify export conditions for EU companies.41 The EU's Export Helpdesk,42 shows product-specific requirements for goods to be imported into the EU, facilitating exports to the EU.
This NTM Survey provides insights into facilitating trade between developing countries and the EU. This information complements findings, notably from ITC NTM Surveys in developing countries,43 on the complex relationship between trade and NTMs, bringing new evidence from developed economies that will serve as a benchmarking tool to better tailor trade policies and assistance across the world.
39 Annex C provides detailed figures on reported burdens by Member State. The sample size varies widely across Member States. Due to the sampling by sector at EU level,. 40 http://madb.europa.eu/madb/indexPubli.htm. 41 SMEs benefit from other initiatives such as the Trade Defence Helpdesk (Mail to: [email protected]) which provides advice services to handle issues with Trade Defence Instruments, such as anti-dumping or anti-subsidy measures; and the SME IPR Helpdesks (https://www.iprhelpdesk.eu/ip-sme-corner) assisting SMEs to protect and enforce their intellectual property rights in partner countries. Much of the information on tariffs, preferences, rules of origin, trade remedies and NTMs, which is contained in ITC’s Market Access Map (www.macmap.org), is also available to EU companies although advanced analytical features are only accessible upon registration. 42 http://exporthelp.europa.eu/thdapp/index.htm. This includes information on EU tariffs, preferential arrangements, quotas and statistics, but also on other requirements, including applicable NTMs. 43 More information about ITC Surveys in developing countries is found at www.ntmsurvey.org and in the ITC publication series on NTMs, available at www.intracen.org/publications/ntm.
NAVIGATING NON-TARIFF MEASURES: INSIGHTS FROM A BUSINESS SURVEY IN THE EUROPEAN UNION
24 MAR-16-66.E
The findings in this NTM Survey only scratch the surface in exploiting the richness of the collected firm-level data. Rather than presenting a full-fledged analysis, this report demonstrates the diversity, detail and relevance of the collected information on EU exports.
This information opens discussion on further analysis that should be undertaken. Possibilities include looking closer at within-industry differences of experiences, specific sectors, markets or company sizes. For Member States with a sufficiently high number of interviews, country-specific analysis could be envisaged. In line with its development mandate, ITC plans to exploit the EU firms’ responses on sourcing from developing countries, to expand the import side of the survey, and to match EU results to the information gathered from developing countries for a better tailoring of trade-related technical assistance.
This NTM Survey focuses on trade in goods. However, complex regulations and related trade obstacles are equally detrimental to companies in the services sector. Given the complexity of services trade, capturing the business experiences for the various sectors and different modes of supply requires a different methodology, which ITC is currently developing. Complementing ITC’s NTM work on goods trade with documentation of private sector experience when trading services, is an important avenue for further research and data collection.

NAVIGATING NON-TARIFF MEASURES: INSIGHTS FROM A BUSINESS SURVEY IN THE EUROPEAN UNION
MAR-16-66.E 25
Annex A. Survey methodology and implementation
Sample frame and sampling method
The ITC NTM Survey sample frame has been constructed from two comprehensive registers, obtained from Dun & Bradstreet (DnB) and Kompass, to compile the maximum number of exporting companies with key information such as the sector of activity, the company size and, most importantly, the contact details. The combined dataset was harmonized by sector and company size, and expanded with the EU Combined Nomenclature. The final sample frame consisted of more than 266,069 exporting companies from the 28 EU Member States.
The selection of companies for the NTM Survey was based on stratified random sampling by sector (26 sectors) and company size (small, medium and large)44 as the type and incidence of NTMs are often related to product and company size (overall 78 strata). The stratification by sector of activity is justified by the fact that non-tariff regulations often refer to specific product or production characteristics.
The sample size of exporting companies was then determined independently for each stratum and calculated from the sample frame statistics (i.e. number of companies). This method allows taking into account the large variations of NTMs across sectors and the potentially differing experience by companies of different sizes. It also ensures that even sectors with a small number of companies but high export activity are well represented. These sectors can be accidentally excluded if the sampling is fully random. Based on these criteria and the available business register, a sample size of 6,664 companies was compiled, of which 2,443 are small, 2,337 medium-sized and 1,884 large (Table A1.)
The sample size for each stratum was then distributed across countries according to their economic weight, i.e. the countries’ respective extra-EU export value shares, the value-added shares and their shares in the number of exporting companies (Table A2.) By weighting for value-added and extra-EU export value, the NTM Survey ensures coverage of those companies that contribute most to the EU’s economic and export activity and that can better identify the main trade obstacles.
In total, 8,100 companies have been interviewed by telephone to ensure a good coverage in each stratum and offset the risk of a lower answer rate than estimated.
The sampling method for ITC’s NTM Surveys is documented in the 2015 ITC publication, ‘The Invisible Barriers to Trade – How Businesses Experience Non-Tariff Measures’.45 Further details on the EU sampling are presented in a technical note, published on ITC’s NTM Survey website.46
44 Company size definition: small = 1-49 employees; medium = 50-249 employees; large = more than 250 employees 45 www.intracen.org/publications/ntm. 46 www.ntmsurvey.org/eu

NAVIGATING NON-TARIFF MEASURES: INSIGHTS FROM A BUSINESS SURVEY IN THE EUROPEAN UNION
26 MAR-16-66.E
Table A1. Estimated sample size by sector and company size
Sector Sample frame Estimated sample size
Small Medium Large Total Small Medium Large Total 1. Agricultural Production - Crops 6,271 1,425 142 7,838 95 90 57 242
2. Agricultural Production - Livestock 2,111 430 50 2,591 92 79 33 203
3. Forestry 836 209 43 1,088 86 66 30 182 4. Fishing, Hunting, & Trapping 960 338 51 1,349 87 75 33 195
5. Food & Kindred Products 12,778 3924 1288 17,990 95 94 89 278
6. Beverages & Tobacco Products 4,918 861 266 6,045 94 86 71 251
7. Textile Mill Products 6,480 2105 300 8,885 95 92 73 259 8. Apparel & Other Textile Products 11,472 3,123 451 15,046 95 93 79 268
9. Lumber & Wood Products 7,852 3,036 349 11,237 95 93 75 263
10. Furniture & Fixtures 6,589 2,120 346 9,055 95 92 75 262 11. Paper & Allied Products 3,038 1,862 385 5,285 93 91 77 261
12. Printing & Publishing 6,464 1,991 270 8,725 95 92 71 257 13. Chemical & Allied Products 7,945 4,329 1023 13,297 95 94 88 277
14. Rubber & Miscellaneous Plastics Products
10,601 5,150 693 16,444 95 94 84 274
15. Leather & Leather Products 4,372 1,083 128 5,583 94 88 55 237
16. Stone, Clay, & Glass Products 7,103 3,122 636 10,861 95 93 83 271
17. Primary Metal Industries 3,848 2,744 705 7,297 94 93 85 271
18. Fabricated Structural Metal Products 8,109 2,059 376 10,544 95 92 76 263
19. Other Fabricated Metal Products 14,282 3,527 786 18,595 95 93 86 274
20. Metalworking and Special Industry Machinery
12,133 2,765 540 15,438 95 93 82 270
21. General Industrial Machinery and Equipment 7,029 1,658 438 9,125 95 91 79 264
22. Other Industrial and Commercial Machinery and Computer Equipment
15,950 3,893 1232 21,075 95 94 89 278
23. Electronic & Other Electric Equipment 11,558 6,169 1,274 19,001 95 95 89 279
24. Transportation Equipment 3,577 1,920 757 6,254 94 91 85 270
25. Instruments & Related Products 5,331 2,857 465 8,653 94 93 80 267
26. Miscellaneous Manufacturing Industries 6,844 1,762 162 8,768 95 91 60 246
Total 188,451 64,462 13,156 266,069 2,443 2,337 1,884 6,664 Source: Dun & Bradstreet’s (Hoover’s) and Kompass (2014), and ITC calculations. Note: The table presents the number of companies contained in the compiled business register per country as well as the estimated sample size estimated ex ante. Out of 6,271 registered small companies in the first sector, 95 companies need to be interviewed to represent this population.

NAVIGATING NON-TARIFF MEASURES: INSIGHTS FROM A BUSINESS SURVEY IN THE EUROPEAN UNION
MAR-16-66.E 27
Table A2. Estimated sample size by country
Sector Number of companies to be interviewed
Share of total sample size
Actual number of telephone interviews
Austria 173 2.50% 228 Belgium 170 2.60% 202 Bulgaria 47 0.80% 52 Croatia 40 0.60% 61 Cyprus 6 0.10% 20 Czech Republic 117 1.80% 144 Denmark 143 2.20% 150 Estonia 25 0.40% 36 Finland 131 1.90% 146 France 839 12.70% 707 Germany 1391 20.80% 1,712 Greece 82 1.30% 98 Hungary 72 1.10% 118 Ireland 70 1.10% 76 Italy 1198 17.30% 1,468 Latvia 23 0.30% 33 Lithuania 40 0.60% 69 Luxembourg 5 0.10% 10 Malta 8 0.10% 10 Netherlands 250 3.90% 268 Poland 256 4.00% 284 Portugal 130 1.80% 152 Romania 85 1.30% 132 Slovakia 40 0.60% 85 Slovenia 37 0.60% 42 Spain 486 7.20% 541 Sweden 238 3.50% 250 United Kingdom 561 8.90% 1,006 Total 6,664 100% 8,100
Source: EU Survey sample, ITC calculations, 2015.
Database
The NTM information captured in the face-to-face interviews is a combination of free descriptions and codified information. The reported burdensome measures (regulations) are classified according to the international taxonomy of NTMs (Section C below), with minor adaptations to the ITC NTM Survey’s needs. The NTM classification used for the ITC surveys consists of 120 specific measures grouped into 16 categories. The NTM classification is the core of the survey, enabling the application of a uniform and systematic approach to comparatively analyse burdensome NTMs in different countries.
Similar to NTMs, procedural obstacles (POs) are classified according to a taxonomy developed by ITC for the purpose of the NTM Surveys (Table A5.)
Each NTM can either create a regulatory obstacle, one (or more) procedural obstacles or a combination of both. During the face-to-face interviews, each company reports a minimum of one trade obstacle.
Where captured on paper, survey responses were digitalized and then compiled into a single dataset, which contains three main databases: (1) the company-level information combining the data captured in the telephone and the face-to-face interviews, (2) the NTM issues information at product and partner country level stemming from the face-to-face interview stage, and (3) the procedural obstacle issues
NAVIGATING NON-TARIFF MEASURES: INSIGHTS FROM A BUSINESS SURVEY IN THE EUROPEAN UNION
28 MAR-16-66.E
information for each NTM. In the country data analysis, frequency and coverage statistics are calculated along several dimensions, including product and sector, main NTM category, related procedural obstacle category and company characteristics.
The information captured through the interviews was subsequently matched with additional trade-related data in order to crosscheck the reliability of the reported information and to allow for further research on the impact of NTMs. This includes the type of trade agreements the EU shares with each partner country, for example Free Trade Agreements; Everything But Arms; and Africa, Caribbean, Pacific Economic Partnership Agreements, which are relevant for the discussion concerning preferential and non-preferential rules of origin. The database also includes a cross-reference to the ITC-UNCTAD-World Bank regulatory dataset on NTMs at the product (HS6/4)-partner-NTM level.
.

NAVIGATING NON-TARIFF MEASURES: INSIGHTS FROM A BUSINESS SURVEY IN THE EUROPEAN UNION
MAR-16-66.E 29
Table A3. Survey database description Type of information Variables
Company information
- company unique ID47 - location (28 EU countries) - number of employees - number of operating years - activity (export or export/import) - main exported/imported products (HS6 code and description) and related sector - export destination/origin markets - export shares in the total value of sales - indication whether the company faces a burdensome NTM when exporting/importing by
destination/origin markets - indication whether the company participated to the face-to-face stage or not
Trade information
- company unique ID - location - product code and description, and related sector - trade direction (export or import) - partner country - indication whether the company faces a burdensome NTM when exporting/importing to the
different partners
NTM information
- company unique ID - location - product (HS6 code and description) and related sector - trade direction - partner - indication on the type of trade agreements that the EU shares with the partner country - description of the NTM-related problem - name of regulation concerned - agency implementing the regulation - indication whether the NTM is applied by the EU, the home country, the partner country or the
buyer (i.e. private standard) - indication whether it is a regulation, a procedural obstacles or a combination of the two both - the NTM code and description - indication whether the reported NTM exists in the NTM repository48 - name of the regulation as captured in the NTM repository - free description of the procedural obstacle (if any and up to three) - characteristics of the procedural obstacle (if any and up to three) - agency involved in the procedural obstacle (if any and up to three) - location of the procedural obstacle (partner or home country, if any and up to three) - Procedural obstacle code and description (if any and up to three) - cost associated to the NTM (as % of the product value) - company recommendation on the best way to address the NTM - link to regulatory mapping of NTMs according to the international NTM classification
Other information
- company unique ID - location - free text on the other obstacles the company face when exporting to the United States, China
and Japan - categories of obstacles the company may face when sourcing from developing countries - company recommendation on developing countries’ supply to EU market
47 Survey data are anonymized for confidentiality reasons. It is part of the survey process and intends to increase the participation in the NTM Survey, which captures critical business operations’ information. 48 Market Access Map database on NTMs
NAVIGATING NON-TARIFF MEASURES: INSIGHTS FROM A BUSINESS SURVEY IN THE EUROPEAN UNION
30 MAR-16-66.E
Non-tariff measures classification for surveys
Importing countries are very different in the ways they apply non-tariff measures (NTMs). This called for an international taxonomy of NTMs, which was prepared by the Multi-Agency Support Team (MAST), a group of technical experts from eight international organizations, including the Food and Agricultural Organization of the United Nations, the International Monetary Fund, ITC, the Organisation of Economic Co-operation and Development, the United Nations Conference on Trade and Development, the United Nations Industrial Development Organization, the World Bank and WTO. It was finalized in November 2009 and updated in 2012. It is used to collect, classify, analyse and disseminate information on NTMs received from official sources such as government regulations.
For the purpose of the large-scale company surveys on NTMs, ITC uses a simplified version of this international classification. ITC’s NTM classification for surveys differentiates measures according to 16 chapters denoted by alphabetical letters, each comprising sub-chapters (denoted by two letters) and the individual measures (denoted by two letters and a number). The following outlines the content of each of the 16 chapters.
Chapter A, on technical regulations, refers to product-related requirements. They are legally binding and set by the importing country. They define the product characteristics, technical specifications of a product or the production process and post-production treatment and comprise the applicable administrative provisions, with which compliance is mandatory. Technical requirements include sanitary and phytosanitary measures, which are generally implemented to protect human, animal and plant life, and health.
Chapter B, on conformity assessment, refers to measures determining whether a product or a process complies with the technical requirements specified under Chapter A. Conformity assessments include control, inspection and approval procedures – such as testing, inspection, certification and traceability – which confirm and control that a product fulfils the technical requirements and mandatory standards imposed by the importing country, for example to safeguard the health and safety of consumers.
Chapter C, on pre-shipment inspection and other formalities, refers to the practice of checking, consigning, monitoring and controlling the shipment of goods before or at entry into the destination country.
Chapter D, on trade remedies refers to measures implemented to counteract the damage resulting from the occurrence of ‘unfair’ foreign trade practices. It includes anti-dumping, countervailing and safeguards measures.
Chapter E, on licences, quotas, prohibitions and other quantity control measures, includes measures that restrain the quantity of goods that can be imported, regardless of whether they come from different sources or from one specific supplier. These measures can take the form of restrictive licensing, fixing of a predetermined quota or through prohibitions.
Chapter F, on charges, taxes and price control measures, refers to measures other than tariffs that increase the cost of imports in a similar manner, i.e. by a fixed percentage or by a fixed amount. It includes measures implemented to control or affect the prices of imported goods.
Chapter G, on finance measures, refers to measures that are intended to regulate the access to and cost of foreign exchange for imports and define the terms of payment. They may increase import costs in the same manner as tariff measures.
Chapter H, on anti-competitive measures, refers to measures that are intended to grant exclusive or special preferences or privileges to one or more limited groups of economic operators.
Chapter I, on trade-related investment measures, refers to measures that restrict investment by requesting local content, or requesting that investment be related to export to balance imports.
Chapter J, on distribution restrictions, refers to restrictive measures related to the internal distribution of imported products.

NAVIGATING NON-TARIFF MEASURES: INSIGHTS FROM A BUSINESS SURVEY IN THE EUROPEAN UNION
MAR-16-66.E 31
Chapter K, on restrictions on post-sales services, refers to measures restricting the provision of post-sales services in the importing country by producers of exported goods.
Chapter L, on subsidies, includes measures related to financial contributions by a government or government body to a production structure, be it a particular industry or company, such as direct or potential transfer of funds (e.g. grants, loans, equity infusions), payments to a funding mechanism and income or price support.
Chapter M, on government procurement restrictions, refers to measures controlling the purchase of goods by government agencies, generally by preferring national providers.
Chapter N, on intellectual property, refers to measures related to intellectual property rights in trade. Intellectual property legislation covers patents, trademarks, industrial designs, layout designs of integrated circuits, copyright, geographical indications and trade secrets.
Chapter O, on rules of origin, covers laws, regulations and administrative determinations of general application applied by the governments of importing countries to determine the country of origin of goods.
Chapter P, on export-related measures, encompasses all measures that countries apply to their exports. It includes export taxes, export quotas or export prohibitions, among others.
The structure of the NTM classification for ITC surveys
Source: International Trade Centre, NTM classification adapted for ITC surveys, February 2015 (unpublished document).
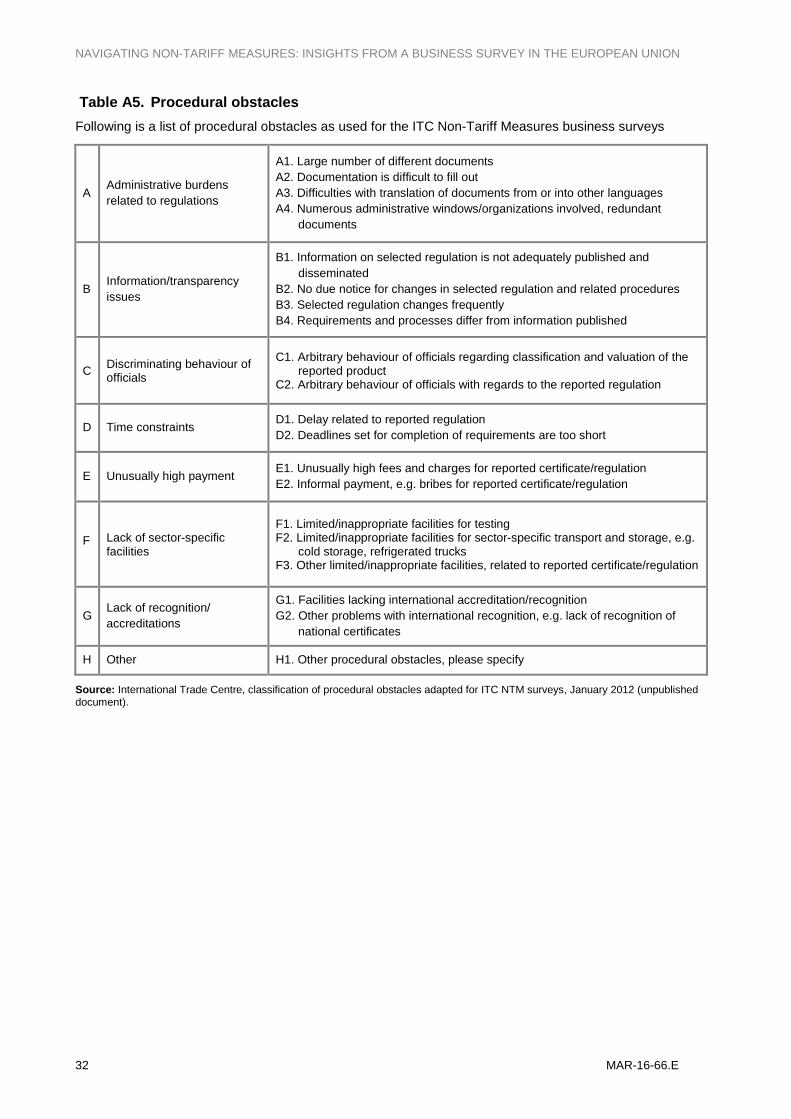
NAVIGATING NON-TARIFF MEASURES: INSIGHTS FROM A BUSINESS SURVEY IN THE EUROPEAN UNION
32 MAR-16-66.E
Table A5. Procedural obstacles Following is a list of procedural obstacles as used for the ITC Non-Tariff Measures business surveys
A Administrative burdens related to regulations
A1. Large number of different documents A2. Documentation is difficult to fill out A3. Difficulties with translation of documents from or into other languages A4. Numerous administrative windows/organizations involved, redundant
documents
B Information/transparency issues
B1. Information on selected regulation is not adequately published and disseminated
B2. No due notice for changes in selected regulation and related procedures B3. Selected regulation changes frequently B4. Requirements and processes differ from information published
C Discriminating behaviour of officials
C1. Arbitrary behaviour of officials regarding classification and valuation of the reported product
C2. Arbitrary behaviour of officials with regards to the reported regulation
D Time constraints D1. Delay related to reported regulation D2. Deadlines set for completion of requirements are too short
E Unusually high payment E1. Unusually high fees and charges for reported certificate/regulation E2. Informal payment, e.g. bribes for reported certificate/regulation
F Lack of sector-specific facilities
F1. Limited/inappropriate facilities for testing F2. Limited/inappropriate facilities for sector-specific transport and storage, e.g.
cold storage, refrigerated trucks F3. Other limited/inappropriate facilities, related to reported certificate/regulation
G Lack of recognition/ accreditations
G1. Facilities lacking international accreditation/recognition G2. Other problems with international recognition, e.g. lack of recognition of
national certificates
H Other H1. Other procedural obstacles, please specify
Source: International Trade Centre, classification of procedural obstacles adapted for ITC NTM surveys, January 2012 (unpublished document).

NAVIGATING NON-TARIFF MEASURES: INSIGHTS FROM A BUSINESS SURVEY IN THE EUROPEAN UNION
MAR-16-66.E 33
Survey implementation and methodology
The EU NTM Survey project started in January 2015. The first two months were dedicated to developing the methodology, particularly the questionnaires and sampling method, in close collaboration with the European Commission’s Directorate-General for Trade’s Chief Economist and Trade Analysis Unit. The following two months, field partners were selected according to ITC’s procurement processes, according to UN rules, and the survey materials were finalized. The questionnaires and project leaflet were translated into 20 EU languages, thanks to the European Commission’s DG Translation services. A specific set of materials was prepared for each EU Member State.
The first interviews were conducted in May 2015 in Poland and the NTM Survey was then launched successively in the other countries. This work lasted 10 months, until February 2016, and involved 18 local survey companies/experts across the 28 Member States). Each implementing partner was trained on the NTM Survey methodology and supervised during the work. In total, more than 150 trained interviewers participated in the field implementation.
ITC applied a quality control and monitoring exercises across the process, starting from the first interviews of field partners, which were usually carried out in the presence of ITC staff, to ensure the methodology was replicated accurately and the sampling was respected. The quality control consisted of periodic statistical checks to identify data incoherencies as well as manual checks to ensure the correct and coherent coding of products, NTMs and procedural obstacles.
Where necessary, data were sent back to partners for correction or completion, which sometimes involved callbacks to interviewed companies. ITC then finalized the data. The 28 country datasets were then compiled and controlled again. The final control consisted in coherence checks, harmonizing the different datasets in terms of language and units, and cleaning the free text variables. As mentioned in section B above, additional data was added to the database to crosscheck the survey information. The final database, available since May 2016, is described in the following section.

NAVIGATING NON-TARIFF MEASURES: INSIGHTS FROM A BUSINESS SURVEY IN THE EUROPEAN UNION
34 MAR-16-66.E
Table A6. Survey sectors
SIC code Survey sector % of
exporting companies in this
sector
% in total export value
01 1. Agricultural Production - Crops 2.9% 1.4% 02 2. Agricultural Production - Livestock 1.0% 0.4% 08 3. Forestry 0.4% 0.0% 09 4. Fishing, Hunting, & Trapping 0.5% 0.2% 20 excl. 208 5. Food & Kindred Products 6.8% 4.4% 21 and 208 6. Beverages & Tobacco Products 2.3% 2.0% 22 7. Textile Mill Products 3.3% 1.1% 23 8. Apparel & Other Textile Products 5.7% 1.8% 24 9. Lumber & Wood Products 4.2% 0.9% 25 10. Furniture & Fixtures 3.4% 1.1% 26 11. Paper & Allied Products 2.0% 1.8% 27 12. Printing & Publishing 3.3% 0.4% 28 13. Chemical & Allied Products 5.0% 17.4% 30 14. Rubber & Miscellaneous Plastics Products 6.2% 2.4% 31 15. Leather & Leather Products 2.1% 1.2% 32 16. Stone, Clay, & Glass Products 4.1% 1.5% 33 17. Primary Metal Industries 2.7% 4.7% 344 18. Fabricated Structural Metal Products 4.0% 3.7% 34 excl. 344 19. Other Fabricated Metal Products 7.0% 1.2% 354 and 355 20. Metalworking and Special Industry Machinery 5.8% 3.8% 356 21. General Industrial Machinery and Equipment 3.4% 4.4% 35 excl. 354 and 355
22. Other Industrial and Commercial Machinery and Computer Equipment 7.9% 14.6%
36 23. Electronic & Other Electric Equipment 7.1% 9.0% 37 24. Transportation Equipment 2.4% 13.9% 38 25. Instruments & Related Products 3.3% 5.3% 39 26. Miscellaneous Manufacturing Industries 3.3% 1.4%
Source: International Trade Statistics by Enterprises Characteristics (TEC) and ITC Trade Map.
Table A7. The NTM Survey process
Source: ITC methodology for NTM Surveys, 2010.
Steps
1 Business register compilation
2 Company selection based on sampling methodology
3 Telephone interviews by local partners covering:
• Company's experience with NTMs • Company-level information
4 Face-to-face interviews by local partners covering:
• Company’s trade information at product and partner level • Detailed information on the NTM-related trade obstacles for each product-partner pair
5 Survey data compilation and verification
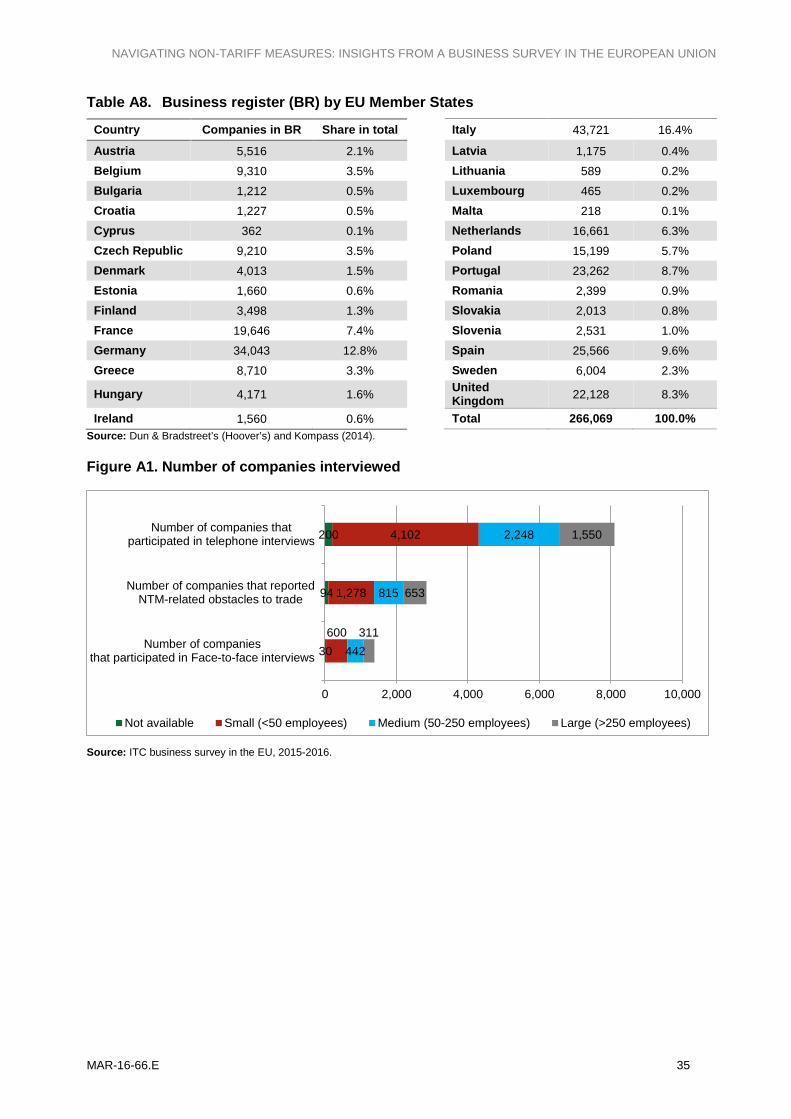
NAVIGATING NON-TARIFF MEASURES: INSIGHTS FROM A BUSINESS SURVEY IN THE EUROPEAN UNION
MAR-16-66.E 35
Table A8. Business register (BR) by EU Member States
Country Companies in BR Share in total Italy 43,721 16.4%
Austria 5,516 2.1% Latvia 1,175 0.4% Belgium 9,310 3.5% Lithuania 589 0.2% Bulgaria 1,212 0.5% Luxembourg 465 0.2% Croatia 1,227 0.5% Malta 218 0.1% Cyprus 362 0.1% Netherlands 16,661 6.3% Czech Republic 9,210 3.5% Poland 15,199 5.7% Denmark 4,013 1.5% Portugal 23,262 8.7% Estonia 1,660 0.6% Romania 2,399 0.9% Finland 3,498 1.3% Slovakia 2,013 0.8% France 19,646 7.4% Slovenia 2,531 1.0% Germany 34,043 12.8% Spain 25,566 9.6% Greece 8,710 3.3% Sweden 6,004 2.3%
Hungary 4,171 1.6% United Kingdom 22,128 8.3%
Ireland 1,560 0.6% Total 266,069 100.0% Source: Dun & Bradstreet’s (Hoover’s) and Kompass (2014).
Figure A1. Number of companies interviewed
Source: ITC business survey in the EU, 2015-2016.
30
94
200
600
1,278
4,102
442
815
2,248
311
653
1,550
0 2,000 4,000 6,000 8,000 10,000
Number of companiesthat participated in Face-to-face interviews
Number of companies that reportedNTM-related obstacles to trade
Number of companies thatparticipated in telephone interviews
Not available Small (<50 employees) Medium (50-250 employees) Large (>250 employees)

NAVIGATING NON-TARIFF MEASURES: INSIGHTS FROM A BUSINESS SURVEY IN THE EUROPEAN UNION
36 MAR-16-66.E
Figure A2. Characteristics of companies interviewed by telephone
Source: ITC business survey in the EU, 2015-2016.
Table A9. Sector composition of companies interviewed by telephone, by company size
Sector Small Medium Large Total
1. Agricultural Production - Crops 2.7% 2.1% 1.7% 2.3% 2. Agricultural Production - Livestock 1.0% 1.0% 0.5% 0.9% 3. Forestry 0.5% 0.3% 0.1% 0.4% 4. Fishing, Hunting, & Trapping 1.1% 1.6% 1.2% 1.3% 5. Food & Kindred Products 5.5% 7.8% 10.8% 7.2% 6. Beverages & Tobacco Products 4.1% 3.5% 4.0% 3.9% 7. Textile Mill Products 3.8% 4.4% 2.6% 3.7% 8. Apparel & Other Textile Products 4.8% 3.9% 4.2% 4.4% 9. Lumber & Wood Products 3.0% 2.9% 2.5% 2.9% 10. Furniture & Fixtures 3.6% 5.0% 2.8% 3.8% 11. Paper & Allied Products 2.9% 3.6% 4.4% 3.4% 12. Printing & Publishing 3.5% 3.1% 1.9% 3.1% 13. Chemical & Allied Products 6.2% 5.7% 7.2% 6.3% 14. Rubber & Miscellaneous Plastics Products 4.9% 5.3% 5.4% 5.2% 15. Leather & Leather Products 4.0% 2.4% 1.7% 3.1% 16. Stone, Clay, & Glass Products 3.9% 3.6% 4.5% 3.9% 17. Primary Metal Industries 3.7% 4.9% 6.5% 4.6% 18. Fabricated Structural Metal Products 2.5% 3.6% 3.2% 2.9% 19. Other Fabricated Metal Products 5.3% 5.4% 4.9% 5.3% 20. Metalworking and Special Industry Machinery 5.2% 4.4% 3.8% 4.7% 21. General Industrial Machinery and Equipment 3.6% 4.0% 3.6% 3.7% 22. Other Industrial and Commercial Machinery, and Computer Equipment 6.8% 5.2% 8.1% 6.6%
23. Electronic & Other Electric Equipment 6.3% 6.2% 5.9% 6.1% 24. Transportation Equipment 2.6% 2.5% 2.6% 2.6% 25. Instruments & Related Products 4.6% 4.3% 4.1% 4.4% 26. Miscellaneous Manufacturing Industries 4.1% 3.3% 1.8% 3.4%
Source: ITC business survey in the EU, 2015-2016.

NAVIGATING NON-TARIFF MEASURES: INSIGHTS FROM A BUSINESS SURVEY IN THE EUROPEAN UNION
MAR-16-66.E 37
Table A10. Destination markets of companies interviewed by telephone, by company size
Destination Small Medium Large Total
United States 42% 51% 64% 49% Canada 22% 28% 42% 28% Latin America 28% 34% 48% 34% Japan 22% 27% 40% 27% China 28% 38% 52% 36% Other Asia 36% 46% 57% 43% Africa 35% 36% 52% 39% Middle East 35% 41% 53% 41% Russian Federation 28% 39% 48% 35% Other Eastern Europe 26% 36% 44% 32% Other partners 36% 42% 43% 39%
Source: ITC business survey in the EU, 2015-2016.
Figure A3. Characteristics of companies interviewed face-to-face
Source: ITC business survey in the EU, 2015-2016.
Table A11. Sector composition of companies interviewed in face-to-face
Sector Small Medium Large Total
1. Agricultural Production - Crops 2.8% 1.6% 3.5% 2.5% 2. Agricultural Production - Livestock 1.3% 1.1% 0.6% 1.1% 3. Forestry 0.5% 0.0% 0.0% 0.3% 4. Fishing, Hunting, & Trapping 1.7% 2.9% 2.9% 2.4% 5. Food & Kindred Products 9.0% 13.3% 15.8% 11.9% 6. Beverages & Tobacco Products 4.5% 5.2% 7.4% 5.4% 7. Textile Mill Products 3.5% 2.9% 2.6% 3.1% 8. Apparel & Other Textile Products 4.0% 3.6% 3.5% 3.8% 9. Lumber & Wood Products 2.8% 2.7% 0.0% 2.2% 10. Furniture & Fixtures 4.5% 3.6% 1.0% 3.3% 11. Paper & Allied Products 2.8% 2.7% 1.9% 2.5% 12. Printing & Publishing 2.7% 3.2% 1.9% 2.7% 13. Chemical & Allied Products 8.7% 7.7% 7.4% 8.1% 14. Rubber & Miscellaneous Plastics Products 3.7% 3.8% 3.5% 3.8% 15. Leather & Leather Products 5.8% 2.7% 1.0% 3.6% 16. Stone, Clay, & Glass Products 2.8% 2.7% 4.5% 3.3%

NAVIGATING NON-TARIFF MEASURES: INSIGHTS FROM A BUSINESS SURVEY IN THE EUROPEAN UNION
38 MAR-16-66.E
17. Primary Metal Industries 3.2% 4.3% 6.1% 4.1% 18. Fabricated Structural Metal Products 2.0% 3.2% 1.3% 2.2% 19. Other Fabricated Metal Products 3.8% 4.5% 4.8% 4.5% 20. Metalworking and Special Industry Machinery 4.5% 4.8% 3.5% 4.4% 21. General Industrial Machinery and Equipment 2.8% 5.9% 3.2% 4.0% 22. Other Industrial and Commercial Machinery, and Computer Equipment 5.8% 4.3% 10.0% 6.1%
23. Electronic & Other Electric Equipment 6.0% 4.5% 4.8% 5.1% 24. Transportation Equipment 2.2% 1.8% 2.3% 2.0% 25. Instruments & Related Products 4.7% 4.1% 5.8% 4.6% 26. Miscellaneous Manufacturing Industries 3.8% 2.7% 0.6% 2.7%
Source: ITC business survey in the EU, 2015-2016.

NAVIGATING NON-TARIFF MEASURES: INSIGHTS FROM A BUSINESS SURVEY IN THE EUROPEAN UNION
MAR-16-66.E 39
Table A12. Destination markets of companies interviewed face-to-face, by company size
Destination Small Medium Large Total
United States 43% 50% 56% 48% Canada 16% 20% 29% 20% Latin America 28% 34% 44% 34% Japan 23% 24% 30% 25% China 30% 40% 47% 37% Other Asia 45% 51% 57% 50% Africa 33% 33% 49% 37% Middle East 35% 39% 47% 39% Russian Federation 29% 44% 42% 37% Other Eastern Europe 16% 24% 24% 21% Other partners 39% 43% 44% 41%
Source: ITC business survey in the EU, 2015-2016.
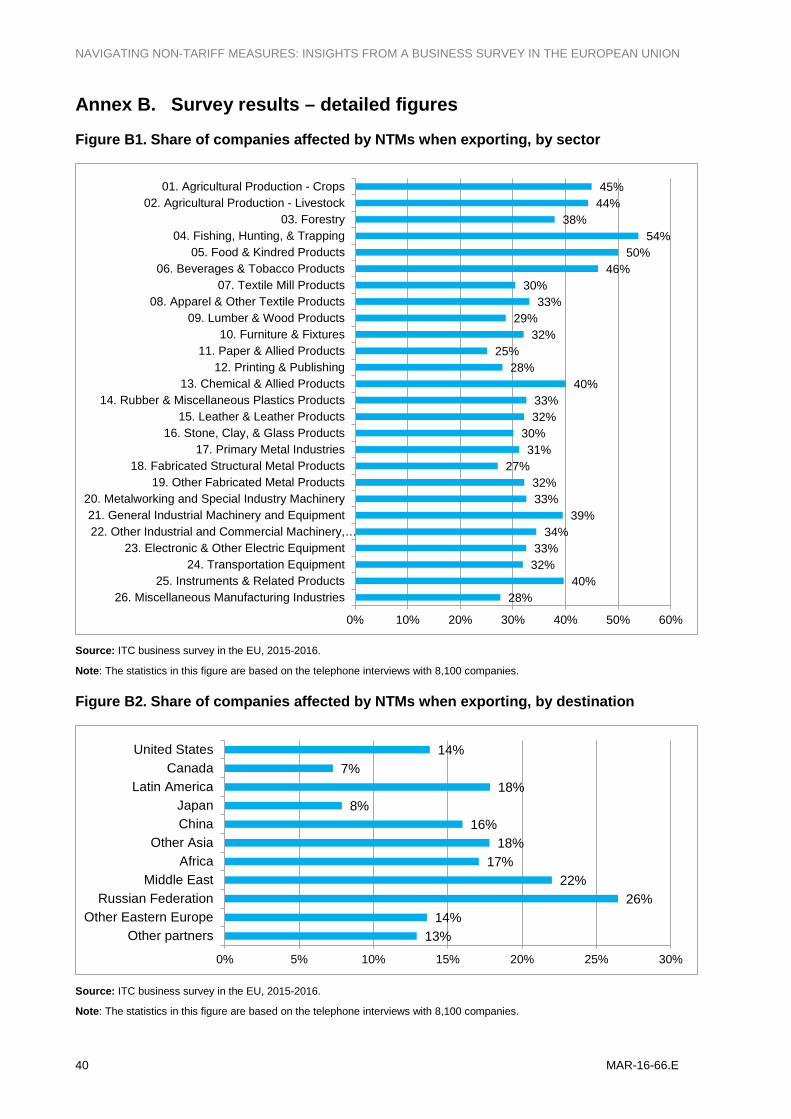
NAVIGATING NON-TARIFF MEASURES: INSIGHTS FROM A BUSINESS SURVEY IN THE EUROPEAN UNION
40 MAR-16-66.E
Annex B. Survey results – detailed figures
Figure B1. Share of companies affected by NTMs when exporting, by sector
Source: ITC business survey in the EU, 2015-2016.
Note: The statistics in this figure are based on the telephone interviews with 8,100 companies.
Figure B2. Share of companies affected by NTMs when exporting, by destination
Source: ITC business survey in the EU, 2015-2016.
Note: The statistics in this figure are based on the telephone interviews with 8,100 companies.
28% 40%
32% 33%
34% 39%
33% 32%
27% 31%
30% 32% 33%
40% 28%
25% 32%
29% 33%
30% 46%
50% 54%
38% 44% 45%
0% 10% 20% 30% 40% 50% 60%
26. Miscellaneous Manufacturing Industries25. Instruments & Related Products
24. Transportation Equipment23. Electronic & Other Electric Equipment
22. Other Industrial and Commercial Machinery,…21. General Industrial Machinery and Equipment
20. Metalworking and Special Industry Machinery19. Other Fabricated Metal Products
18. Fabricated Structural Metal Products17. Primary Metal Industries
16. Stone, Clay, & Glass Products15. Leather & Leather Products
14. Rubber & Miscellaneous Plastics Products13. Chemical & Allied Products
12. Printing & Publishing11. Paper & Allied Products
10. Furniture & Fixtures09. Lumber & Wood Products
08. Apparel & Other Textile Products07. Textile Mill Products
06. Beverages & Tobacco Products05. Food & Kindred Products
04. Fishing, Hunting, & Trapping03. Forestry
02. Agricultural Production - Livestock01. Agricultural Production - Crops
13% 14%
26% 22%
17% 18%
16% 8%
18% 7%
14%
0% 5% 10% 15% 20% 25% 30%
Other partnersOther Eastern Europe
Russian FederationMiddle East
AfricaOther Asia
ChinaJapan
Latin AmericaCanada
United States

NAVIGATING NON-TARIFF MEASURES: INSIGHTS FROM A BUSINESS SURVEY IN THE EUROPEAN UNION
MAR-16-66.E 41
Table B1. Face-to-face interviews – share of transaction* facing burdensome NTMs by destination
Number of transaction*
for which there is a burdensome regulation
Number of transaction* for which there is
NO burdensome regulation
Share of transaction* for which there is a burdensome
regulation Russian Federation 609 287 68.00% United States of America 455 570 44.40% China 356 392 47.60% Saudi Arabia 235 100 70.10% United Arab Emirates 227 198 53.40% Brazil 217 152 58.80% Switzerland 214 298 41.80% Turkey 190 126 60.10% Ukraine 149 133 52.80% Iran (Islamic Republic) 146 34 81.10% Japan 139 392 26.20% Egypt 134 92 59.30% Belarus 125 60 67.60% Canada 125 283 30.60% India 121 118 50.60% Qatar 108 47 69.70% Australia 101 233 30.20% Mexico 98 114 46.20% Republic of Korea 94 92 50.50% Nigeria 91 52 63.60% Kazakhstan 89 60 59.70% Algeria 84 55 60.40% Norway 84 210 28.60% Israel 74 89 45.40% Argentina 70 54 56.50% Morocco 69 81 46.00% South Africa 67 129 34.20% Serbia 57 81 41.30% Iraq 56 19 74.70% Tunisia 51 61 45.50% Kuwait 49 56 46.70% Kenya 44 14 75.90% Viet Nam 42 39 51.90% Chinese Taipei 41 59 41.00% Chile 39 62 38.60% Thailand 39 99 28.30% Indonesia 38 39 49.40% Libyan Arab Jamahir 38 13 74.50% Singapore 36 97 27.10% Oman 34 9 79.10% Colombia 33 56 37.10% Azerbaijan 32 34 48.50% Venezuela 32 18 64.00% Malaysia 30 65 31.60% Albania 29 18 61.70% Hong Kong, China 29 70 29.30% Lebanon 28 65 30.10% Uzbekistan 27 12 69.20% Jordan 26 29 47.30% Angola 26 12 68.40% Pakistan 25 38 39.70% New Zealand 23 58 28.40% Bosnia and Herzegovina 21 55 27.60% Ghana 21 22 48.80%

NAVIGATING NON-TARIFF MEASURES: INSIGHTS FROM A BUSINESS SURVEY IN THE EUROPEAN UNION
42 MAR-16-66.E
Armenia 18 14 56.30% Ecuador 18 22 45.00% Syrian Arab Republic 18 5 78.30% Peru 16 38 29.60% Philippines 16 35 31.40% Bahrain 15 8 65.20% Montenegro 14 7 66.70% The former Yugoslav Republic of Macedonia
14 37 27.5%
United Republic of Tanzania 14 6 70.00% Cameroon 13 4 76.50% Dominican Republic 13 19 40.60% Georgia 11 17 39.30% Myanmar 11 4 73.30% Yemen 11 5 68.80% State of Palestine 10 2 83.30% Congo 9 15 37.50% Costa Rica 9 13 40.90% Cuba 9 6 60.00% Mauritius 9 12 42.90% Mozambique 9 21 30.00% Panama 9 13 40.90% Côte D'Ivoire 8 11 42.10% Ethiopia 8 12 40.00% Republic of Moldova 8 16 33.30% Turkmenistan 8 1 88.90% Zimbabwe 8 9 47.10% Iceland 7 29 19.40% Senegal 7 12 36.80% Gabon 6 10 37.50% Sudan 6 6 50.00% Bangladesh 5 6 45.50% Barbados 5 2 71.40% Cayman Islands 5 1 83.30% Nicaragua 5 3 62.50% Uganda 5 4 55.60% Liberia 4 1 80.00% Mali 4 3 57.10% Uruguay 4 22 15.40% Afghanistan 3 0 100.00% Bolivia 3 6 33.30% Burkina Faso 3 1 75.00% Guatemala 3 4 42.90% Kosovo 3 19 13.60% Sri Lanka 3 4 42.90% Togo 3 2 60.00% Cape Verde 2 9 18.20% Democratic People's Republic of Korea 2 2 50.00% Democratic Republic of the Congo 2 1 66.70% Guinea 2 3 40.00% Lao People's Democratic Republic 2 0 100.00% Nepal 2 1 66.70% Papua New Guinea 2 0 100.00% Puerto Rico 2 8 20.00% Sao Tome and Principe 2 3 40.00% Sierra Leone 2 1 66.70% Aruba 1 0 100.00% Benin 1 3 25.00% Chad 1 10 9.10% Equatorial Guinea 1 1 50.00% Gambia 1 2 33.30% Guinea-Bissau 1 13 7.10%

NAVIGATING NON-TARIFF MEASURES: INSIGHTS FROM A BUSINESS SURVEY IN THE EUROPEAN UNION
MAR-16-66.E 43
Honduras 1 12 7.70% Jamaica 1 4 20.00% Kyrgyzstan 1 18 5.30% Madagascar 1 5 16.70% Maldives 1 5 16.70% Niger 1 8 11.10% Seychelles 1 2 33.30% Somalia 1 1 50.00% Suriname 1 1 50.00% Tajikistan 1 0 100.00% Timor-Leste 1 0 100.00% Botswana 0 2 0.00% Cambodia 0 2 0.00% Central African Republic 0 2 0.00% Djibouti 0 3 0.00% El Salvador 0 5 0.00% Eritrea 0 2 0.00% Fiji 0 1 0.00% French Polynesia 0 1 0.00% Grenada 0 1 0.00% Guyana 0 2 0.00% Liechtenstein 0 1 0.00% Macao, China 0 13 0.00% Mauritania 0 7 0.00% Mongolia 0 3 0.00% Namibia 0 2 0.00% Netherland Antilles 0 2 0.00% New Caledonia 0 1 0.00% Paraguay 0 11 0.00% Saint Lucia 0 1 0.00% Swaziland 0 1 0.00% Zambia 0 8 0.00% Total 5,844 6,322 48.00% Source: ITC business survey in the EU, 2015-2016.
Notes: (*) A transaction is a pair of exported product (at HS6 level) and partner country for a company. The share of companies affected by burdensome NTMs is based on telephone interviews while the share of affected companies’ transaction is based on face-to-face interviews

NAVIGATING NON-TARIFF MEASURES: INSIGHTS FROM A BUSINESS SURVEY IN THE EUROPEAN UNION
44 MAR-16-66.E
Table B2. Product certification issues by sector and company size Micro Small Medium-
sized Large Total Sectoral
distribution 01. Agricultural Production - Crops 4 14 4 37 59 4.0% 02. Agricultural Production - Livestock 0 10 9 1 20 1.4% 03. Forestry 0 7 0 0 7 0.5% 04. Fishing, Hunting, & Trapping 0 13 14 8 35 2.4% 05. Food & Kindred Products 28 42 101 139 310 20.9% 06. Beverages & Tobacco Products 14 11 22 13 60 4.1% 07. Textile Mill Products 9 1 5 5 20 1.4% 08. Apparel & Other Textile Products 7 5 5 86 103 7.0% 09. Lumber & Wood Products 10 3 35 0 48 3.2% 10. Furniture & Fixtures 10 6 35 4 55 3.7% 11. Paper & Allied Products 25 3 5 1 34 2.3% 12. Printing & Publishing 2 1 3 0 6 0.4% 13. Chemical & Allied Products 2 23 48 46 119 8.0% 14. Rubber & Miscellaneous Plastics Products 6 11 20 3 40 2.7% 15. Leather & Leather Products 18 35 14 42 109 7.4% 16. Stone, Clay, & Glass Products 1 3 15 5 24 1.6% 17. Primary Metal Industries 0 4 16 4 24 1.6% 18. Fabricated Structural Metal Products 3 2 27 0 32 2.2% 19. Other Fabricated Metal Products 6 8 47 8 69 4.7% 20. Metalworking and Special Industry Machinery
6 8 19 9 42 2.8%
21. General Industrial Machinery and Equipment 4 22 24 17 67 4.5% 22. Other Industrial and Commercial Machinery, and Computer Equipment
0 11 7 16 34 2.3%
23. Electronic & Other Electric Equipment 8 38 27 14 87 5.9% 24. Transportation Equipment 0 5 7 2 14 0.9% 25. Instruments & Related Products 8 16 17 11 52 3.5% 26. Miscellaneous Manufacturing Industries 1 1 8 1 11 0.7% Total 172 303 534 472 1,481 100.0% Distribution by size of the companies 11.6% 20.5% 36.1% 31.9% 100.0%
Source: ITC business survey in the EU, 2015-2016.

NAVIGATING NON-TARIFF MEASURES: INSIGHTS FROM A BUSINESS SURVEY IN THE EUROPEAN UNION
MAR-16-66.E 45
Table B3. Labelling issues by sector and size class Micro Small Medium-
sized Large Total Sectoral
distribution
01. Agricultural Production - Crops 1 0 0 0 1 0.3% 02. Agricultural Production - Livestock 0 0 0 0 0 0.0% 03. Forestry 0 0 0 0 0 0.0% 04. Fishing, Hunting, & Trapping 0 1 2 1 4 1.1% 05. Food & Kindred Products 3 7 27 31 68 18.0% 06. Beverages & Tobacco Products 2 7 23 50 82 21.8% 07. Textile Mill Products 0 7 1 0 8 2.1% 08. Apparel & Other Textile Products 1 0 4 2 7 1.9% 09. Lumber & Wood Products 1 0 0 0 1 0.3% 10. Furniture & Fixtures 10 0 0 0 10 2.7% 11. Paper & Allied Products 0 7 0 5 12 3.2% 12. Printing & Publishing 0 2 0 0 2 0.5% 13. Chemical & Allied Products 3 55 1 2 61 16.2% 14. Rubber & Miscellaneous Plastics Products
2 6 3 2 13 3.4%
15. Leather & Leather Products 1 2 2 0 5 1.3% 16. Stone, Clay, & Glass Products 0 0 1 4 5 1.3% 17. Primary Metal Industries 0 1 1 0 2 0.5% 18. Fabricated Structural Metal Products 0.0% 19. Other Fabricated Metal Products 2 1 0 7 10 2.7% 20. Metalworking and Special Industry Machinery
8 0 2 1 11 2.9%
21. General Industrial Machinery and Equipment
4 0 0 19 23 6.1%
22. Other Industrial and Commercial Machinery, and Computer Equipment
0 4 0 0 4 1.1%
23. Electronic & Other Electric Equipment 2 6 2 1 11 2.9% 24. Transportation Equipment 0 1 0 0 1 0.3% 25. Instruments & Related Products 12 10 3 4 29 7.7% 26. Miscellaneous Manufacturing Industries 1 2 4 0 7 1.9% Total 53 119 76 129 377 100.0% Distribution by size of the companies 14.1% 31.6% 20.2% 34.2% 100.0%
Source: ITC business survey in the EU, 2015-2016.
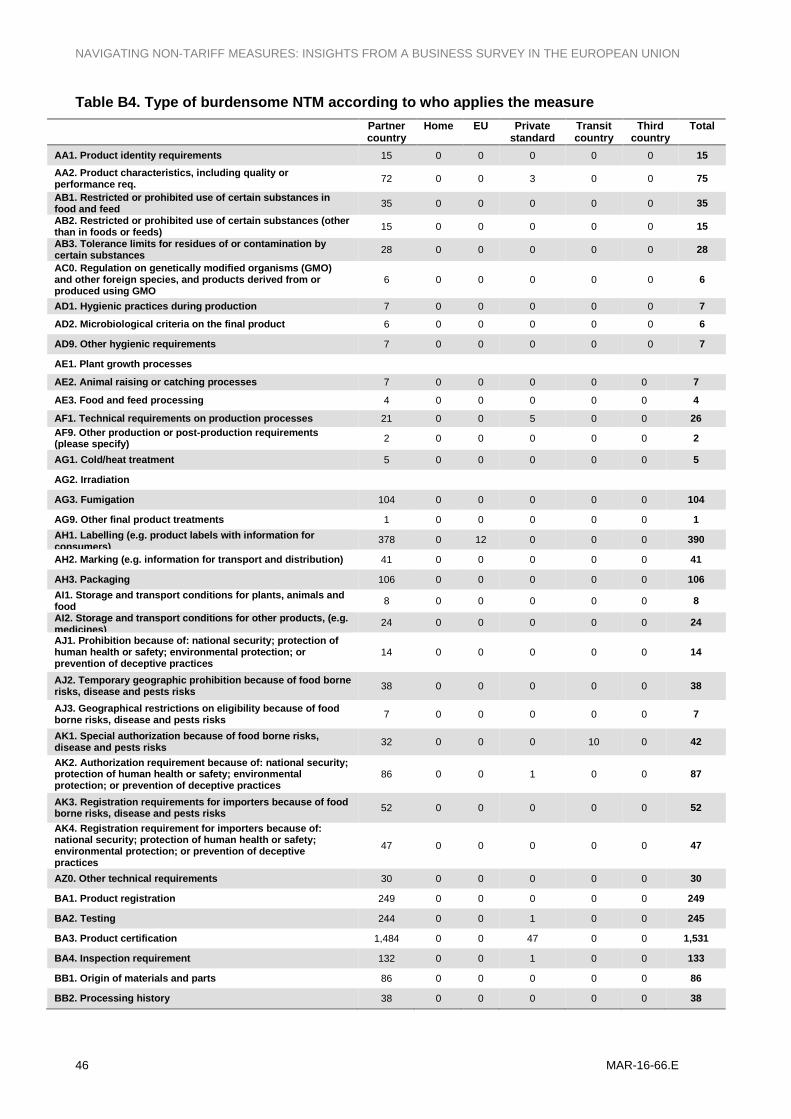
NAVIGATING NON-TARIFF MEASURES: INSIGHTS FROM A BUSINESS SURVEY IN THE EUROPEAN UNION
46 MAR-16-66.E
Table B4. Type of burdensome NTM according to who applies the measure Partner
country Home EU Private
standard Transit country
Third country
Total
AA1. Product identity requirements 15 0 0 0 0 0 15 AA2. Product characteristics, including quality or performance req. 72 0 0 3 0 0 75
AB1. Restricted or prohibited use of certain substances in food and feed 35 0 0 0 0 0 35 AB2. Restricted or prohibited use of certain substances (other than in foods or feeds) 15 0 0 0 0 0 15 AB3. Tolerance limits for residues of or contamination by certain substances 28 0 0 0 0 0 28
AC0. Regulation on genetically modified organisms (GMO) and other foreign species, and products derived from or produced using GMO
6 0 0 0 0 0 6
AD1. Hygienic practices during production 7 0 0 0 0 0 7
AD2. Microbiological criteria on the final product 6 0 0 0 0 0 6
AD9. Other hygienic requirements 7 0 0 0 0 0 7
AE1. Plant growth processes
AE2. Animal raising or catching processes 7 0 0 0 0 0 7
AE3. Food and feed processing 4 0 0 0 0 0 4
AF1. Technical requirements on production processes 21 0 0 5 0 0 26 AF9. Other production or post-production requirements (please specify) 2 0 0 0 0 0 2
AG1. Cold/heat treatment 5 0 0 0 0 0 5
AG2. Irradiation
AG3. Fumigation 104 0 0 0 0 0 104
AG9. Other final product treatments 1 0 0 0 0 0 1 AH1. Labelling (e.g. product labels with information for consumers)
378 0 12 0 0 0 390
AH2. Marking (e.g. information for transport and distribution) 41 0 0 0 0 0 41
AH3. Packaging 106 0 0 0 0 0 106 AI1. Storage and transport conditions for plants, animals and food 8 0 0 0 0 0 8 AI2. Storage and transport conditions for other products, (e.g. medicines)
24 0 0 0 0 0 24
AJ1. Prohibition because of: national security; protection of human health or safety; environmental protection; or prevention of deceptive practices
14 0 0 0 0 0 14
AJ2. Temporary geographic prohibition because of food borne risks, disease and pests risks 38 0 0 0 0 0 38
AJ3. Geographical restrictions on eligibility because of food borne risks, disease and pests risks 7 0 0 0 0 0 7
AK1. Special authorization because of food borne risks, disease and pests risks 32 0 0 0 10 0 42
AK2. Authorization requirement because of: national security; protection of human health or safety; environmental protection; or prevention of deceptive practices
86 0 0 1 0 0 87
AK3. Registration requirements for importers because of food borne risks, disease and pests risks 52 0 0 0 0 0 52
AK4. Registration requirement for importers because of: national security; protection of human health or safety; environmental protection; or prevention of deceptive practices
47 0 0 0 0 0 47
AZ0. Other technical requirements 30 0 0 0 0 0 30
BA1. Product registration 249 0 0 0 0 0 249
BA2. Testing 244 0 0 1 0 0 245
BA3. Product certification 1,484 0 0 47 0 0 1,531
BA4. Inspection requirement 132 0 0 1 0 0 133
BB1. Origin of materials and parts 86 0 0 0 0 0 86
BB2. Processing history 38 0 0 0 0 0 38

NAVIGATING NON-TARIFF MEASURES: INSIGHTS FROM A BUSINESS SURVEY IN THE EUROPEAN UNION
MAR-16-66.E 47
BB3. Distribution and location of products after delivery 4 0 0 0 0 0 4
BB9. Other traceability requirements (please specify) 2 0 0 1 0 0 3
BC0. Quarantine 20 0 0 0 0 0 20
BZ0. Other conformity assessment 5 0 0 0 0 0 5
CA0. Pre-shipment inspection 222 0 0 0 0 0 222
CB0. Direct consignment requirement
CC0. Requirement to pass through specified port of customs 11 0 0 0 0 0 11 CD0. Import monitoring and surveillance requirements and other automatic licensing measures
30 0 0 0 0 0 30 CZ0. Other pre-shipment inspection and other entry formalities 317 0 0 2 0 0 319
DA1. Anti-dumping duties 22 0 0 0 0 0 22
DA9. Other anti-dumping measures (please specify) 1 0 0 0 0 0 1
DB1. Countervailing duties
DC1. Safeguard duties 10 0 0 0 0 0 10
DC2. Safeguard quantitative restriction 2 0 0 0 0 0 2
DC9. Other safeguard measures 5 0 0 0 0 0 5
DZ0. Other trade remedies 1 0 0 0 0 0 1
EA1. Licence for economic reasons 43 0 0 0 0 0 43
EA2. Licence for non-economic reasons 16 0 0 0 0 0 16
EA9. Other (non-automatic) licences 33 0 0 0 1 0 34
EB1. Permanent quotas 15 0 0 0 0 0 15
EB2. Seasonal or temporary quotas 3 0 0 0 0 0 3
EB3. Tariff rate quotas 13 0 0 0 0 0 13
EB9. Other quotas 1 0 0 0 0 0 1
EC1. Total prohibition (not for technical reasons) 69 0 0 0 13 0 82
EC2. Seasonal or temporary prohibition 1 0 0 0 0 0 1
EC9. Other prohibitions 3 0 0 0 0 0 3
EZ0. Other quantity control measures 4 0 0 0 0 0 4
FA1. Reference prices and other price controls 1 0 0 0 0 0 1
FD0. Customs surcharges 87 0 0 0 0 0 87
FE1. Custom inspection, processing and servicing fees 2 0 0 0 0 0 2
FE2. Merchandise handling or storing fees 1 0 0 0 0 0 1
FF1. Stamp tax 1 0 0 0 0 0 1
FF2. Import licence fee 2 0 0 0 0 0 2
FF3. Consular invoice fee 20 0 0 0 0 0 20
FF5. Tax on transport facilities 3 0 0 0 0 0 3
FF9. Other additional taxes and charges 8 0 0 0 0 0 8
FG0. Internal taxes and charges levied on imports 51 0 0 0 0 0 51
FH0. Customs valuations 15 0 0 0 0 0 15
FZ0. Other charges, taxes and price control measures 2 0 0 0 0 0 2
GA1.Advance import deposit 4 0 0 0 0 0 4
GA9.Other advance payment requirements 2 0 0 0 0 0 2
GC1. Bank authorization 3 0 0 0 0 0 3 GC9. Other regulations on official foreign exchange allocation specify)
5 0 0 0 0 0 5
GD0. Regulations concerning terms of payment for imports 73 0 0 3 0 0 76
GZ0. Other finance measures 13 0 0 0 0 0 13
HA0. Restrictive import channel 12 0 0 0 0 0 12

NAVIGATING NON-TARIFF MEASURES: INSIGHTS FROM A BUSINESS SURVEY IN THE EUROPEAN UNION
48 MAR-16-66.E
HB0. Compulsory use of a national service (e.g. transport or insurance) 15 0 0 0 0 0 15
HZ0. Other anti-competitive measure 6 0 0 0 0 0 6
IA0. Trade balancing measures 3 0 0 0 0 0 3
IZ0. Other trade-related investment measures (please specify) 7 0 0 0 0 0 7
JA0. Geographical restriction 1 0 0 0 0 0 1
JB0. Restriction on resellers 21 0 0 0 0 0 21
JZ0. Other distribution restrictions 2 0 0 0 0 0 2
KA0. Restriction of post-sales services 12 0 0 0 0 0 12
LA0. Subsidies 1 0 0 0 0 0 1
MA0. Government procurement restrictions 29 0 0 0 0 0 29
NA0. Intellectual property 13 0 0 0 0 0 13
OA0. Rules of origin and related certificate of origin 1,174 0 0 0 0 0 1,174
PA1. Export inspection 0 45 11 0 0 0 56
PA2. Certification required by the exporting country 0 64 93 0 0 0 157
PA9. Other export technical measures 0 42 15 0 0 0 57
PB1. Export prohibitions 0 27 90 0 0 0 117
PB2. Export quotas
PB3. Licensing or permit to export 0 276 310 0 0 2 588
PB4. Export registration 0 7 118 0 0 0 125
PC0. Export taxes and charges 0 0 1 0 0 0 1
PD0. Export price control measures 0 0 1 0 0 0 1
PE0. Measures on re-export 0 2 4 0 0 0 6
PZ0. Other export related measures 0 130 53 0 0 0 183
Total 5,873 593 708 64 24 2 7,264
Share of total 80.9% 8.2% 9.7% 0.9% 0.3% 0.0% 100.0%
Source: ITC business survey in the EU, 2015-2016.
Figure B3. Type of burdensome NTM by company size
Source: ITC business survey in the EU, 2015-2016.
0% 20% 40% 60% 80% 100%
Large
Medium
Small
Micro
A. Techinical requirementsB. Conformity AssessmentC. Pre-shipment inspections andother entry formalitiesD. Trade remediesE. Quantity Control measuresF. Charge, taxes and price control measuresG. Finance measuresH. Anti-competitive measuresI. Trade related investment measuresJ. Distribution restrictionsK. Restrictions on post-sales servicesL. SubsidiesM. Government Procurement RestrictionsN. Intellectual propertyO. Rules of Origin and related certificates of OriginP. Export related measures

NAVIGATING NON-TARIFF MEASURES: INSIGHTS FROM A BUSINESS SURVEY IN THE EUROPEAN UNION
MAR-16-66.E 49
Figure B4. Type of burdensome NTM by destination market
Source: ITC business survey in the EU, 2015-2016.
Table B5. Burdensome NTMs by type of measure
Regulatory obstacles
Procedural obstacles
Combination of regulatory
and procedural obstacles
Total
A. Technical requirements 404 418 407 1229
B. Conformity assessment 187 1144 983 2314
C. Pre-shipment inspections and other entry formalities 67 330 185 582
D. Trade remedies 17 10 14 41
E. Quantity control measures 115 58 42 215
F. Charge, taxes and price control measures 104 33 56 193
G. Finance measures 63 22 18 103
H. Anti-competitive measures 10 18 5 33
I. Trade-related investment measures 9 0 1 10
J. Distribution restrictions 5 8 11 24
K. Restrictions on post-sales services 12 0 0 12
L. Subsidies 1 0 0 1
M. Government procurement restrictions 23 1 5 29
N. Intellectual property 2 11 0 13
Oa. Preferential rules of origin and related certificates of origin 38 319 223 580
Ob. Non-preferential rules of origin and related certificates of origin 51 311 232 594
P. Export-related measures 327 455 509 1291
Total 1435 3138 2691 7264
19.7% 43.2% 37.1% 100%
Source: ITC business survey in the EU, 2015-2016.
0% 20% 40% 60% 80% 100%
Developedeconomies
Developingeconomies
A. Techinical requirementsB. Conformity AssessmentC. Pre-shipment inspections andother entry formalitiesD. Trade remediesE. Quantity Control measuresF. Charge, taxes and price control measuresG. Finance measuresH. Anti-competitive measuresI. Trade related investment measuresJ. Distribution restrictionsK. Restrictions on post-sales servicesL. SubsidiesM. Government Procurement RestrictionsN. Intellectual propertyO. Rules of Origin and related certificates of OriginP. Export related measures

NA
VIG
ATI
NG
NO
N-T
AR
IFF
ME
AS
UR
ES
: IN
SIG
HTS
FR
OM
A B
US
INE
SS
SU
RV
EY
IN T
HE
EU
RO
PE
AN
UN
ION
MA
R-1
6-66
.E
50
Tabl
e B
6. P
roce
dura
l obs
tacl
es b
y ty
pe a
nd N
TM c
hapt
er
NTM
cha
pter
s
A
B
C
D
E
F
G
H
I J
M
N
Oa
Ob
P
Tota
l
Adm
inis
trat
ive
burd
ens
rela
ted
to re
gula
tions
A1.
Lar
ge n
umbe
r of d
iffer
ent d
ocum
ents
75
37
6 65
6
5 1
10
2 1
0 7
10
159
322
67
1106
A
2. D
ocum
enta
tion
is d
iffic
ult t
o fil
l out
26
70
29
5
0 3
0 1
0 0
5 2
91
123
11
366
A3.
Diff
icul
ties
with
tran
slat
ion
of
docu
men
ts fr
om o
r int
o ot
her l
angu
ages
66
56
12
0
1 1
0 1
0 0
2 1
4 46
52
24
2
A4.
Num
erou
s ad
min
istra
tive
win
dow
s/or
gani
zatio
ns in
volv
ed, r
edun
dant
do
cum
ents
36
13
5 14
1
14
4 3
0 0
2 13
20
48
16
6 42
49
8
Info
rmat
ion/
tr
ansp
aren
cy is
sues
B1.
Info
rmat
ion
on s
elec
ted
regu
latio
n is
not
ad
equa
tely
pub
lishe
d an
d di
ssem
inat
ed
89
190
36
12
9 7
2 5
1 0
8 20
64
24
8 30
72
1
B2.
No
due
notic
e fo
r cha
nges
in s
elec
ted
regu
latio
n an
d re
late
d pr
oced
ures
21
29
19
1
7 2
0 0
0 0
2 0
3 50
16
15
0
B3.
Sel
ecte
d re
gula
tion
chan
ges
frequ
ently
46
49
5
3 6
4 0
0 0
0 0
13
19
71
3 21
9 B
4. R
equi
rem
ents
and
pro
cess
es d
iffer
fro
m in
form
atio
n pu
blis
hed
14
27
7
3 0
0 0
0 0
0 36
27
7
83
1 20
5
Dis
crim
inat
ing
beha
viou
r of
offic
ials
C1.
Arb
itrar
y be
havi
our o
f offi
cial
s re
gard
ing
clas
sific
atio
n an
d va
luat
ion
of th
e re
porte
d pr
oduc
t 3
11
15
0 0
8 0
0 0
0 1
2 2
14
0 56
C2.
Arb
itrar
y be
havi
our o
f offi
cial
s w
ith
rega
rds
to th
e re
porte
d re
gula
tion
40
60
27
4 3
1 3
1 0
0 18
20
6
101
11
295
Tim
e co
nstr
aint
s D
1. D
elay
rela
ted
to re
porte
d re
gula
tion
306
1109
32
8 11
47
9
18
7 1
0 92
92
38
1 10
85
589
4075
D
2. D
eadl
ines
set
for c
ompl
etio
n of
re
quire
men
ts a
re to
o sh
ort
4 4
0 0
1 0
0 0
0 0
0 0
3 6
5 23
Unu
sual
ly h
igh
paym
ent
E1.
Unu
sual
ly h
igh
fees
and
cha
rges
for
repo
rted
certi
ficat
e/re
gula
tion
222
865
93
28
31
46
12
9 0
16
38
67
173
638
107
2345
E2.
Info
rmal
pay
men
t, e.
g. b
ribes
for
repo
rted
certi
ficat
e/re
gula
tion
9 24
31
2
0 4
4 1
0 2
5 2
4 62
2
152
Lack
of s
ecto
r-sp
ecifi
c fa
cilit
ies
F1. L
imite
d/in
appr
opria
te fa
cilit
ies
for
test
ing
2 36
0
0 0
0 0
0 0
0 0
0 0
14
0 52
F2. L
imite
d/in
appr
opria
te fa
cilit
ies
for
sect
or-s
peci
fic tr
ansp
ort a
nd s
tora
ge, e
.g.
cold
sto
rage
, ref
riger
ated
truc
ks
2 3
0 0
0 0
0 2
0 0
0 0
2 3
0 12
F3. O
ther
lim
ited/
inap
prop
riate
faci
litie
s,
rela
ted
to re
porte
d ce
rtific
ate/
regu
latio
n 11
17
3 4
1 0
15
0 2
0 0
9 6
21
207
5 45
4

NA
VIG
ATI
NG
NO
N-T
AR
IFF
ME
AS
UR
ES
: IN
SIG
HTS
FR
OM
A B
US
INE
SS
SU
RV
EY
IN T
HE
EU
RO
PE
AN
UN
ION
51
NTM
cha
pter
s
A
B
C
D
E
F
G
H
I J
M
N
Oa
Ob
P
Tota
l
Lack
of r
ecog
nitio
n/
accr
edita
tions
G1.
Fac
ilitie
s la
ckin
g in
tern
atio
nal
accr
edita
tion/
reco
gniti
on
1 18
0
0 0
0 0
0 0
0 0
0 0
17
0 36
G2.
Oth
er p
robl
ems
with
inte
rnat
iona
l re
cogn
ition
, e.g
. lac
k of
reco
gniti
on o
f na
tiona
l cer
tific
ates
17
14
9 2
0 0
0 0
0 0
0 0
3 2
65
0 23
8
Oth
er
H1.
Oth
er p
roce
dura
l obs
tacl
es, p
leas
e sp
ecify
95
29
16
1
0 2
1 1
0 0
1 0
7 36
23
21
2
Tota
l 10
85
3413
70
3 78
12
4 10
7 53
32
3
20
237
285
996
3357
96
4 11
457
Sour
ce: I
TC b
usin
ess
surv
ey in
the
EU
, 201
5-20
16.
Not
es: N
TM C
hapt
ers
are:
A =
Tec
hnic
al re
quire
men
ts; B
= C
onfo
rmity
ass
essm
ent;
C=
Pre
-shi
pmen
t ins
pect
ions
and
oth
er e
ntry
form
aliti
es; D
= Tr
ade
rem
edie
s; E
= Q
uant
ity C
ontro
l mea
sure
s; F
= C
harg
e, ta
xes
and
pric
e co
ntro
l mea
sure
s; G
= Fi
nanc
e m
easu
res;
H=
Ant
i-com
petit
ive
mea
sure
s; I=
Tra
de-re
late
d in
vest
men
t mea
sure
s; J
= D
istri
butio
n re
stric
tions
; K. R
estri
ctio
ns o
n po
st-s
ales
se
rvic
es; L
= S
ubsi
dies
; M=
Gov
ernm
ent p
rocu
rem
ent r
estri
ctio
ns; N
= In
telle
ctua
l pro
perty
; Oa.
Pre
fere
ntia
l rul
es o
f orig
in a
nd re
late
d ce
rtific
ates
of o
rigin
; Ob
= N
on-p
refe
rent
ial r
ules
of o
rigin
and
re
late
d ce
rtific
ates
of o
rigin
; P=
Exp
ort-r
elat
ed m
easu
res

NA
VIG
ATI
NG
NO
N-T
AR
IFF
ME
AS
UR
ES
: IN
SIG
HTS
FR
OM
A B
US
INE
SS
SU
RV
EY
IN T
HE
EU
RO
PE
AN
UN
ION
52
MA
R-1
6-66
.E
Ann
ex C
. Eur
opea
n U
nion
Mem
ber S
tate
s ta
bles
Tabl
e C
1. D
istr
ibut
ion
of is
sues
by
NTM
cha
pter
by
coun
try
N
TM c
hapt
ers
A
B
C
D
E
F G
H
I
J K
L
M
N
Oa
Ob
P To
tal
Aus
tria
6.
37%
40
.20%
6.
37%
0.
00%
1.
47%
2.
94%
0.
98%
0.
98%
0.
00%
0.
00%
0.
00%
0.
00%
1.
47%
0.
00%
9.
31%
11
.76%
18
.14%
10
0.00
%
Bel
gium
12
.12%
45
.45%
6.
06%
0.
00%
9.
09%
0.
00%
0.
00%
6.
06%
0.
00%
0.
00%
0.
00%
0.
00%
0.
00%
0.
00%
6.
06%
9.
09%
6.
06%
10
0.00
%
Bul
garia
52
.41%
44
.14%
0.
00%
0.
00%
0.
00%
0.
00%
0.
00%
0.
00%
0.
00%
0.
00%
0.
00%
0.
00%
0.
00%
0.
00%
2.
76%
0.
00%
0.
69%
10
0.00
%
Cro
atia
26
.19%
42
.86%
19
.05%
0.
00%
4.
76%
0.
00%
0.
00%
0.
00%
0.
00%
0.
00%
0.
00%
0.
00%
0.
00%
0.
00%
2.
38%
0.
00%
4.
76%
10
0.00
%
Cyp
rus
0.00
%
31.5
8%
47.3
7%
0.00
%
0.00
%
0.00
%
0.00
%
0.00
%
0.00
%
0.00
%
0.00
%
0.00
%
0.00
%
0.00
%
5.26
%
15.7
9%
0.00
%
100.
00%
C
zech
Rep
ublic
19
.08%
35
.20%
12
.17%
0.
00%
4.
93%
0.
00%
0.
00%
0.
00%
0.
00%
0.
00%
0.
00%
0.
00%
6.
58%
0.
00%
6.
25%
0.
99%
14
.80%
10
0.00
%
Den
mar
k 27
.03%
39
.19%
20
.27%
0.
00%
0.
00%
0.
00%
2.
03%
0.
00%
0.
00%
0.
00%
0.
00%
0.
00%
0.
68%
0.
00%
0.
68%
4.
05%
6.
08%
10
0.00
%
Esto
nia
5.88
%
41.1
8%
5.88
%
0.00
%
47.0
6%
0.00
%
0.00
%
0.00
%
0.00
%
0.00
%
0.00
%
0.00
%
0.00
%
0.00
%
0.00
%
0.00
%
0.00
%
100.
00%
Fi
nlan
d 30
.79%
45
.03%
5.
30%
0.
00%
0.
99%
1.
32%
0.
66%
0.
00%
0.
00%
0.
00%
0.
00%
0.
00%
0.
66%
0.
33%
5.
30%
4.
30%
5.
30%
10
0.00
%
Fran
ce
15.5
5%
40.3
4%
13.8
7%
0.00
%
4.62
%
1.26
%
2.10
%
0.42
%
0.42
%
0.00
%
0.00
%
0.00
%
0.00
%
0.00
%
5.46
%
3.78
%
12.1
8%
100.
00%
G
erm
any
8.73
%
28.6
4%
5.25
%
0.68
%
3.56
%
2.12
%
0.93
%
0.68
%
0.08
%
1.36
%
1.02
%
0.00
%
0.00
%
0.00
%
10.8
5%
8.98
%
27.1
2%
100.
00%
G
reec
e 7.
58%
25
.76%
6.
06%
0.
00%
1.
52%
15
.91%
0.
76%
0.
76%
0.
00%
2.
27%
0.
00%
0.
00%
0.
00%
0.
00%
3.
79%
4.
55%
31
.06%
10
0.00
%
Hun
gary
8.
49%
32
.08%
3.
77%
0.
00%
3.
77%
0.
00%
2.
83%
0.
00%
0.
00%
0.
00%
0.
00%
0.
00%
0.
00%
0.
00%
12
.26%
8.
49%
28
.30%
10
0.00
%
Irela
nd
23.8
1%
7.14
%
21.4
3%
0.00
%
4.76
%
21.4
3%
2.38
%
2.38
%
0.00
%
0.00
%
0.00
%
0.00
%
0.00
%
0.00
%
2.38
%
0.00
%
14.2
9%
100.
00%
Ita
ly
16.9
3%
31.7
8%
3.40
%
1.18
%
1.11
%
1.03
%
1.48
%
0.67
%
0.00
%
0.22
%
0.00
%
0.00
%
0.00
%
0.00
%
9.02
%
13.6
0%
19.5
9%
100.
00%
La
tvia
13
.64%
32
.73%
10
.00%
0.
00%
20
.91%
2.
73%
18
.18%
0.
00%
0.
00%
0.
00%
0.
00%
0.
00%
0.
00%
0.
00%
0.
00%
0.
00%
1.
82%
10
0.00
%
Lith
uani
a 8.
03%
22
.89%
14
.46%
0.
00%
2.
81%
3.
21%
0.
00%
0.
00%
0.
00%
0.
00%
0.
00%
0.
00%
0.
00%
0.
00%
28
.51%
15
.66%
4.
42%
10
0.00
%
Luxe
mbo
urg
66.6
7%
8.33
%
0.00
%
0.00
%
25.0
0%
0.00
%
0.00
%
0.00
%
0.00
%
0.00
%
0.00
%
0.00
%
0.00
%
0.00
%
0.00
%
0.00
%
0.00
%
100.
00%
M
alta
0.
00%
9.
09%
54
.55%
0.
00%
0.
00%
0.
00%
0.
00%
0.
00%
0.
00%
0.
00%
0.
00%
0.
00%
0.
00%
9.
09%
18
.18%
9.
09%
0.
00%
10
0.00
%
Net
herla
nds
25.4
1%
39.2
7%
8.58
%
0.00
%
1.65
%
0.33
%
0.33
%
0.33
%
0.33
%
0.00
%
0.00
%
0.00
%
0.00
%
0.00
%
2.31
%
3.63
%
17.8
2%
100.
00%
Po
land
11
.27%
45
.09%
4.
00%
0.
00%
0.
73%
0.
36%
2.
91%
1.
45%
0.
00%
0.
00%
0.
00%
0.
00%
0.
00%
0.
00%
8.
36%
6.
55%
19
.27%
10
0.00
%
Port
ugal
15
.45%
27
.47%
2.
58%
2.
15%
0.
86%
14
.59%
0.
43%
0.
43%
0.
00%
0.
00%
0.
00%
0.
00%
0.
00%
0.
43%
16
.74%
18
.03%
0.
86%
10
0.00
%
Rom
ania
4.
88%
17
.07%
7.
32%
0.
00%
0.
00%
0.
00%
4.
88%
0.
00%
2.
44%
0.
00%
0.
00%
0.
00%
0.
00%
0.
00%
0.
00%
0.
00%
63
.41%
10
0.00
%
Slov
akia
28
.57%
22
.45%
36
.73%
0.
00%
0.
00%
0.
00%
0.
00%
0.
00%
0.
00%
0.
00%
0.
00%
0.
00%
4.
08%
0.
00%
2.
04%
4.
08%
2.
04%
10
0.00
%
Slov
enia
5.
21%
52
.08%
19
.79%
0.
00%
0.
00%
0.
00%
3.
13%
0.
00%
0.
00%
0.
00%
0.
00%
0.
00%
0.
00%
0.
00%
14
.58%
2.
08%
3.
13%
10
0.00
%
Spai
n 33
.63%
35
.09%
6.
14%
0.
88%
4.
39%
3.
22%
1.
46%
0.
58%
1.
17%
0.
00%
0.
00%
0.
00%
0.
29%
0.
00%
4.
39%
1.
46%
7.
31%
10
0.00
%
Swed
en
26.3
7%
10.4
5%
28.8
6%
0.50
%
3.48
%
2.99
%
5.97
%
0.50
%
0.00
%
0.50
%
0.00
%
0.00
%
0.00
%
0.00
%
5.97
%
6.97
%
7.46
%
100.
00%
U
nite
d K
ingd
om
14.7
6%
25.5
3%
8.26
%
0.74
%
3.81
%
4.36
%
0.28
%
0.00
%
0.19
%
0.09
%
0.00
%
0.09
%
0.00
%
0.93
%
4.74
%
8.73
%
27.4
8%
100.
00%
So
urce
: ITC
bus
ines
s su
rvey
in th
e E
U, 2
015-
2016
. N
otes
: NTM
Cha
pter
s ar
e: A
= T
echn
ical
requ
irem
ents
; B=
Con
form
ity a
sses
smen
t; C
= P
re-s
hipm
ent i
nspe
ctio
ns a
nd o
ther
ent
ry fo
rmal
ities
; D=
Trad
e re
med
ies;
E=
Qua
ntity
con
trol m
easu
res;
F =
Cha
rge,
taxe
s an
d pr
ice
cont
rol m
easu
res;
G=F
inan
ce m
easu
res;
H=A
nti-c
ompe
titiv
e m
easu
res;
I=Tr
ade
rela
ted
inve
stm
ent m
easu
res;
J=D
istri
butio
n re
stric
tions
; K. R
estri
ctio
ns o
n po
st-s
ales
ser
vice
s; L
=sub
sidi
es; M
= G
over
nmen
t pr
ocur
emen
t res
trict
ions
; N=
Inte
llect
ual p
rope
rty; O
a. =
Pre
fere
ntia
l rul
es o
f orig
in a
nd re
late
d ce
rtific
ates
of o
rigin
; Ob
= N
on-p
refe
rent
ial r
ules
of o
rigin
and
rela
ted
certi
ficat
es o
f Orig
in; P
= E
xpor
t-rel
ated
mea
sure
s
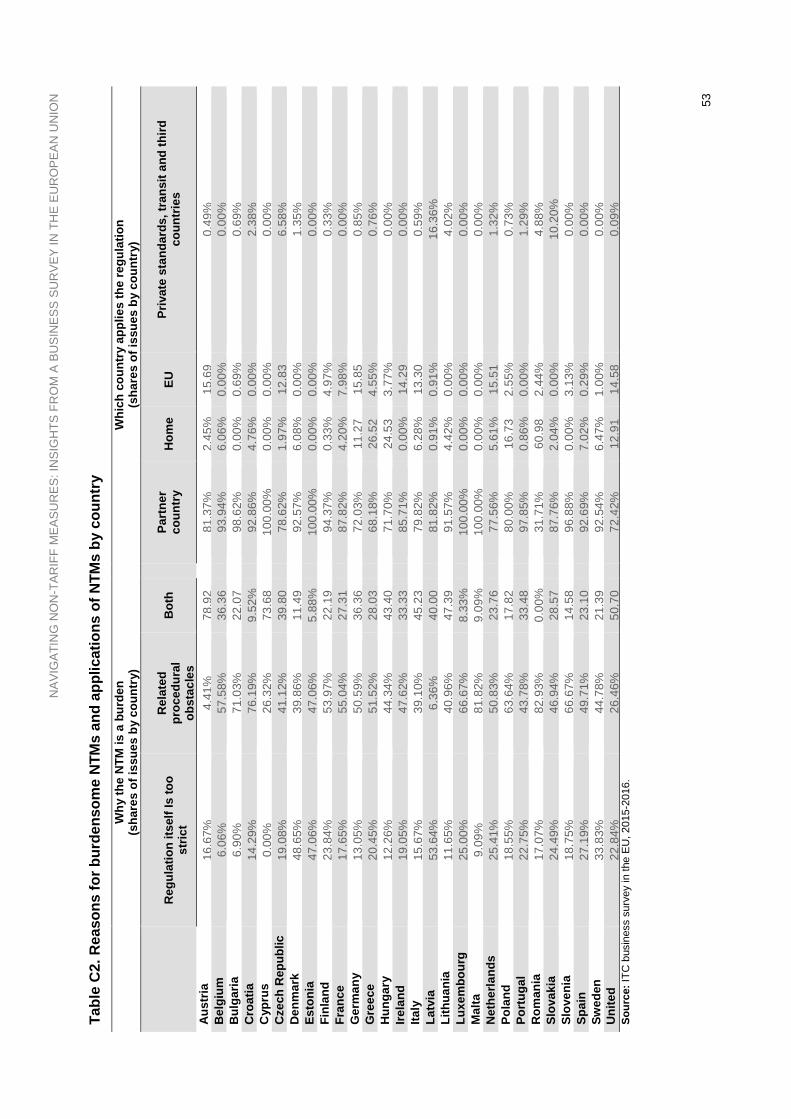
NA
VIG
ATI
NG
NO
N-T
AR
IFF
ME
AS
UR
ES
: IN
SIG
HTS
FR
OM
A B
US
INE
SS
SU
RV
EY
IN T
HE
EU
RO
PE
AN
UN
ION
53
Tabl
e C
2. R
easo
ns fo
r bur
dens
ome
NTM
s an
d ap
plic
atio
ns o
f NTM
s by
cou
ntry
W
hy th
e N
TM is
a b
urde
n
(sha
res
of is
sues
by
coun
try)
Whi
ch c
ount
ry a
pplie
s th
e re
gula
tion
(sha
res
of is
sues
by
coun
try)
R
egul
atio
n its
elf I
s to
o st
rict
R
elat
ed
proc
edur
al
obst
acle
s B
oth
Pa
rtne
r co
untr
y H
ome
EU
Priv
ate
stan
dard
s, tr
ansi
t and
third
co
untr
ies
Aus
tria
16.6
7%
4.41
%
78.9
2
81.3
7%
2.45
%
15.6
9 0.
49%
B
elgi
um
6.06
%
57.5
8%
36.3
6
93.9
4%
6.06
%
0.00
%
0.00
%
Bul
garia
6.
90%
71
.03%
22
.07
98
.62%
0.
00%
0.
69%
0.
69%
C
roat
ia
14.2
9%
76.1
9%
9.52
%
92
.86%
4.
76%
0.
00%
2.
38%
C
ypru
s 0.
00%
26
.32%
73
.68
10
0.00
%
0.00
%
0.00
%
0.00
%
Cze
ch R
epub
lic
19.0
8%
41.1
2%
39.8
0
78.6
2%
1.97
%
12.8
3 6.
58%
D
enm
ark
48.6
5%
39.8
6%
11.4
9
92.5
7%
6.08
%
0.00
%
1.35
%
Esto
nia
47.0
6%
47.0
6%
5.88
%
10
0.00
%
0.00
%
0.00
%
0.00
%
Finl
and
23.8
4%
53.9
7%
22.1
9
94.3
7%
0.33
%
4.97
%
0.33
%
Fran
ce
17.6
5%
55.0
4%
27.3
1
87.8
2%
4.20
%
7.98
%
0.00
%
Ger
man
y 13
.05%
50
.59%
36
.36
72
.03%
11
.27
15.8
5 0.
85%
G
reec
e 20
.45%
51
.52%
28
.03
68
.18%
26
.52
4.55
%
0.76
%
Hun
gary
12
.26%
44
.34%
43
.40
71
.70%
24
.53
3.77
%
0.00
%
Irela
nd
19.0
5%
47.6
2%
33.3
3
85.7
1%
0.00
%
14.2
9 0.
00%
Ita
ly
15.6
7%
39.1
0%
45.2
3
79.8
2%
6.28
%
13.3
0 0.
59%
La
tvia
53
.64%
6.
36%
40
.00
81
.82%
0.
91%
0.
91%
16
.36%
Li
thua
nia
11.6
5%
40.9
6%
47.3
9
91.5
7%
4.42
%
0.00
%
4.02
%
Luxe
mbo
urg
25.0
0%
66.6
7%
8.33
%
10
0.00
%
0.00
%
0.00
%
0.00
%
Mal
ta
9.09
%
81.8
2%
9.09
%
10
0.00
%
0.00
%
0.00
%
0.00
%
Net
herla
nds
25.4
1%
50.8
3%
23.7
6
77.5
6%
5.61
%
15.5
1 1.
32%
Po
land
18
.55%
63
.64%
17
.82
80
.00%
16
.73
2.55
%
0.73
%
Port
ugal
22
.75%
43
.78%
33
.48
97
.85%
0.
86%
0.
00%
1.
29%
R
oman
ia
17.0
7%
82.9
3%
0.00
%
31
.71%
60
.98
2.44
%
4.88
%
Slov
akia
24
.49%
46
.94%
28
.57
87
.76%
2.
04%
0.
00%
10
.20%
Sl
oven
ia
18.7
5%
66.6
7%
14.5
8
96.8
8%
0.00
%
3.13
%
0.00
%
Spai
n 27
.19%
49
.71%
23
.10
92
.69%
7.
02%
0.
29%
0.
00%
Sw
eden
33
.83%
44
.78%
21
.39
92
.54%
6.
47%
1.
00%
0.
00%
U
nite
d
22.8
4%
26.4
6%
50.7
0
72.4
2%
12.9
1 14
.58
0.09
%
Sour
ce: I
TC b
usin
ess
surv
ey in
the
EU
, 201
5-20
16.

NAVIGATING NON-TARIFF MEASURES: INSIGHTS FROM A BUSINESS SURVEY IN THE EUROPEAN UNION
MAR-16-66.E 54
ITC publication series on non-tariff measures
Available country reports Sri Lanka: Company perspectives (English, 2011) Burkina Faso: Company perspectives (French, 2011) Morocco: Company perspectives (French, 2012) Peru: Company perspectives (English, 2012; Spanish, 2013) Malawi: Company perspectives (English, 2013) Trinidad and Tobago: Company perspectives (English, 2013) Uruguay: Company perspectives (Spanish, 2013) Jamaica: Company perspectives (English, 2013) Madagascar: Company perspectives (French, 2013) Paraguay: Company perspectives (Spanish, 2013) Mauritius: Company perspectives (English, 2014) Rwanda: Company perspectives (English, 2014) Senegal: Company perspectives (French, 2014) Côte d’Ivoire: Company perspectives (French, 2014) Kenya: Company perspectives (English, 2014) Cambodia: Company perspectives (English, 2014) Regulatory and procedural barriers to trade in Kazakhstan (English, 2014; Russian, 2014) Tunisia: Company perspectives (French, 2014) United Republic of Tanzania: Company perspectives (English, 2014) State of Palestine: Company perspectives (English, 2015) Guinea: Company perspectives (French, 2015) Egypt: Company perspectives (English, 2016) Indonesia: Company perspectives (English, 2016) Thailand: Company perspectives (English, 2016) Forthcoming country reports
Bangladesh: Company perspectives (English) Mali: Company perspectives (French) Benin: Company perspectives (French) Colombia: Company perspectives (Spanish) Related publications
NTMs and the fight against malaria: Obstacles to trade in anti-malarial commodities (English, 2011) The Invisible Barriers to Trade: How Businesses Experience Non-Tariff Measures (English, 2015) Making regional integration work – Company perspectives on non-tariff measures in Arab States (English, 2015; Arabic and French forthcoming) Regional integration in ECOWAS (forthcoming in English and French)
The reports are accessible free of charge at the ITC publications page: www.intracen.org/ntm/publications
NTM Survey results are also available online at www.ntmsurvey.org.


FSC is an independent, non-governmental, not for profit organization established to promote the responsible management of the world´s forests.
Printed by ITC Digital Printing Service on FSC paper, which is environmentally-friendly paper (without chlorine) using vegetable-based inks. The printed matter is recyclable.
A free pdf is available on ITC’s website at: www.intracen.org/publications

Street address: ITC, 54-56, rue de Montbrillant, 1202 Geneva, Switzerland
Postal address: ITC, Palais des Nations, 1211 Geneva 10, Switzerland
Telephone: +41-22 730 0111 Fax: +41-22 733 4439E-mail: [email protected]: www.intracen.org
In partnership with:


