SOURCE: Dalbar Inc. Quantitative Analysis of Investor Behavior 2014. Represents average annually compounded returns of equity indices vs. equity mutual fund investors; based on the length of time shareholders actually remain invested in a fund and the historical performance of the fund’s appropriate index. Returns are from the time period of January 1992 to December 2011. Past Performance is no guarantee of future results. Investors cannot invest directly into in an index.
During the biggest bull market in history (1994 – 2013), equity mutual fund investors significantly lagged the market. Why?
Answer: Investors are repeatedly led astray by past
performance, moods of the market, etc.
Solution: A disciplined investment process.
“Investor Behavior” Penalty
Limbic System
Main structures: Hypothalamus Hippocampus Amygdala
Probabilities of positive/negative returns for given holding periods
SOURCE: Morningstar Direct, LFN Investment Research, data uses calendar returns between 1928-2014.
Risks Characteristics
Source: Standard & Poor’s
Asset Class Short Term
Market Volatility Market Risk Interest Rate
Risk Credit Risk Inflation Risk
Stocks High High Moderate Low Low
REITs Moderate Moderate Moderate Low Low
High Yield Bonds High Moderate High High Moderate
Corporate Bonds Moderate Moderate High Moderate –
High Moderate
U.S. Government
Bonds Low
High
High Low High
Cash Low Low Low – Moderate Low High
Different asset classes are subject to various levels of risk. Below indicates the general risk exposures of various asset classes.
Asset Location
Tax-Deferred Client Dependent Taxable
Client Dependent
Client Dependent Taxable
Either Either Taxable
Tax Efficiency Low High
Low
H
igh
Ret
urn
Pote
ntia
l
Medium
Med
ium
The goal of asset location is to divide their investments
among taxable and retirement accounts in a way that will defer taxes and ultimately provide the best after-tax
returns. The optimal location for an investor's assets can also vary depending on tax bracket, investment holding
periods, and the tax and return characteristics of the
securities.
Order of Distribution
Developing a Distribution Strategy Objective: maximize retirement income and family wealth on an after-tax basis Establish a consolidated cash management account o Deposit all taxable income to this account (Social Security, pensions,
o Deposit investment cash flows (dividends, interest, and capital gains from taxable accounts).
o Excess balances may be used to periodically rebalance the portfolio. o Inadequate balances dictate the need for withdrawals from the portfolio.
Determine the order of withdrawal between account types. o Taxable accounts (exclusive of cash management account) - periodic taxable
dividends, interest, and/or capital gains o Tax-deferred accounts - taxable income at distribution only o Tax-free accounts - no taxes periodically or at distribution
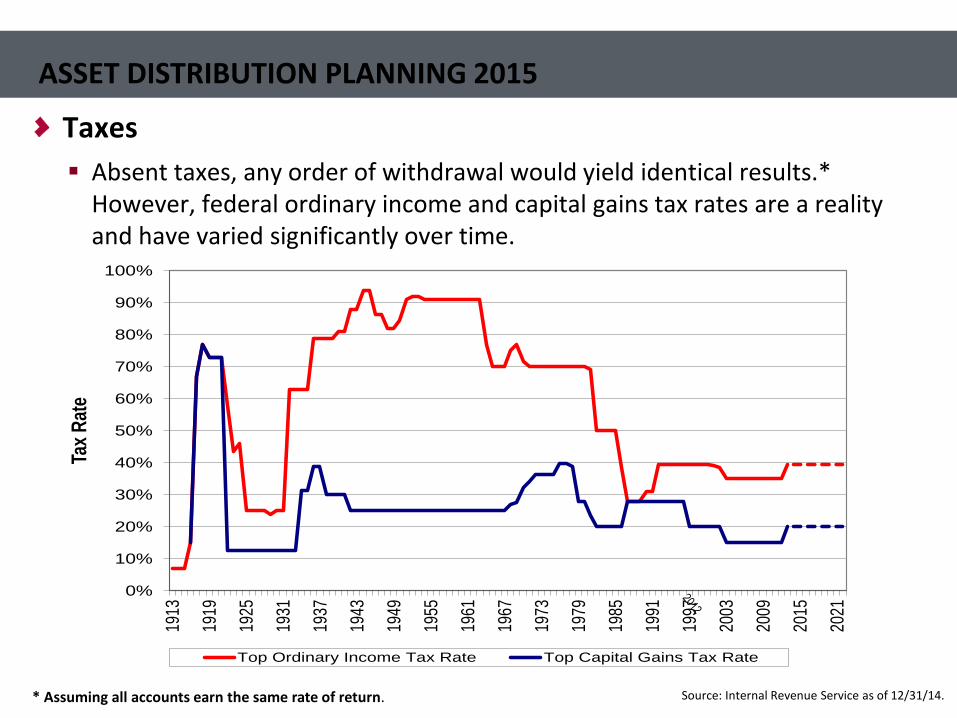
ASSET DISTRIBUTION PLANNING 2015
Taxes Absent taxes, any order of withdrawal would yield identical results.*
However, federal ordinary income and capital gains tax rates are a reality and have varied significantly over time.
0%
10%
20%
30%
40%
50%
60%
70%
80%
90%
100%
1913
1919
1925
1931
1937
1943
1949
1955
1961
1967
1973
1979
1985
1991
1997
2003
2009
2015
2021
Tax R
ate
Top Ordinary Income Tax Rate Top Capital Gains Tax Rate
Source: Internal Revenue Service as of 12/31/14.
ASSET DISTRIBUTION PLANNING 2015
* Assuming all accounts earn the same rate of return.
Taxes Qualified (Q) versus Non-Qualified (NQ) Accounts o Qualified accounts are generally funded with pre-tax dollars and grow tax-
deferred. Distributions are fully taxed (exception: after-tax contributions to traditional IRAs and qualified company retirement plans).
o Non-qualified accounts are generally funded with after-tax dollars and do not grow tax-deferred. Distributions are partially taxed (exception: NQ annuities and cash value life insurance).
ASSET DISTRIBUTION PLANNING 2015
Distribution order is highly dependent on your expectations for your future tax liabilities relative to your situation today.
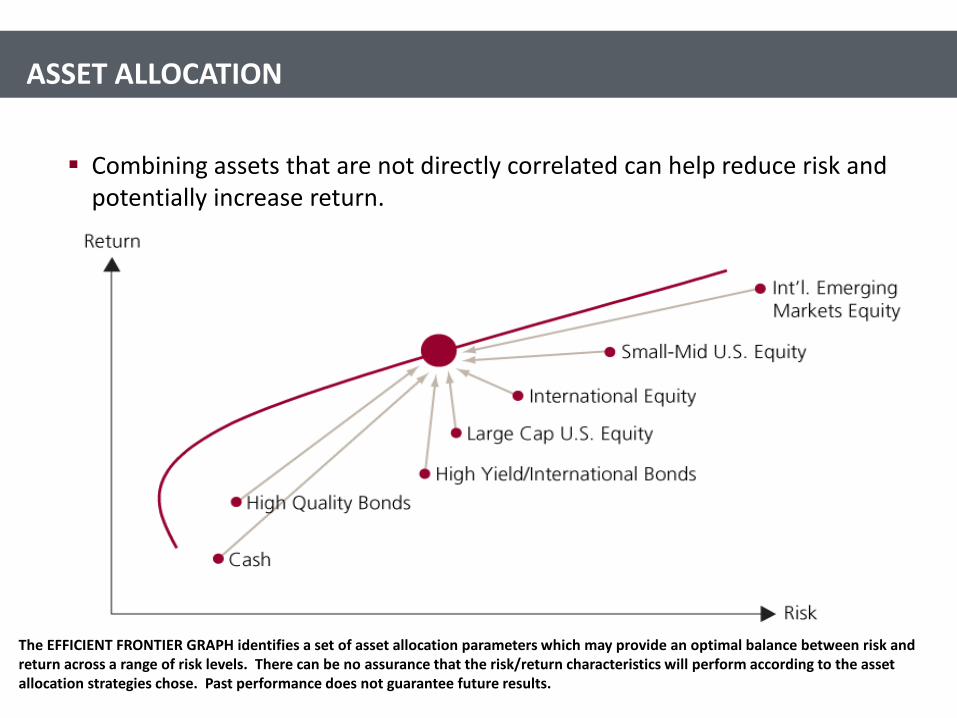
Combining assets that are not directly correlated can help reduce risk and potentially increase return.
The EFFICIENT FRONTIER GRAPH identifies a set of asset allocation parameters which may provide an optimal balance between risk and return across a range of risk levels. There can be no assurance that the risk/return characteristics will perform according to the asset allocation strategies chose. Past performance does not guarantee future results.
ASSET ALLOCATION
The placement of assets should not only provide for tax efficiency, but also for withdrawal flexibility to help manage distributions in periods of market volatility.
Some characteristics are more preferable than others within asset classes.
ASSET PLACEMENT
Account Type Taxable Tax-Deferred/Tax-Free
Asset Allocation Same as total portfolio % Same as total portfolio %
Asset Type Municipal bonds Corporate bonds
Low dividend equities High dividend equities
Asset Management Passive, Active (tax-sensitive)
Active
Public Private
General Asset Location Guidelines
Tax-Deferred Client Dependent Taxable
Client Dependent
Client Dependent Taxable
Either Either Taxable
Tax Efficiency Low High
Low
H
igh
Ret
urn
Pote
ntia
l
Medium
Med
ium
Source: FPA Journal – Asset Location: A Generic Framework for maximizing After-Tax Wealth; Journal of Finance: Optimal Asset Location and Allocation with Taxable and Tax-Deferred Investing. See the Main Disclosure for additional information
The goal of asset location is to divide their investments among taxable and retirement accounts in a way that will defer taxes and ultimately provide the best after-tax returns.
The optimal location for an investor's assets
can also vary depending on tax
bracket, investment holding periods, and
the tax and return characteristics of the
securities.
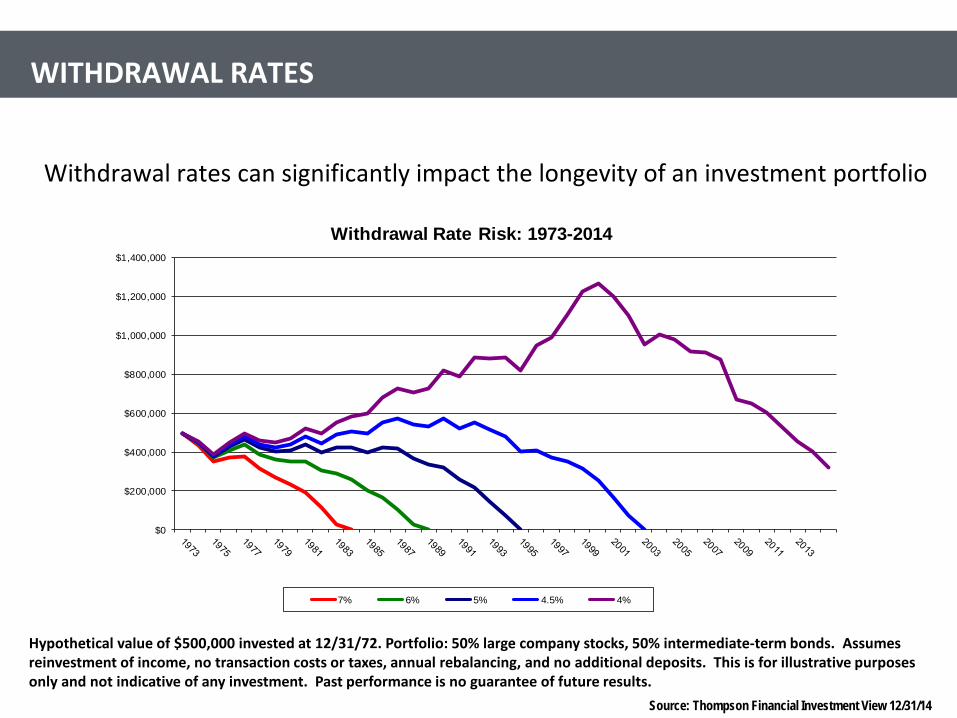
Withdrawal rates can significantly impact the longevity of an investment portfolio
Hypothetical value of $500,000 invested at 12/31/72. Portfolio: 50% large company stocks, 50% intermediate-term bonds. Assumes reinvestment of income, no transaction costs or taxes, annual rebalancing, and no additional deposits. This is for illustrative purposes only and not indicative of any investment. Past performance is no guarantee of future results.
WITHDRAWAL RATES
US Large Company Equity and 10 Year US Treasury Bond Rates 12/31/73-12/31/14
Source: Yahoo Finance
GSPC: Standard & Poor’s 500 Index
TNX: Chicago Board Options Exchange Interest Rate 10 Year Treasury Note
HISTORICAL MARKET PERFORMANCE
6.54% 1.68%
Expectations of future rates of return and inflation may differ from historical averages.
The “4% annual safe withdrawal rate” rule of thumb may be overly aggressive given current market conditions. o Most studies indicate that a withdrawal rate in the range of 2.5% - 3%
may be more appropriate to help ensure longevity of the portfolio.
WITHDRAWAL RATES
Historical
(1973-2014) 10 Year Forward
Assumptions
Intermediate Fixed Income 7.3% 3.9%
US Large Cap Equity 11.9% 7.3%
Portfolio 50%/50% 9.6% 5.6%
Inflation 4.2% 2.7%
Inflation Adjusted Return 5.4% 2.9%
4% WITHDRAWAL RULE
Matching the most appropriate funding sources to specific needs is a key element in designing an effective retirement plan.
Stable Income Sources
Systematic Withdrawals
Specific Distributions
Asset Repositioning
RETIREMENT INCOME PLANNING
Core Expenses Goals
. Legacy
.
Lifestyle Expenses
Portfolio Strategy
PORTFOLIO STRATEGY
Strategy Objective Ideal Situation Distribution
Need
Asset/Liability Matching
Immunize risk by matching a future liability with an asset
1) Portfolio w/ high dist. requirement +5%
Needs / Wants Separation
Fund needs expenses and wants expenses separately and address investor psychology
1) Retirement 2% - 4.5%
Segmented Portfolio
Create risk segments to optimize yield and address investor psychology
1) Retirement, 2) Endowment /
Foundation 2% - 4.5%
Total Return Portfolio
All assets are positioned to achieve the same goals(s)
1) Accumulation, 2) Retirement w/
min. dist. 0% - 2%
ASSET – LIABILITY MATCHING
Description: Strategy to minimize risk to support a required withdrawal strategy beyond the ability of the portfolio.
Best Use: Investor who’s withdrawals are more than a portfolio can sustain Pros:
1. Assure known liabilities are provided for with known asset payoffs 2. Immunize portfolio from duration risk (interest rate rises) 3. Address psychological/behavioral aspects
Cons: 1. Requires futures liabilities to be project with level of certainty 2. Requires monitoring and cash flow budgeting
ASSET/LIABILITY MATCHING
Institutional process to primarily immunize duration risk and seek targeted yields.
Year 1 Year 2 Year 3 Year 4 Year 5 Year 6
Living Exp. $100k $100k $100k $100k $100k $100k
Travel $20k $20k $20k $20k $20k $20k
Car $50k
Grandson Coll. $25k $27k $30k
TOTAL EXP. $120k $120k $170k $145k $147k $150k
NEEDS / WANTS SEPARATION
Description: Match survival expenses (needs) with known income sources and lifestyle expenses (wants) with variable income sources
Best Use: Investor that has ability to change his/her lifestyle Pros:
1. Apply Asset/Liability matching process 2. Address psychological/behavioral aspects 3. Mitigate panic in down years to allow market recovery 4. Allows for implementation flexibility (use of different products)
Cons: 1. Requires reviewing and cash flow budgeting 2. Discretionary expenses may be tied to market requiring flexibility
NEEDS / WANTS SEPARATION
Expense Category Purpose Examples Funded By…
Basic Needs Pay for expenses to sustain oneself
Food, Shelter, Clothing, Medical, Taxes, etc.
Social Security, Pensions, Annuities, other stable income
Lifestyle Wants Pay for desirable but not necessary lifestyle expenses
Travel, Country Club, Boat Upkeep, Leisure Activities, Restaurants, etc.
Investment portfolio income and/or periodic withdrawals
Specific Goals Pay for non-recurring goals with specific timing
Grand children’s college, Second home, Charitable Gift
Portfolio withdrawals as needed
NEEDS / WANTS SEPARATION
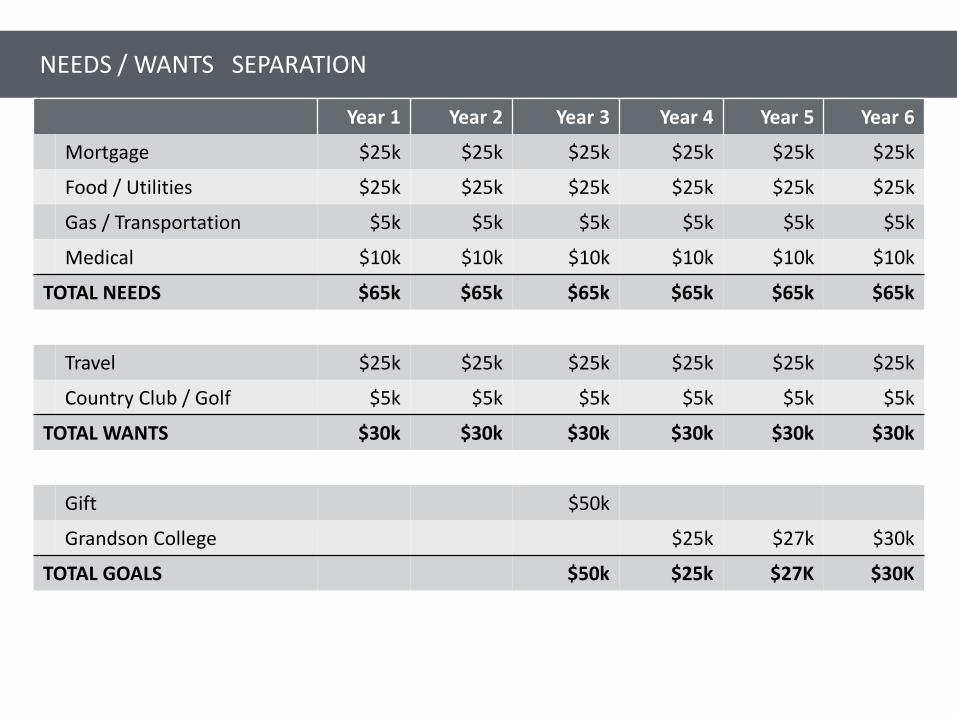
Year 1 Year 2 Year 3 Year 4 Year 5 Year 6
Mortgage $25k $25k $25k $25k $25k $25k
Food / Utilities $25k $25k $25k $25k $25k $25k
Gas / Transportation $5k $5k $5k $5k $5k $5k
Medical $10k $10k $10k $10k $10k $10k
TOTAL NEEDS $65k $65k $65k $65k $65k $65k
Travel $25k $25k $25k $25k $25k $25k
Country Club / Golf $5k $5k $5k $5k $5k $5k
TOTAL WANTS $30k $30k $30k $30k $30k $30k
Gift $50k
Grandson College $25k $27k $30k
TOTAL GOALS $50k $25k $27K $30K
NEEDS / WANTS SEPARATION
NEEDS / WANTS SEPARATION
SEGMENTED PORTFOLIO (BUCKETED PORTFOLIO)
Description: Establish a series of buckets with more stable and conservative assets in the near term bucket and more aggressive assets in the long term bucket
Best Use: Structure portfolio approach with high unsustainable withdrawal rate Pros:
1. Target assets’ riskiness with appropriate investment horizon 2. Develop a dedicated withdrawal strategy 3. Address psychological/behavioral aspects 4. Mitigate panic in down years to allow market recovery
Cons: 1. Overall portfolio may become more aggressive as strategy matures 2. Need to review and tweak strategy throughout the strategies life span 3. Periodic rebalance to ensure overall portfolio risk
Bucket # 1 Used for short term needs. Primarily comprised of stable assets.
Bucket # 2 Used for intermediate term needs. Primarily comprised of income oriented assets, with some level of fluctuation.
Bucket # 3 Used for long term needs to grow assets and address purchasing power risk. Primarily comprised of growth assets that may high volatility.
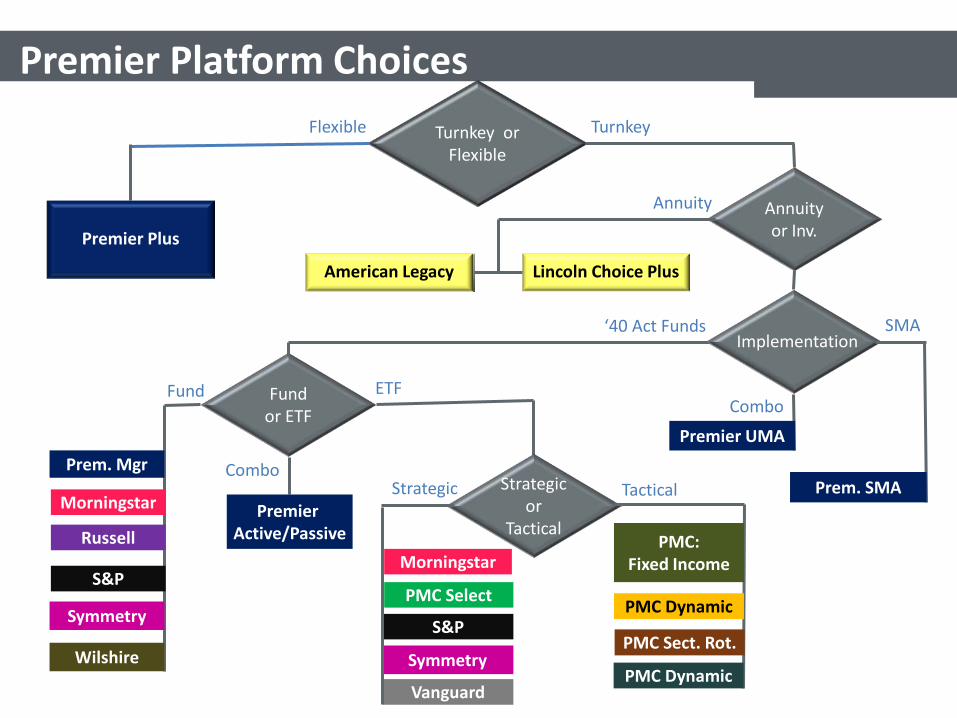
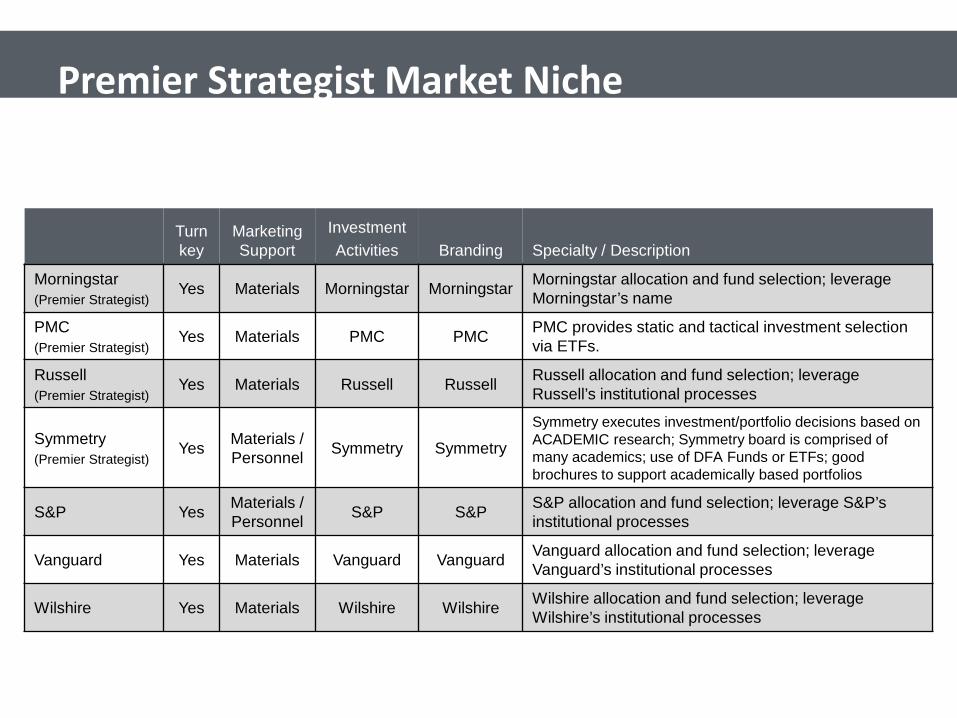
Yes Materials Morningstar Morningstar Morningstar allocation and fund selection; leverage Morningstar’s name
PMC (Premier Strategist)
Yes Materials PMC PMC PMC provides static and tactical investment selection via ETFs.
Russell (Premier Strategist)
Yes Materials Russell Russell Russell allocation and fund selection; leverage Russell’s institutional processes
Symmetry (Premier Strategist)
Yes Materials / Personnel Symmetry Symmetry
Symmetry executes investment/portfolio decisions based on ACADEMIC research; Symmetry board is comprised of many academics; use of DFA Funds or ETFs; good brochures to support academically based portfolios
S&P Yes Materials / Personnel S&P S&P S&P allocation and fund selection; leverage S&P’s
institutional processes
Vanguard Yes Materials Vanguard Vanguard Vanguard allocation and fund selection; leverage Vanguard’s institutional processes
Wilshire Yes Materials Wilshire Wilshire Wilshire allocation and fund selection; leverage Wilshire’s institutional processes
Holistic Planning for Financial Independence
Even the best finance experts face their share of surprises when they retire, according to a June 2015 article in Forbes. 1) Medicare doesn’t cover everything 2) Travel isn’t cheap 3) Paying off your mortgage pays off 4) Investment risk can lose its allure 5) Taxes can get more complicated when you retire 6) It’s difficult to switch from saving to spending 7) Adjusting to retirement takes time
Top Seven Retirement Surprises
70% - Percentage of people older than 65 who will require LTC (Source: U.S. Department of Health and Human Services)
$87,600 – Avg. annual cost for nursing home private room (Source: Genworth’s 2014 Cost of Care Survey)
77% - Per of promised Social Security benefits after 2033 if system isn’t revised (Source: Forbes)
3% - Growth of ind. variable annuity from Q1 2014 to Q1 2015
(Source: LIMRA)
Holistic Planning
Holistic Planning
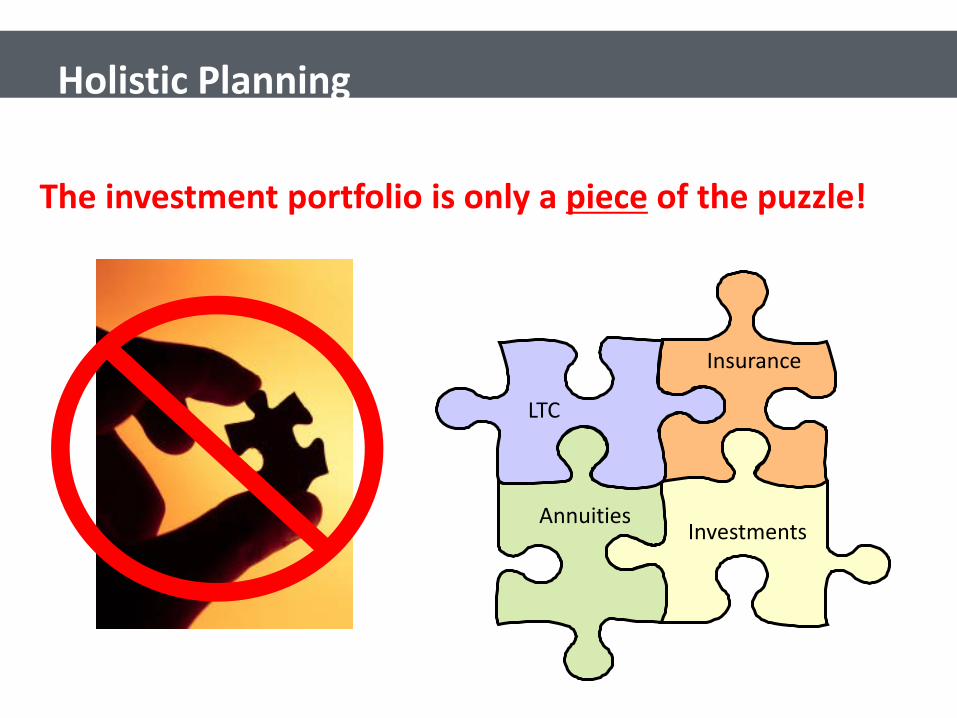
The investment portfolio is only a piece of the puzzle!
Investments Annuities
Insurance
LTC
Case Study
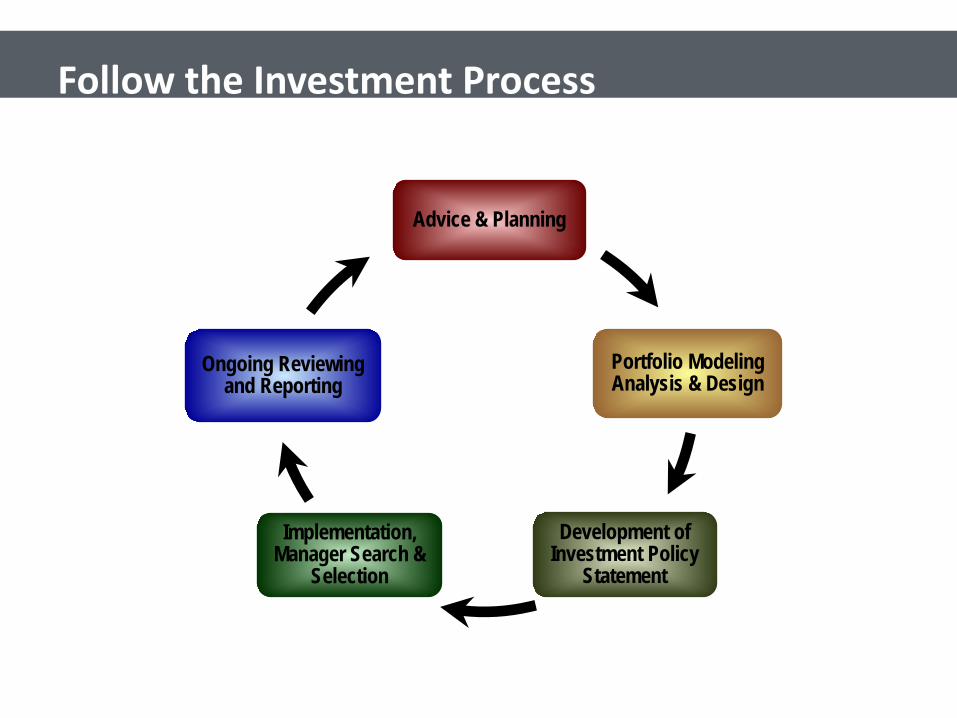
Follow the Investment Process
Advice & Planning
Portfolio Modeling Analysis & Design
Development of Investment Policy
Statement
Implementation, Manager Search &
Selection
Ongoing Reviewing and Reporting
Step 1: Gather Information
Step 2: Analyze and Model
Step 2: Analyze and Model
Step 2: Analyze and Model
Step 2: Analyze and Model
Risk Tolerance Questionnaire
Sections:
1) Risk Capacity 2) Risk Attitude
Step 2: Analyze and Model
Step 2: Analyze and Model
Step 2: Analyze and Model
Step 4: Implementation
Step 4: Implementation
Step 5: Monitor
QUESTIONS
64 For agent or broker use only. Not for use with the public.