43
Navios Maritime Holdings Inc. 5th Annual Shipping, Logistics & Offshore Services Conference New York City September 16, 2008

Navios Maritime Holdings Inc.
5th Annual Shipping, Logistics & Offshore Services Conference
New York City
September 16, 2008

DisclosuresStatements in this presentation which are not statements of historical fact are “forward-looking statements” (as such term is defined in Section 21E of the Securities Exchange Act of 1934, as amended). These forward-looking statements are based on the information available to, and the expectations and assumptions deemed reasonable by, the Company at the time this presentation was made. Although the Company believes that the assumptions underlying such statements are reasonable, it can give no assurance that they will be attained. The Company undertakes no obligation to update any forward-looking statements, whether as a result of new information or future events, unless it is required to do so under the securities laws. The Company makes no prediction or statement about the performance of its common units.
For the selected financial data presented herein, Navios compiled consolidated statement of operations for the three-month and six month periods ended June 30, 2008 and June 30, 2007.
EBITDA represents net income plus interest and finance costs plus depreciation and amortization and income taxes, if any. EBITDA is included because it is used by certain investors to measure a company's financial performance. EBITDA is a “non-GAAP financial measure” and should not be considered a substitute for net income, cash flow from operating activities and other operations or cash flow statement data prepared in accordance with accounting principles generally accepted in the United States or as a measure of profitability or liquidity. EBITDA is presented to provide additional information with respect to the Company's ability to satisfy its obligations including debt service, capital expenditures, working capital requirements and determination of dividends. While EBITDA is frequently used as a measure of operating results and the ability to meet debt service requirements, the definition of EBITDA used here may not be comparable to that used by other companies due to differences in methods of calculation.
3
Agenda
• Navios Business Model Overview• Q2 2008 and Recent Developments• Vessel Operations• Navios Maritime Partners• Navios South American Logistics• Industry Overview• Financial Highlights – Q2 and H1 2008• Appendix

4
Navios Business Model Overview
555
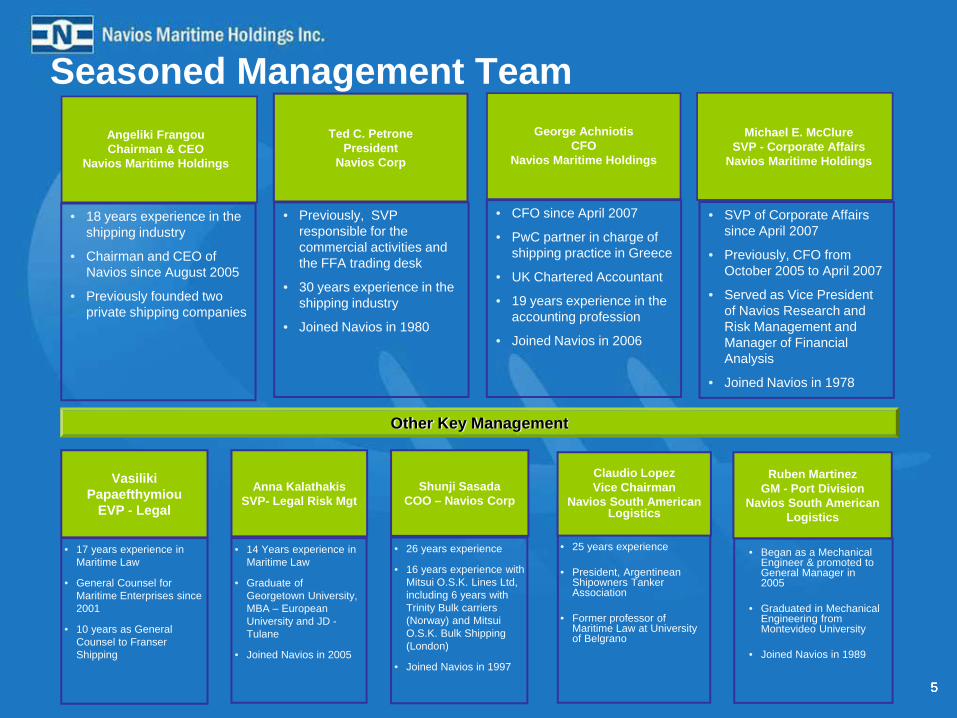
Seasoned Management Team
• 18 years experience in the shipping industry
• Chairman and CEO of Navios since August 2005
• Previously founded two private shipping companies
Shunji SasadaCOO – Navios Corp
• 26 years experience
• 16 years experience with Mitsui O.S.K. Lines Ltd, including 6 years with Trinity Bulk carriers (Norway) and Mitsui O.S.K. Bulk Shipping (London)
• Joined Navios in 1997
Other Key Management
• SVP of Corporate Affairs since April 2007
• Previously, CFO from October 2005 to April 2007
• Served as Vice President of Navios Research and Risk Management and Manager of Financial Analysis
• Joined Navios in 1978
Angeliki FrangouChairman & CEO
Navios Maritime Holdings
• CFO since April 2007
• PwC partner in charge of shipping practice in Greece
• UK Chartered Accountant
• 19 years experience in the accounting profession
• Joined Navios in 2006
George AchniotisCFO
Navios Maritime Holdings
Michael E. McClureSVP - Corporate Affairs
Navios Maritime Holdings
Vasiliki Papaefthymiou
EVP - Legal
• 17 years experience in Maritime Law
• General Counsel for Maritime Enterprises since 2001
• 10 years as General Counsel to Franser Shipping
Anna KalathakisSVP- Legal Risk Mgt
• 14 Years experience in Maritime Law
• Graduate of Georgetown University, MBA – European University and JD -Tulane
• Joined Navios in 2005
• Previously, SVP responsible for the commercial activities and the FFA trading desk
• 30 years experience in the shipping industry
• Joined Navios in 1980
Ted C. PetronePresident
Navios Corp
Claudio LopezVice Chairman
Navios South American Logistics
• 25 years experience
• President, Argentinean Shipowners Tanker Association
• Former professor of Maritime Law at University of Belgrano
Ruben MartinezGM - Port Division
Navios South American Logistics
• Began as a Mechanical Engineer & promoted to General Manager in 2005
• Graduated in Mechanical Engineering from Montevideo University
• Joined Navios in 1989

66
Company Overview• NYSE listing (“NM”)
• 50+ year operating history
• Among world’s largest vertically integrated dry bulk shipping companies
– Young fleet of 64 owned & chartered-in vessels (6.2 million dwt)
– In-house technical & commercial management
– Purchase options on 20 vessels significantly below fair market value
• Flexible Business Model
• Significant Contracted Revenue
• Low-cost Operator
• Strong Brand with Established Long-term Relationships
Capesize
Ultra-Handymax
Panamax
(1) Fleet Growth statistics shown represent change from September 1, 2005 to September 12, 2008. Fleet calculation includes controlled fleet of Navios Group. Fleet of 21 vessels at September 1, 2005 and 62 controlled vessels at September 12, 2008. EBITDA represents CAGR for 2005-2007. Includes Obeliks (95% owned) sold in Q2 2008
EBITDA: 55%Fleet: 205%
Significant Growth (1)
Analyst Coverage• Cantor Fitzgerald• Dahlman Rose & Co.• Fearnley Fonds• JP Morgan• Lazard Capital Markets• Merrill Lynch• Jefferies• Goldman Sachs• Bank of America• DnB NOR
777
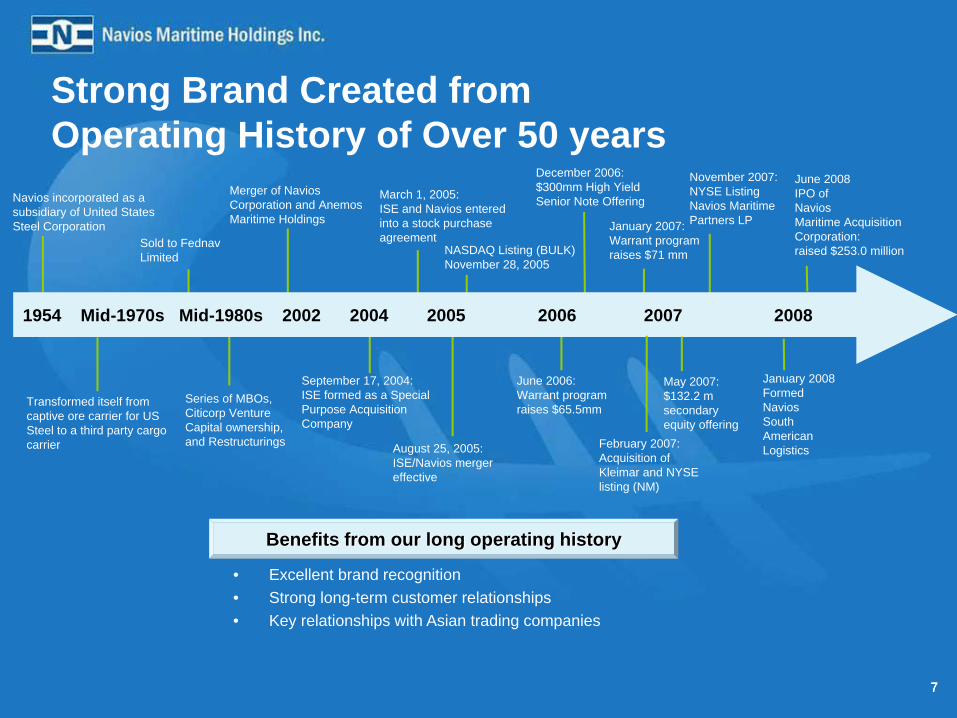
Strong Brand Created from Operating History of Over 50 years
December 2006:$300mm High YieldSenior Note OfferingNavios incorporated as a
subsidiary of United States Steel Corporation
Sold to Fednav Limited
Merger of Navios Corporation and Anemos Maritime Holdings
Transformed itself from captive ore carrier for US Steel to a third party cargo carrier
Series of MBOs, Citicorp Venture Capital ownership, and Restructurings
September 17, 2004:ISE formed as a Special Purpose Acquisition Company
August 25, 2005: ISE/Navios merger effective
March 1, 2005:ISE and Navios entered into a stock purchase agreement
1954 Mid-1970s Mid-1980s 2002 2004 2005 2006 2007 2008
NASDAQ Listing (BULK)November 28, 2005
• Excellent brand recognition• Strong long-term customer relationships• Key relationships with Asian trading companies
Benefits from our long operating history
June 2006:Warrant program raises $65.5mm
January 2007:Warrant program raises $71 mm
February 2007: Acquisition of Kleimar and NYSE listing (NM)
May 2007:$132.2 m secondary equity offering
November 2007:NYSE Listing Navios Maritime Partners LP
January 2008FormedNaviosSouthAmericanLogistics
June 2008IPO ofNaviosMaritime Acquisition Corporation:raised $253.0 million

88
NM Flexible Business ModelSecured Cash Flow + Risk Management + Investment Opportunities
Core Fleet (Owned and Long-Term Chartered-in Fleet)
Capitalize on real-time Market Intelligence in making strategic fleet management decisionsContracts of Affreightment (“COA”)Short-Term ChartersForward Freight Agreements (“FFA”)
Risk Management
63.8% ownership stakeBarge operations in the Hidrovia region and Port Terminal facilities (grain and liquid)Emerging markets commoditiesSignificant growth potential
Navios South American Logistics
Navios Maritime Partners L.P.(NYSE:NMM)
51.6% ownership stake 2.0% General Partner Interest Significant Incentive Distribution RightsHigh dividend distribution modelSignificant growth potentialNAV per NM share: $1.24*
Navios Maritime Acquisition Corp.(NYSE:NNA.U)
19% ownership stake for NM $253.0 million Gross IPO Proceeds$7.6 million NM investment Favorable marine transportation dynamicsNAV subject to successful business combination
NM TotalEBITDA
Includes both owned and long term chartered-in vesselsEmployed in long-term charter-out contracts (>12 months) Significant spreads over vessel operating expenses and charter-in rates
* As of September 8, 2008

9
Q2 2008 and Recent Developments

10
Recent Fleet Chartering Activity– Renewal of charters at 80% premium to current rates – Newbuildings chartered-out well ahead of availability
(1) Net time charter-out rate per day (net of commissions)
(2) Charter agreements include a redelivery time range of two to four months
(3) Estimated commencement date of new charter assuming midpoint redelivery by charterers
Vessel Type DWT Current charter-out daily rate (1)
New charter-out daily rate (1)
Period (2) Charter-out date (3)
Navios Orion
Panamax 76,602 $27,312 $49,400 3.5 years 4/1/2009
Navios Achilles
Ultra-Handymax
52,063 $21,138 $38,009 3 years 2/23/2009
Navios TBN
Capesize 172,000 n/a $41,325 10 years Q4 2009
Navios TBN
Capesize 172,000 n/a $57,000 5 years Q1 2010
11
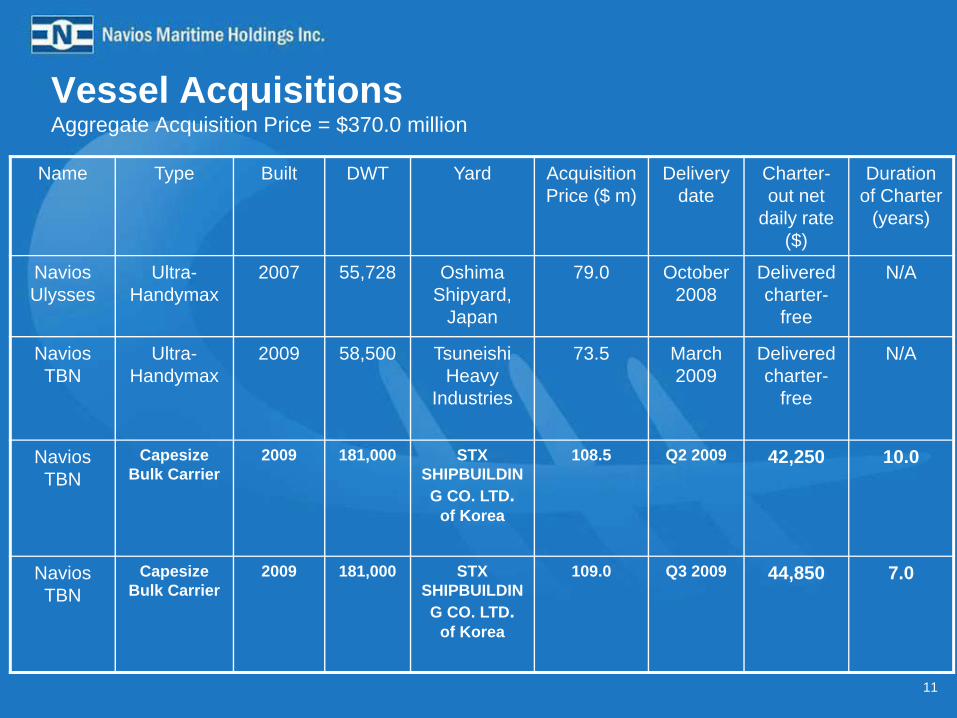
Vessel AcquisitionsAggregate Acquisition Price = $370.0 million
Name Type Built DWT Yard Acquisition Price ($ m)
Delivery date
Charter-out net
daily rate ($)
Duration of Charter
(years)
Navios Ulysses
Ultra-Handymax
2007 55,728 Oshima Shipyard,
Japan
79.0 October 2008
Delivered charter-
free
N/A
Navios TBN
Ultra-Handymax
2009 58,500 Tsuneishi Heavy
Industries
73.5 March 2009
Delivered charter-
free
N/A
Navios TBN
Capesize Bulk Carrier
2009 181,000 STX SHIPBUILDING CO. LTD.
of Korea
108.5 Q2 2009 42,250 10.0
Navios TBN
Capesize Bulk Carrier
2009 181,000 STX SHIPBUILDING CO. LTD.
of Korea
109.0 Q3 2009 44,850 7.0
12
Navios Maritime Acquisition Corporation
• Priced on June 25, 2008
• Closed on July 1, 2008
• Gross Proceeds of $253.0 million
• Units trading on NYSE (NYSE: NNA.U)– Common shares trade on NYSE under the symbol NNA– Warrants trade on NYSE under the symbol NNA WS
• 19% ownership position for NM
• Potential to NM – $7.6 million initial investment– Significant upside potential
Vessel Operations

1414
Navios Holdings – 64 vessels & 6.2 million DWT
(1) Includes Product tanker Vanessa, excludes Navios Logistics’ Fleet(2) Navios Group is composed of Navios Holdings (NM) and Navios Partners (NMM)
22 Panamax
• 17 vessels (1.35 million dwt)
17 Ultra-Handymax
• 5 vessels (0.27 million dwt)
• 3 vessels (0.17 million dwt)
36 Long-term Chartered-in 3.40 million dwt
20 Purchase Options
28 Owned Vessels2.79 million dwt
Controls 64(1) Vessels (6.2 million dwt)33 Currently Operating (2.6 million dwt)
Average Age = 4.5 years
Charter-in strategy allows fleet expansion with zero capital outlay& future ownership option via purchase options
Navios Group(2) controls 74 vessels and 7.2 million DWT
19 Capesize
• 10 vessels (1.75 million dwt)
• 9 vessels (1.61 million dwt)
• 3 vessels (0.54 million dwt)
One of the largest fleet among US-listed dry bulk carriers
6 Handysize
• 5 vessels (0.17 million dwt)
• 5 vessels (0.17 million dwt)
• 1 vessel (1)
(0.02 million dwt)• 5 vessels
(0.38 million dwt)• 12 vessels
(0.64 million dwt)
• 9 vessels (0.72 million dwt)

15
Fleet Growth Strategy
9,555
13,410
16,138
8,899
4,000
8,000
12,000
16,000
20,000
2008 2009 2010 2011
Available Days (1)
(1) Excludes COAs, Kleimar controlled Fleet and Navios Logistics’ Fleet
Equivalent Vessels (1)
26.5
37.3
44.8
24.7
20
25
30
35
40
45
50
2008 2009 2010 2011

1616
Attractive Charter-Out Rates with Creditworthy Parties
Top Ten Charter PartiesCharterer % of Total Charter-Out Revenue (2)
Cosco Bulk Carriers 20.4% Mitsui O.S.K. Lines Ltd. 15.4% Korea Line Corp 12.9% Daiichi Chuo Kisen Kaisha 6.3% Sanko 5.3% STX Pan Ocean Co. Ltd. 3.9% Emirates Trading Agency 3.5% Shinwa 3.2% Samsun Logix 3.0% Sangamon Trans Grp 2.9%
Total: 76.8%
Contracted Revenue(1)
2008: $217.3 million2009: $223.0 million2010: $245.2 million2011: $218.3 million
Average Daily Charter Rate
$24,760
$33,277$36,578 $37,929
$21,479
$10,000
$15,000
$20,000
$25,000
$30,000
$35,000
$40,000
2007 2008 2009 2010 2011
Average Daily Charter-out Rate
High utilization ratesEarnings visibilitySteady cash flowDownside protection in challenging markets
Time Charter Strategy
(1) Excludes COAs, Kleimar controlled Fleet and Navios Logistics’ Fleet
% Days Contracted
36%
50%
70%
99%
0%
20%
40%
60%
80%
100%
2008 2009 2010 2011
% Days Contracted
AA insurance on all charters-out
(2) Years 2008 through 2010
1717
Efficient, Low Cost Operator with Favorable Charters-in
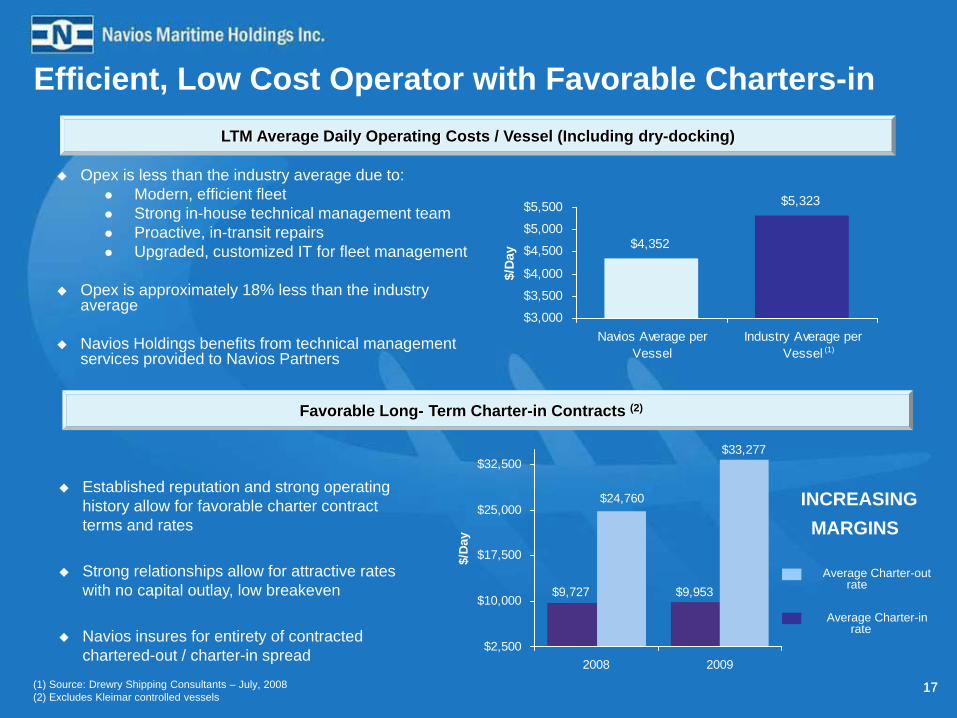
Opex is less than the industry average due to:Modern, efficient fleetStrong in-house technical management team Proactive, in-transit repairs Upgraded, customized IT for fleet management
Opex is approximately 18% less than the industry average
Navios Holdings benefits from technical management services provided to Navios Partners
LTM Average Daily Operating Costs / Vessel (Including dry-docking)
$4,352
$5,323
$3,000
$3,500
$4,000
$4,500
$5,000
$5,500
Navios Average perVessel
Industry Average perVessel
$/Da
y
(1)
(1) Source: Drewry Shipping Consultants – July, 2008(2) Excludes Kleimar controlled vessels
Favorable Long- Term Charter-in Contracts (2)
Established reputation and strong operating history allow for favorable charter contract terms and rates
Strong relationships allow for attractive rates with no capital outlay, low breakeven
Navios insures for entirety of contracted chartered-out / charter-in spread
$9,727 $9,953
$33,277
$24,760
$2,500
$10,000
$17,500
$25,000
$32,500
2008 2009
$/D
ay
Average Charter-out rate
Average Charter-in rate
INCREASINGMARGINS
Navios Maritime Partners
19
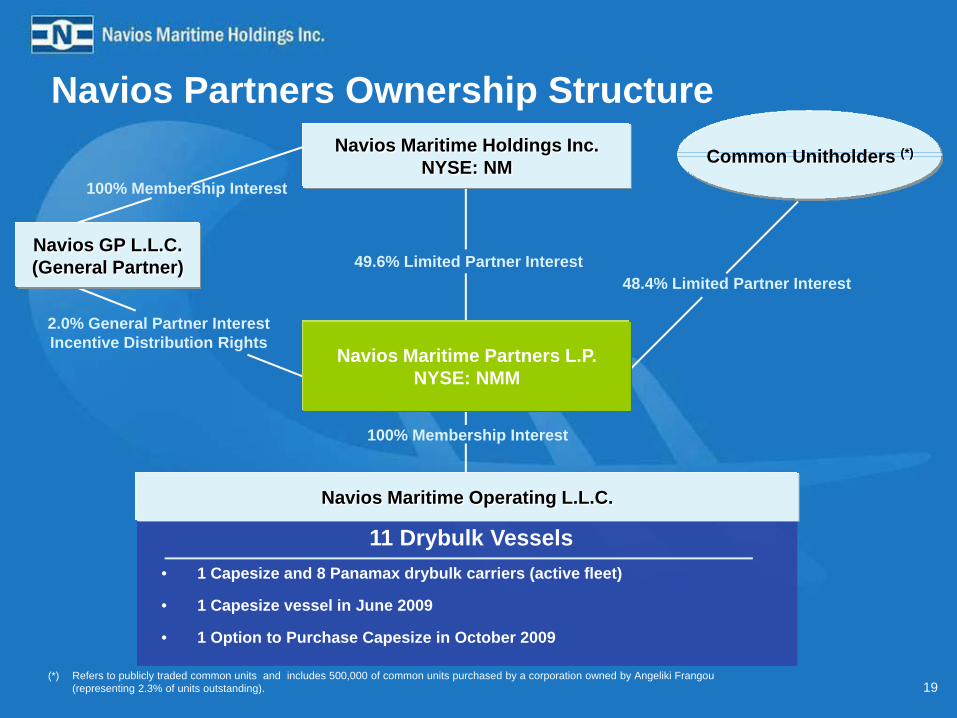
Navios Partners Ownership Structure
100% Membership Interest
2.0% General Partner InterestIncentive Distribution Rights
48.4% Limited Partner Interest49.6% Limited Partner Interest
11 Drybulk Vessels• 1 Capesize and 8 Panamax drybulk carriers (active fleet)
• 1 Capesize vessel in June 2009
100% Membership Interest
Navios GP L.L.C.(General Partner)
Navios Maritime Partners L.P.NYSE: NMM
Navios Maritime Operating L.L.C.
Common Unitholders (*)Navios Maritime Holdings Inc.NYSE: NM
(*) Refers to publicly traded common units and includes 500,000 of common units purchased by a corporation owned by Angeliki Frangou (representing 2.3% of units outstanding).
• 1 Option to Purchase Capesize in October 2009
20
NMM: Transactional and Strategic Overview• NMM’s Strategy
– Create durable cash flow for investors• Replacement reserve from operating cash for asset renewals
– Business Model • Panamax and Capesize vessels w/ target charter period of > 3 years • Pursue growth strategy – multiple avenues for growth• Excludes FFA / Short term chartering / COA • Excludes technical and commercial management
• NMM benefits from NM relationship– Proven source of new assets to grow the MLP– Proven network of strong relationships– Seasoned management providing:
• technical management• commercial management• administrative services
• Omnibus Agreement – Governs relationship between NM and NMM for future vessel acquisitions, etc.

Navios South American Logistics

22
Creation of Navios South American Logistics
• Acquired 51% interest in Horamar for $112.2 million cash• Horamar is a South American operator of barges and upriver port terminal with 30+
years operating history• Combined Navios’ port terminal business with Horamar’s barge and upriver port• Navios owns 63.8% of Navios Logistics (Lopez family own the remaining 36.2%)• Transaction Rationale:
– Critical mass for South American logistics business • Complementary business• Eventual Spin off
– Assets complementary to Navios Port Terminal– Strong presence in inland waterway transportation in the Hidrovia region of
Argentina, Bolivia, Brazil, Paraguay and Uruguay– Create platform capitalizing on region’s growing agricultural and mineral exports– Attractive valuation for consideration paid : 8.4x -9.3x 2008F EBITDA– Attractive valuation for Navios Port Terminal (15x 2007E EBITDA)

23
Navios South American LogisticsGroup Structure
23
Navios South American Logistics Inc(Marshall Islands)
100%
Horamar S.A
• 240 wet and dry barges• 1 Port - Paraguay• Fleet employed in Argentine cabotage business
(four product oil tankers):- Malva H delivered on January 13, 2008 - Estefania H delivered on July 25, 2008 - Makenita: expected delivery in Q4 2008- Sara H: expected delivery in Q4 2009
Corporación Navios S.A.
Port Terminal – Nueva Palmira –Uruguay (tax free zone)
2424
Navios Logistics Fleet Expansion• Fleet expansion:
– Acquisition of six convoys at approximately $72.0 million– Financing: $70.0 million Loan Facility– Secured Long-Term Cash Flow:
• 3 & 5 year agreements with two major commodity producers • Starting operations in Q4 2008
• Fleet employed in Argentine cabotage business:– Malva H delivered on January 13, 2008
• Product Oil Tanker, built in 2007, dwt 9,947• Employed as of February 2, 2008• Chartered for minimum four years (plus charterer’s option to extend for two years)
– Estefania H delivered on July 25, 2008• Product Oil Tanker, built in 2008, dwt 12,000• Employed as of August 2, 2008
– Makenita: expected delivery in Q4 2008• Product Oil Tanker, dwt 17,000
– Sara H: expected delivery in Q4 2009• Product Oil Tanker, dwt 9,000
• Navios Logistics will control a fleet of 240 barges and vessels transporting wet and dry cargo

25
Industry Overview

BDI Index 2006 - 2008Forward expectations remain strong …
0
2000
4000
6000
8000
10000
12000
14000
JAN
JAN
JAN
FEB
FEB
FEB
MARMAR
APR
APR
APR
MAYMAYJUN
JUN
JUN
JUL
JUL
JUL
AUG
AUG
AUGSEP
SEP
OCT
OCTOCTNOVNOVNOVDEC
DECin
dex
poin
BDI 2006
BDI 2007
BDI 2008
Forward Curve Q4
Forward Curve SEP
….. despite continuing worldwide credit and equity concerns
Source: The Baltic Exchange
27272727
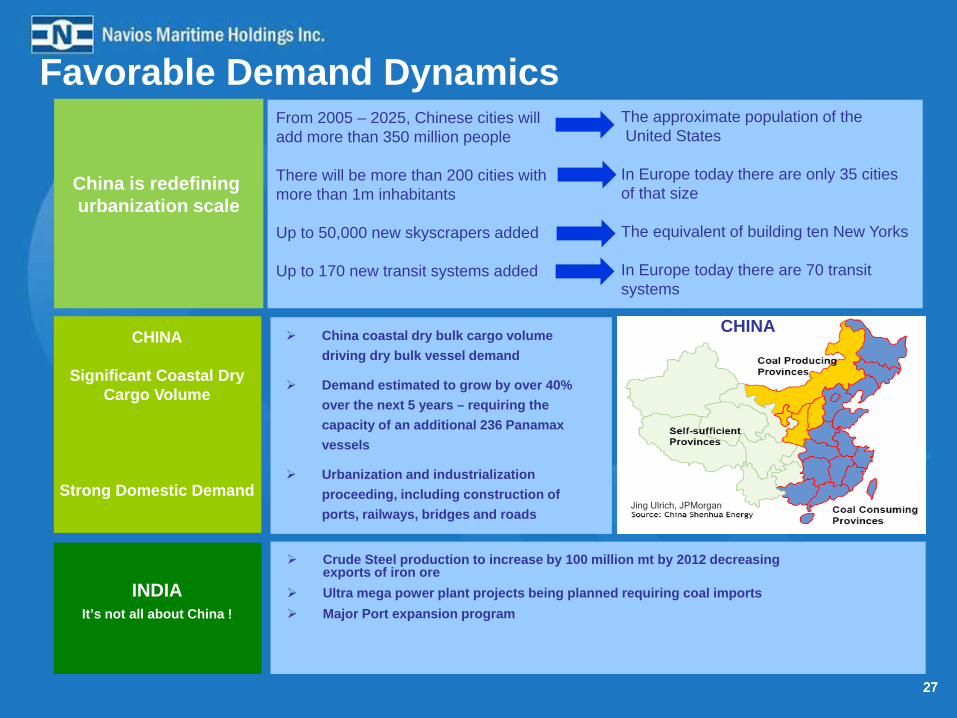
Favorable Demand Dynamics
CHINA
Significant Coastal Dry Cargo Volume
Strong Domestic Demand
China coastal dry bulk cargo volume driving dry bulk vessel demand
Demand estimated to grow by over 40% over the next 5 years – requiring the capacity of an additional 236 Panamax vessels
Urbanization and industrialization proceeding, including construction of ports, railways, bridges and roads
CHINA
Jing Ulrich, JPMorgan
INDIAIt’s not all about China !
Crude Steel production to increase by 100 million mt by 2012 decreasingexports of iron ore Ultra mega power plant projects being planned requiring coal importsMajor Port expansion program
China is redefining urbanization scale
From 2005 – 2025, Chinese cities will add more than 350 million people
There will be more than 200 cities with more than 1m inhabitants
Up to 50,000 new skyscrapers added
Up to 170 new transit systems added
The approximate population of theUnited States
In Europe today there are only 35 cities of that size
The equivalent of building ten New Yorks
In Europe today there are 70 transit systems
28
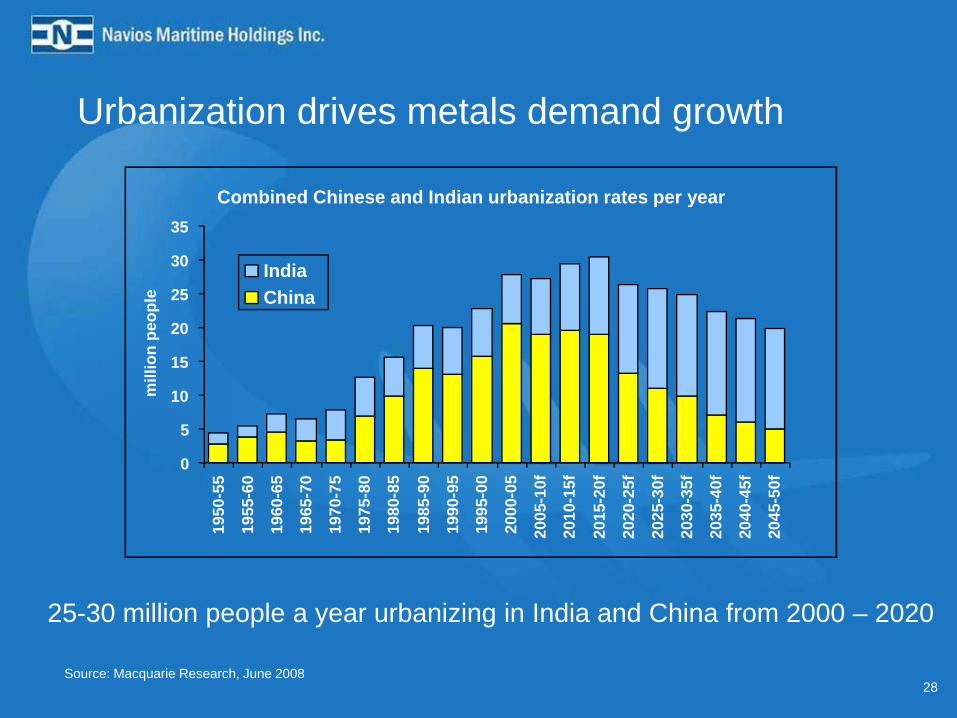
25-30 million people a year urbanizing in India and China from 2000 – 2020
Combined Chinese and Indian urbanization rates per year
0
5
10
15
20
25
30
3519
50-5
5
1955
-60
1960
-65
1965
-70
1970
-75
1975
-80
1980
-85
1985
-90
1990
-95
1995
-00
2000
-05
2005
-10f
2010
-15f
2015
-20f
2020
-25f
2025
-30f
2030
-35f
2035
-40f
2040
-45f
2045
-50f
mill
ion
peop
le
IndiaChina
Urbanization drives metals demand growth
Source: Macquarie Research, June 2008

29
Trade growth mainly China and mainly iron ore
29
Annual Changes in Seaborne Demand
-30-20-10
0102030405060708090
100110120
1977
1978
1979
1980
1981
1982
1983
1984
1985
1986
1987
1988
1989
1990
1991
1992
1993
1994
1995
1996
1997
1998
1999
2000
2001
2002
2003
2004
2005
2006
2007
2008
f20
09f
2010
f20
11f
2012
f
m to
nnes
cha
nge
Outside ChinaChina
China’s future role is even greaterSource: Macquarie Research, June 2008

30
Drybulk Vessels – Supply vs. Aging Fleet• Order book includes 181.1 mdwt (44.5% of fleet) of scheduled deliveries through 2010(1)
– New vessels ordered today will not be delivered until 2011– Substantial greenfield (red) and inexperienced (gray) shipyard risk– Capesize orderbook to be built at 31 yards – only 13 of them have built Capes before (2)
– Slippage of newbuilding deliveries has occurred
(1) Source: Drewry Shipping Consultants, Ltd. (August 2008)(2) Source: Howe Robinson (January 2008)(3) Source: SSY’s Dry Bulk Forecaster (August 2008)(4) Source: SSY (July 2008)
29%
16%
0%
10%
20%
30%
40%
50%
Total Drybulk Fleet Total Drybulk Fleet
Over 20 Years Old Over 25 Years Old
Drybulk Industry Age Profile (% dwt) (3)
0102030405060708090
100
Handy Handymax Panamax Cape
%
Established New Entrant (size) New Entrant (Type)
Given strong market conditions, older vessels are not being actively scrapped
Dry Bulk Orderbook by Type of Builder: Share of 2009/2010 Orders (4)

31
Financial Highlights: Q2 2008 and H1 2008
32
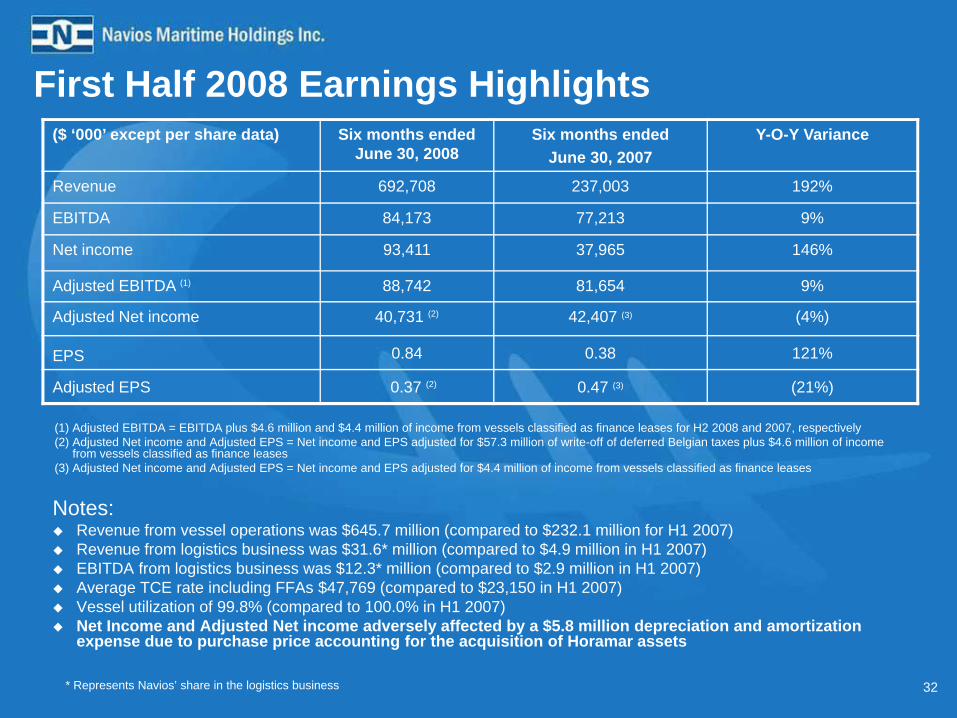
First Half 2008 Earnings Highlights
Notes: Revenue from vessel operations was $645.7 million (compared to $232.1 million for H1 2007)Revenue from logistics business was $31.6* million (compared to $4.9 million in H1 2007)EBITDA from logistics business was $12.3* million (compared to $2.9 million in H1 2007)Average TCE rate including FFAs $47,769 (compared to $23,150 in H1 2007)Vessel utilization of 99.8% (compared to 100.0% in H1 2007)Net Income and Adjusted Net income adversely affected by a $5.8 million depreciation and amortization expense due to purchase price accounting for the acquisition of Horamar assets
($ ‘000’ except per share data) Six months ended June 30, 2008
Six months ended June 30, 2007
Y-O-Y Variance
Revenue 692,708 237,003 192%
EBITDA 84,173 77,213 9%
Net income 93,411 37,965 146%
Adjusted EBITDA (1) 88,742 81,654 9%
Adjusted Net income 40,731 (2) 42,407 (3) (4%)
EPS 0.84 0.38 121%
Adjusted EPS 0.37 (2) 0.47 (3) (21%)
* Represents Navios’ share in the logistics business
(1) Adjusted EBITDA = EBITDA plus $4.6 million and $4.4 million of income from vessels classified as finance leases for H2 2008 and 2007, respectively(2) Adjusted Net income and Adjusted EPS = Net income and EPS adjusted for $57.3 million of write-off of deferred Belgian taxes plus $4.6 million of income
from vessels classified as finance leases (3) Adjusted Net income and Adjusted EPS = Net income and EPS adjusted for $4.4 million of income from vessels classified as finance leases

33
Second Quarter 2008 Earnings Highlights
Notes: Revenue from vessel operations was $328.9 million (compared to $132.5 million for Q2 2007)Revenue from logistics business was $17.1* million (compared to $3.4 million in Q2 2007) EBITDA from logistics business was $6.9* million (compared to $2.3 million in Q2 2007)Average TCE rate including FFAs $48,390 (compared to $23,909 in Q2 2007)Vessel utilization of 99.7% (compared to 100.0% in Q2 2007)Net Income and Adjusted Net income adversely affected by a $2.8 million depreciation and amortization expense due to purchaseprice accounting for the acquisition of Horamar assets
($ ‘000’ except per share data) Three months ended June 30, 2008
Three months ended June 30, 2007
Y-O-Y Variance
Revenue 354,432 135,865 161%
EBITDA 46,175 42,641 8%
Net income 79,166 23,182 241%
Adjusted EBITDA(1) 48,217 45,578 6%
Adjusted Net income 23,960 (2) 26,119 (3) (8%)
EPS 0.72 0.24 200%
Adjusted EPS 0.22 (2) 0.27 (3) (19%)
(1) Adjusted EBITDA = EBITDA plus $2.0 million and $2.9 million of income from vessels classified as finance leases for Q2 2008 and 2007, respectively(2) Adjusted Net income and Adjusted EPS = Net income and EPS adjusted for $57.3 million of write-off of deferred Belgian taxes plus $2.0 million of income
from vessels classified as finance leases (3) Adjusted Net income and Adjusted EPS = Net income and EPS adjusted for $2.9 million of income from vessels classified as finance leases
* Represents Navios’ share in the logistics business
34
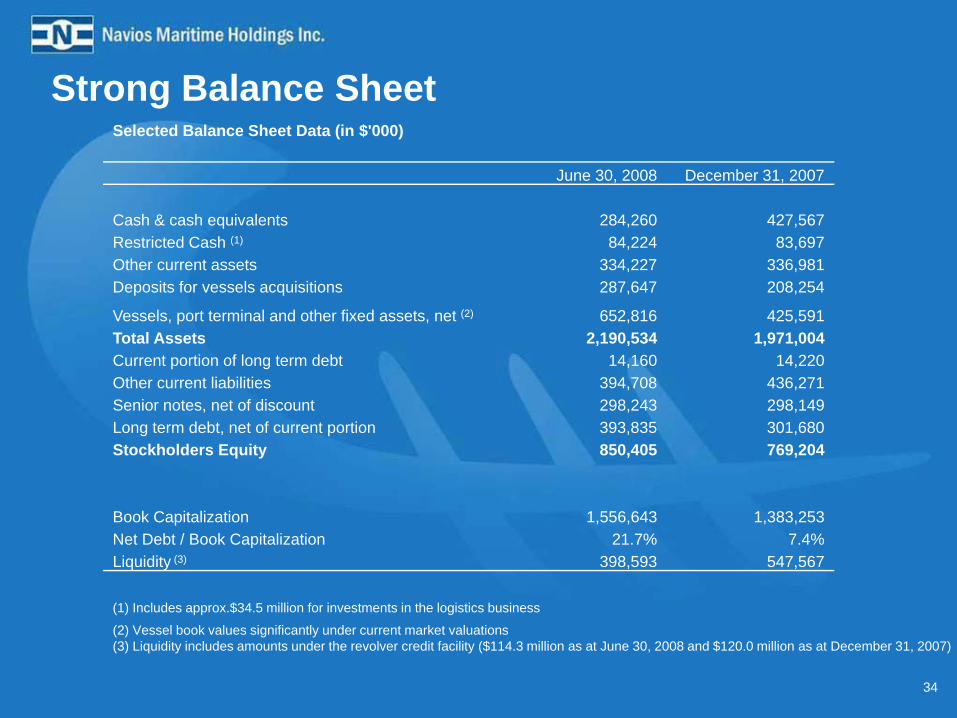
Strong Balance Sheet Selected Balance Sheet Data (in $'000)
June 30, 2008 December 31, 2007
Cash & cash equivalents 284,260 427,567Restricted Cash (1) 84,224 83,697Other current assets 334,227 336,981Deposits for vessels acquisitions 287,647 208,254
Vessels, port terminal and other fixed assets, net (2) 652,816 425,591Total Assets 2,190,534 1,971,004Current portion of long term debt 14,160 14,220Other current liabilities 394,708 436,271Senior notes, net of discount 298,243 298,149Long term debt, net of current portion 393,835 301,680Stockholders Equity 850,405 769,204
Book Capitalization 1,556,643 1,383,253Net Debt / Book Capitalization 21.7% 7.4%Liquidity (3) 398,593 547,567
(1) Includes approx.$34.5 million for investments in the logistics business
(2) Vessel book values significantly under current market valuations(3) Liquidity includes amounts under the revolver credit facility ($114.3 million as at June 30, 2008 and $120.0 million as at December 31, 2007)

35
New Bank Facility
• NM entered into a new Term Loan Facility with DnB Nor Bank ASA for $133.0 million on June 24, 2008
• The proceeds will be used to finance two new-building Capesize vessels delivering in March & June 2010
• 8 year loan (18 year amortization profile)
• Interest rate: LIBOR + 100 bp
• Principal repayments commence only upon the delivery of the vessels
• Principal repayments over 16 equal semiannual installments of $1.85 million each– Annual repayment $3.7 million each (total $7.4 million)– Balloon payment of $36.9 million each (total $73.8 million)

36
Dividend Distribution for Q2 2008
– Proposed dividend distribution for Q2 2008 of $0.09 per share outstanding
– Record Date: September 2, 2008– Payment Date: September 12, 2008– Shares outstanding (NYSE: NM): 104,159,215 (1) (2)
– Warrants outstanding (NYSE: NM WS): 6,903,930 (1)
Buyback Program Update (1)
– Number of shares bought: 3,164,440
(1) As of August 18, 2008
(2) Excludes shares repurchased
37
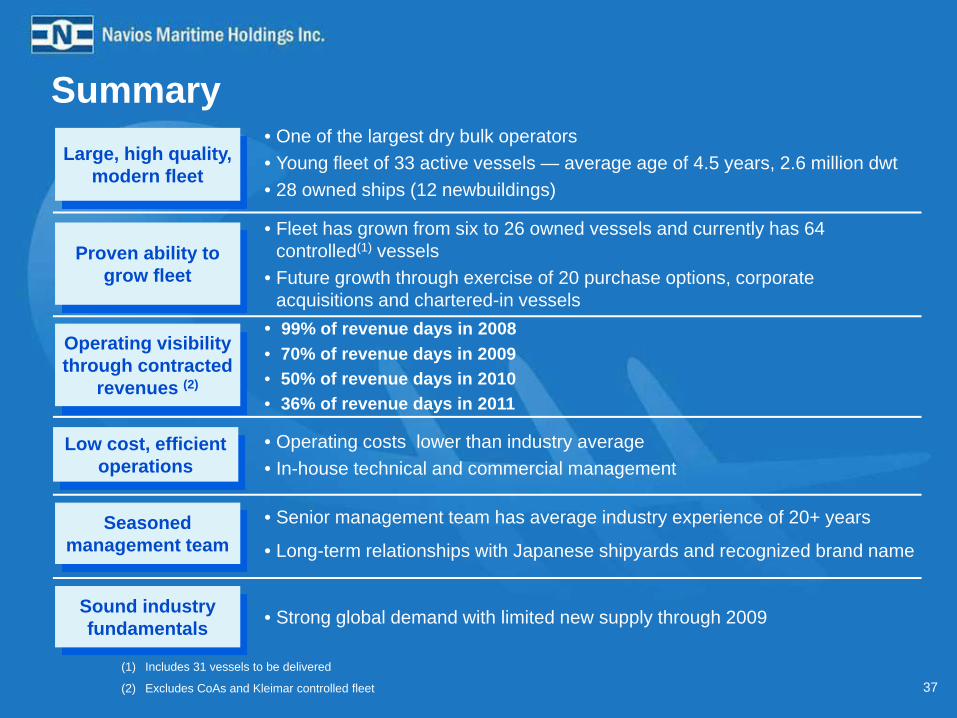
Summary
• Senior management team has average industry experience of 20+ years
• Long-term relationships with Japanese shipyards and recognized brand name
• Operating costs lower than industry average• In-house technical and commercial management
• 99% of revenue days in 2008• 70% of revenue days in 2009 • 50% of revenue days in 2010• 36% of revenue days in 2011
• Fleet has grown from six to 26 owned vessels and currently has 64 controlled(1) vessels
• Future growth through exercise of 20 purchase options, corporate acquisitions and chartered-in vessels
• One of the largest dry bulk operators• Young fleet of 33 active vessels — average age of 4.5 years, 2.6 million dwt• 28 owned ships (12 newbuildings)
Large, high quality, modern fleet
Proven ability to grow fleet
Seasoned management team
Low cost, efficient operations
Operating visibility through contracted
revenues (2)
(1) Includes 31 vessels to be delivered
(2) Excludes CoAs and Kleimar controlled fleet
• Strong global demand with limited new supply through 2009Sound industry fundamentals

Appendix
404040
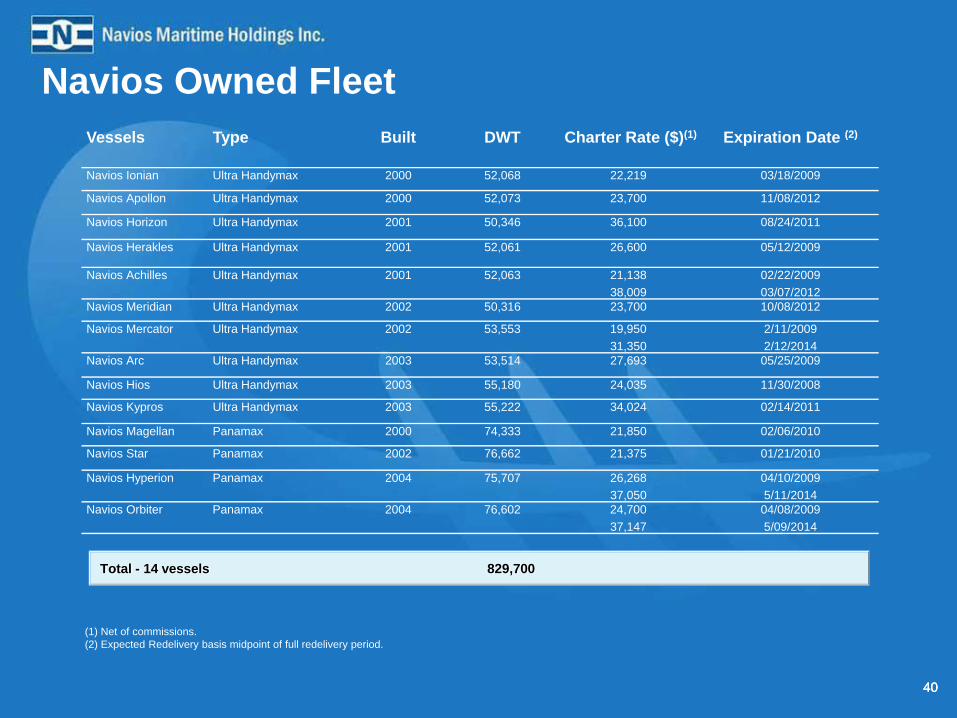
Navios Owned FleetVessels Type Built DWT Charter Rate ($)(1) Expiration Date (2)
Navios Ionian Ultra Handymax 2000 52,068 22,219 03/18/2009
Navios Apollon Ultra Handymax 2000 52,073 23,700 11/08/2012
Navios Horizon Ultra Handymax 2001 50,346 36,100 08/24/2011
Navios Herakles Ultra Handymax 2001 52,061 26,600 05/12/2009
Navios Achilles Ultra Handymax 2001 52,063 21,13838,009
02/22/200903/07/2012
Navios Meridian Ultra Handymax 2002 50,316 23,700 10/08/2012
Navios Mercator Ultra Handymax 2002 53,553 19,95031,350
2/11/20092/12/2014
Navios Arc Ultra Handymax 2003 53,514 27,693 05/25/2009
Navios Hios Ultra Handymax 2003 55,180 24,035 11/30/2008
Navios Kypros Ultra Handymax 2003 55,222 34,024 02/14/2011
Navios Magellan Panamax 2000 74,333 21,850 02/06/2010
Navios Star Panamax 2002 76,662 21,375 01/21/2010
Navios Hyperion Panamax 2004 75,707 26,26837,050
04/10/20095/11/2014
Navios Orbiter Panamax 2004 76,602 24,70037,147
04/08/20095/09/2014
Total - 14 vessels 829,700
(1) Net of commissions. (2) Expected Redelivery basis midpoint of full redelivery period.
414141
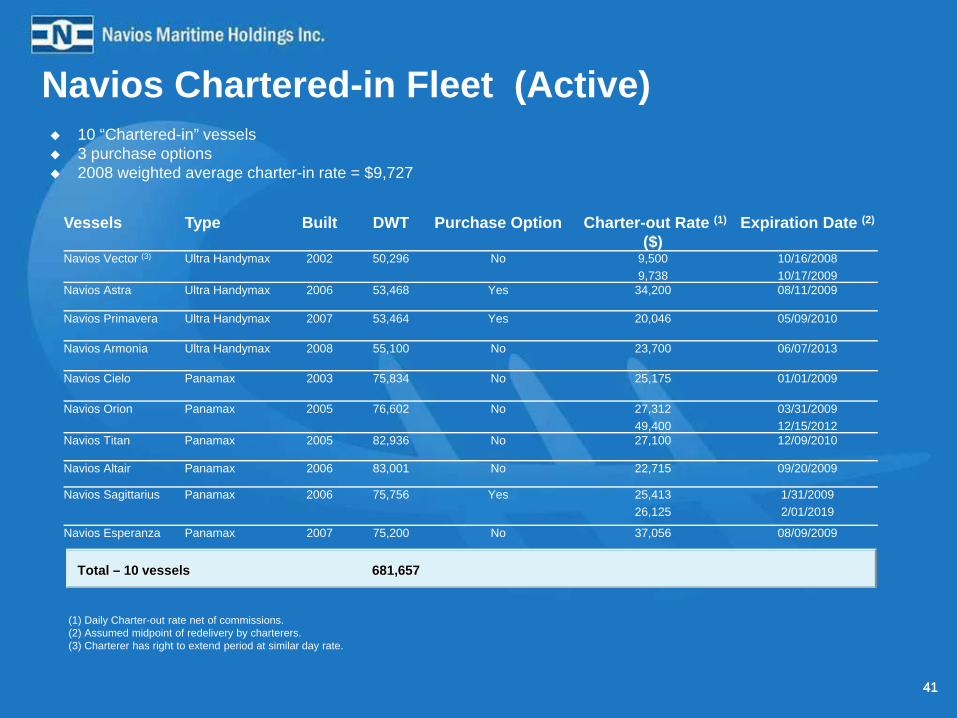
Navios Chartered-in Fleet (Active)
Vessels Type Built DWT Purchase Option Charter-out Rate (1)
($)Expiration Date (2)
Navios Vector (3) Ultra Handymax 2002 50,296 No 9,5009,738
10/16/200810/17/2009
Navios Astra Ultra Handymax 2006 53,468 Yes 34,200 08/11/2009
Navios Primavera Ultra Handymax 2007 53,464 Yes 20,046 05/09/2010
Navios Armonia Ultra Handymax 2008 55,100 No 23,700 06/07/2013
Navios Cielo Panamax 2003 75,834 No 25,175 01/01/2009
Navios Orion Panamax 2005 76,602 No 27,31249,400
03/31/200912/15/2012
Navios Titan Panamax 2005 82,936 No 27,100 12/09/2010
Navios Altair Panamax 2006 83,001 No 22,715 09/20/2009
Navios Sagittarius Panamax 2006 75,756 Yes 25,41326,125
1/31/20092/01/2019
Navios Esperanza Panamax 2007 75,200 No 37,056 08/09/2009
10 “Chartered-in” vessels 3 purchase options2008 weighted average charter-in rate = $9,727
Total – 10 vessels 681,657
(1) Daily Charter-out rate net of commissions.(2) Assumed midpoint of redelivery by charterers.(3) Charterer has right to extend period at similar day rate.
424242
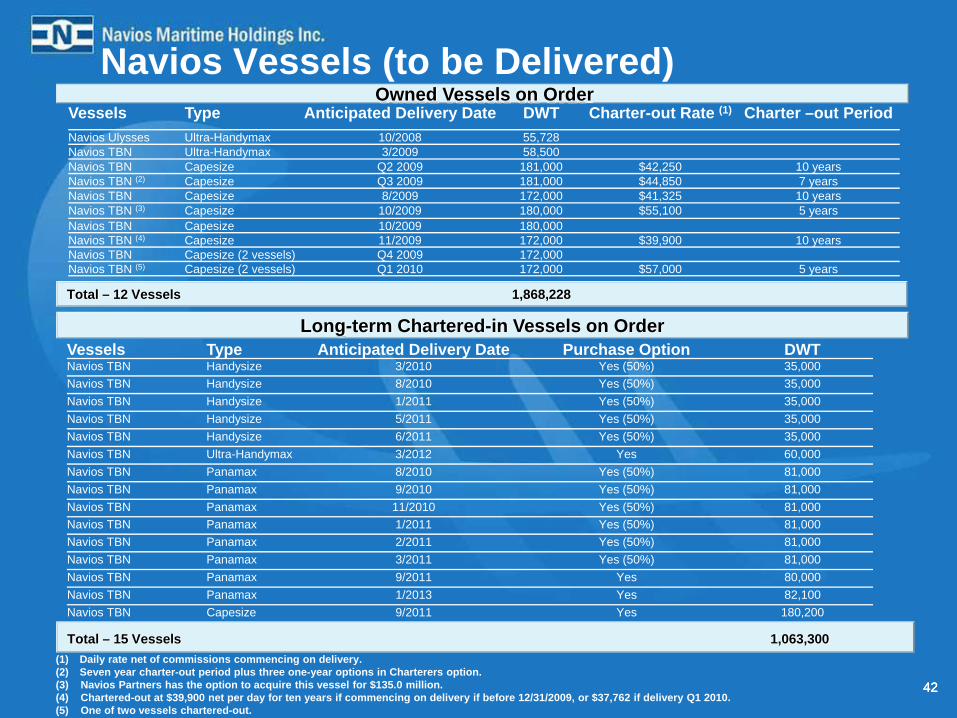
Navios Vessels (to be Delivered)
Vessels Type Anticipated Delivery Date Purchase Option DWTNavios TBN Handysize 3/2010 Yes (50%) 35,000Navios TBN Handysize 8/2010 Yes (50%) 35,000Navios TBN Handysize 1/2011 Yes (50%) 35,000Navios TBN Handysize 5/2011 Yes (50%) 35,000Navios TBN Handysize 6/2011 Yes (50%) 35,000Navios TBN Ultra-Handymax 3/2012 Yes 60,000Navios TBN Panamax 8/2010 Yes (50%) 81,000Navios TBN Panamax 9/2010 Yes (50%) 81,000Navios TBN Panamax 11/2010 Yes (50%) 81,000Navios TBN Panamax 1/2011 Yes (50%) 81,000Navios TBN Panamax 2/2011 Yes (50%) 81,000Navios TBN Panamax 3/2011 Yes (50%) 81,000Navios TBN Panamax 9/2011 Yes 80,000Navios TBN Panamax 1/2013 Yes 82,100Navios TBN Capesize 9/2011 Yes 180,200
Long-term Chartered-in Vessels on Order
Total – 15 Vessels 1,063,300
Owned Vessels on OrderVessels Type Anticipated Delivery Date DWT Charter-out Rate (1) Charter –out PeriodNavios Ulysses Ultra-Handymax 10/2008 55,728Navios TBN Ultra-Handymax 3/2009 58,500Navios TBN Capesize Q2 2009 181,000 $42,250 10 yearsNavios TBN (2) Capesize Q3 2009 181,000 $44,850 7 yearsNavios TBN Capesize 8/2009 172,000 $41,325 10 yearsNavios TBN (3) Capesize 10/2009 180,000 $55,100 5 yearsNavios TBN Capesize 10/2009 180,000Navios TBN (4) Capesize 11/2009 172,000 $39,900 10 yearsNavios TBN Capesize (2 vessels) Q4 2009 172,000Navios TBN (5) Capesize (2 vessels) Q1 2010 172,000 $57,000 5 years
Total – 12 Vessels 1,868,228
(1) Daily rate net of commissions commencing on delivery.(2) Seven year charter-out period plus three one-year options in Charterers option.(3) Navios Partners has the option to acquire this vessel for $135.0 million.(4) Chartered-out at $39,900 net per day for ten years if commencing on delivery if before 12/31/2009, or $37,762 if delivery Q1 2010.(5) One of two vessels chartered-out.
434343
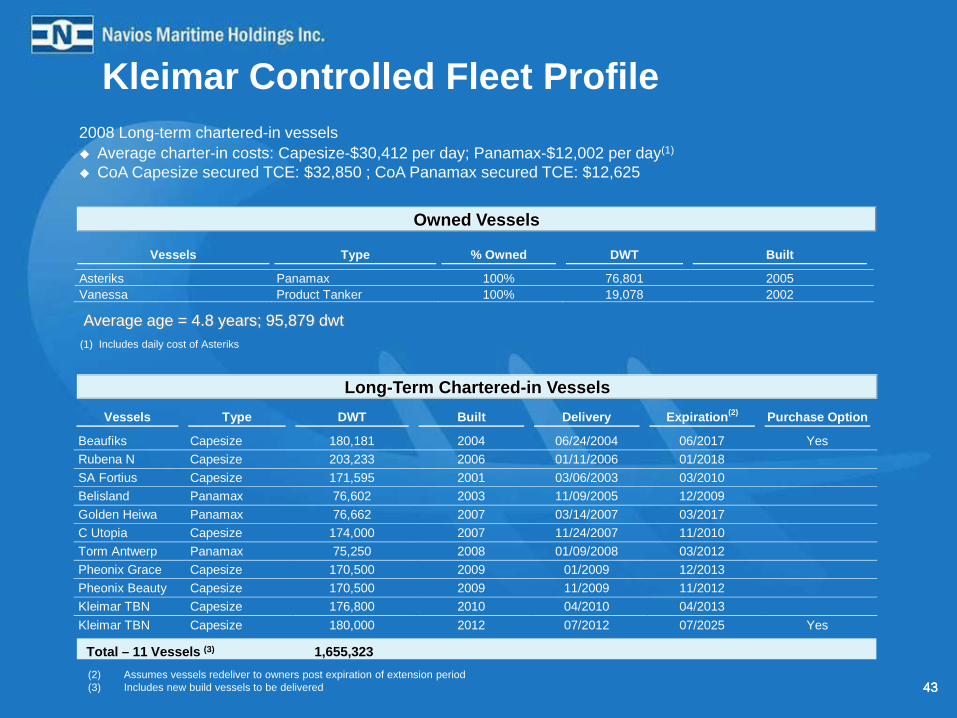
Kleimar Controlled Fleet Profile2008 Long-term chartered-in vessels
Average charter-in costs: Capesize-$30,412 per day; Panamax-$12,002 per day(1)
CoA Capesize secured TCE: $32,850 ; CoA Panamax secured TCE: $12,625
(2) Assumes vessels redeliver to owners post expiration of extension period(3) Includes new build vessels to be delivered
Long-Term Chartered-in Vessels
Vessels Type % Owned DWT Built
Asteriks Panamax 100% 76,801 2005 Vanessa Product Tanker 100% 19,078 2002
Owned Vessels
Vessels Type DWT Built Delivery Expiration(2) Purchase Option
Beaufiks Capesize 180,181 2004 06/24/2004 06/2017 Yes Rubena N Capesize 203,233 2006 01/11/2006 01/2018 SA Fortius Capesize 171,595 2001 03/06/2003 03/2010 Belisland Panamax 76,602 2003 11/09/2005 12/2009 Golden Heiwa Panamax 76,662 2007 03/14/2007 03/2017 C Utopia Capesize 174,000 2007 11/24/2007 11/2010 Torm Antwerp Panamax 75,250 2008 01/09/2008 03/2012 Pheonix Grace Capesize 170,500 2009 01/2009 12/2013 Pheonix Beauty Capesize 170,500 2009 11/2009 11/2012 Kleimar TBN Capesize 176,800 2010 04/2010 04/2013 Kleimar TBN Capesize 180,000 2012 07/2012 07/2025 Yes
(1) Includes daily cost of Asteriks
Total – 11 Vessels (3) 1,655,323
Average age = 4.8 years; 95,879 dwt


