54
1 Navy Maintenance Reducing Initiatives and Ship’s Material Condition Visibility Rick Leeker

1
Navy Maintenance ReducingInitiatives and Ship’s Material
Condition Visibility
Rick Leeker

2
Agenda
§ Program Description
§ Initiative Overview
§ SEA 05N
§ Hardware
§Model
§ SEA 04RM (ePMA)
§ Summary

3
§ Capital Investment for Labor – ASN (RD&A) directed program to reduce Sailor workload and improve shipboard Quality of Life.
§ Common Ship – Addresses common problems applicable across multiple ship classes and equipment with an eye towards reducingSailor workload and operating costs.
§ Surface Ship Maintenance – Continuous review of ship maintenance requirements to ensure they are applicable and effective.
§ All areas endorsed by Fleet § Specific technologies approved by the Cost Reduction and
Effectiveness Improvement (CREI) Council
SEA 05N/04RM Programs

4
§ Magnetic Couplings § Mechanical Seals § Composites § Ventilation § Calibration Reduction § Tank Level Indicators § Tank Monitoring § Sanitary Spaces § Durable Easy Care Tile § Preservation Teams § Motor testers§ Ultrasonic Tester§ Diesel Monitoring§ Ceramic Bearings
Navy Technologies with Common Application to the Coast Guard
§ Hand Tools § Anti-Stain Paints § Bilge Preservation § Nonskid Preservation § Water Tight Doors § Water-jetting § Superbolt§ Mounting Foundation Levelers § Self Cleaning Lube/Fuel Oil
Filter § IR Cameras§ Centrifugal Oil Filters§ TOMS Oil monitoring§ Valve Tester

5
Fleet Feedback

6
Old Style Coupling
New Magnetic Coupling
Problem:
Solution:
• Alignments are time consuming• Poor alignment causes premature
seal and bearing failure• Leads to coupling and motor
winding failures
Magnetic Couplings
• Eliminate precision alignments• Coupling maintenance• Increase bearing and seal life• Lower starting current for electric motors
Magnetic Couplings

7
Installation Status
IndustryIn use throughout industry in 100s of applications:
Mine rock crushers and conveyor beltsCommercial marine usePetroleum and refinery applications
NavyPassed Shock, Vibration, and EMI Testing Installed Couplings:
More than 130 couplings installed161 procured during FY03Plan to install 700+ couplings on surface combatantsWorking on CVN installations
USS CARNEY (DDG-64)Magnetic Coupling Installation
on Seawater Service Pump

8
Magnetic Couplings
USS CARNEY (DDG-64) Case Study:• #2 seawater service pump experienced recurring leakage and premature failure
of standard mechanical seals Mechanical seals were failing about every 4 months
• Documented annual expenditures for this pump for each of the two previousyears had been
– $27k for pump due to failed mechanical seals– 230 IMA man-hours and
– 14 ship’s force man-hours for corrective maintenance
• In April of 2001, a Chesterton 442 Split Mechanical Seal & a Rexnord Magnalink Magnetic Coupling were installed on the #2 seawater pump
• 12 May 2003 inspection of the #2 seawater service pump observed:– No visual evidence of seal leakage or premature wear– The new mechanical seals have never leaked during their
2-year service period. USS CARNEY

9
Problem:
Solution:
• 85% of of installed mechanical seals fail with 6 – 12 months of installation
• Sailors currently spend 12 Sailor-days per year per pump repairing and replacing mechanical seals.
• Use of improved Mechanical Seals allows easier replacement, better reliability and they last longer to cut maintenance costs.
• Installation of commercial off-the-shelf split, cartridge, and gas seals can increase service life to two plus years.
• Improved seals decrease installation difficulties to reduce Sailor pump maintenance burden.
Mechanical Seals

10
Split Mechanical Seals
Specifications
Temperature range: to 500 degrees F
System pressure: 25” vacuum to 400 psig
Shaft speed: 3600 rpm
Available sizes: 2.625 to 3.5 inches
Navy application: Seawater & Freshwater
Benefits
• Increased reliability
• Field repairable
• Simple installation
• Future seals do not require pump disassembly
• Static shaft O-ring - held in a captive groove- easy installation and
rebuilding - no adhesive needed
USS MONTEREY (CG-61) pump with split mechanical seal

11
Cartridge Mechanical Seals
Specifications
Temperature range: -20 oF to 500 oF
System pressure: Full vacuum to 300 psig
Shaft speed: 500 to 7,000 rpm
Available sizes: 1-1/8” to 3-1/2”
Navy application: Lube Oil Systems
Benefits
• Reduced installation time from 96 hours to 2 hours
• Service life increased to 2 yrs
• Fits most pumps without seal chamber modification
• Cartridge design for easy installation
• No small springs to clog
• Dynamic O-ring hang-up eliminated (cause of most seal failures)

12
Gas Mechanical Seals
Specifications
Temperature range: -40 to 500 oF
System pressure: 25” vacuum to 200 psig
Shaft speed: 500 to 7,000 rpm
Available sizes: 1 to 3 inches
Navy application: Fuel Oil and Lube Oil
Benefits
• Zero leakage without pump shaft modification
• Non-contacting seal faces provides for seal life expectancy of 3-5 years minimum
• Simple installation
• Dynamic O-ring hang-up eliminated (cause of most seal failures)
• Rides on gas seal

13
§ Problem: – Current tools used to assess WTD integrity,
Freon leaks, compartment integrity, bearing condition, and fluid leaks are subjective and inaccurate
§ Solution:– Ultrasonic testers replace
• chalk lines, • flashlights, • soap suds, • stethoscopes, • and electronic Freon sniffers
§ Benefits• Eliminates false findings • Easy to use• Ventilation status does not impact ability to find
leaks
Ultrasonic Hand Held Tester

14
§ Usage:• More accurate than current tools• Average Sailor can use with only
minimal training • Use in high noise areas does not
affect performance• Problems and checks can be done
more efficiently (less time)
§ Status:• NAVSEA pursuing funding to
outfit Fleet• All Surface Ships will have 5
testers per ship• CVN/CV, LHA, LHD, and AS
ship classes will have 10 testers per ship
Ultrasonic Hand Held Tester

15
§ USS ASHLAND LSD-48 Case Study– Electric lube oil pumps for #MRG could
not provide full flow and pressure, ship was unable to isolate problem
– Tool used by Port Engineer to identify failing pump gear train and bearings
§ USS GUNSTON HALL LSD-44 Case Study:– SWS discharge valve– Tool used by Ship’s Force to determine
leaking valve
Ultrasonic Hand Held Tester
16
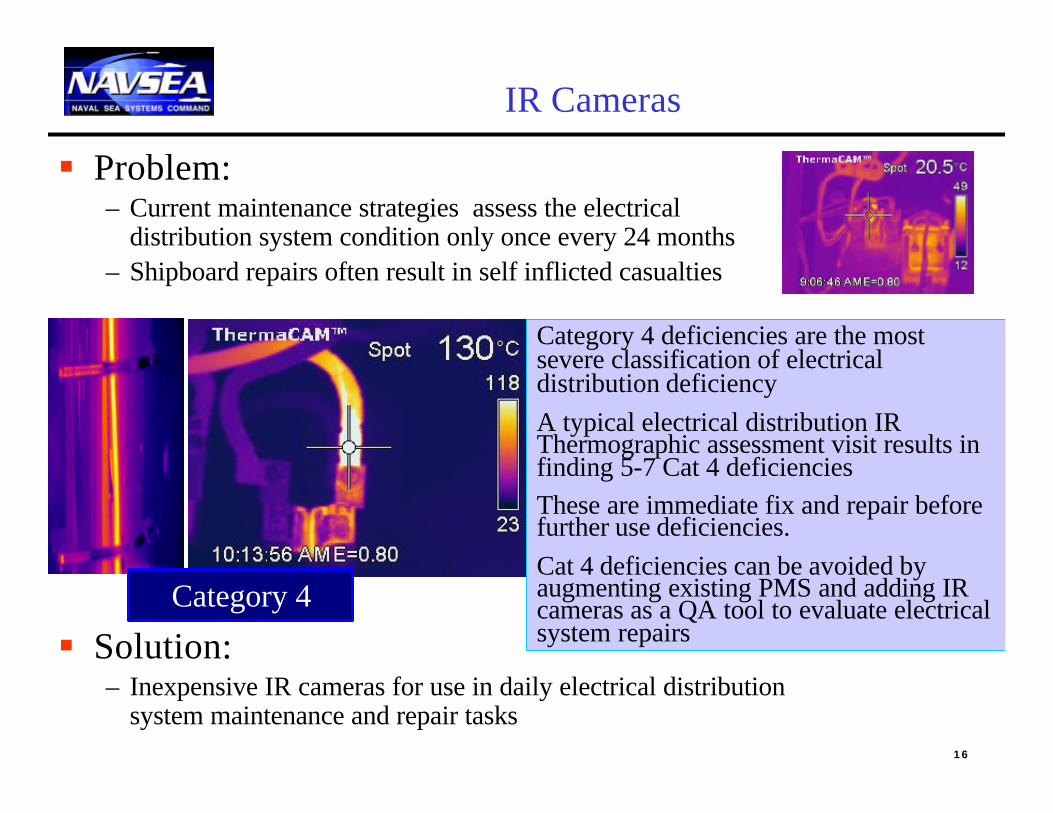
§ Problem:– Current maintenance strategies assess the electrical
distribution system condition only once every 24 months– Shipboard repairs often result in self inflicted casualties
§ Solution:– Inexpensive IR cameras for use in daily electrical distribution
system maintenance and repair tasks
IR Cameras
Category 4 deficiencies are the most severe classification of electrical distribution deficiencyA typical electrical distribution IR Thermographic assessment visit results in finding 5-7 Cat 4 deficienciesThese are immediate fix and repair before further use deficiencies.Cat 4 deficiencies can be avoided by augmenting existing PMS and adding IR cameras as a QA tool to evaluate electrical system repairs
Category 4

17
§ Benefit:– Based on FTSCPAC studies cost avoidance on a FY basis would be
$3.6M Fleet-wide – Eliminates self inflicted casualties caused by improper repair techniques – Identify component failure, overheating and overload conditions before
failure occurs – Eliminates guess work in determining the condition of wiring insulation
for motors, controllers, power and fuse panels
IR Cameras
Category 4Category 1

18
§ Status– NAVSEA 04RM conducted shipboard testing in
2002.– Test results recommended IR cameras for use in
conducting electrical distribution equipment PMS and use as a final QA tool for assessing repairs.
– Two cameras were evaluated as cost effective and ready for shipboard use, and have a service life of >5yrs.
• ISI ‘Snap Shot’, $8K• Flir model 2E, $14K
– NAVSEA is seeking funding to outfit Fleet • One camera per surface ship • Two cameras per carrier and ships with repair
departments
IR Cameras
ISI ‘Snap shot’
FLIR Model 2E

19
§ Problem:– Current overhaul and maintenance strategies
• Hard time events• Valves are overhauled before wear out• Valves not needing repair are unnecessarily
overhauled
§ Solution:– In place portable valve testers that can
identify mistimed, damaged, and leaking valves
• Motor operated • Air operated • Hydraulic operated • Control • Regulators (i.e. Leslie)• Check valves
Valve Testing

20
§ Benefit– Replaces multi-meters, and stethoscopes
for valve testing and setting– Valve conditions can be trended– Valves can be rapidly timed and set
§ Status– NAVSEA will be conducting shipboard
testing in mid summer
Valve Testing

21
ICAS
Opt
ion
Alerts ModelAlgorithm
SNAPOMMS
2Ks
INTask
OUTTask
Alerts SKED
1
1
1
Do
1
1
2
4
3
3
3
2
2
4
Complete
Complete
4N/A
N/A
Record
1
1
1
1
Non-ICAS EquipProblems via SNAP
Completed Work
Completed Work
3
ContinuousTask UpdatesBased on new parameters
2 4
ContinuousCompletion
ScheduledEvents 3
PDA
MCM Prototype Nr. Two – Paperless Logs
Record
Check

22
CNO Goals and Guidance
NAVOP 008/00 (DTG 191605Z JUL 00), Paragraph 41. Develop and implement standardized, configuration-linked assessment criteria across the
Fleet using common material condition metrics and assessment procedures.
2. Incorporate methodology to support continual assessment process improvement and elimination of duplicative events.
3. Consolidate all Fleet material condition data into a single data warehouse and provide easy and timely access to all users.
Develop procedures to determine key areas to reduce sailor workload and improve Fleet material readiness.
CNO Guidance for 20041. We must:
– Improve our use of modeling
– Develop and improve output metrics to better define our requirements and resource needs
2. Deliver the right readiness (Action Items for 2004)
3. We must refine our training, maintenance and interdeployment readiness processes to increase our operational availability.
4. Develop a performance measurement system within the Integrated Readiness Capabilities Assessment (IRCA) process to equate funding inputs to expected levels of readiness outputs.

23
Why Measure Material Condition?
Material condition is a key component of ReadinessThe output of the maintenance process is ships in adequate material condition; materially capable of performing their mission.
ReadinessSupply
Personnel
Training
Capability / Capacity
Readiness - The capability to provide well maintained, adequately supplied platforms with sufficient resources to carry out required Naval missions and functions
Material Condition
Material Condition

24
Material Condition Model
Levelof
Indenture
“Warfare” mFOMWarfare
Area
“Functional”mFOM
L1(Function)(A) (B) (C) (D)
“System” mFOML2(System)
(AA) (AA)
“Equipment” mFOML3(Subsystem)
“Component” mFOM
“Sub-Component”mFOM
2 K (or ICAS data, CASREP)

25
MRS Cost = #####Industrial Man-days = ####Time = ####Who’s Availability -> T1 – T4
• Material Condition Index Value = 0 to 1• Specific Warfare Area Impacts:
JSN EIC_DESC ASU C2W CCC FSO INT LOG MIW MOB MOS NCOEM01-1850 STBD MAIN REDUCT 0.072067 0.000000 0.000000 0.066021 0.070983 0.000000 0.036158 0.063660 0.000000 0.071355EM01-1891 MN PRPLN DENG 1B 0.027673 0.000000 0.000000 0.024553 0.026646 0.000000 0.022506 0.023897 0.000000 0.026786
• Listing of like work• Listing of Approved Availabilities• Available Costing Data
RMAIS
Screening Process Data Flow
ModelAlgorithm2 Kilo
2-Kilo is assigned to availability
Screening Info
2 Kilo Info
Historical Data

26
mFOM 1.0 and mFOM 2.0 Difference
FiremainSystem
Zone 3 Zone 2 Zone 1
Pump 6 Pump 5 Pump 4 Pump 3 Pump 2 Pump 1
X
X X
mFOM 2.0 Representation of Firemain System
Rollup causes Zone 3 to show loss of capability
Ship’s FiremainZone 3 Zone 2 Zone 1
1234X X6 5
§ mFOM 1.0 requires Ship’s Force to use 2K Priority and Job Status (STm) fields to show equipment relationships
– MCC and Severity Codes are fixed– Outcome is subjective as Ship’s Force
manipulates 2 factors to show relationship
Firemain Example
§ mFOM 2.0 takes into account equipment relationship based on model structure with weights and criticalities supplied by Warfighters (COs, XOs, Dept Heads, etc) and Technical Experts (ISEAs)
–Outcome is objective and repeatable across multiple ships and classes
Significance of Failure
No way to show relationship of equipment

27
mFOM 1.0 and mFOM 2.0 Difference
§mFOM 1.0 2K Priority at RMC is a straight combined grouping not an integrated priority.
–Does not allow ability to prioritize between ships of the same class or across classes
–Results may vary
Integration of Work at the RMC
RMC
LowestIntegrated Priority
HighestIntegrated Priority
CGFFG
LSD
LPD
§mFOM 2.0 with model structure provides priority between various ships and is warfare based.
–Allows ability to tie funding to material readiness
–Consistency of process
?

28
L1 L2 L3 L4 L5 LLI CAS_DATEMOB DC DC EQUIP CLOSURES ZONE 4 ZONE 4 03/08/02ASU PROP MP 1 1 PROP-
SHAFTSEAL 05/01/02
CCC PROP MP 1 1 PROP-SHAFT
SEAL 05/01/02
FSO PROP MP 1 1 PROP-SHAFT
SEAL 05/01/02
INT PROP MP 1 1 PROP-SHAFT
SEAL 05/01/02
MIW PROP MP 1 1 PROP-SHAFT
SEAL 05/01/02
MOB PROP MP 1 1 PROP-SHAFT
SEAL 05/01/02
NCO PROP MP 1 1 PROP-SHAFT
SEAL 05/01/02
MIW MINESWEEPING
ENGAGE AN/SLQ-38 MECH SWEEP 05/16/02
CCC MINEHUNTING
ENGAGE AN/SLQ-48 AN/SLQ-48 06/27/02
MIW MINEHUNTING
ENGAGE AN/SLQ-48 AN/SLQ-48 06/27/02
LOG AUX REVERSEOSMOSIS
REVERSEOSMOSIS
06/30/02
MOB AUX REVERSEOSMOSIS
REVERSEOSMOSIS
06/30/02
L2 L3 L4 L5 LLI CAS_DATEDC DC EQUIP CLOSURES ZONE 4 ZONE 4 03/08/02PROP MP 1 1 PROP-
SHAFTSEAL 05/01/02
MINESWEEPING
ENGAGE AN/SLQ-38 MECH SWEEP 05/16/02
MINEHUNTING
ENGAGE AN/SLQ-48 AN/SLQ-48 06/27/02
AUX REVERSEOSMOSIS
REVERSEOSMOSIS
06/30/02
MISSION AREADate ASU C2W CCC FSO INT LOG MIW MOB MOS NCO
6/30/02 0.00 1.00 0.75 0.00 0.00 0.25 0.00 0.00 1.00 0.00
§ These CASREPsopen on 06/30/02:
ASU C2W CCC FSO INT LOG MIW MOB MOS NCO
§ Impact these Mission Areas:
§ Leading to these metrics:
War Fighting Reporting

29
Concept of Model Use
CDMD-OA
Port Engineer Availability
Planning
Today CDMD-OA
Port Engineer Availability
Planning
Today
Financial Planning
SHIPMAIN Bridge Plot
17
SMCM Drill Down by Class Median mFOM per K$ 8. Premiums Paid ($M)
Growth and New Work FPY Roll Up CT Roll Up (Days) OTD Rollup
B
E
30%
40%
50%
60%
70%
80%
90%
J A O D F A J A O D F A
CFT 1-3
CFT 4B
B
E
0 %
1 0 %
2 0 %
3 0 %
4 0 %
5 0 %
6 0 %
7 0 %
8 0 %
J A O D F A J A O D F A
CFT 4CFT 1-3
E
B
B
50
75
100
125
150
175
200
225250
275
300
J A O D F A J A O D F A0
300
600
900
1200
1500
1800
21002400
2700
3000CFT 1-3
CFT 4
CFT 1-3 CFT 4
B
E
0.0
1.0
2.0
3.0
4.0
5.0
6.0
7.0
J A O D F A J A O D F A
0 %
1 0 %2 0 %
3 0 %4 0 %
5 0 %6 0 %
7 0 %8 0 %
9 0 %1 0 0 %
J A O D F A J A O D F A0
1020
3040
5060
7080
90100
% PP vsG&NW
$ M
(%)
0
10
20
30
40
50
60
70
80
90
100
110
J A O D F A J A O D F A
Monthly
Cumulative
($M)
($M)
MCM
SMCM Drill Down by Class Median mFOM per K$ 8. Premiums Paid ($M)
Growth and New Work FPY Roll Up CT Roll Up (Days) OTD Rollup
B
E
3 0 %
4 0 %
5 0 %
6 0 %
7 0 %
8 0 %
9 0 %
J A O D F A J A O D F A
CFT 1-3CFT 4
B
B
E
0 %
10%
20%
30%
40%
50%
60%
70%
80%
J A O D F A J A O D F A
CFT 4
CFT 1-3
E
B
B
50
75
100
125
150
175
200
225
250
275
300
J A O D F A J A O D F A0
300
600
900
1200
1500
1800
2100
2400
2700
3000CFT 1-3CFT 4
CFT 1-3 CFT 4
B
E0 . 0
1 . 0
2 . 0
3 . 0
4 . 0
5 . 0
6 . 0
7 . 0
J A O D F A J A O D F A
0 %1 0 %
2 0 %3 0 %
4 0 %5 0 %
6 0 %7 0 %8 0 %
9 0 %1 0 0 %
J A O D F A J A O D F A
010
2030
4050
607080
90100
% PP vsG&NW$ M
(%)
0
10
20
30
40
50
60
70
80
90
100
110
J A O D F A J A O D F A
MonthlyCumulative
($M)
($M)
MCM
Median mFOM per K$ 8. Premiums Paid ($M)
FPY Roll Up CT Roll Up (Days) OTD Rollup
B
E
3 0 %
4 0 %
5 0 %
6 0 %
7 0 %
8 0 %
9 0 %
J A O D F A J A O D F A
CFT 1-3
CFT 4B
B
E
D F A J A O D F A
CFT 4
CFT 1-3
E
B
B
50
75
100
125150
175
200
225
250
275
300
J A O D F A J A O D F A
0
300
600
9001200
1500
1800
2100
2400
2700
3000CFT 1-3
CFT 4
CFT 1-3 CFT 4
B
E
0 . 0
1 . 0
2 . 0
3 . 0
4 . 0
5 . 0
6 . 0
7 . 0
J A O D F A J A O D F A0
10
20
30
40
50
60
70
80
90
100
110
J A O D F A J A O D F A
Monthly
Cumulative
($M)
($M)
SMCM Drill Down by Class Median mFOM per K$
Growth and New Work FPY Roll Up CT Roll Up (Days)
B
B
E
0%
10%
20%
30%
40%
50%
60%
70%
80%
J A O D F A J A O D F A
CFT 4CFT 1-3
E
B
50
75
100
125
150
175
200
225
250
275300
J A O D F A J A O
CFT 1-3
CFT 4
CFT 1-3
B
E0 . 0
1 . 0
2 . 0
3 . 0
4 . 0
5 . 0
6 . 0
7 . 0
J A O D F A J A O D F
0 %
1 0 %2 0 %
3 0 %4 0 %
5 0 %6 0 %
7 0 %8 0 %
9 0 %1 0 0 %
J A O D F A J A O D F A0
1020
3040
5060
7080
90100
% PP vsG&NW
$ M
(%)
MCM
mFOMDrill Down by Class
Tomorrow
CDMD-OA
Port Engineer Availability
Planning
Battle Group CDR
Operational Planning
CO’s View of Ship Status
Today
Tomorrow
Future
Financial Planning
SHIPMAIN Bridge Plot
17
SMCM Drill Down by Class Median mFOM per K$ 8. Premiums Paid ($M)
Growth and New Work FPY Roll Up CT Roll Up (Days) OTD Rollup
B
E
30%
40%
50%
60%
70%
80%
90%
J A O D F A J A O D F A
CFT 1-3
CFT 4B
B
E
0 %
1 0 %
2 0 %
3 0 %
4 0 %
5 0 %
6 0 %
7 0 %
8 0 %
J A O D F A J A O D F A
CFT 4CFT 1-3
E
B
B
50
75
100
125
150
175
200
225250
275
300
J A O D F A J A O D F A0
300
600
900
1200
1500
1800
21002400
2700
3000CFT 1-3
CFT 4
CFT 1-3 CFT 4
B
E
0.0
1.0
2.0
3.0
4.0
5.0
6.0
7.0
J A O D F A J A O D F A
0 %
1 0 %2 0 %
3 0 %4 0 %
5 0 %6 0 %
7 0 %8 0 %
9 0 %1 0 0 %
J A O D F A J A O D F A0
1020
3040
5060
7080
90100
% PP vsG&NW
$ M
(%)
0
10
20
30
40
50
60
70
80
90
100
110
J A O D F A J A O D F A
Monthly
Cumulative
($M)
($M)
MCM
SMCM Drill Down by Class Median mFOM per K$ 8. Premiums Paid ($M)
Growth and New Work FPY Roll Up CT Roll Up (Days) OTD Rollup
B
E
3 0 %
4 0 %
5 0 %
6 0 %
7 0 %
8 0 %
9 0 %
J A O D F A J A O D F A
CFT 1-3CFT 4
B
B
E
0 %
10%
20%
30%
40%
50%
60%
70%
80%
J A O D F A J A O D F A
CFT 4
CFT 1-3
E
B
B
50
75
100
125
150
175
200
225
250
275
300
J A O D F A J A O D F A0
300
600
900
1200
1500
1800
2100
2400
2700
3000CFT 1-3CFT 4
CFT 1-3 CFT 4
B
E0 . 0
1 . 0
2 . 0
3 . 0
4 . 0
5 . 0
6 . 0
7 . 0
J A O D F A J A O D F A
0 %1 0 %
2 0 %3 0 %
4 0 %5 0 %
6 0 %7 0 %8 0 %
9 0 %1 0 0 %
J A O D F A J A O D F A
010
2030
4050
607080
90100
% PP vsG&NW$ M
(%)
0
10
20
30
40
50
60
70
80
90
100
110
J A O D F A J A O D F A
MonthlyCumulative
($M)
($M)
MCM
Median mFOM per K$ 8. Premiums Paid ($M)
FPY Roll Up CT Roll Up (Days) OTD Rollup
B
E
3 0 %
4 0 %
5 0 %
6 0 %
7 0 %
8 0 %
9 0 %
J A O D F A J A O D F A
CFT 1-3
CFT 4B
B
E
D F A J A O D F A
CFT 4
CFT 1-3
E
B
B
50
75
100
125150
175
200
225
250
275
300
J A O D F A J A O D F A
0
300
600
9001200
1500
1800
2100
2400
2700
3000CFT 1-3
CFT 4
CFT 1-3 CFT 4
B
E
0 . 0
1 . 0
2 . 0
3 . 0
4 . 0
5 . 0
6 . 0
7 . 0
J A O D F A J A O D F A0
10
20
30
40
50
60
70
80
90
100
110
J A O D F A J A O D F A
Monthly
Cumulative
($M)
($M)
SMCM Drill Down by Class Median mFOM per K$
Growth and New Work FPY Roll Up CT Roll Up (Days)
B
B
E
0%
10%
20%
30%
40%
50%
60%
70%
80%
J A O D F A J A O D F A
CFT 4CFT 1-3
E
B
50
75
100
125
150
175
200
225
250
275300
J A O D F A J A O
CFT 1-3
CFT 4
CFT 1-3
B
E0 . 0
1 . 0
2 . 0
3 . 0
4 . 0
5 . 0
6 . 0
7 . 0
J A O D F A J A O D F
0 %
1 0 %2 0 %
3 0 %4 0 %
5 0 %6 0 %
7 0 %8 0 %
9 0 %1 0 0 %
J A O D F A J A O D F A0
1020
3040
5060
7080
90100
% PP vsG&NW
$ M
(%)
MCM
mFOMDrill Down by Class

30
Possible SHIPMAIN Bridge Plot
Growth and New Work FPY Roll Up CT Roll Up (Days) OTD Rollup
B
E
30%
40%
50%
60%
70%
80%
90%
J A O D F A J A O D F A
CFT 1-3
CFT 4B
B
E
0%
10%
20%
30%
40%
50%
60%
70%
80%
J A O D F A J A O D F A
CFT 4
CFT 1-3
E
B
B
50
75
100
125
150
175
200
225
250
275
300
J A O D F A J A O D F A0
300
600
900
1200
1500
1800
2100
2400
2700
3000CFT 1-3
CFT 4
CFT 1-3 CFT 4
0%
10%
20%30%
40%
50%60%
70%80%
90%
100%
J A O D F A J A O D F A0
10
2030
40
5060
7080
90
100% PP vsG&NW
$ M
(%)
8. Premiums Paid ($M)
0
10
20
30
40
50
60
70
80
90
100
110
J A O D F A J A O D F A
Monthly
Cumulative
($M)
($M)
Median mFOM per K$
B
E
0.0
1.0
2.0
3.0
4.0
5.0
6.0
7.0
J A O D F A J A O D F A
SMCM Drill Down by Class
MCM
mFOM Drill Down by Class

31

32
Model can make suggestions on what to fix and then display
change in mFOMvalue based on
that fix

33
DDG “CLASS” Baseline (Foundation)• DDG Class Integrated Lifecycle Assessment Program• DDG Class Long Term Modernization Program• DDG Class “High-Level” Maintenance Routines
STRIKEASWAAWAUXDCHABMOB NAV
0
20
40
60
80
100
The End in MindLink Material Condition to Readiness
§ Enables ‘what if’ drill to determine most efficient & effective mix of repairs and/or mods to meet objective readiness requirements
§ Tycoms establish the short term requirements, maintenance community can state what work is required to get there and how much it will cost
§ Short term requirements link to specific equipment and numbers of equipment availability based on upcoming mission type (i.e. 3 of 4 main engines etc. for drug ops)
x x
xx
x
xx
x SHORT TERM (x) mFOM Requirementsbased on upcoming
mission
Current mFOM Status
LONG TERM Requirements
Display not in current model – functionality currently available

34
SBIRs
§ Smart Machinery Space– Wireless sensors monitor spaces to reduce
watchstander time
§ Bearing Remaining Useful Life – Wireless sensors monitor bearing trends to predict
remaining useful life– Power harvesting sensors

35
Portable Maintenance Assistant (PMA)
§ Program Description - Application of Mobile Computing for reducing shipboard workload. It provides Paperless PMS management, paperless e-Logs, paperless data collection, ready access to IETMs and logistics data at the Point of work, diagnostic andtroubleshooting capability, generate electronic work items (4790/2K & CK) at the Point of Work, wireless communication interface to shipboard OMMS-NG / SKED / ICAS, Paperless e-feedback reports
§ The entire business process utilizes existing and near term infrastructure and Navy Technical and Logistics products to optimize the Life Cycle Cost
§ Deployment Status: - Prototype ready for demonstration and customer feedback. A networked workstation and a PMA is being tailored for a shipboard demo

36
PMA Information Flow
3M & CDMD-OA Databases
Ship’s SNAP
PMA
IT-21 Work Centers
RF Link
Ship’s LAN
RADSKEDOTHER SYS.
TAGOUT

37
SKEDPMA
PROCESS
Upload to SNAP
S/F
DocumentMRC
CompletionS/F
Use Digitized
MRCsTech Manuals
S/F
Validate Configuration
S/F
DownloadPMS Schedule
to PMA
Log-in toIT-21 CTR.RF Link to
PMAWork CTR S/F
RF Uploadto SKED
S/F
Generate2Ks/CKs
S/F
PMA Overview
Objectives§ Workload Reduction § Maintenance Mentoring / Tailored
EPSS§ Paperless PMS
Benefits§ Reduce data collection workload§ Facilitates paperless work site§ Quality 2K generation § Eliminates filing and re-filling of paper
MRCs in work center§ Interactive MRCs - video and audio§ Facilitates performance based training
for maintenance generalist§ Allows tailoring of MRCs to account for
differences in equipment configuration§ Eliminate confusion due to "line out" on
MIPs and MRCs§ Paperless feedback generation at the
point of work

38
PMA Benefits Overview
§ External connectivity§ Select Origin codes§ Generate POC list§ Review MRC cards§ View/Edit/Print Visit Summary
Report § View/Edit/Print PMS summary
status§ Streamlined SNAP and up-line
reporting§ Validation of configuration data
at the point of work§ Improve accuracy of
configuration information by CK generation at
§ Maintenance Mentoring§ Generate/Edit/View e-2 Kilos§ PMS “to do" list on PMAs§ Generate/Edit/View e-4790 CKs§ Generate/Edit E-log entries§ Switch between SRF screen, associated MRC
comments screens, and pre-filled 2K screen.§ Standard statements based on dominant failure
modes (RCM), filtered by SWAB for Block 35, User Editable
§ IETMs on PMAs§ Spell Checker for block 35

39
PMA Benefits Overview Contd.
§ Collect usage informationGPETE - reduce calibrationParts usage- more efficient loadout, COSAL validationConsumables- more efficient loadout, COSAL validationHAZMAT - reduce stowage and loadout
§ Error reduction, eliminates transposing of information, data capture one time
§ Feedback generation at point of work§ Sketchpad for Sailor to provide additional information he can't
otherwise enter§ Recording and reporting of "as found" conditions§ Alternate views of information based upon viewing medium§ Onboard vibration analysis capability at the point of work§ Onboard thermal analysis capability at the point of work§ Other analysis tools available onboard at the point of work§ Allow hyperlinks to other media (video, pictures, procedures,
how to's, etc.)

40
§ USN has invested considerable research into new technologies that will eliminate much of what Sailors do for routine maintenance– One technologies does not necessarily solve all problems– It must be applicable and effective– New technologies should undergo a trial period with a definitive test plan
that specifies what success is
§ Model usage can provide real time visibility into ship’s material condition§ ePMA testing is continuing on DDG-51 platforms§ These efforts can be leveraged for new
construction efforts and for legacy platforms.
Summary

Back Ups

42
METRICSCommon Ship Tracking Database

43
§ Problem:– Motor overhauls are time directed tasks based on
projected hours (40,000 hrs).– Dominate motor failure modes:
• Shorted windings (turn to turn)• Bearing, causing collateral damage to windings and stator
§ Solution:– Inexpensive portable motor tester that analyzes motor
health and bearings:• Determines bearing condition and remaining service life
until failure• Determines optimum overhaul cycle for motors and
determine motor service life remaining
Portable Motor Testers

44
§ Benefit:– In place motor assessment at the controller (motor
running or off)– Assesses material condition of controller and motor
in one test– Eliminate premature overhaul costs of good motors
§ Status:– NAVSEA 04RM will be conducting a shipboard test
of three motor testers in March 2004 to determine:• Applicability and effectiveness of conducting in place
motor testing• Determine whether high voltage or low voltage testing
offers the most benefit with least risk in assessing motor health
• Determine whether motor testing tools are best suited for shipboard maintenance tasks or better suited for assessment team use

45
Ship Availability Planning Tool
With all the work candidates loaded, mFOM 2.0 displays the Warfare FOM Values:
The Model lists the impact that a work item has on each warfare area:
MISSION AREA Date ASU C2W CCC FSO INT LOG MIW MOB MOS NCO
6/30/02 0.71 0.98 0.75 0.64 0.68 0.88 0.65 0.58 0.85 0.69
ASU C2W CCC FSO INT LOG MIW MOB MOS NCO
JSN EIC_DESC ASU C2W CCC FSO INT LOG MIW MOB MOS NCOEM01-1850 STBD MAIN REDUCT 0.072067 0.000000 0.000000 0.066021 0.070983 0.000000 0.036158 0.063660 0.000000 0.071355EM01-1891 MN PRPLN DENG 1B 0.027673 0.000000 0.000000 0.024553 0.026646 0.000000 0.022506 0.023897 0.000000 0.026786EM01-1985 RDCN GEAR STBY P 0.018977 0.000000 0.000000 0.022857 0.024488 0.000000 0.023369 0.021962 0.000000 0.024617EM02-1294 SW SPLX STRAINER 0.010844 0.000000 0.000000 0.013061 0.013993 0.000000 0.013354 0.012549 0.000000 0.014067EA01-0787 REFRIGERATION CO 0.000000 0.000000 0.000000 0.000000 0.000000 0.000000 0.000000 0.012488 0.000000 0.000000EA01-0790 NR 2 ASW PUMP 0.008133 0.000702 0.001303 0.009796 0.010495 0.048145 0.010016 0.009412 0.045833 0.010550EA01-0734 REFER NO.2 COND 0.000000 0.000000 0.000000 0.000000 0.000000 0.000000 0.000000 0.006244 0.000000 0.000000OA01-0857 SHIPS DISTANCE I 0.007736 0.000000 0.000000 0.011658 0.000000 0.000000 0.004700 0.005492 0.000000 0.000000EM02-1344 MEDIUM PRESSURE 0.002711 0.002105 0.000434 0.003265 0.003498 0.016575 0.003339 0.003137 0.016000 0.003517

46
Model Hierarchal Structure
Levelof
Indenture
“Warfare” Material Condition FOMWarfare Area
“Functional” MaterialCondition FOM
L1(Function)(A) (B) (C) (D)
“System” Material Condition FOML2(System)
(AA) (AA)
“Component” Material Condition FOM
“Sub-Component” MaterialCondition FOM
One or more EOC’s from 2Ks, CASREPs, assessments, ICAS data, PMS can all contribute to FOM
“Equipment” Material Condition FOML3(Subsystem)

47
The Port Engineer can use mFOM 2.0 to see what jobs will have the most impact on the mission assigned to the ship.
JSN EIC_DESC MIWEM01-1850 STBD MAIN REDUCT 0.036158EM01-1793 MN PRPLN DENG 1B 0.022506EM01-1985 RDCN GEAR STBY P 0.023369EM02-1294 SW SPLX STRAINER 0.013354EA01-0790 NR 2 ASW PUMP 0.010016OA0-10857 UWTR LOG 0.004700EM02-1344 MP AIR COMP NO 2 0.003339EE01-2274 OUTSIDE ELECTRIC 0.000406EM02-1296 1A SSDG 0.000355EM02-1295 1B SSDG 0.000237EE01-R026 400HZ MOTOR GENE 0.000119EA01-0796 STEERING GEAR RO 0.000107OA01-0845 TB-30C/SQQ-32(V) 0.022616OA01-0763 VEH HDLG SYS SLQ 0.008481DA01-0677 AEL MECH MS EQPT 0.007068DA01-0678 AEL MECH MS EQPT 0.007068
JSN EIC_DESC INTEM01-1850 STBD MAIN REDUCT 0.070983EM01-1793 MN PRPLN DENG 1B 0.026646EM01-1985 RDCN GEAR STBY P 0.024488EM02-1294 SW SPLX STRAINER 0.013993EA01-0790 NR 2 ASW PUMP 0.010495EA01-0796 STEERING GEAR RO 0.008813EE01-2274 OUTSIDE ELECTRIC 0.004203EM02-1296 1A SSDG 0.003966EM02-1344 MP AIR COMP NO 2 0.003498EM02-1295 1B SSDG 0.002644EE01-R026 400HZ MOTOR GENE 0.001322
Mine Warfare Intel
Ship Availability Planning Tool
• Some items are the same on the lists since the item impacts both mission areas
• Items move up and down on each list based on importance to each warfare area
• Some items are important to some mission areas, but not others

48
Component
Side
Subcomponent
Frame
Functional Index Number FIN
20 Digits
FunctionalArea
SystemSubsystem
Variant
DeckAPLCode
ESWBS & SWLIN Code
1 2 3 4 5 6 7 8 9 10 11 12 13 14 15 16 17 18 19 20

49
5 3 3 A 0 1 A 6 5 1 1 0 4 0 2 0 3 5 0 1
Functional Index Number FIN
No Variant
AUX
Pumps
Potable Water
PUMPS
NO 1 – Pump Liquid End
Impeller
2nd Deck
35th Frame
1st to Starboard
Water, Potable
Service

50
Functional Index Number FIN
Positions
Values
ESWBS & SWLIN Code53300 POTABLE WATER 533 Z53310 WATER, POTABLE SERVICE 533 A53320 DISTILLED WATER SERVICE 533 B
1 2 3 4
5 3 3 A
Common Configuration Item 01 - Pumps
5 6
0 1
Functional Area A = AUX
7
A
System Potable Water
8
6
Subsystem PUMPS
9
5
10 11
Component NO 1 – Pump Liquid End
1 1
Subcomponent Impeller
12 13
0 4
Variant No Variant
14
0
Deck 2nd Deck
15
2
Frame 35th Frame
16 17 18
0 3 5
Side 1st to Starboard
19 20
0 1

51
Problem:• Shipboard metal materials corrode & require
frequent maintenance painting and repair
• Fleet-wide, sailors spend 15,400 man-days per year maintaining these items
Solution:• Replace metal materials with composite
components extending the service life from 5 to 20 years.
Composite Materials
Composite vent screen
Composite deck grating

52
Benefits:• Composite materials never require painting.• Composite materials provide a strong, lightweight and
comparatively priced alternative to standard metal products for a variety of applications:
− Pumps and valves− Grating and screens− Topside electrical boxes− Ladders, vent ducts and fans
Composite Materials
Composite boxes
USS LEYTE GULF Composite Pump
Composite boxes

53
Composite Materials
Case Study:• Installation of composite material on CVN catwalks has
resulted in cost avoidance of: − $1.9M USS ABRAHAM LINCOLN (CVN-72) − $1.9M USS THEODORE ROOSEVELT (CVN-71)− 4 ships completed to date
• Installation of composite vent screensresulted in cost avoidance of:
− $2.7M USS ABRAHAM LINCOLN (CVN-72)− $599K USS STOUT (DDG-55)− 13 ships have composite vent screens
• Composite decks & grates now available via supply system
Composite vent screen

54
• Problem:– Watertight doors require frequent
maintenance. – Fleet-wide, sailors spend over 590 man-
years/year maintaining watertight doors.
• Solution:– Redesign door hinge pins, bushings, and
hinge yokes to eliminate premature hinge failures
– Redesign door dogs to incorporate more resistant materials to extend life of dog bushings.
– Projected sailor workload reduction is 350 myr/yr
– Projected cost avoidance is $100 M
Hinge Pins and Bushings Currently in Use
Redesigned Hinge Pins and Bushings
Watertight Doors


