Navitus Bay Socio-Economic and Tourism Baseline Assessment
Baseline Report | April 2013 1
1 SOCIO-ECONOMICS AND TOURISM
Introduction
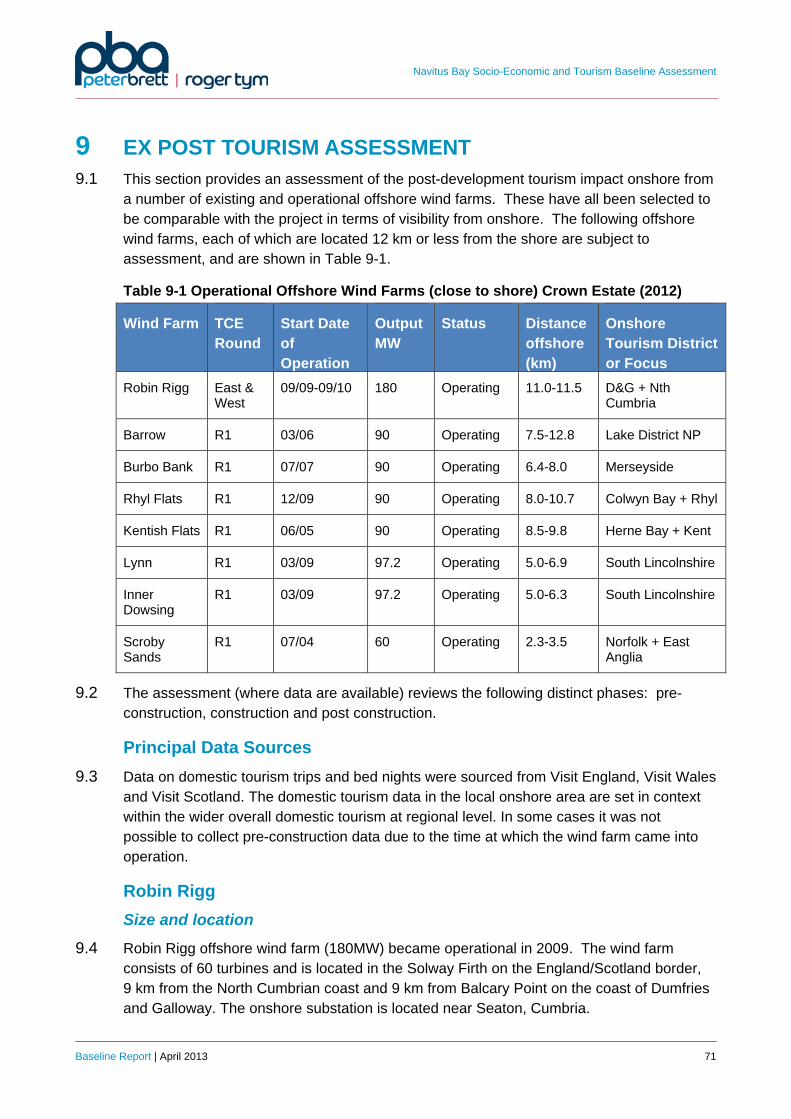
1.1 This document presents the baseline data upon which an assessment of socio-economic and tourism impacts arising from the proposed Navitus Bay Wind Park project (hereafter referred to as the ‘project’) have been identified during its construction, operation and maintenance, and decommissioning phases.
1.2 This document also briefly reviews baseline data for the Commercial Fisheries and Shipping and Navigation impact assessments. Both of these are the subject of separate assessment, but linked to this work because of their role as economic activities.
Study Area
1.3 The study area for the socio-economic assessment takes in the counties of Dorset and Hampshire and the unitary authorities of Poole, Bournemouth, the Isle of Wight, Portsmouth and Southampton, and is detailed in Figure 1.1. These areas form the key areas of population and economic activity within which the proposed development site is located. It includes areas that may be involved in construction, operation and maintenance and decommissioning activities. Solely for the purpose of labour market analysis, a study area defined by 30, 45 and 60 minute drive time catchments from the ports has been adopted in relation to the offshore components of the project.
1.4 The tourism study area is also defined in Figure 1.1. This includes a 20 km zone which has as its midpoint, the coastline, stretching from the Purbeck Peninsula to the east of the Isle of Wight. It includes parts of the counties of Dorset and Hampshire and the unitary authorities of Poole, Bournemouth and the Isle of Wight. The principal towns and settlements in the surrounding area, including Bournemouth, Poole and Swanage are included. This area was considered appropriate in response to consultation, consideration of the approach adopted in other assessments of offshore wind proposals, and professional judgement.
1.5 For the onshore components of the project the study area is a 2 km zone around the cable route and substation. For the labour market analysis, a study area defined by 30, 45 and 60 minute drive time catchments from the substation has been adopted for the onshore components of the project..
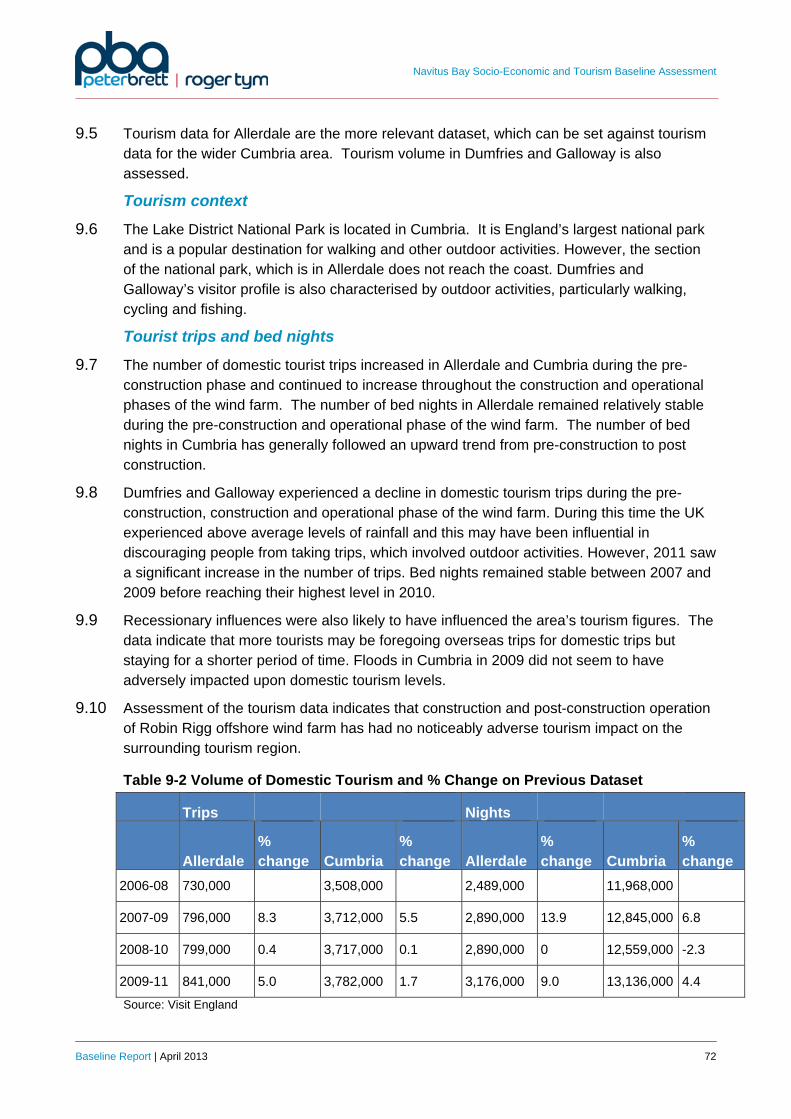
1.6 The study area for the Commercial Fisheries assessment broadly includes the area of open sea from St. Catherine’s Point on the Isle of Wight in the east to St. Alban’s Head in Dorset in the west. This area includes all inshore waters and extends to the most southerly extent of the offshore development site.
1.7 The study area for the Shipping assessment is based on a 10 NM buffer around the proposed Offshore Development Area. This distance has been used as it presents a
Navitus Bay Socio-Economic and Tourism Baseline Assessment
Baseline Report | April 2013 2
sufficient area to capture the relevant issues for the wind farm in terms of vessel movements. In addition, the baseline includes a brief review of the available information about the economic role of the key ports within the socio-economic study area.
Navitus Bay Socio-Economic and Tourism Baseline Assessment
Baseline Report | April 2013 3
Figure 1-1 Study Area
Source PBA RTP Baseline Assessment
Navitus Bay Socio-Economic and Tourism Baseline Assessment
Baseline Report | April 2013 4
1.8 This baseline review is supplemented by a survey of local tourism businesses which may be affected by the project as well as two quantitative and one qualitative pieces of visitor research. The findings of this research, which are reported separately, provide additional detail on the profile of visitors and visits, key characteristics of the area, business trends and prospects, rates, levels of turnover and the perceived potential impact of the project on businesses.
Navitus Bay Socio-Economic and Tourism Baseline Assessment
Baseline Report | April 2013 5
2 DATA SOURCES 2.1 This assessment has been informed by data and documents related to the study area for
the project, i.e. the administrative areas of Poole and Bournemouth Borough Councils, Southampton and Portsmouth City Councils, the counties of Dorset, Hampshire and the Isle of Wight and the South East and South West regions.
2.2 Information sources and relevant documents used in the compilation of the socio-economic and tourism baseline are listed in Table 2-1 below.
Table 2-1 Key Data Sources
Scale Source
Regional
Socio-Economics Office for National Statistics (via NOMIS)
Census data (2001and 2011)
Mid-year population estimates (2011)
Claimant Count (March 2013)
Annual Business Inquiry (2008)
Annual Population Survey (Jan 2012 – Dec 2012)
Regional GVA Figures (2011)
BERR – VAT registrations/ de-registrations by industry (2007)
Tourism
South West and South East Top 10 Paid and Unpaid Visitor Attractions (2011)
South West of England Regional Summary (VisitEngland) (2010)
South East of England Regional Summary (VisitEngland) (2010)
Great Britain Tourism Survey Analysis (2007-2011) (VisitEngland)
Overseas Tourism in UK Countries/Regions (2011) (VisitBritain)
Office for National Statistics. International Passenger Survey (2011)
Isle of Wight Tourism Activity Monitor Visitor statistics for tourism year (2010/2011)
The Economic Impact of Tourism: New Forest (Tourism South East, 2008)
Navitus Bay Socio-Economic and Tourism Baseline Assessment
Baseline Report | April 2013 6
Scale Source
Christchurch and East Dorset Core Strategy Pre-Submission (2012)
Building a more Competitive Economy in Bournemouth Dorset and Poole (2005-2016)
Isle of Wight Economic Development Plan (2011/12 – 2013/14)
Economic Strategy for New Forest District (2006)
Dorset Local Economic Partnership Prospectus (2012)
Navitus Bay Socio-Economic and Tourism Baseline Assessment
Baseline Report | April 2013 7
3 EDUCATION AND TRAINING INFRASTRUCTURE 3.1 An assessment of education providers offering courses in the renewable energy market has
been prepared. The relevant courses in the area will help to train people to get a job in the renewables sector. Access to relevant courses will help to strengthen the areas skills within the renewables market.
3.2 In those areas with the potential to be impacted by the project (i.e. Bournemouth, Poole, Swanage, Southampton and Portsmouth), there are some training programmes and university/college courses specifically designed to cater for the renewable energy market. A summary of relevant academic courses and training programmes is provided below:
Southampton University
Environmental Engineering – Students learn about sustainable energy resources and there are specific modules with elements related to offshore wind. Examples include modules on Coastal and Maritime Engineering and Energy and Energy Resources and Engineering.
Sustainable Energy Technologies – Students are taught the advanced knowledge and practical skills needed for a professional career in the renewable energy industry amongst others. One of the compulsory modules of the course (Renewable Energy from the Environment) teaches students the theoretical understanding required to design suitable energy conversion devices suitable for exploiting wind, both on and offshore. At the end of the course students should have an understanding of how devices are sited and the considerations required for installation, maintenance, operational control and eventual decommissioning.
Maritime Engineering and Ship Science – Offshore structures and wind/water energy harvesting structures are examples of engineering systems considered on the course.
Warsash Maritime Academy
There is a training course titled Renewable UK Marine Survival Training (MST) which addresses the most significant health, safety and emergency response training issues as they relate to vessel transit and transfer. The course provides training for a number of modules including Offshore environment and hazards, Organisation for safety when transiting and transferring to and from offshore wind farms, offshore operations and emergencies and first aid.
Apprenticeship Training Ltd (ATL)
A training organisation in Southampton which offers a two day course on Renewables awareness.
3.3 As a result of a recent successful European Funding Bid, Southampton City Council and its UK/French partners have secured £1.7m for a project entitled BEEMS (Building European Environmental Maritime Skills). The project is envisaged to help stimulate the development and growth of environmental and maritime skills within the marine renewable energy industry. It should enable people to have the skills to work in the offshore renewables industry in a range of vocations such as welding to fire safety.
Navitus Bay Socio-Economic and Tourism Baseline Assessment
Baseline Report | April 2013 8
3.4 There are also indirect courses which provide some of the skills to work in the offshore industry. At Bournemouth and Poole College there is a course in electronics and Corporate Safety Management (CSM) in Poole. This college offers a range of health and safety courses. Bournemouth and Poole College also offers construction courses relevant to the onshore project, as well as other providers such as Eastleigh College, A Plus Safety & Training Services in Bournemouth and Poole, Highbury College in Portsmouth and City College, Southampton.
3.5 Bournemouth University provides a variety of engineering degree courses as well as a Higher National Certificate (HNC) in Electrical Technology. Southampton University provides degree and post graduate courses in electrical engineering and Portsmouth University also offers engineering degree courses.
3.6 Across the wider South West and South East regions there are a greater number and range of education, training and skills providers which could help deliver a skilled labour market to develop the region’s energy industry.
Navitus Bay Socio-Economic and Tourism Baseline Assessment
Baseline Report | April 2013 9
4 SOCIO-ECONOMIC PROFILE 4.1 This section outlines the socio-economic characteristics of the areas with the potential to be
impacted by the project. These are the areas of Bournemouth, Poole, the Isle of Wight, Southampton, Portsmouth, Dorset and Hampshire. For the purposes of this assessment these areas will be referred to as the ‘study area’. Study area characteristics are compared to the national socio-economic profile.
Population Structure and Projections
4.2 Since 2001 all areas within the study area have seen population growth, with the Isle of Wight, Southampton and Portsmouth experiencing growth in excess of the national average (Table 4-1). The average for the study area as whole is just below the GB average.
4.3 The areas of Poole, Isle of Wight, Dorset and Hampshire all have a relatively low proportion of working age population and a high dependency ratio1, compared to the study area and national averages. Whereas Bournemouth, Southampton and Portsmouth have a notably low dependency ratio and a higher number of working age population. These statistics are to be expected given that these are the three main cities in the study area, which are more likely to draw people looking for work. Since 2001 the age structure, in these three areas has strengthened (i.e. the proportion of working age people has increased) at a much higher rate compared to the wider socio-economic study area and national averages.
1 The dependency ratio (or proportion of working age people) is significant as it measures the relationship between the productive element of a population and the economically dependent.
Navitus Bay Socio-Economic and Tourism Baseline Assessment
% change from 2001 7% 2% 0% 3% 4% -1% -1% -2% 1% *working age defined as anyone aged 16-64
**Total figure of Bournemouth, Poole, Isle of Wight, Southampton, Portsmouth, Dorset and Hampshire.
***GB data includes Scotland, England, and Wales.
Source: NOMIS 2013
Navitus Bay Socio-Economic and Tourism Baseline Assessment
Baseline Report | April 2013 11
4.4 Compared to the national average, the study area has higher economic activity rates2 and lower unemployment and claimant rates (Table 4-2). The study area also has a higher proportion of the workforce as employees and a well-represented self-employed labour force. A high proportion of self-employed workers is a good indicator of entrepreneurship and a dynamic labour market.
4.5 At a local authority level all these areas exhibit economic activity rates which are relatively close to the national average. The Isle of Wight is characterised by a higher unemployment and JSA Claimant rate3. Hampshire and Dorset by contrast have a well-balanced economically active labour force with relatively low unemployment rates.
2 The economic activity rate measures the percentage of the population who are in employment or unemployed. The economic activity rate is therefore a useful measure of the labour market opportunities available to the people. 3 A high proportion of economically active unemployed people represents and underutilised workforce that could contribute to the area’s economic performance.
Navitus Bay Socio-Economic and Tourism Baseline Assessment
Baseline Report | April 2013 12
Table 4-2 Economic Activity (Jan 2012 - Dec 2012)
Bourne-mouth
Poole Isle of Wight
South-ampton
Ports-mouth
Dorset Hamp-shire
Study Area
GB
Economically active
84,700 (74.8%)
70,400 (78.7%)
63,000 (75.1%)
129,700 (73.7%)
115,500 (78.1%)
194,000 (80.7%)
678,600 (80.9%)
1,335,900 (81.3%) 76.9%
In employment
79,700 (70.3%)
66,700 (74.4%)
57,900 (69.0%)
120,300 (68.3%)
106,800 (72.3%)
183,800 (76.6%)
646,000 (76.9%)
1,261,200 (76.8%) 70.7%
Employees 67,000 (59.6%)
56,700 (63.7%)
47,400 (57.5%)
106,200 (60.7%)
93,900 (63.6%)
144,700 (62.4%)
548,100 (66.3%)
1,064,000 (64.8%) 60.6%
Self employed 12,300 (10.5%)
9,800 (10.4%)
10,300 (11.3%)
13,100 (7.1%)
12,100 (8.1%)
36,100 (13.6%)
94,000 (10.2%)
187,700 (11.4%) 9.6%
Unemployed 5,800 (6.7%)
3,700 (5.3%)
5,100 (8.1%)
10,100 (7.7%)
8,800 (7.6%)
10,200 (5.2%)
32,600 (4.8%)
76,300 (5.7%) 7.9%
JSA (2013) 4,033 (3.3%)
2,003 (2.2%)
3,852 (4.7%)
5,723 (3.5%)
5,294 (3.8%)
4,028 (1.7%)
16,291 (2.0%)
41,224 (2.5%) 3.8%
Economically inactive
27,700 (25.2%)
18,500 (21.3%)
20,100 (24.9%)
45,400 (26.3%)
31,900 (21.9%)
43,200 (19.3%)
153,100 (19.1%)
339,900 (20.7%) 23.1%
Wanting a job 5,800 (5.3%)
3,500 (4.1%)
4,300 (5.3%)
11,500 (6.7%)
10,600 (7.3%)
11,000 (4.9%)
40,800 (5.1%)
87,500 (5.3%) 5.8%
Not wanting a job
21,900 (19.9%)
14,900 (17.2%)
15,800 (19.6%)
33,800 (19.6%)
21,300 (14.6%)
32,300 (14.4%)
112,300 (14.0%)
252,300 (15.4%) 17.3%
Source: NOMIS 2013
Navitus Bay Socio-Economic and Tourism Baseline Assessment
Baseline Report | April 2013 13
Business Structure
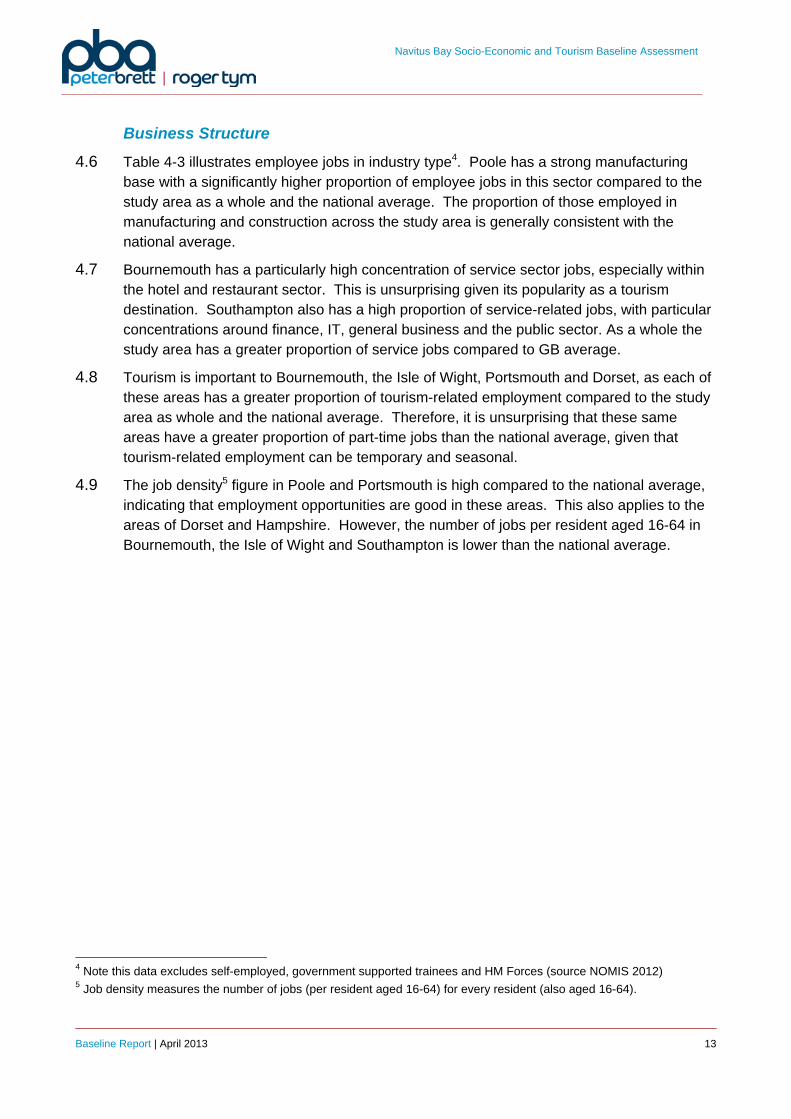
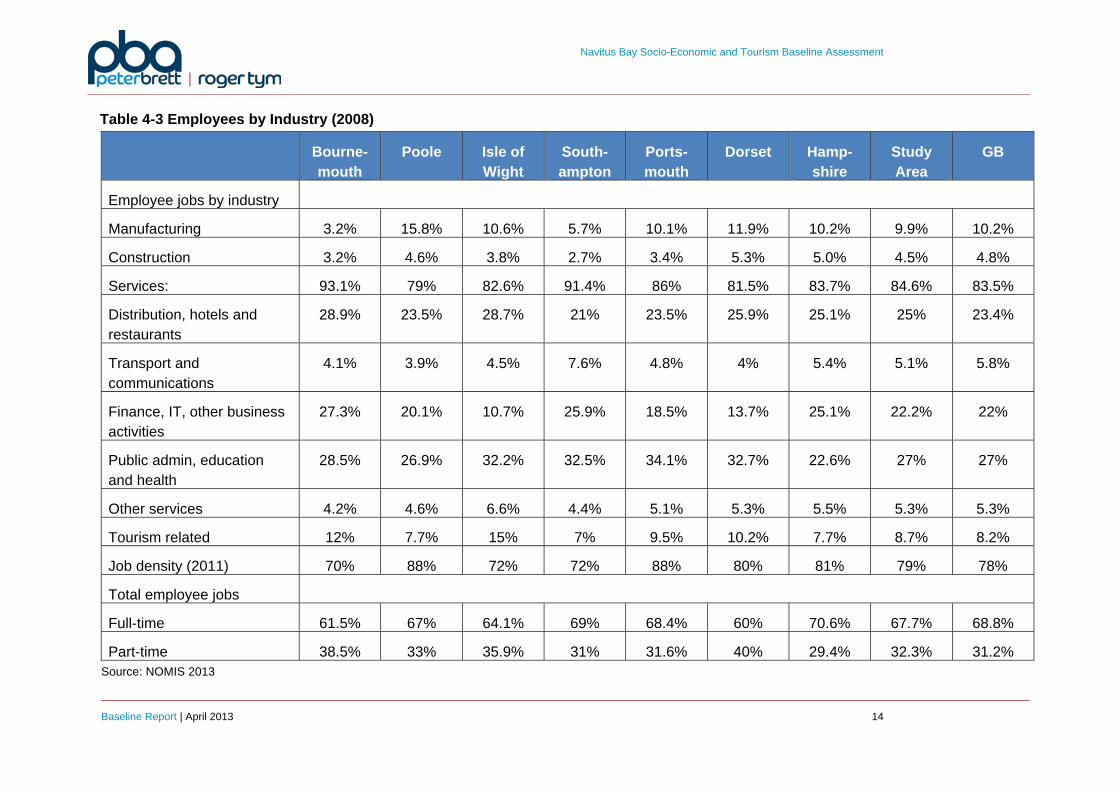
4.6 Table 4-3 illustrates employee jobs in industry type4. Poole has a strong manufacturing base with a significantly higher proportion of employee jobs in this sector compared to the study area as a whole and the national average. The proportion of those employed in manufacturing and construction across the study area is generally consistent with the national average.
4.7 Bournemouth has a particularly high concentration of service sector jobs, especially within the hotel and restaurant sector. This is unsurprising given its popularity as a tourism destination. Southampton also has a high proportion of service-related jobs, with particular concentrations around finance, IT, general business and the public sector. As a whole the study area has a greater proportion of service jobs compared to GB average.
4.8 Tourism is important to Bournemouth, the Isle of Wight, Portsmouth and Dorset, as each of these areas has a greater proportion of tourism-related employment compared to the study area as whole and the national average. Therefore, it is unsurprising that these same areas have a greater proportion of part-time jobs than the national average, given that tourism-related employment can be temporary and seasonal.
4.9 The job density5 figure in Poole and Portsmouth is high compared to the national average, indicating that employment opportunities are good in these areas. This also applies to the areas of Dorset and Hampshire. However, the number of jobs per resident aged 16-64 in Bournemouth, the Isle of Wight and Southampton is lower than the national average.
4 Note this data excludes self-employed, government supported trainees and HM Forces (source NOMIS 2012) 5 Job density measures the number of jobs (per resident aged 16-64) for every resident (also aged 16-64).
Navitus Bay Socio-Economic and Tourism Baseline Assessment
Navitus Bay Socio-Economic and Tourism Baseline Assessment
Baseline Report | April 2013 15
Employment Structure
4.10 The study area as a whole has a similar level of highly skilled workers as the national average. Both Hampshire and Dorset are characterised by a higher than average proportion of highly skilled workers. Whereas the Isle of Wight has a notably lower level of highly skilled workers compared to the rest of the study area.
4.11 In terms of skilled workers, every area, apart from Southampton and Hampshire, has a higher proportion than the national average. In particular, the areas of Bournemouth and the Isle of Wight have a high proportion of skilled trades people.
4.12 Southampton has a particularly high level of unskilled workers compared to the rest of the study area and Great Britain.
Navitus Bay Socio-Economic and Tourism Baseline Assessment
Baseline Report | April 2013 16
Table 4-4 Employment Structure by Occupational Group (Jan 2012- Dec 2012)
Navitus Bay Socio-Economic and Tourism Baseline Assessment
Baseline Report | April 2013 17
Qualifications and Skills
4.13 The proportion of people achieving the highest level of qualifications (HND, Degree and Higher Degree level qualifications) across the study area is slightly below the GB average, apart from Dorset and Hampshire which is above. Table 4-5 shows that Poole and the Isle of Wight have particularly low levels of those obtaining the highest qualifications. However, the proportion of people achieving some sort of qualification is relatively high across the study area, with low levels of people holding no qualifications compared to the national average.
Navitus Bay Socio-Economic and Tourism Baseline Assessment
Baseline Report | April 2013 18
Table 4-5 Skills and Qualifications (Jan 2012 – Dec 2012)
Bournemouth Poole Isle of Wight
Southampton Portsmouth Dorset Hampshire Study Area
Navitus Bay Socio-Economic and Tourism Baseline Assessment
Baseline Report | April 2013 19
Gross Value Added (GVA) Output and Productivity
4.14 Table 4-6 shows that within the study area Hampshire has shown the greatest GVA growth (+60%) over the period 2001-2011, with the lowest growth in the period occurring in Southampton (+30%).
Navitus Bay Socio-Economic and Tourism Baseline Assessment
Baseline Report | April 2013 20
Table 4-6 GVA Total by Area – 2001- 2011 (£ million at current basic prices)
Bournemouth and Poole
Isle of Wight Southampton Portsmouth Dorset Hampshire Study Area UK*
Navitus Bay Socio-Economic and Tourism Baseline Assessment
Baseline Report | April 2013 21
Earnings
4.15 Average gross weekly pay for residents and full time (FT) workers in the study area are slightly lower relative to the national average (Table 4-7). The areas with the lowest gross weekly pay are the Isle of Wight and Southampton. These comparatively low wage rates are influenced by the lower than average proportion of highly paid, highly skilled occupations in each of these areas. Earnings in the Hampshire region exceed the study area and national averages.
Navitus Bay Socio-Economic and Tourism Baseline Assessment
Baseline Report | April 2013 22
Table 4-7 Average Weekly Earnings by Place of Residence 2012
Bournemouth Poole Isle of Wight Southampton Portsmouth Dorset Hampshire Study Area
GB
Earnings by workplace FT workers £482.1 £485.6 £457 £466.3 £479.1 £480 £532.9 £483.29 £508
% of Study Area 100% 100% 95% 96% 99% 99% 110% 100% 105%
Source: NOMIS 2013
Navitus Bay Socio-Economic and Tourism Baseline Assessment
Baseline Report | April 2013 23
Business Health
4.16 VAT registrations and de-registrations offer a useful guide to the pattern of business start-ups and closures in an area, and are a useful indicator of the level of entrepreneurship and health of a business population.
4.17 The study area as a whole has shown strong growth in the number of VAT registered businesses since 2001, particularly in Poole. VAT registrations also surpassed de-registrations for the latest available data period for each of the authorities in the study area (Table 4-8).
Navitus Bay Socio-Economic and Tourism Baseline Assessment
Baseline Report | April 2013 24
Table 4-8 Business Health of VAT Registered Business (2007)
Bournemouth Poole Isle of Wight
Southampton Portsmouth Dorset Hampshire Study Area
Navitus Bay Socio-Economic and Tourism Baseline Assessment
Baseline Report | April 2013 27
Table 4-10 Drive time catchment data - substation
Mannington Substation
Drive time 30 Mins 45 Mins 60 Mins
Economically active (16-74 yrs) 238,791 572,965 851,783
Potentially available labour pool 11,517 25,726 35,726
Manufacturing and construction related workforce
35,035 84,328 131,620
Navitus Bay Socio-Economic and Tourism Baseline Assessment
Baseline Report | April 2013 28
Figure 4-1 Southampton Drive Time Catchment
Navitus Bay Socio-Economic and Tourism Baseline Assessment
Baseline Report | April 2013 29
Figure 4-2 Portsmouth Drive Time Catchment
Navitus Bay Socio-Economic and Tourism Baseline Assessment
Baseline Report | April 2013 30
Figure 4-3 Portland Drive Time Catchment
Navitus Bay Socio-Economic and Tourism Baseline Assessment
Baseline Report | April 2013 31
Figure 4-4 Poole Drive Time Catchment
Navitus Bay Socio-Economic and Tourism Baseline Assessment
Baseline Report | April 2013 32
Figure 4-5 Yarmouth Drive Time Catchment
Navitus Bay Socio-Economic and Tourism Baseline Assessment
Baseline Report | April 2013 33
Figure 4-6 Mannington Substation Drive Time Catchment
Navitus Bay Socio-Economic and Tourism Baseline Assessment
Baseline Report | April 2013 34
Summary
4.19 Bournemouth has an increasing population with a strong working age structure. It has an economic activity rate comparable to the national average. Service and tourism related employment is important in the area. The area is characterised with good educational attainment levels. However, average earnings in the area are below the national average.
4.20 The area around Poole has an economic activity rate which is above the national average and has a strong manufacturing base. Its employment structure is characterised as having an above average proportion of skilled labour. The area has relatively low levels of people achieving the highest levels of qualifications and its average wages are comparatively low.
4.21 The Isle of Wight is characterised by a low working age population, a below average economic activity rate and fairly low level of educational attainment. The service sector is an important employment sector in the area. There are an above average number of unskilled workers in the area. Average weekly pay in the area is low.
4.22 Southampton has a strong working age population with an economic activity rate lower than the national average. Service related employment makes up the majority of the jobs in the area particularly in the public sector. It has an above average proportion of unskilled workers. Educational attainment levels are comparatively low compared to national averages. GVA growth in the area has been relatively low.
4.23 Portsmouth has an increasing population with a good economic activity rate. Tourism related employment is important in the area. The area has an above average proportion unskilled workers. The area is characterised by a low proportion of people achieving the highest levels of qualifications. GVA growth between 2001 and 2011 has been at a rate greater than the UK average.
4.24 Dorset has a strong working age population with an above average economic activity rate. The job density rate in the area is also higher than the UK average. There are an above proportion of highly skilled and skilled workers in the area. Educational attainment levels are also relatively high. Average earnings however are below average.
4.25 Hampshire has an increasing population with a high economic activity rate. The job density rate in the area is high indicating that job opportunities are good. There is a higher than average proportion of highly skilled workers in the area. There are also high proportions of people achieving the highest levels of qualifications. GVA growth in the area is also high with workers receiving above average weekly wages.
Navitus Bay Socio-Economic and Tourism Baseline Assessment
Baseline Report | April 2013 35
5 TOURISM BASELINE 5.1 The area with the potential to be impacted by the project includes parts of two sub-national
divisional areas, the most eastern part of the South West region and the most western part of the South East region. This section presents a tourism baseline profile of both regions. Where possible, local level data is used, focusing on the areas generally perceived to have the greatest potential for impact (beneficial and adverse). This includes the County Authority (CA) areas of Dorset, Hampshire; and the local authority (LA) areas of the Isle of Wight and Bournemouth and Poole. The baseline provides a thorough understanding of the tourism context in which the project is set.
5.2 This section provides an overview which details the volume and value of tourism, identifies significant tourism attractions, accommodation provision and sets out the tourism business density of the areas most likely to be affected (if at all) by the proposed wind farm and the presence of grid connections, including underground cable routing and associated substation infrastructure.
Regional Overview
South West
5.3 The South West of England has a diverse tourism profile with a range of activities and visitor attractions. The region covers about 9,200 square miles with a varied landscape, including rocky coastline and high moorland in the west to flat clay vales and chalk and limestone downland in the east.
5.4 Within the area there are two National Parks – Exmoor and Dartmoor, as well as four World Heritage Sites.6 There also 13 Areas of Outstanding Natural Beauty (AONB) including Dorset, the Cotswolds and the Quantock Hills. There are 50 National Nature Reserves across seven counties in the region, as well as six Registered Historic Battlefields including the Battle of Braddock Down.
5.5 The coastline of the South West totals 700 miles. Much of its coastline is protected. Such designations include World Heritage and Heritage Coast status. The region as a whole has high levels of legal coastal access in England.
5.6 There are a number of beaches in the South West region, with 25 having Blue Flag status (as of September 2012) offering visitors the chance to enjoy sandy beaches and access to clean and safe swimming waters. There are a number of key seaside destinations in the area including Bournemouth and Poole.
5.7 The area also has a significant amount of architectural attractions and traditions and includes a number of historic cities and towns.
6 Stonehenge, Avebury and Associated Sites, City of Bath, Cornwall and West Devon Mining Landscape and Dorset and East Devon Coast.
Navitus Bay Socio-Economic and Tourism Baseline Assessment
Baseline Report | April 2013 36
South East
5.8 As with the South West, the South East region also has a varied mix of tourism activities and attractions, ranging from numerous historical buildings and natural features to theme parks and zoos. The region itself covers 7,373 square miles with over 990 miles of coastline, 45 miles of which is designated as heritage coast.
5.9 The area has numerous heritage sites, including two National Parks – The New Forest and the South Downs and two World Heritage sites7. It also has six Registered Historic Battlefields including the site of the Battle of Hastings and nineteen Protected Historic Wreck Sites including the 16th century warship of King Henry VIII's feet, The Mary Rose, which is located in the Solent near Portsmouth.
5.10 Some of the major attractions in the area include historic environment visitor attractions such as Canterbury Cathedral and Windsor Castle. There are also a number of theme parks including Thorpe Park (Chertsey) and Legoland (Windsor).
5.11 There are 18 Blue Flag beaches in the South East region including two on the Isle of Wight and 3 around Portsmouth.
Key Visitor Attractions and Activities
Regional Area
5.12 VisitEngland carries out a regular survey to determine the most popular visitor attractions in various regions across the country. Table 5.1 shows the top 10 paid and unpaid attractions in the South West and South East of England. The most popular attractions are the Moors Valley Country Park and Stonehenge in the South West and the flagship garden of the Royal Horticultural Society, RHS Garden Wisley, and Canterbury Cathedral in the South East.
5.13 The closest county authorities to the proposed wind farm are Dorset (located in the South West region) and Hampshire (South East region). One top ten paid attraction and two unpaid attractions in the South East are the located in Hampshire; none of which are within the 10 km coastal study area. None of the top ten paid or unpaid attractions in the South West are within the 10 km coastal study area around the project site. However, one attraction, the Moors Valley Country Park, is within close proximity (approximately 2.5 km) to the proposed cable route, although outside of the study area.
7 Blenheim Palace in Oxfordshire and a strip of sites in Canterbury (the Cathedral, St Augustine's Abbey and St Martin's Church.
Navitus Bay Socio-Economic and Tourism Baseline Assessment
Baseline Report | April 2013 37
Table 5-1 Top 10 Paid and Unpaid Regional Attractions (Hampshire and Dorset Highlighted) (2011)
6. Grand Pier 350,000 6. Pitt Rivers Museum 245,773
7. Gloucester Cathedral 275,862 7. Brighton Museum and Art Gallery 235,894
8. Salisbury Cathedral 253,474 8. Royal Victoria Country Park 234,500
9. New Brewery Arts 253,000 9. Rochester Cathedral 234,371
10. Durlston Country Park National Nature Reserve
250,000
10. Itchen Valley Country Park (Southampton, Hampshire) 183,783
Source: South West and South East Top 10 Paid and Unpaid Visitor Attractions (2011)
Study Area
5.14 There is a wide variety of tourism attractions and activities in Bournemouth, Poole, Swanage, Christchurch, Isle of Wight, Wareham and the New Forest National Park and their surrounding areas.
Navitus Bay Socio-Economic and Tourism Baseline Assessment
Baseline Report | April 2013 38
Bournemouth
5.15 There are 7 miles of beaches at Bournemouth including Durley Chine and Alum Chine. Four beaches in the area have Blue Flag status. These beaches all have access to safe clean bathing waters. Visitors are able to participate in watersports, go on boat trips, play volleyball and walk along one of the area’s numerous piers, the most famous being Bournemouth Pier, which has a theatre, a restaurant and a gift shop. Visitors can travel up and down cliffs at the beaches using the West and East Cliff lifts. People are able to move around the various beaches using the Land Train which runs along the promenade.
5.16 Bournemouth is also home to a number of other attractions. These include the Oceanarium, which is an award-winning aquarium that has a variety of marine life. Bournemouth has three gardens which play host to events and attractions during the summer months. Within the Lower Gardens, there is the Bournemouth Balloon, which offers riders a panoramic view of the English Channel and the surrounding area for up to 20 miles from the highest public observation point in Bournemouth. Tourists can visit built heritage in the area such as the historic Grade 1 listed Civic Church, St Peter’s. Bournemouth is also home to a variety of concerts and shows, with popular venues including the Bournemouth International Centre and Bournemouth Pavilion. There are also sightseeing tours and museums including the Russell Cotes Art Gallery and Museum.
Poole
5.17 Poole provides a number of tourist attractions and destinations, primarily focused around its coast (self-proclaimed as the ‘Coast with the Most’). It has the world’s second largest natural harbour and Poole Quay offers views of its miles of beaches. As with Bournemouth, there are four beaches with Blue Flag status and ample opportunities for watersports such as surfing and sailing. There are also numerous boat trips and charters including the Poole Sea Safari and Sea Events (Boat Charter). Activities ashore include, visiting museums such as the Poole Museum and the Poole Old Lifeboat Museum and Shop. There are theme park attractions such as the water theme park Splashdown and located just outside the town is Farmer Palmer’s Farm Park, which caters for the under 8’s. Other attractions in Poole include Ginger Pop, an attraction focused around the works of Enid Blyton. Located just outside Poole is Upton Country Park, where visitors can go on guided walks around the grounds. Another popular visitor attraction nearby Poole is Brownsea Island, where there is a nature reserve and a castle. It is also the birthplace of the Scouting and Guiding movement and there is a Baden-Powell Outdoor Centre. There are opportunities for visitors to the island to take in views of the Purbeck Hills.
Swanage
5.18 Outside Poole and Bournemouth, there are other important visitor attractions. At Swanage there are two nature reserves and a heritage centre. The Purbeck coast path also passes through it. Swanage Pier is another key attraction, where there are steamer sailings. There is also the Swanage Railway, which allows visitors to travel in heritage steam engine locomotives. Situated just outside Swanage, is the Durlston Country Park and nature reserve. It is part of the Jurassic Coast World Heritage Site, and provides scenic views, numerous walking trails and a wide variety of habitat including cliffs, downs and woodland.
Navitus Bay Socio-Economic and Tourism Baseline Assessment
Baseline Report | April 2013 39
It is also home to the historic Anvil Point Lighthouse and one of the largest stone spheres in the world, The Great Globe.
Christchurch
5.19 At Christchurch, attractions include visiting the remains of Christchurch Castle, and a number of museums including the Museum of Electricity. There is also the Adventure Wonderland theme park.
Isle of Wight
5.20 Needles Park provides various attractions including rides, a chairlift to the beach, glassmaking crafts, a sweet factory, kid’s activities and shopping and eating outlets. There are also a number of historical attractions and museums such as the Brighstone Village Museum, The Heritage Attractions, Tennyson Monument. Children’s activities include The Dinosaur Isle, Britain's first purpose built dinosaur museum and visitor attraction.
Wareham
5.21 In Wareham, one of the major attractions is the thousand year old Corfe Castle. It offers visitors the chance to enjoy views across Purbeck. There are walks around the castle as well as a model village which depicts the Castle and village as it was in 1646. Other attractions in Wareham include the Tank Museum and the Purbeck Information and Heritage Centre.
New Forest National Park
5.22 Another key attraction is the New Forest National Park where there a multitude of attractions and activities8. Within the park are museums such as the Beaulieu National Motor Museum. There are a number of parks and gardens, including Exbury Gardens where there is a steam railway. Visitors can visit historic buildings such as Beaulieu Abbey as well as look at wildlife and nature at locations such as the Liberty's Owl Raptor and Reptile Centre and The New Forest Wildlife Park. Paultons Family Theme Park is situated close to the eastern edge of the New Forest National Park. This includes Peppa Pig World which opened in recent years and is specifically aimed at younger children.
5.23 Within the New Forest District lies the Port of Lymington, which is well known for sailing. It hosts a number of world famous regattas such as the Royal Lymington Cup and the Source Regatta. The town also holds a number of major keelboat and dinghy events.
5.24 On the southern edge of the New Forest District there are a number of small seaside villages such as Barton on Sea and Milford on Sea, which offer picturesque views across to the Isle of Wight.
Accommodation Stock
5.25 In 2010 VisitEngland carried out an accommodation stock audit in both the South West and South East of England. The audit determines the number of serviced establishments
8 It should be noted that sections to the north of National Park in Wiltshire are not included in study area and are therefore not included in this assessment
Navitus Bay Socio-Economic and Tourism Baseline Assessment
Baseline Report | April 2013 40
versus the number of non-serviced establishments in the area and also specifies the number of bed spaces contained within these establishments.
South West
5.26 The majority of serviced accommodation provision is located within Dorset and Somerset. However, in general there is a fairly even split across the South West areas. In terms of non-serviced establishments, over two-thirds are found in Cornwall, the Isles of Scilly and Devon. A fifth is found in Dorset and Somerset, whilst only small proportion is found in the Gloucestershire, Wiltshire and Bristol/Bath area.
5.27 Table 5-2 shows that in terms of the number of serviced bed spaces, nearly a third of the stock (31%) is found in Dorset and Somerset. Whilst for non-serviced bed spaces the majority is found in Cornwall and the Isles of Scilly (36%).
5.28 Dorset and Somerset are well represented with serviced and non-serviced accommodation providers and bed spaces, indicating their popularity and importance as a tourist destination.
Table 5-2 Serviced and Non-Serviced Accommodation Bed Space Provision in South West of England 2010
Dorset and Somerset
Gloucestershire, Wiltshire and
Bristol/Bath area
Cornwall and Isles of Scilly Devon
South West
Number of Serviced establishments
2,348 1,423 1,551 1,716 7,038
% of South West Total
33% 20% 22% 24%
Number of serviced bed spaces
57,899 51,351 30,677 27,352 187,085
% of South West Total
31% 27% 16% 25% -
Number of non-serviced establishments
2,575 862 4,478 4,691 12,606
% of South West Total
20% 7% 36% 37% -
Number of non-serviced bedspaces
193,659 53,476 236,004 127,994 635,356
% of South West Total
30% 8% 37% 24% -
Source: South West of England Regional Summary (VisitEngland, 2010)
South East
5.29 Approximately a quarter (27%) of the serviced accommodation provision is located within Hampshire and the Isle of Wight, with the majority being found in Surrey, East and West Sussex. However, in terms of non-serviced accommodation, Hampshire and the Isle of Wight have a far greater share (42%) than the other counties. This suggests that self-catering type accommodation is popular in these areas.
Navitus Bay Socio-Economic and Tourism Baseline Assessment
Baseline Report | April 2013 41
5.30 Table 5-3 shows that in terms of serviced bed spaces, 25% of the region’s stock is found in Hampshire and the Isle of Wight. These areas also have the largest share of non-serviced bed spaces at just over a third (36%).
Table 5-3 Serviced and Non-Serviced Accommodation Bed Space Provision in South East of England 2010
Hampshire and Isle of
Wight
Berkshire, Buckinghamshire and Oxfordshire
Surrey, East and
West Sussex Kent
South East
Number of Serviced establishments
1,776 1,614 2,010 1,141 6,541
% of South East Total
27% 25% 31% 17% -
Number of serviced bed spaces
54,560 61,706 72,365 33,139 221,770
% of South East Total
25% 28% 33% 15% -
Number of non-serviced establishments
1,728 366 1,175 871 4,140
% of South East Total
42% 9% 28% 21% -
Number of non-serviced bed spaces
87,756 32,198 78,838 43,138 241,930
% of South East Total
36% 13% 33% 18% -
Source: South East of England Regional Summary (VisitEngland, 2010)
Tourism Volume and Value
Domestic Trips, Nights and Spend
5.31 The volume and value of domestic tourism in the South West is far greater than that of the South East (Table 5-4). Overall both regions have not seen any major changes in their domestic tourism figures between 2007 and 2011. This shows the relative popularity of both these regions, to perform consistently in the current economic climate. The recession and the advent of more people choosing to holiday in the UK may have helped these regions.
5.32 Dorset accounts for just over 16% of the South West of England region’s domestic tourism and value9. Domestic tourism in Dorset has remained generally stable. There have been small reductions in average annual trips (-2%), nights (-4%) and spend (-2%) between the 2007 to 2009 and 2009 to 2011 periods.
9 The South West region is made up of the following sub-regions: Cornwall, Devon, Dorset, Somerset, Bristol, Gloucestershire and Wiltshire.
Navitus Bay Socio-Economic and Tourism Baseline Assessment
Baseline Report | April 2013 42
5.33 Hampshire makes up approximately 20% of the South East region’s domestic tourism and value10. As with Dorset, the area’s performance has remained relatively consistent, with small percentage decreases recorded in average trips, nights and spend between the reporting periods of 2007-09 and 2009-11.
5.34 The Isle of Wight performance has also seen modest increases in these areas over the same time period. The average annual spend in the Isle of Wight is relatively high given its size, as it accounts for nearly 10% of the South East’s total spend.
5.35 At a local level, Poole, Purbeck and Bournemouth make up approximately 5-10% of the South West’s tourism and value. Whereas these areas account for nearly 50% of Dorset’s tourism and value. Bournemouth is the most popular destination in Dorset for domestic tourism, with 30% of Dorset’s annual trips and spend coming from the seaside town. Despite its popularity, between the reporting periods of 2007-09 and 2009-11, Bournemouth has seen a fall in its number of trips (-2%) and nights (-4%). Over the same time period, Poole has also seen its tourism and value figures reduced. Purbeck has experienced a distinct reduction in its number of trips (-17%), nights (-23%) and spend (-11%).
10 The South East region is made up of the following sub-regions: Berkshire, Buckinghamshire, East Sussex, Hampshire, Isle of Wight, Kent, Oxfordshire, Surrey and West Sussex
Navitus Bay Socio-Economic and Tourism Baseline Assessment
Baseline Report | April 2013 43
Table 5-5-4 Tourism – Domestic Trips, Nights and Spend (3- Year Averages)
Navitus Bay Socio-Economic and Tourism Baseline Assessment
Baseline Report | April 2013 44
Overseas Visitor Trips
Number of Trips
5.36 Figure 5-1 shows that in terms of overseas tourism trips, Hampshire destinations are more popular relative to Dorset and the Isle of Wight. In relation to the South East of England, Hampshire accounted for 15% of trips in 2011, whilst the Isle of Wight contributed 1%.16% of overseas trips to the South West were to Dorset.
5.37 Between 2003 and 2011, overseas trips to Hampshire have fluctuated, from a low of 500,000 trips in 2005 to a high of 670,000 trips in 2006. Recent trends have shown an increase in trips to the area, whereas figures for Dorset and the Isle of Wight for the same period have remained fairly stable and consistent.
Figure 5-1 Overseas Trips (000’s)
Source: Overseas Tourism in UK Countries/Regions 2011 (VisitBritain, 2011)
Purpose of Visit
5.38 Trip purpose is detailed in Table 5-5, with the majority of overseas visits from those either on holiday or visiting friends or relatives.
Table 5-5 Purpose of Overseas Visits (000’s) (2011)
Holiday VFR* Business Other Study Dorset 164 (49%) 103 (31%) 41 (12%) 8 (2%) 19 (6%) Hampshire 204 (33%) 254 (41%) 133 (21%) 24 (4%) 11 (2%) Isle of Wight 27 (44%) 28 (46%) 4 (7%) 0 (0%) 2 (3%) South West 880 (42%) 739 (35%) 347 (17%) 71 (3%) 52 (2%) South East 1,422 (33%) 1,590 (37%) 933 (22%) 246 (6%) 112 (3%)
Source: Office for National Statistics. International Passenger Survey 2011
*VFR – Visiting friends and relatives
0
100
200
300
400
500
600
700
800
2003 2004 2005 2006 2007 2008 2009 2010 2011
Dorset
Hampshire
Isle of Wight
Navitus Bay Socio-Economic and Tourism Baseline Assessment
Baseline Report | April 2013 45
Overseas Visitor Nights
Number of Nights
5.39 In terms of overseas nights, as with trips, Hampshire counted for the majority in comparison with Dorset and the Isle of Wight. However, in 2011 Hampshire only accounted for 14% of the South East’s overseas nights. Whilst Dorset accounted for 17% of the South West figure.
5.40 Both Hampshire and Dorset have experienced fluctuations in overseas nights between 2003 and 2011 (Figure 5-2). The biggest change was noted in Dorset which saw a 65% increase from 2.6 million nights in 2005 to 4.3 million nights in 2006. This correlates to the 12% increase in overseas trips seen during the same time period. Hampshire also saw a large increase (43%) from 3.9 million nights in 2005 to 5.6 million trips in 2006. However, both these areas have seen reductions in overseas nights spent between 2009 and 2010 (Dorset -22%, Hampshire -17%) which can be explained by the current financial situation, with people having less disposable income for overseas trips. However, both Dorset and Hampshire have increased since 2010.
5.41 The Isle of Wight, however, has appeared to be relatively unaffected by the current financial climate in terms of overseas nights spent, as its figures have remained fairly consistent between 2003 -10.
Figure 5-2 Overseas Nights (Millions) (2011)
Source: Overseas Tourism in UK Counties/Regions 2011 (VisitBritain)
Accommodation Used
5.42 Table 5-7 shows that the majority of these nights, as with visits, were spent free at friends’ or relatives’ accommodation. A significant number of nights were also spent in hotel accommodation, for all the areas concerned. These trends are generally consistent with those seen at the wider England level.
0.0
1.0
2.0
3.0
4.0
5.0
6.0
2003 2004 2005 2006 2007 2008 2009 2010 2011
Dorset
Hampshire
Isle of Wight
Navitus Bay Socio-Economic and Tourism Baseline Assessment
Baseline Report | April 2013 46
Table 5-6 Accommodation Used for Overseas Nights (000’s) (2011)
Dorset Hampshire
Isle of Wight
South West
South East
England
Free guest with relatives or friends 1,200 (41%) 2,504 (53%) 386 (62%)
8,380 (48%)
15,903 (48%)
53,739 (26%)
Hotel/guest house 223 (8%) 709 (15%) 96 (15%)
2,512 (14%)
5,251 (16%)
98,257 (47%)
Paying guest family or friends house 71 (2%) 93 (2%) 10 (2%)
Source: Office for National Statistics. International Passenger Survey 2011
Overseas Visitor Spend
Amount Spent
5.43 Figure 5-3 details the value of overseas tourism 2003-2011 in the region. As to be expected, given the greater number of visits and nights spent, Hampshire has secured a significant amount of spend across the study area. In 2011 across the South East region Hampshire accounted for 13% of its overseas spend. Whilst the Isle of Wight made up only 1.7%. Nearly a fifth of overseas spend in the South West in 2011 was taken from Dorset. This highlights the importance of Dorset a key tourist destination in the South West.
5.44 Dorset, Hampshire and the Isle of Wight have seen recent increases in overseas spend. Between 2010 and 2011 overseas spend in Hampshire increased by 30%. Overseas spend in Isle of Wight has doubled between 2010 and 2011, indicating that it is becoming an increasingly popular destination for overseas tourists.
Navitus Bay Socio-Economic and Tourism Baseline Assessment
Source: Overseas Tourism in UK Counties/Regions 2011 (VisitBritain)
Where Money is Spent
5.45 Table 5-8 illustrates the origin of spend by type of accommodation. The majority of spend for all areas originates from either visitors staying free with friends or relatives or those staying in hotels. These figures are not surprising given the similar trends recorded for overseas visits and nights spend. Again these figures are broadly similar to the total all England figures, where nearly 80% of revenue has come from those residing free with friends or relatives or from people staying in hotels.
0.0
50.0
100.0
150.0
200.0
250.0
300.0
2003 2004 2005 2006 2007 2008 2009 2010 2011
Dorset
Hampshire
Isle of Wight
Navitus Bay Socio-Economic and Tourism Baseline Assessment
Baseline Report | April 2013 48
Table 5-7 Full Year Accommodation Usage Figures for 2011 – Spend (£ million) – Staying Visitors
Source: Office for National Statistics. International Passenger Survey 2011
Overseas Activities
5.46 The International Passenger Survey (ONS, 2011b) is carried out annually and in it visitors to the UK are asked what activities they undertake whilst visiting. The top three most popular things to do in the South West of England were ‘eating in restaurants’, ‘going to a pub’ and ‘shopping for clothes and accessories’. Visiting the countryside was one area that makes the South West stand out from other regions, with over of third of respondents enjoying this activity. Built heritage was also a key draw for visitors, with a third going to see famous buildings or monuments. Less prominent activities include golf, researching ancestry and visiting spa/beauty centres.
5.47 Similar results were found in the South East of England, where again ‘eating in restaurants’ was the most popular activity. After this shopping for clothes/accessories was the second most popular choice of activity. ‘Going to the Pub’ and ‘Socialising with the locals’ were also common activities for many. As with the South West, visiting built heritage and going to the countryside were other popular draws.
Navitus Bay Socio-Economic and Tourism Baseline Assessment
Baseline Report | April 2013 49
6 COASTAL TOURISM PROFILES 6.1 The preceding chapter outlined visitor statistics for the region and sub-region acquired from
VisitEngland and VisitBritain. The following section refers to bespoke visitor profiles for the coastal area. These profiles also provide estimates of volume and value which can be overlaid with the VisitEngland and VisitBritain data and provide useful visitor profile information.
Isle of Wight
6.2 The Isle of Wight, situated 2.5 miles off the coast of Hampshire, is England’s largest island spanning some 150 square miles. The island has been a popular visitor destination since the Victorian era and regularly attracts around 2.5 million visitors each year.
6.3 The tourism industry employs around 15% of the island’s workforce and is one of the island’s main industries. A number of music festivals such as the Isle of Wight International Jazz Festival and the Isle of Wight (rock music) Festival add to the island’s visitor appeal. The Isle of Wight Walking Festival also attracts approximately 24,000 participants over a 2 week period in May making it one of the largest walking festivals in the UK. The island also has an extensive cycle path network and coastal paths to capitalise on the island’s attractive natural environment.
6.4 The Isle of Wight Tourism Activity Monitor report provides insight on the Isle of Wight’s tourism industry during 2010-2011.
Volume and Value
6.5 Table 6-1 shows that total tourist visits per annum fell slightly in 2010/11 (4%). However they have remained relatively stable over the last 4 years at around 2.5million per annum. Domestic visits account for around 9 out of 10 tourist visits (95%). Overall domestic visits fell recently (2%) as did overseas visitor numbers which notably decreased (-31%).
Overseas visitors p.a. 122 176 123 120 122 Source: Isle of Wight Tourism Activity Monitor Visitor statistics for tourism year (2010/2011)
6.6 Overall visitor expenditure slightly reduced in 2010/11 by 0.3% compared to 2009-10. The domestic staying visitor market accounts for over three quarters (83%) of the total value of the Isle of Wight’s visitor market. Day trippers and overseas visitors account for around 10% each.
Navitus Bay Socio-Economic and Tourism Baseline Assessment
Baseline Report | April 2013 50
Table 6-2 Value of Tourism (£million)
2010/11 2009/2010 % change
Day trip £35m £41m Domestic staying trip £336m £317m Overseas staying £30m £45m Total £402m £403m -0.3%
Source: Isle of Wight Tourism Activity Monitor Visitor statistics for tourism year (2010/2011)
6.7 The preferred method of travel on the island is by private car, as visitors are more likely to travel with their car to the island and use it to travel around (Table 6-3). The proportion of people choosing to walk on foot has increased by over 10% since 2009/10.
Source: Isle of Wight Tourism Activity Monitor Visitor statistics for tourism year (2010/2011)
6.8 Nearly half (43%) of domestic visitors surveyed were visiting the island for holiday. The majority of which were additional holidays to their main holidays (37%). The domestic business day trips to the island accounted for over a tenth of total domestic trips.
6.9 In terms of overseas trips nearly a third were visiting on holiday. Moreover, a relatively high proportion (30%) visited friends or relatives. Over a quarter of overseas trips were day trips whilst on holiday.
Navitus Bay Socio-Economic and Tourism Baseline Assessment
Baseline Report | April 2013 51
Table 6-4 Purpose of Trip 2010/11
Domestic Trips % Overseas Trips %
Overnight Main holiday 6% 6% Other holiday/leisure 37% 25% Visiting friends and relatives (overnight) 16% 30% Business (overnight) 3% 4% Leisure and business (overnight) 0% 1% Other (overnight) 1% 1% Day Day from home 12% 5% Day on holiday 4% 26% Visiting friends and relatives (day) 7% 4% Business (day) 13% 1% Other (day) 2% 0%
Source: Isle of Wight Tourism Activity Monitor Visitor statistics for tourism year (2010/2011)
6.10 Staying at the home of a friend or a relative is the most popular type of accommodation used by overnight visitors (37%). This may be related to the current recession with visitors trying to find more cost-effective forms of accommodation. Staying in hotel accommodation is the second most popular accommodation (Table 6-5). Staying in self-catering accommodation or static caravan/ chalets account for around a fifth of all accommodation. The island also has a notable proportion of visitors visiting their second home on the island (6%).
Table 6-5 Type of Accommodation used by Overnight Visitors (2010/11)
Accommodation Type
% Home of a friend or relative 37% Hotel 23% Rented Self-catering 10% Static caravan or chalet 4% Touring caravan or tent 11% Guest House or bed and breakfast 6% Second home 6% On-board a yacht/ boat 1% Other type of accommodation 1%
Source: Isle of Wight Tourism Activity Monitor Visitor statistics for tourism year (2010/2011)
6.11 Germany, France and the U.S.A account for the majority of overseas visitors to the island. Visitors from Spain have increased in recent years while the number of visitors from the Netherlands has declined.
Navitus Bay Socio-Economic and Tourism Baseline Assessment
Baseline Report | April 2013 52
Table 6-6 Origin of Overseas Visitors
2010/11 2009/10
Germany 13% 10%
France 10% 15%
U.S.A 10% 9%
Spain 9% 4%
Australia 7% 8%
Belgium 7% 1%
Rep. of Ireland 5% 1%
Netherlands 5% 8%
Source: Isle of Wight Tourism Activity Monitor Visitor statistics for tourism year (2010/2011)
6.12 Over half (53%) of domestic day visitors come from Hampshire which is unsurprising given its relatively close proximity. Nearby Dorset to the west and West Sussex; Surrey and London to the east account for around 5% each.
Table 6-7 Origin of Domestic Day Visitors
2010/11 2009/10
Hampshire 53% 52%
Dorset 7% 6%
West Sussex 5% 5%
Surrey 5% 5%
London 4% 5%
East Sussex 2% 2%
Wiltshire 2% 2%
Kent 2% 2% Source: Isle of Wight Tourism Activity Monitor Visitor statistics for tourism year (2010/2011)
6.13 The domestic staying visitor market is more fragmented attracting a greater proportion of visitors from further afield. Visitors from Hampshire still account for the majority of staying visitors however visitors from London and Surrey are also well represented.
Table 6-8 Origin of Domestic Staying Visitors
2010/11 2009/10
Hampshire 19% 18%
London 14% 13%
Surrey 9% 9%
West Sussex 5% 4%
Kent 4% 4%
Essex 4% 4% East Sussex 3% 3% Dorset 3% 3%
Source: Isle of Wight Tourism Activity Monitor Visitor statistics for tourism year (2010/2011)
Navitus Bay Socio-Economic and Tourism Baseline Assessment
Baseline Report | April 2013 53
6.14 There has been a decline in the proportion of tourists visiting a tourist attraction during their stay. 40% reported visiting a tourist attraction during their time on the island which is 11% lower than the previous year.
Table 6-9 Visits to Attractions
2010/11 2009/10 2008/09
% of all tourists visiting attractions
40% 51% 44%
Free 12% 15% 13%
Paid for 28% 36% 31% Source: Isle of Wight Tourism Activity Monitor Visitor statistics for tourism year (2010/2011)
6.15 The Isle of Wight has a high level of repeat visits particularly from visitors who returned within the last 12 months. This suggests a high level of satisfaction with the area’s tourism offer.
Table 6-10 Repeat Visitors 2010/2011
%
First visit 12%
Visited in last 12 months 62%
Visited 2-5 years ago 17%
Visited 5+ years ago 9% Source: Isle of Wight Tourism Activity Monitor Visitor statistics for tourism year (2010/2011)
New Forest
6.16 The New Forest District Council area sits between the Solent and east Dorset, and contains the majority of the New Forest National Park – which primarily covers areas in Hampshire but also extends north into Wiltshire; with a mix of forest, heathland and unenclosed pasture land. Villages and small towns are spread throughout the park boundary.
6.17 The New Forest was awarded National Park status in 2005 to conserve and enhance the area’s outstanding natural beauty, wildlife and cultural heritage. The Park covers 220 square miles and lies between the conurbations of Bournemouth and Southampton. It is bounded by the River Avon to the west and The Solent to the south.
6.18 The 2008 Economic Impact of Tourism in the New Forest (Tourism South East, 2008) outlines the tourism volume and value of the district council area.
Volume and Value
6.19 7.2 million day trips were made to the New Forest in 2008, which represented a slight rise (2.9%) in visitor numbers since 2006. Associated visitor expenditure marginally increased (2.4%) and now stands at around £278 million.
Navitus Bay Socio-Economic and Tourism Baseline Assessment
Baseline Report | April 2013 54
Table 6-11 Tourism Day Trips and Spend
Trips Spend
Total 2008 7,175,000 £277,755,000
Total 2006 6,975,000 £271,231,000
% change 2.9% 2.4% Source: The Economic Impact of Tourism New Forest (Tourism South East, 2008)
6.20 Almost 900,000 overnight trips were made in 2008 the vast majority (92%) from domestic tourists. However overseas visitors account for 17% of total overnight expenditure despite only accounting for 8% of total overnight visitors.
Table 6-12 Tourism Overnight Trips and Spend
Overseas
Trips
Spend
Domestic
Trips
Spend
Total 2008 801,800 £135,093,000 69,300 £27,286,000
Total 2006 823,000 £127,109,000 70,000 £26,887,000
% change -2.6% 6.3% -1% 1.5% Source: The Economic Impact of Tourism New Forest (Tourism South East, 2008)
6.21 The majority of domestic visitors stay in serviced accommodation (26%) such as hotels while around a quarter of visitors (24%) stay with friends or relatives. Touring caravans/ tents (22%) and static caravans/ tents (19%) also make up a sizable proportion of domestic tourists’ visitor accommodation.
6.22 A larger share of overseas tourists stay with friends and relatives (33%) and self-catering accommodation (9%) relative to domestic visitors. Serviced accommodation still accounts for around 1 in 4 accommodation types favoured by overseas tourists. Caravan and tent accommodation is also less favoured by overseas visitors.
Table 6-13 Accommodation type used (2008)
UK Overseas Total
Serviced 26% 25% 26%
Self-catering 5% 9% 6%
Touring caravans/ tents 22% 13% 21%
Static caravans 19% 12% 18%
Group. Campus 0% 0% 0%
Second homes 1% 3% 1%
Boat moorings 2% 0% 1%
Other 1% 4% 1%
Paying guests 0% 0% 0%
Staying with friends and relatives 24% 33% 25% Source: The Economic Impact of Tourism New Forest (Tourism South East, 2008)
6.23 Day visitors spend most of their expenditure on food and drink (42%) and shopping (25%). Domestic overnight and overseas overnight visitors’ expenditure is spread more evenly between accommodation, shopping and food and drink.
Navitus Bay Socio-Economic and Tourism Baseline Assessment
Baseline Report | April 2013 55
6.24 The day visitor market is worth almost two thirds (63%) of the New Forest’s overall visitor market; overnight domestic market is worth around a third (31%). The overnight overseas tourism market is worth 6% in total.
Table 6-14 Sector Breakdown of Visitor Expenditure (2008)
UK touristsOverseas tourists
Sub-Total Tourist
day visits
Total
£m Accommodation £41.0 £7.4 £48.4 £0.0 £48.4
Shopping £25.3 £8.0 £33.2 £69.8 £103.0
Food and drink £29.8 £6.0 £35.8 £117.1 £152.9 Attractions/ entertainment
Source: The Economic Impact of Tourism New Forest (Tourism South East, 2008)
Dorset
6.25 Dorset is located in South West England and covers an area of 1,000 square miles bordering Hampshire to the east, Wiltshire to the north-east, Somerset to the north-east and Devon to the south-west. Bournemouth-Poole accounts for almost half of Dorset’s population. The area beyond this is primarily rural and has a low population density.
6.26 Tourism is a key employer and major driver of Dorset’s economy, especially in the coastal areas. The Dorset Visitor Study (2009) provides detailed information on the profile of tourists visiting Dorset; their main motivation for visiting the area and their origin and expenditure patterns.
Domestic
6.27 Over half (57%) of domestic visitors are from the immediate South East and South West area. London and the West Midlands account for around 10% (9% and 8% respectively). Visitors from Wales, Scotland and Northern Ireland only account for 6% of all domestic visits.
Navitus Bay Socio-Economic and Tourism Baseline Assessment
Baseline Report | April 2013 56
Table 6-15 UK Visitor Origins (2009)
% South East 29% South West 28% London 9% West Midlands 8% North West 6% East Midlands 6% North East 6% Wales 3% East Anglia 2% Scotland 2% Northern Ireland 1%
6.28 Germany and Holland make up the largest share of the area’s overseas visitors market (19% and 18% respectively). Ireland also accounts for a notable share (9%).
Table 6-16 Overseas Visitor Origin (2009)
% Germany 19% Holland 18% Ireland 9% USA 6% Italy 6% France 6% Poland 5% Guernsey 5% Canada 5% Australia 5% Spain 4% Belgium 4% Switzerland 3% Jersey 3% Rest of World 6%
6.29 Bournemouth is the most popular destination in Dorset accounting for 1 in 4 trips (25%). The Weymouth and Portland area was the second most popular destination (16%). The coastal areas of Christchurch and Poole were two of the least popular destinations in Dorset (8% and 4% respectively).
Navitus Bay Socio-Economic and Tourism Baseline Assessment
Baseline Report | April 2013 57
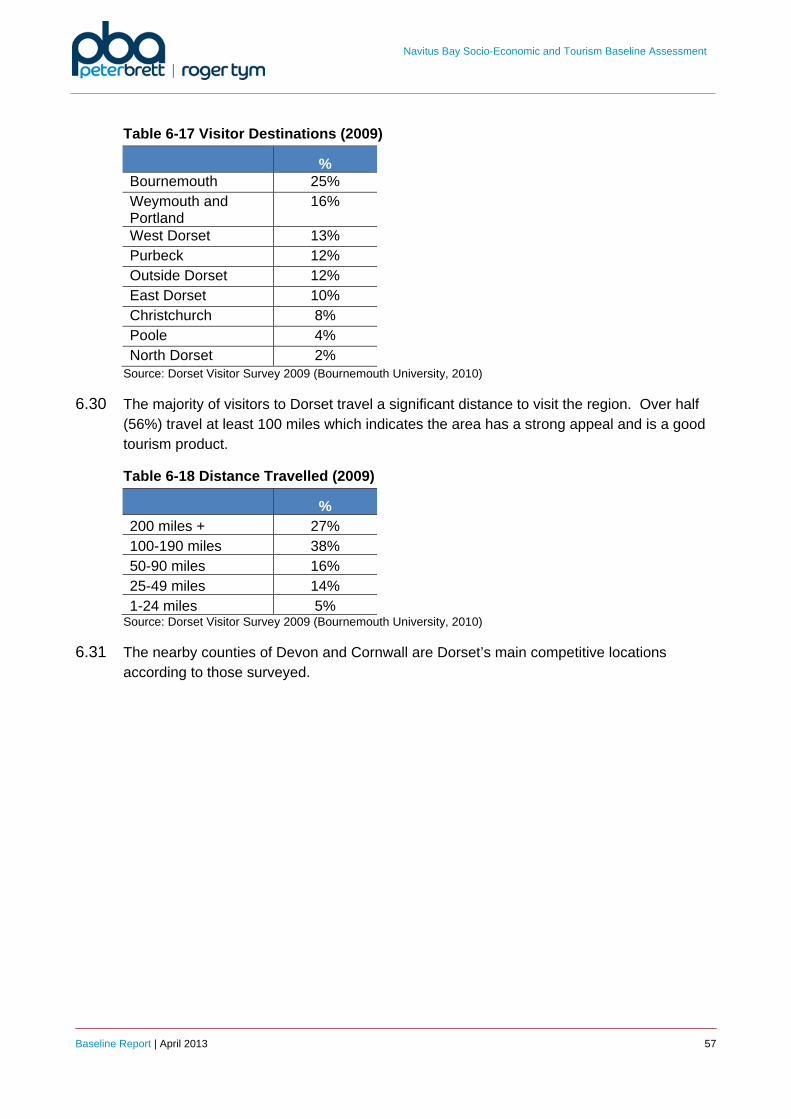
Table 6-17 Visitor Destinations (2009)
% Bournemouth 25% Weymouth and Portland
16%
West Dorset 13% Purbeck 12% Outside Dorset 12% East Dorset 10% Christchurch 8% Poole 4% North Dorset 2%
6.30 The majority of visitors to Dorset travel a significant distance to visit the region. Over half (56%) travel at least 100 miles which indicates the area has a strong appeal and is a good tourism product.
Table 6-18 Distance Travelled (2009)
% 200 miles + 27% 100-190 miles 38% 50-90 miles 16% 25-49 miles 14% 1-24 miles 5%
6.32 Visiting the seaside, beaches and coastal area was the main motivation for domestic trips to Dorset (22%). Visiting friends and relatives was also a common reason for visiting (19%).
6.33 Over a third (35%) of overseas visitors were visiting friends and relatives in the area, while around a quarter (24%) wanted to visit somewhere they had not been before.
Table 6-20 Main Motivation for Visiting the Area (2009)
UK Overseas
Visited the area before 20% 10%
Visiting friends and relatives 19% 35% Wanted to go somewhere they had not been before
10% 24%
Seaside, beaches, coast 22% 6%
Scenery and countryside 5% 1%
Recommended by friends 4% 7%
Local visitor attractions 4% 9%
Easy to get to 2% 1%
Peace and quiet 1% 1%
Good shopping facilities 0% 0%
Cultural heritage 2% 6%
Sporting activities 4% 0%
An event of festival 8% 4%
Trying local food 0% 0%
World heritage site 4% 3% Source: Dorset Visitor Survey 2009 (Bournemouth, University, 2010)
6.34 Over 90% of visitors rated the availability, quality, standard and service in Dorset accommodation to be either good or very good.
Navitus Bay Socio-Economic and Tourism Baseline Assessment
6.35 The average number of visitor nights spent in Dorset has steadily declined since 2007. In 2009 on average visitors spent around 6.7 nights in Dorset compared to 7.7 nights in 2006. People spend the least number of nights in Bournemouth (5.7 nights) and stay the most number of nights in East Dorset (7.3 nights).
6.36 Around a third (32%) of visitors stay in hotel accommodation. A further 22% stay in mobile accommodation such as a campervan; tent or touring caravan.
Table 6-23 Accommodation (2009)
%
Hotel 32%
Guest House/ bed and breakfast 8%
Self-catering 11%
Static caravan 6%
Campervan/ mobile 7%
Holiday park 3%
Touring caravan/ tent 15%
Home of a friend 13%
Second home 1%
Other 4%
Navitus Bay Socio-Economic and Tourism Baseline Assessment
6.38 The language school market in Bournemouth and Poole is estimated to generate 36,000 trips, 1.3million bed nights and an overall spend of £130m11.
6.39 Conferences in Bournemouth and Poole are estimated to generate 353,000 trips, 371,000 nights, generating an estimated spend of £123.8m12.
Coastal Tourism Summary
6.40 Bournemouth, Poole, Christchurch, Swanage and parts of the Isle of Wight and New Forest have high concentrations of tourism related businesses, while all of the coastal authorities (with the exception of Poole) have above average tourism related employment.
Isle of Wight
6.41 The Isle of Wight has a relatively steady number of visitors each year (c.2.5m). Its visitor market is heavily reliant on domestic staying visitors. Almost half (43%) of domestic visitors were on holiday trips. The day trip market is mainly locally based with over half of visitors’ travelling from neighbouring Hampshire. The domestic overnight market attracts visitors from a wider geographic area. The Isle of Wight is also characterised by a high level of repeat visitors with over a third of all visitors visiting a paid or unpaid attraction.
New Forest
6.42 The New Forest National Park is growing in popularity and now attracts around 8 million visitors per annum. Day trips account for the majority of visits however overseas visitors are also extremely valuable. Overseas tourists, while only accounting for 8% of total overnight visitors, accounts for 6.3% spend.
Dorset
6.43 Dorset (including Bournemouth; Poole and Christchurch) has a strong visitor appeal with the majority of visitors travelling over 100 miles. According to visitors Dorset also offers a
11 Team, 2008, Bournemouth and Poole Tourism Strategic Framework; based on 2005 data 12 Team, 2008, Bournemouth and Poole Tourism Strategic Framework; based on 2005 data
Navitus Bay Socio-Economic and Tourism Baseline Assessment
Baseline Report | April 2013 61
high level of accommodation. However the average number of nights has steadily fallen since 2007. The immediate South East and South West area make up the majority of the domestic visitor market. Visiting the beaches and staying with friends and relatives was the main visitor incentive for domestic and overseas tourists respectively. Conference and language school markets are important parts of the Bournemouth and Poole tourism market.
Navitus Bay Socio-Economic and Tourism Baseline Assessment
Baseline Report | April 2013 63
7 ONSHORE CABLE ROUTE AND SUBSTATION 7.1 Site visits have been used to establish the tourism businesses and destinations alongside
the route of the onshore cable and around the substation at Mannington, within the 2 km zone around the cable route and substation. In addition to the potential impacts common to other tourism businesses across the study area, these locations may be affected by additional impacts from the construction and decommissioning phases, such as obstruction, or other effects such as noise or traffic.
7.2 Figure 7-1 notes the businesses identified and their location.
7.3 The cable route comes onshore between Barton-on-Sea and Milford on Sea. The underground cable route goes past Hordle, around New Milton, and passes Hinton, Sopley and Avon before heading through West Moors to the substation site in Three Legged Cross. The first half of the cable route is located underground in Hampshire and the second half is within Dorset.
7.4 Tourist attractions in proximity to the proposed cable route include Snowtrax Ski Centre and Matchams Karting Centre. The route also runs nearby various walking and cycling route including a number of rights of way and National Cycling Route 2.
7.5 It is also noted that the cable route runs through a number of small towns or villages without tourist attractions.
Navitus Bay Socio-Economic and Tourism Baseline Assessment
Baseline Report | April 2013 64
Figure 7-7-1 Tourism Businesses and Destinations along the Cable Route and Substation
Navitus Bay Socio-Economic and Tourism Baseline Assessment
Baseline Report | April 2013 65
8 TOURISM BUSINESS DENSITY BY AREA 8.1 Table 8-1 shows the number of tourism related businesses13 located along a 5 km and
10 km coastal strip and within 15 km of the proposed substation (see Figure 8-1 overleaf).
8.2 The proportional split between tourism business types is broadly similar across each of the three geographic areas. Restaurants account for approximately half of all tourism related businesses. Hotels account for between 13 and 17%, while sporting activities account for between 14 and 18%.Three quarters (76%) of tourism related businesses within the 10 km strip of the coastal are located within the core 5 km coastal strip.
Table 8-1 Tourism Business Density (200814) Geographic area
Hotels Camping sites and other
provision of short-stay
accommodation
Restaurants Sporting activities
Other recreational
activities
TOTAL
5 km coastal area
192 90 617 159 105 1,163
10 km coastal area
249 141 764 248 135 1,537
15 km from substation
164 74 659 214 109 1,220
% OF TOTAL
5 km coastal area
17% 8% 53% 14% 9% 100%
10 km coastal area
16% 9% 50% 16% 9% 100%
15 km from substation
13% 6% 54% 18% 9% 100%
Source: ONS ABI (2012)
8.3 Figure 8-1 shows the concentration of tourism related businesses in the study area. Bournemouth, Poole, Christchurch, Swanage, and parts of the Isle of Wight and New Forest have notably high tourism business densities which is unsurprising given their role as visitor destinations and tourism centres.
13 By broad classification type 14 Latest data available
Navitus Bay Socio-Economic and Tourism Baseline Assessment
Baseline Report | April 2013 66
Figure 8-1 Tourism Business Density Map (2008)
Navitus Bay Socio-Economic and Tourism Baseline Assessment
Baseline Report | April 2013 67
Tourism Businesses by Area
8.4 Using data received from Experian, the make-up of tourism businesses located in key towns within proximity of the project can be identified.
Bournemouth
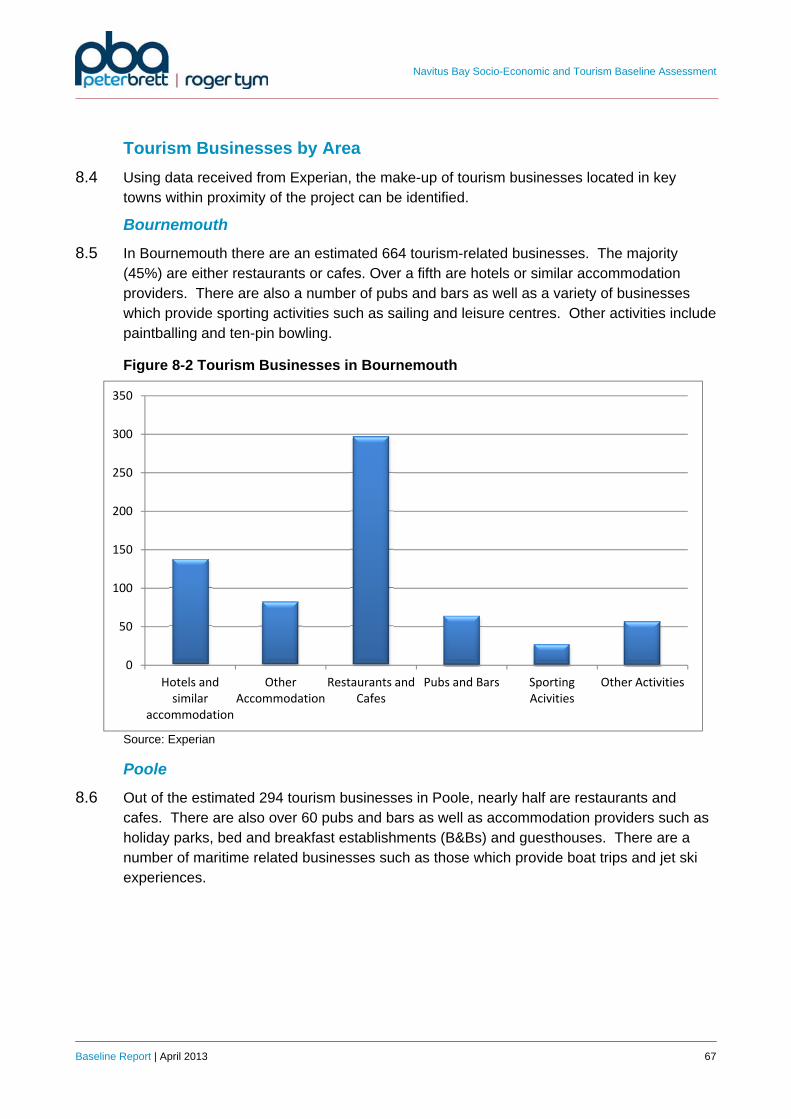
8.5 In Bournemouth there are an estimated 664 tourism-related businesses. The majority (45%) are either restaurants or cafes. Over a fifth are hotels or similar accommodation providers. There are also a number of pubs and bars as well as a variety of businesses which provide sporting activities such as sailing and leisure centres. Other activities include paintballing and ten-pin bowling.
Figure 8-2 Tourism Businesses in Bournemouth
Source: Experian
Poole
8.6 Out of the estimated 294 tourism businesses in Poole, nearly half are restaurants and cafes. There are also over 60 pubs and bars as well as accommodation providers such as holiday parks, bed and breakfast establishments (B&Bs) and guesthouses. There are a number of maritime related businesses such as those which provide boat trips and jet ski experiences.
0
50
100
150
200
250
300
350
Hotels and similar
accommodation
Other Accommodation
Restaurants and Cafes
Pubs and Bars Sporting Acivities
Other Activities
Navitus Bay Socio-Economic and Tourism Baseline Assessment
Baseline Report | April 2013 68
Figure 8-3 Tourism Businesses in Poole
Source: Experian
Christchurch
8.7 The historic town of Christchurch, which lies between Bournemouth and the New Forest, accommodates around 135 tourism businesses, the majority of which are restaurants and cafes. The area has a wide range of accommodation providers, from traditional hotels to camping parks. Pubs and bars are also well represented. Other attractions include historic Grade I listed buildings and children’s theme parks.
Figure 8-4 Tourism Businesses in Christchurch
Source: Experian
0
20
40
60
80
100
120
140
160Numberof Businesses
0
10
20
30
40
50
60
Number of Business
Navitus Bay Socio-Economic and Tourism Baseline Assessment
Baseline Report | April 2013 69
Swanage
8.8 Just over a third of Swanage’s 99 tourism businesses are made up of a range of accommodation providers including holiday and caravan parks, B&Bs and guesthouses. There are over 25 restaurants and cafes. Other activities include amusements, a country park and museums.
Figure 8-5 Tourism Businesses in Swanage
Source: Experian
Tourism Employment
8.9 Table 8-2 below shows the number of tourism related jobs and their proportional share of overall jobs for each of the coastal local authorities in the study area and the wider Dorset, Hampshire and South West and South East study area.
8.10 Tourism related employment in the South East LPAs Isle of Wight and New Forest has increased in recent years whereas tourism related employment in the South West local authorities has either remained broadly constant (Christchurch and Purbeck) or declined (Bournemouth, Poole and Weymouth and Portland). This South West/ South East trend is also event at the wider County Council level and regional level.
8.11 Tourism related employment accounts for an above average proportion of all employment in each local authority (with the notable exception of Poole). Tourism related employment in the southern west LPAs Purbeck and Portland account for a particularly high share of all employment. The Isle of Wight and New Forest also have a high proportion of tourism related jobs compared to the regional average.
0
5
10
15
20
25
30
35
40
Number of Businesses
Navitus Bay Socio-Economic and Tourism Baseline Assessment
South East - 8.2% - 8.0% - 8.0% South West - 9.0% - 9.2% - 9.3%
Source: NOMIS 2013
Navitus Bay Socio-Economic and Tourism Baseline Assessment
Baseline Report | April 2013 71
9 EX POST TOURISM ASSESSMENT 9.1 This section provides an assessment of the post-development tourism impact onshore from
a number of existing and operational offshore wind farms. These have all been selected to be comparable with the project in terms of visibility from onshore. The following offshore wind farms, each of which are located 12 km or less from the shore are subject to assessment, and are shown in Table 9-1.
Kentish Flats R1 06/05 90 Operating 8.5-9.8 Herne Bay + Kent
Lynn R1 03/09 97.2 Operating 5.0-6.9 South Lincolnshire
Inner Dowsing
R1 03/09 97.2 Operating 5.0-6.3 South Lincolnshire
Scroby Sands
R1 07/04 60 Operating 2.3-3.5 Norfolk + East Anglia
9.2 The assessment (where data are available) reviews the following distinct phases: pre-construction, construction and post construction.
Principal Data Sources
9.3 Data on domestic tourism trips and bed nights were sourced from Visit England, Visit Wales and Visit Scotland. The domestic tourism data in the local onshore area are set in context within the wider overall domestic tourism at regional level. In some cases it was not possible to collect pre-construction data due to the time at which the wind farm came into operation.
Robin Rigg
Size and location
9.4 Robin Rigg offshore wind farm (180MW) became operational in 2009. The wind farm consists of 60 turbines and is located in the Solway Firth on the England/Scotland border, 9 km from the North Cumbrian coast and 9 km from Balcary Point on the coast of Dumfries and Galloway. The onshore substation is located near Seaton, Cumbria.
Navitus Bay Socio-Economic and Tourism Baseline Assessment
Baseline Report | April 2013 72
9.5 Tourism data for Allerdale are the more relevant dataset, which can be set against tourism data for the wider Cumbria area. Tourism volume in Dumfries and Galloway is also assessed.
Tourism context
9.6 The Lake District National Park is located in Cumbria. It is England’s largest national park and is a popular destination for walking and other outdoor activities. However, the section of the national park, which is in Allerdale does not reach the coast. Dumfries and Galloway’s visitor profile is also characterised by outdoor activities, particularly walking, cycling and fishing.
Tourist trips and bed nights
9.7 The number of domestic tourist trips increased in Allerdale and Cumbria during the pre-construction phase and continued to increase throughout the construction and operational phases of the wind farm. The number of bed nights in Allerdale remained relatively stable during the pre-construction and operational phase of the wind farm. The number of bed nights in Cumbria has generally followed an upward trend from pre-construction to post construction.
9.8 Dumfries and Galloway experienced a decline in domestic tourism trips during the pre-construction, construction and operational phase of the wind farm. During this time the UK experienced above average levels of rainfall and this may have been influential in discouraging people from taking trips, which involved outdoor activities. However, 2011 saw a significant increase in the number of trips. Bed nights remained stable between 2007 and 2009 before reaching their highest level in 2010.
9.9 Recessionary influences were also likely to have influenced the area’s tourism figures. The data indicate that more tourists may be foregoing overseas trips for domestic trips but staying for a shorter period of time. Floods in Cumbria in 2009 did not seem to have adversely impacted upon domestic tourism levels.
9.10 Assessment of the tourism data indicates that construction and post-construction operation of Robin Rigg offshore wind farm has had no noticeably adverse tourism impact on the surrounding tourism region.
Table 9-2 Volume of Domestic Tourism and % Change on Previous Dataset
Navitus Bay Socio-Economic and Tourism Baseline Assessment
Baseline Report | April 2013 73
Table 9-3 Volume of Domestic Tourism and % Change on Previous Year
Trips Nights
Dumfries and Galloway
% change Dumfries and Galloway
% change
2007 0.8 2.6
2008 0.79 -1.3 2.6 0
2009 0.75 -5.3 2.6 0
2010 0.72 -4.2 3 13.3
2011 0.83 13.3 Not available Not available
Source: Visit Scotland
Barrow
Size and location
9.11 Barrow offshore wind farm (90 MW) is located in the East Irish Sea, approximately 7 km south west of Walney Island, near Barrow-in-Furness. The wind farm became operational in 2006. The most relevant tourism regions, for which data are available, are Barrow-in-Furness and Cumbria.
Tourism context
9.12 Barrow-in-Furness is a large industrial town, which has become an established hub for energy generation. The area offers beaches, museums and a castle but is not renowned as a popular tourist destination.
Tourist trips and bed nights
9.13 The number of tourist trips increased in Barrow following the construction of the wind farm. There was also a significant increase in bed nights (32.9%), which indicates extended visitor stays. The number of trips has fallen in recent years, however bed nights for the most recent period are at their highest level.
9.14 In Cumbria the number of domestic tourist trips also increased following the construction and remained relatively stable before peaking during the 2009-11 period. Bed nights also peaked during 2009-11.
9.15 Tourism numbers in Barrow-in-Furness and the wider Cumbria appear unaffected by Barrow offshore wind farm. Indeed bed nights in Barrow-in-Furness and bed nights and trips increased to their highest level during 2009-11.
Navitus Bay Socio-Economic and Tourism Baseline Assessment
Baseline Report | April 2013 74
Table 9-4 Volume of Domestic Tourism and % Change on Previous Dataset
9.16 Burbo Bank offshore wind farm (90MW) consists of 25 turbines and is situated on the Burbo Flats in Liverpool Bay, 7 km from North Wirral. The substation is located in North Wales. The Wirral and Merseyside tourism regions are the most relevant datasets available to assess the tourism impact of Burbo Bank.
Tourism context
9.17 The Wirral possesses a variety of tourist attractions, it being well known for its good quality beaches and golf courses; and the area is due to host the Golf Open Championships in 2014.
Tourist trips and bed nights
9.18 Between construction and operation of the wind farm the Wirral experienced a significant drop in number of trips (19%). However tourist trips increased following the construction phase and peaked in 2009-11. Bed nights have fallen however to their lowest level, which could be a result of the prolonged economic downturn.
9.19 The number of domestic trips and bed nights spent in Merseyside dipped during the construction phase but has now returned to a higher level than the initial recession of 2008.
9.20 The tourism datasets indicate that neither the Wirral, nor Merseyside have been adversely affected by Burbo Bank.
Navitus Bay Socio-Economic and Tourism Baseline Assessment
Baseline Report | April 2013 75
Table 9-5 Volume of Domestic Tourism and % Change on Previous Dataset
9.21 Lynn and Inner Dowsing are two adjacent offshore wind farms (both 97.2 MW) located in the North Sea, c.5 km off the Lincolnshire coast. Lynn is 5.2 km off the shore of Skegness and Inner Dowsing 5.2 km off the shore of Ingoldmells. Both started operating in March 2009. The substation is in Skegness, on the Lincolnshire coast.
Tourism context
9.22 Skegness is a popular family seaside destination, the beach and the pier being popular outdoor attractions.
Tourist trips and bed nights
9.23 Skegness has experienced a continuous increase in number of trips between 2006 and 2011. There was a distinct increase (8%) in number of trips between the construction phase and operational period. It is likely that this is as a result of people holidaying at destinations closer to home due to the economic recession. There has also been an increase in number of trips and bed nights in the wider Lincolnshire area.
9.24 It would appear neither Lynn nor Inner Dowsing wind farms have had detrimental effects on domestic tourism levels in Skegness or Lincolnshire as a whole.
Navitus Bay Socio-Economic and Tourism Baseline Assessment
Baseline Report | April 2013 76
Table 9-6 Volume of Domestic Tourism and % Change on Previous Dataset
9.25 Rhyl Flats offshore wind farm (90 MW) is located 8 km off the coast of North Wales near Cowlyn Bay. The substation is in Towyn, a seaside resort on the North Wales coast. Rhyl Flats became operational in 2009.
Tourism context
9.26 Tourism is a vital industry in North Wales accounting for a third of the overall Welsh tourism industry (Tourism Partnership North Wales 2009). North Wales is known for its scenic beauty, scenery and countryside.
Tourist trips and bed nights
9.27 The number of trips to North Wales varied during the pre-construction period and fell slightly during construction. This may have been as a result of the UK economic recession and downturn. However post-construction the trips and bed nights increased to their highest level. The distinct increase in number of trips and bed nights could also indicate that North Wales is becoming a more appealing tourist destination. The North Wales tourism industry appears more buoyant than the Welsh national tourism industry as a whole, which while experiencing year on year fluctuations remains below its 2006 level for trips and bed nights.
9.28 Rhyl Flats has not had any noticeable impact on North Wales tourism, which is now at its highest level since 2006.
Navitus Bay Socio-Economic and Tourism Baseline Assessment
Baseline Report | April 2013 77
Table 9-7 Domestic Tourist Trips and Bed nights and % Change on Previous Year
Trips (millions)
Bed nights (millions)
North Wales
% change
Wales % Change
North Wales
% change
Wales % Change
2006 3.24 9.61 12.91 36.4
2007 2.95 -9.8 8.9 -8.6 11.43 -12.9 32.1 -13.5
2008 3.18 7.2 8.5 -4.2 11.98 4.6 31.9 -0.6
2009 2.99 -6.4 9.0 5.1 12.17 1.6 32.9 3.0
United Kingdom Tourism Survey
Scroby Sands
Size and location
9.29 Scroby Sands offshore wind farm (60 MW) is located 2.5 km off the shore of Great Yarmouth in East Anglia. It has 30 turbines and began operating in 2004.
Tourism context
9.30 The wind farm has its own visitor centre, which has emerged as a popular local tourist attraction, attracting over 35,000 visitors each year. Great Yarmouth is popular with families because of the presence of long-established attractions including the Pleasure Beach, museums and theme parks.
Trips and bed nights
9.31 Only post-construction tourism data were available for Great Yarmouth. The number of trips made to Great Yarmouth generally increased between 2006 and 2011. However the number of bed nights has decreased. The most significant decrease was between 2006 and 2008 and 2007-09 (10.2%).This decrease coincided with the economic recession and it indicates that people were still visiting Great Yarmouth, but were taking shorter trips. The wider Norfolk region experienced a similar pattern to that of Great Yarmouth.
9.32 Scroby Sands is unique in that it has become a tourist attraction in itself and has had a distinct measurable beneficial effect (c.35,000 visits per annum). Tourist visits to Great Yarmouth and Norfolk also reached their highest level for the most recent data period (2009-11).
Navitus Bay Socio-Economic and Tourism Baseline Assessment
Baseline Report | April 2013 78
Table 9-8 Volume of Domestic Tourism and % Change on Previous Dataset
9.33 Kentish Flats offshore wind farm (90 MW) is located 8.9 km north of Herne Bay and 10 km north of Whitstable in Kent. It became operational in 2005, during which time it was the largest wind farm in the country.
Tourism context
9.34 Herne Bay and Whitstable are popular tourist destinations due to their coastal location and surrounding countryside. Herne is part of the City of Canterbury local government district, and Canterbury’s tourism statistics relate to an inland area. Hence to assess the broader coastal area in tourism terms data for the wider area of Thanet have been used in the assessment.
Tourist trips and bed nights
9.35 Data are only available for the post-construction period for Kentish Flats, during which the Thanet area experienced a distinct decrease in the number of trips and bed nights.
9.36 Significantly the Thanet Local Plan addresses this issue and concludes that tourism in Thanet has declined due to the seaside holidays becoming less popular. The Plan recognises Thanet needs to invest in the area’s tourism infrastructure to improve its visitor appeal.
9.37 It remains a possibility that Kentish flats may have had some adverse impacts on Thanet’s tourism. However given the Local Plan’s assessment of the area’s tourism products and the prevailing decline in the wider Kent region it is more likely that the downward trend is attributable to external factors.
Navitus Bay Socio-Economic and Tourism Baseline Assessment
Baseline Report | April 2013 79
Table 9-9 Volume of Domestic Tourism and % Change on Previous Dataset
9.38 The analysis shows that most areas within the assessment have experienced an increase in number of trips. In all cases it does not seem likely that the wind farms have had an adverse impact on the local or wider onshore areas. External factors such as the economic recession have been most likely the greatest influence on the way in which number of trips has changed.
9.39 Post the construction of both Robin Rigg and Rhyl Flats the number of trips has increased in each of these areas, indicating that people are not being discouraged from visiting these areas by the presence and visibility of these offshore wind farms.
Wider Tourism Trends
9.40 Wales’ domestic tourism figures have remained relatively stable between 2007 and 2010, and then increased substantially in 2011.
9.41 England recorded a high volume of trips in 2009, which then declined by 2010. However, 2011 saw this level reach higher than 2009. This trend is likely to have continued due to the Olympics and the large number of trips associated with it.
Weather
9.42 The weather plays an important part in whether people take domestic trips. Annex 22B.4 shows the total annual rainfall in the UK from 2007 until 2011. 2007-2009 were very wet years with above average rainfall, particularly 2008. However, at a national level this did not seem to adversely impact on total domestic trips in England, Scotland or Wales, which all increased in 2009. This above average rainfall may have been one of the reasons why trips to some areas decreased between 2008 and 2009, as seen in the local scale data.
Navitus Bay Socio-Economic and Tourism Baseline Assessment
Baseline Report | April 2013 80
Key weather events in the UK between 2006 and 2011.
Year Key Weather Events
2006 Record breaking heat and sunshine in July (South east England)
2007 Flooding in May, June, July (South Midlands)
2008 Flooding in September (South west England, south & mid Wales)
2009 Cumbria floods (November)
2010 Severe wintry weather (UK)
2011 Warm in September, and October (England and Wales)
Source: Met Office
9.43 Evidence indicates that it is likely that poor weather in a specific location or region in one year results in a temporary reduction in domestic tourism numbers the following year.
Navitus Bay Socio-Economic and Tourism Baseline Assessment
Baseline Report | April 2013 81
Figure 9-1 Case Study Domestic Tourism Trips
Source Visit England
Navitus Bay Socio-Economic and Tourism Baseline Assessment
Baseline Report | April 2013 82
Figure 9-2 Domestic Trips to the Wider Area around the Case Studies
Source: Visit Scotland, United Kingdom Tourism Survey
Navitus Bay Socio-Economic and Tourism Baseline Assessment
Baseline Report | April 2013 83
Figure 9-3 National Context and Tourism Trends
Source: Met Office, United Kingdom Tourism Survey 2007-2011
Navitus Bay Socio-Economic and Tourism Baseline Assessment
Baseline Report | April 2013 84
Other information
Scotland
9.44 Research undertaken on behalf of the Scottish Government15 (‘The economic impacts of wind farms on Scottish tourism’, 2008) considered the impact on tourism of windfarms. This research was in the context of Scottish Tourism’s heavy reliance on landscape, with 92% of visitors stating that scenery was important in their choice of Scotland as a holiday destination, the natural environment being important to 89% of visitors (based on a 2005 Tourism Attitudes Survey).
9.45 This research found that, in relation to the impacts on tourism of onshore wind farms, three-quarters of respondents considered that wind farms had a beneficial or neutral impact on the landscape, and this increased for respondents who were engaged in outdoor recreational activities. The Scottish Government research found that the vast majority (93-99 per cent) of respondents who had seen a onshore wind farm suggested that this would not have any effect on their likelihood to return to an area.
North Hoyle
9.46 North Hoyle offshore wind farm has 30 2 MW 107 metre high turbines 7.2 km from shore and has been generating since 2003. It has been the subject of two public attitude surveys, in 2003 and 2004, with the 2004 survey capturing 200 residents and 56 visitors – a relatively small sample, but useful in the absence of larger survey programmes. The summary of the surveys are reported as part of the written evidence to the Select Committee on Innovation, Universities, Science and Skills16.
9.47 The key findings of this research indicated that:
The sea view is important to residents and visitors – 34% of residents say it is a main reason for them living there and 52% or visitors say it is a main reason for them visiting the area.
21% of residents and 13% of visitors considered that the wind farm is a ‘blot on the landscape’. 10% of residents said the wind farm has improved the view, whereas 22% said the view has been spoilt (between the 2003 and 2004 surveys, views polarised with fewer people neutral about the impact on the view). However 31% of residents and 40% of visitors said it is pleasing to look at.
73% of residents said they supported the windfarm (which increased from the 62% who supported it before it was operational). 5% of residents opposed the wind farm.
33% of residents felt that North Hoyle was a good choice of location, 52% an acceptable choice and 8% a bad choice. 48% of visitors felt that North Hoyle was a good choice of location, 36% an acceptable choice and 2% a bad choice, and 14% did not know.
15 Glasgow Caledonian University, Moffat Centre, Cogentsi, 2008, The economic impacts of wind farms on Scottish tourism. http://www.scotland.gov.uk/Resource/Doc/214910/0057316.pdf 16 Written evidence to the Select Committee on Innovation, Universities, Science and Skills, 2008, http://www.publications.parliament.uk/pa/cm200708/cmselect/cmdius/216/216we96.htm accessed May 2013.
Navitus Bay Socio-Economic and Tourism Baseline Assessment
Baseline Report | April 2013 85
71% of visitors supported the windfarm and none opposed it.
67% of residents felt that the wind farm has had no effect on the number of people visiting the area. 11% of residents said that visitors had increased compared to 4% who said it had decreased. 82% of visitors do not see any effect on visitor numbers.
Conclusion
9.48 This assessment of domestic tourism volume has, in general, shown that the local onshore areas have not been adversely affected by the presence and visibility of offshore wind farms. The assessment allowed for a comparison of pre-construction tourism figures with post construction tourism figures. In some cases the volume of tourism has actually increased over time. Scroby Sands in Great Yarmouth has become a tourist attraction itself. Where a decrease in tourism volume has occurred, particularly between 2007 and 2009, this may be a combination of above average rainfall and the economic recession.
9.49 The ex-post survey work suggests that both residents and visitors are very aware of offshore wind farm landscape impacts, and a minority consider this negative in addition to some who are pleased to see the wind farm. However there is also a general level of support for offshore wind and despite the changes to the landscape, residents and visitors did not consider the volume of tourism had changed.
Navitus Bay Socio-Economic and Tourism Baseline Assessment
Baseline Report | April 2013 86
10 COMMERCIAL FISHERIES 10.1 The commercial fisheries socio-economic baseline draws upon Navitus Bay ES
Commercial Fisheries Baseline Technical Report. The broader context is of declining fishing activity in the UK, with the number of registered vessels fallen by 26% between 1996 and 2012, and the number of full time and part time fishermen on UK registered vessels also decreased by 17 % and 16 % respectively since 2001.
10.2 The administrative port closest to the study area is Poole where a total of 482 vessels and 847 fishermen (full-time and part-time) were registered in 2011. After Newlyn, Poole is the second most important port in terms of the number of vessels and fishermen along the UK’s south coast. Marine Management Organisation data clearly presents Poole, Portsmouth and Weymouth as major fishing ports.
10.3 Most of the commercial fishing vessels operating in the offshore project area are based in Lymington, Keyhaven, Mudeford (identified in official statistics as Christchurch), Poole and Swanage. Yarmouth vessels are not reported to fish in the project area. The fishing grounds in and around the project area have also been subject to sporadic fishing activity undertaken by nomadic vessels originating from ports in Sussex, Devon, Cornwall, Wales and continental Europe. These nomadic vessels have not been regular visitors to the local grounds in recent years, with the exception of mainland European vessels in the southerly waters of the study area.
10.4 It is estimated that between 25-30 commercial fishing vessels and 15-25 charter-angling vessels are regularly active at fishing grounds in the vicinity of the export cable route and turbine area. The number of vessels that obtain a significant proportion of earnings from within the project site is likely to be lower, but difficult to quantify as vessels will alter the grounds fished depending upon conditions and circumstances at the time. Based on interviews with fishermen in the area:
Most of the vessels (83%) are 10 metres or under, and most of these have a crew of 1-3.
Vessels over 10 metres have a crew of 3-4.
All of the fishermen are full time.
The average turnover of vessels varies between less than £25,000 to up to £300,000 per annum.
Not all fish caught locally is landed in the study area.
10.5 It is estimated that the majority of the commercial fishing in the study area is in the inshore waters between the coast and the northern part of the turbine area, but spanning the offshore cable corridor route.
10.6 The majority of vessels operating in the vicinity of the proposed turbine area and the export cable route are less than 10 metres in length, and almost all are owner-operated. Many vessels are multi-purpose and change fishing technique according to seasons or returns.
Navitus Bay Socio-Economic and Tourism Baseline Assessment
Baseline Report | April 2013 87
11 SHIPPING 11.1 The commercial fisheries socio-economic baseline draws upon Navitus Bay ES Volume B
Chapter 16: Shipping and Navigation. Fifteen main commercial vessel routes have been identified in proximity to the offshore site. These include regular ferry service routes as well as other cargo and tanker vessels.
Description of main routes – source ES Chapter 16 Shipping & Navigation
Route Number
Destination Vessel Type Number Of Vessels Per Day
1 Poole to Guernsey Passenger Just over 1 vessel per day
2 Southampton to Eastern UK and European Ports
Various 3 vessels per day
3A Poole to Cherbourg (Northbound) Passenger 1 vessel per day 3B Poole to Cherbourg (Southbound) Passenger 1 vessel per day 4 Southampton to Channel Islands Majority are cargo
vessels (87%) 1 vessel per day
5 West Coast UK and Ireland to East Coast UK and Mainland Europe
Majority are cargo vessels (85%)
6 vessels per day
6 To/from TSSs Cargo (68%) and tankers (28%)
56 vessels per day
7 Southampton to European Ports Passenger 1 vessel every 4 days 8 Eastern Ports to Shoreham Cargo and
Dredgers/Subsea Ops 1 vessel every 2 days
9A Southampton to Liverpool (to Southampton)
Cargo 1 vessel every 10 days
9B Southampton to Liverpool (from Southampton)
Cargo 1 vessel every 10 days
10 UK South/West Coast Tankers 1 vessel every 3 days 11 Poole to The Solent Tankers 1 vessel every 6 days 12A Poole to Cherbourg Cargo/Passenger 1 vessel per day 12B Poole to Santander Cargo/Passenger 1 vessel every 4 days 13 Portsmouth to Channel Islands Passenger Just over 3 vessels per
day 14A Portsmouth to Santander Passenger 1 vessel every 2 days 14B Portsmouth to St Malo Passenger Just under 1 vessel per
day 15 Portsmouth to Bilbao/Santander Passenger 1 vessel every 2 days
11.2 Regular ferries operate on routes from Poole to the Channel Islands. The ports serving routes in proximity to the offshore site are important parts of their respective areas’ economies, and the logic chain dictates that impacts on shipping and navigation will generate risks to these economies:
11.3 The Port of Southampton is a passenger and cargo port and is ranked the UK’s busiest cruise port and the UK’s fifth busiest freight port. The Port directly generates some 5,100 jobs (8,300 jobs including oil and defence activities taking place in the wider Port area). The Port of Southampton directly and indirectly supports some 9,370 jobs in the Solent, 11,570 in the South East region and 14,160 across the country as a whole.
Navitus Bay Socio-Economic and Tourism Baseline Assessment
Baseline Report | April 2013 88
11.4 The Port of Portsmouth is responsible for the direct employment of 805 Full Time Equivalent (FTE) jobs and the injection of £38.7M of income into the greater Portsmouth area. Indirectly, these figures rise to 1,595 FTE jobs supported by Port activity and a total estimated £71.3m output throughout the Greater Portsmouth area economy.
11.5 The Port of Poole directly employs approximately 90 individuals and there are a further 450 people employed on the Port Estate. The Port of Poole Masterplan notes that in 2007 it was estimated that the commercial Port of Poole was responsible for 762 FTE jobs within Dorset with a further 788 people being employed in local marinas. This generated a total of £52.9 million Gross Value Added.
Navitus Bay Socio-Economic and Tourism Baseline Assessment
Baseline Report | April 2013 89
12 REFERENCES
Bournemouth University (2010) Dorset Visitor Survey 2009. Available at: http://www.visit-dorset.com/dbimgs/Dorset%20Visitors%20Survey%20report%202009%20final.pdf. Accessed: 08/03/13.
IPC (2011) Scoping Opinion: Proposed Navitus Bay Wind Park November 2011.
Visit England (2010/2011) Isle of Wight Tourism Monitor. Visitor statistics for tourism year 2010/2011.Availableat:http://www.visitisleofwight.co.uk/dbimgs/Tourism%20Year%202010_11%20report.pdf Accessed: 18/04/13.
NOMIS (2012) Official Labour Market Statistics. Available at: http://www.nomisweb.co.uk/. Accessed: 18/04/13.
Office for National Statistics (2011a) Regional GVA Figures. Available at: http://www.ons.gov.uk/ons/datasets-and-tables/index.html?pageSize=50&sortBy=none&sortDirection=none&newquery=nuts+3+gva&content-type=Reference+table&content-type=Dataset. Accessed: 18/04/13.
Office for National Statistics (2011b) International Passenger Survey. Available at: http://www.visitbritain.org/insightsandstatistics/inboundvisitorstatistics/. Accessed: [09/04/13]
Visit England (2011). South West and South East Top 10 Paid and Unpaid Visitor Attractions (2011). Available at: http://www.visitengland.org/insight-statistics/major-tourism-surveys/attractions/Annual_Survey/index.aspxAccessed: 08/04/13.
Tourism South East (2008) The Economic Impact of Tourism: New Forest, 2008. Available at: http://mediafiles.thedms.co.uk/Publication/NF/cms/pdf/new-forest-tourism-economic-impacts-estimates-2008.pdf. Accessed:05/04/13.
VisitBritain (2011) Overseas Tourism in UK Countries/Regions. Available at: http://www.visitbritain.org/insightsandstatistics/inboundvisitorstatistics/ Accessed: 05/04/13.
VisitEngland (2010) South East of England Regional Summary. Available at: http://www.visitengland.org/Images/South%20East%20Factsheet%202010_tcm30-27836.pdf. Accessed 05/04/13.
VisitEngland (2010) South West of England Regional Summary. Available at: http://www.visitengland.org/Images/South%20West%20Factsheet%202010_tcm30-27837.pdf Accessed: 05/04/13.
VisitEngland (2011) Great Britain Tourism Survey (GBTS) Analysis 2007 – 2011. Available at: http://www.visitengland.org/insight-statistics/major-tourism-surveys/overnightvisitors/Index/Regional_Results_2011.aspx. Accessed:18/04/13.
UK Parliament Select Committee on Innovation, Universities, Science and Skills Written Evidence, 2008. Available at: http://www.publications.parliament.uk/pa/cm200708/cmselect/cmdius/216/216we96.htm Accessed 13/05/13
Navitus Bay Socio-Economic and Tourism Baseline Assessment
Baseline Report | April 2013 90
Team, 2008, Bournemouth and Poole Tourism Strategic Framework http://www.pooletourism.com/downloads/assets/StrategicFramework.pdf
Scottish Government, 2008, The Economic Impacts of Wind Farms on Scottish Tourism – section 13.4 http://www.scotland.gov.uk/Resource/Doc/214910/0057316.pdf
Scottish Natural Heritage, 2006, A Handbook on Environmental Impact Assessment Appendix 5.
Atkins, 2011, Economic Impact of the Port of Southampton
University of Portsmouth’s Centre for Economic Analysis and Policy, 2012, Local Economic Assessment http://www.portsmouth.gov.uk/media/API_STR_JSNA_SEC_EMP_ECON_AREA_AX2012.pdf
Poole Harbour Commissioners, 2012, Draft Master Plan Version Two http://www.phc.co.uk/masterplan/_downloads/phc-masterplan.pdf
MEP, 2013, Commercial Fisheries Baseline
VisitBritain, 2013, Inbound Tourism - Updated April 2013 http://www.visitbritain.org/insightsandstatistics/inboundtourismfacts/
South West Tourism/ SW Tourism Alliance, 2008, Value of Tourism 2008.
Bournemouth University, 2008, Town Centre Master Vision Evaluation of the Effect of an Evening Event in the town on business levels and customer perceptions
TSE, 2009, The Significance of Sailing to South Hampshire and the Isle of Wight’s Visitor Economy
Marine Aggregate Levy Sustainability Fund, 2009, Quantifying and Valuing the Impacts of Marine Aggregate Extraction on Ecosystem Goods and Services http://www.cefas.co.uk/media/462458/mepf-08-p77-final-report.pdf
OECD, 2011, Job Tenure Statistics - which shows that an average job duration is 9.3 years http://stats.oecd.org/Index.aspx?DatasetCode=TENURE_AVE