Page 1
State of the Art of Multi-Unit Residential Building Airtightness: Test Procedures, Performance, and Industry Involvement
GRAHAM FINCH, MASC, P.ENG, PRINCIPAL,
RDH BUILDING ENGINEERING LTD. VANCOUVER, BC
CO-AUTHOR: LORNE RICKETTS
Page 2
Outline
à Airtightness Test Procedures &
Equipment
à Worldwide Regulatory
Requirements & Targets for
Airtightness
à Airtightness of Multi-Unit
Residential Buildings
à Air Barrier Systems
à Industry Preparedness for
Airtightness Testing
Page 3
Why We Care – Why We Test
Page 4
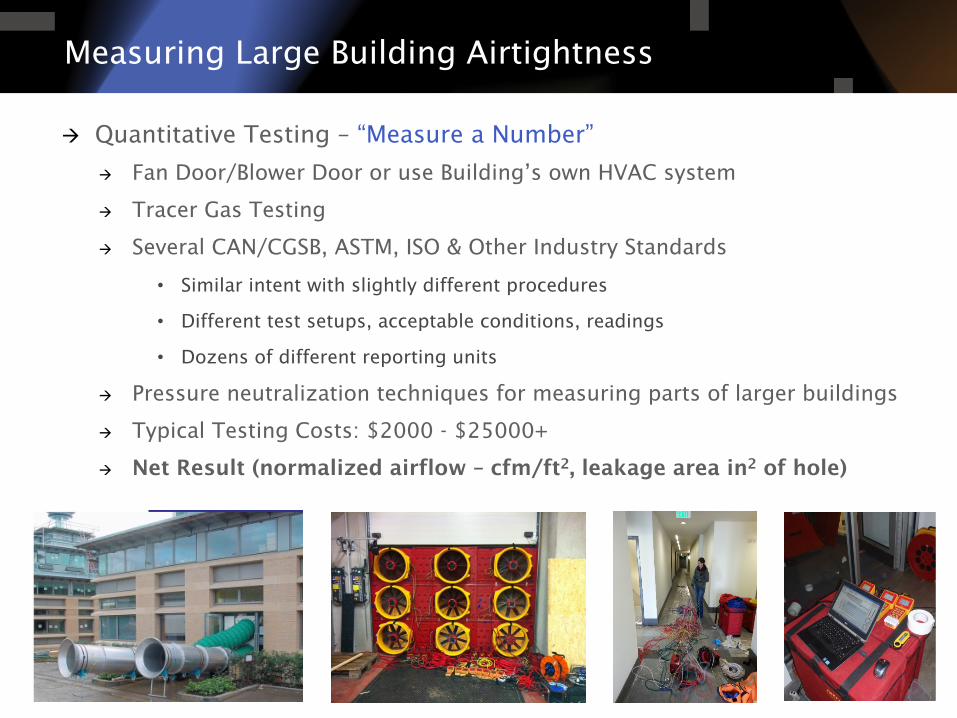
Measuring Large Building Airtightness
à Quantitative Testing – “Measure a Number”
à Fan Door/Blower Door or use Building’s own HVAC system
à Tracer Gas Testing
à Several CAN/CGSB, ASTM, ISO & Other Industry Standards
• Similar intent with slightly different procedures
• Different test setups, acceptable conditions, readings
• Dozens of different reporting units
à Pressure neutralization techniques for measuring parts of larger buildings
à Typical Testing Costs: $2000 - $25000+
à Net Result (normalized airflow – cfm/ft2, leakage area in2 of hole)
Page 5
Large Building Targets - Worldwide
à Washington State & Seattle, ABAA Target
<0.40 cfm/ft2 @ 75 Pa (<2.0 L/s·m2 @75Pa)
à US Army Corps of Engineers, <0.25 cfm/ft2 at 75
Pa (proposed down to 0.15 cfm/ft2)
à Passivhaus, 0.6 ACH50 (~0.12 cfm/ft2 at 75 Pa)
à LEED, 6-sided apartment test
(~0.23 cfm/ft2 at 50 Pa)
à UK (AATMA) Large Buildings,
~0.14 to 0.35 cfm/ft2 at 75 Pa
à Interestingly India, Qatar, Turkey, Dubai, Abu
Dhabi and others also have testing reqs. <0.40
cfm/ft2 at 75 Pa
à Canada – currently no requirement
Page 6
Finding Large Building Air Leakage
à Qualitative Testing –
“Seeing It/Finding It” à Infrared Thermography
(positive/negative pressures)
à Smoke Tracers/Generators
à Sound Transmission
à Leak Detection Liquid
à Manometers, Pressure Profiling
à Typical Costs: $500 to $2000+
à Net Result – Finds the leaks
Page 7
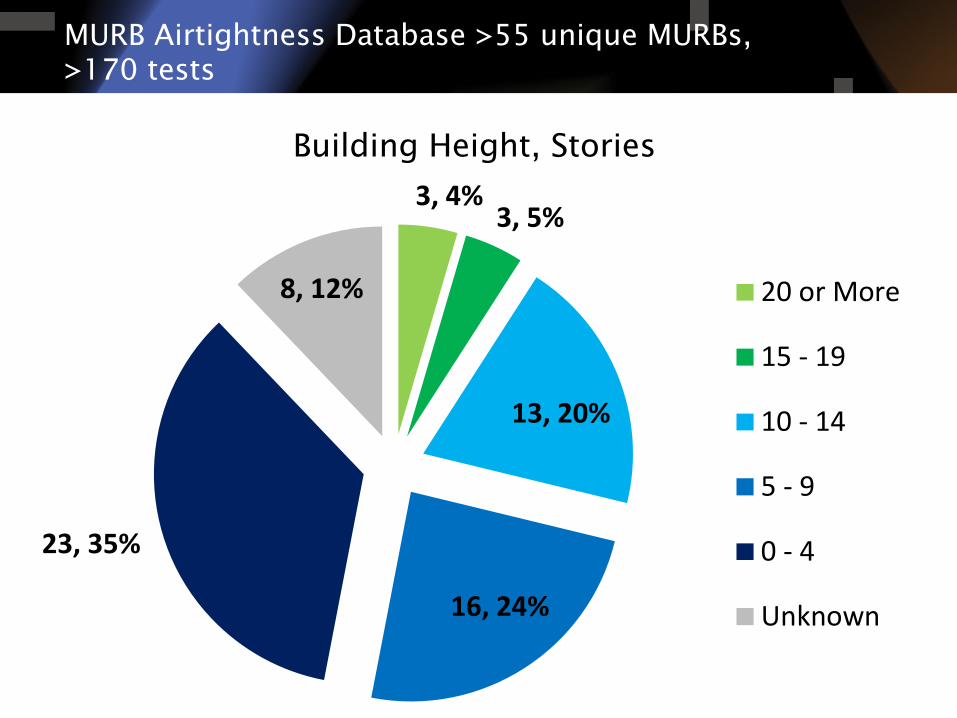
MURB Airtightness Database >55 unique MURBs, >170 tests
13, 20%
19, 29%
8, 12%2, 3%3, 4%
14, 21%
7, 11%
Geographical Distribution of MURBs in Database
British Columbia
Ontario
Quebec
Manitoba
Rest of Canada
United States
Unknown
Geographical Location
4, 6%5, 7%
6, 9%
13, 20%
18, 27%
13, 20%
7, 11%
Distribution of Air Barrier Construction or Modification Date for MURBs in Database
Pre 1960
1961 -‐ 1970
1971 -‐ 1980
1981 -‐ 1990
1991 -‐ 2000
2001 -‐ Present
Unknown
Age of Air Barrier Construction
3, 5%
6, 9%
1, 1%
1, 2%
1, 2%
4, 6%
14, 21%28, 42%
8, 12%
Distribution of Air Barrier Age when Testedfor MURBs in Database
40 or Older30 -‐ 3925 -‐ 2920 -‐ 2415 -‐ 1910 -‐ 145 -‐ 90 -‐ 4Unknown
Age of Air Barrier when Tested
3, 4%3, 5%
13, 20%
16, 24%
23, 35%
8, 12%
Distribution of Number of Storeys for MURBs in Database
20 or More
15 -‐ 19
10 -‐ 14
5 -‐ 9
0 -‐ 4
Unknown
Building Height, Stories
Page 8
0.0
0.5
1.0
1.5
2.0
2.5
3.0
3.5
Airig
htne
ss [cfm
/ft²]
Airtightness of MURBs
Average = 0.72(excluding outlier)
at 75 Pa
This value has been identified as an outlier and while the cause of this high value can not be determined, it has been removed from future plots.
Sample = 40 buildings
0
1
2
3
4
5
6
0 < x ≤ 0.1
0.1 < x ≤ 0.2
0.2 < x ≤ 0.3
0.3 < x ≤ 0.4
0.4 < x ≤ 0.5
0.5 < x ≤ 0.6
0.6 < x ≤ 0.7
0.7 < x ≤ 0.8
0.8 < x ≤ 0.9
0.9 < x ≤ 1
1 < x ≤ 1.1
1.1 < x ≤ 1.2
1.2 < x ≤ 1.3
1.3 < x ≤ 1.4
1.4 < x ≤ 1.5
1.5 < x ≤ 1.6
1.6 < x ≤ 1.7
1.7 < x ≤ 1.8
1.8 < x ≤ 1.9
1.9 < x ≤ 2
Num
ber o
f Buildings
Airtightness Range [ft³/min·∙ft²]
Distribution of MURB Airtightness
Mean = 0.78Median = 0.67Minimum = 0.16Maximum = 1.97 (excluding outlier)Standard Deviation = 0.45Sample = 40 buildings
at 75 Pa
0.0
0.5
1.0
1.5
2.0
2.5
1950 1960 1970 1980 1990 2000 2010 2020
Airtightne
ss [cfm
/ft²]
Construction of Building [Year]
Airtightness of MURBs versus Orignal Year of Construction
at 75 Pa
Airtightness of MURBs – cfm/ft2 @ 75 Pa
1 cfm/ft2 = 5 L/s·m2
Page 9
0.0
0.1
0.2
0.3
0.4
0.5
0.6
0.7
0.8
0.9
1.0
Flow
Expon
ent, n
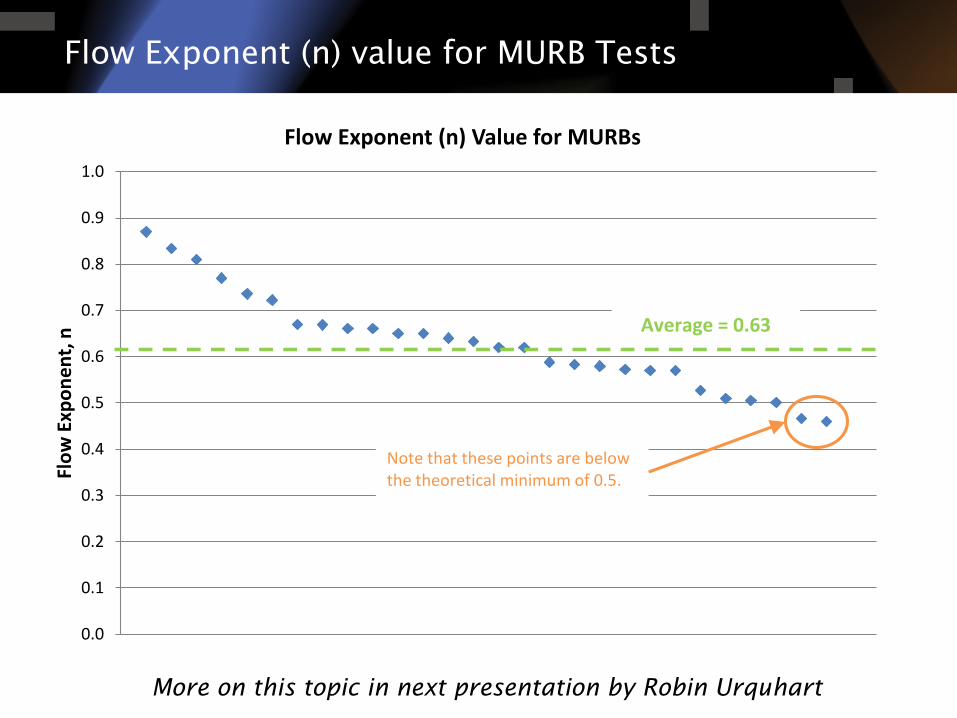
Flow Exponent (n) Value for MURBs
Average = 0.63
Note that these points are below the theoretical minimum of 0.5.
Flow Exponent (n) value for MURB Tests
More on this topic in next presentation by Robin Urquhart
Page 10
The Potential – US Army Corps Buildings
0.0
0.1
0.2
0.3
0.4
0.5
0.6
Airtightne
ss [cfm
/ft²]
Airtightness of USACE Barracks Buildings
Average = 0.19(excluding outlier)
at 75 Pa
This value is an outlier compared to the other US ACE values; however, is not unreasonable when compared with other non US ACE testing.
US ACE Target0.25 ft³/min·∙ft²
1 cfm/ft2 = 5 L/s·m2
Page 11
Trends from Seattle – Past 3 Years of Testing
Code minimum not that tight
tight
very tight
Modern Wall Air Barrier Strategies – RDH Seattle Test Data, >30 buildings, mid- to high-rise
Average = 0.25 cfm/ft2
Page 12
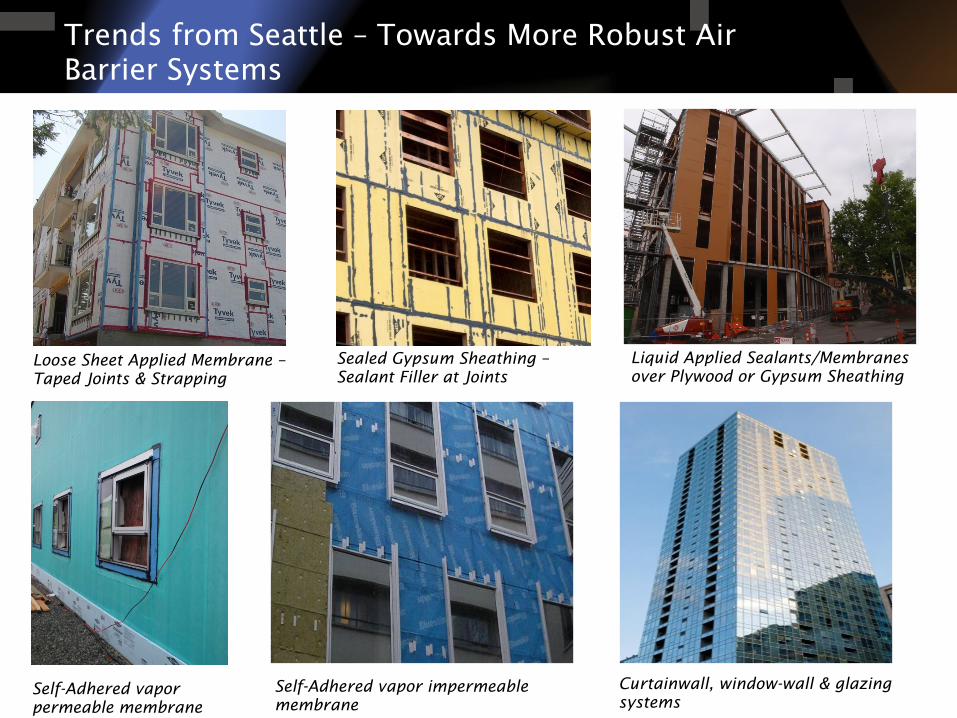
Trends from Seattle – Towards More Robust Air Barrier Systems
Loose Sheet Applied Membrane – Taped Joints & Strapping
Sealed Gypsum Sheathing – Sealant Filler at Joints
Liquid Applied Sealants/Membranes over Plywood or Gypsum Sheathing
Self-Adhered vapor permeable membrane
Self-Adhered vapor impermeable membrane
Curtainwall, window-wall & glazing systems
Page 13
0.0
0.2
0.4
0.6
0.8
1.0
1.2
1.4
1.6
1.8
2.0
Airtightne
ss [cfm
/ft²]
Airtightness of MURBs Pre-‐ and Post-‐Retrofit
Pre-‐Retrofit Post-‐Retrofit
at 75 Pa
Average = 0.63
Average = 0.98
0%
10%
20%
30%
40%
50%
60%
Airtightne
ss [cfm
/ft²]
% Improvement in MURB Air Tightness Pre-‐ and Post-‐Retrofit
at 75 Pa
Average = 31%
The Potential – Building Enclosure Retrofits
Page 14
Industry Awareness & Preparedness Survey
à Survey sent to hundreds of architects, engineers,
contractors and others responsible for design,
implementation, and testing of air barrier systems in
large buildings (in 2012) à 67 respondents across North America
à Potential for bias in survey à Respondents more likely to care about good air barrier
performance and need for testing
à Non respondents less likely to care or don’t perceive value
Page 15
Industry Survey Respondents
48%
48%
4%
Geographic Distribution of Responses
Canada
USA
Other Countries
43%
22%
14%
15%
6%
Distribution of Qualifications
EngineerEnergy Advisor or AuditorTechnologistArchitectOther
Page 16
0% 20% 40% 60% 80% 100%
Energy
Moisture Control
Indoor Air Quality
Acoustics
Other
Percent of Total Respondents
Why to Address Airtightness
1 (Most Important)
2
3
4
5 (Least Important)
Why Address Airtightness in Buildings?
Page 17
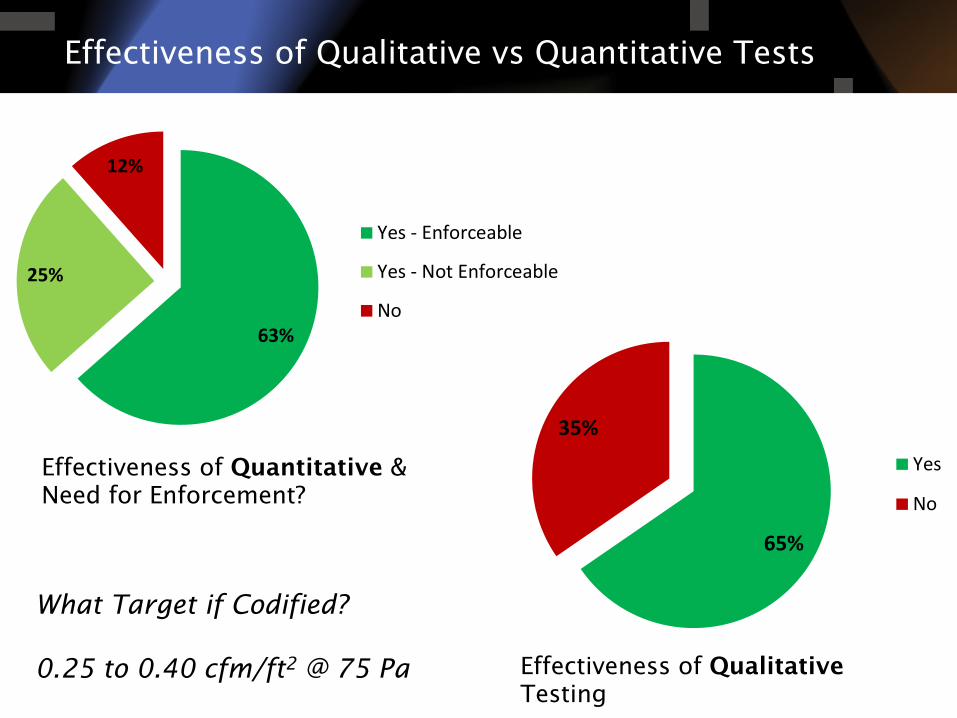
Effectiveness of Qualitative vs Quantitative Tests
63%
25%
12%
Should Quantitative Testing be Implemented in Building Code?
Yes -‐ Enforceable
Yes -‐ Not Enforceable
No
65%
35%
Should Qualitative Testing be Implemented in Building Code?
Yes
No
Effectiveness of Quantitative & Need for Enforcement?
Effectiveness of Qualitative Testing
What Target if Codified? 0.25 to 0.40 cfm/ft2 @ 75 Pa
Page 18
Capacity & Time to Develop Industry Capacity
2%
25%
13%38%
22%
Could Air Tightness Capacity Be Met in Your Area?
No Local Interest
No Local Capacity
Unsure
Capacity Could be Easily Met
Capacity Currently Exists
Capacity for Local Airtightness Testing?
23%
40%
37%
How Long to Develop Capacity?
<1 year
1-‐2 years
2+ years
Time to Develop Industry Capacity?
Page 19
Evolution & Market Transformation
Page 21
Summary & Key Points
à Many different standards & methods to measure
airtightness and locate air leakage in large buildings
à Average airtightness of MURBs in database
0.75 cfm/ft2 @ 75Pa
à Airtightness of newer MURBs and USACE barracks
buildings much lower, 0.3 to 0.4 cfm/ft2 @ 75Pa easily
achievable
à Many strategies for air barrier systems
à Industry capacity and drivers in place
Page 22
Questions
Graham Finch [email protected] - 604.873.1181