Housing Finance Banks NBFC* Insurance New Fund Offer (NFO) starts on: 22/07/2021 | New Fund Offer (NFO) closes on: 29/07/2021 Scheme re-opens for continuous sale & Re-purchase on and from 03/08/2021 Mirae Asset Nifty Financial Services ETF An open ended scheme replicating/tracking Nifty Financial Services Total Return Index Aims to guide you on the path to progress. *Non Banking Financial Corporation
Transcript
HousingFinance
BanksNBFC*
Insurance
New Fund Offer (NFO) starts on: 22/07/2021 | New Fund Offer (NFO) closes on: 29/07/2021Scheme re-opens for continuous sale & Re-purchase on and from 03/08/2021
Mirae Asset Nifty Financial Services ETFAn open ended scheme replicating/tracking Nifty Financial Services Total Return Index
Aims to guide you onthe path to progress.
*Non Banking Financial Corporation
Financial Services sector: Close to our lifeand economy
Financial Services sector – It’s not just Banks
BANK
Banking Financial Services
Capital Markets: Asset Management, Broking, Exchanges, Rating agencies, Wealth Management
How Financial Services sector relates to life and economy
Your financial incomemay rise
(Bonuses, salary increase,business income growth)
You will need toplan to use money wiselyWhen economy grows Industry Growth
How Financial Services sector relates to life and economy
Plan for Big Spending Secure for Future Plan for new Investments
Bank /NBFC Insurance Company Asset Management Companies(AMC) / Stock Brocking
How Financial Services sector is related to your life
Banking and Financial Services Sector Is close to your daily life
Monthly SIP toMutual fund
Online Payment & Mobile wallet
Apply insurance for your familyYour Salary account
Credit Card & EMI Taking Housing & Car loanStock trading
BUYSELL
SIP : Systematic Installment Plan
Why Participate in the Sector ?
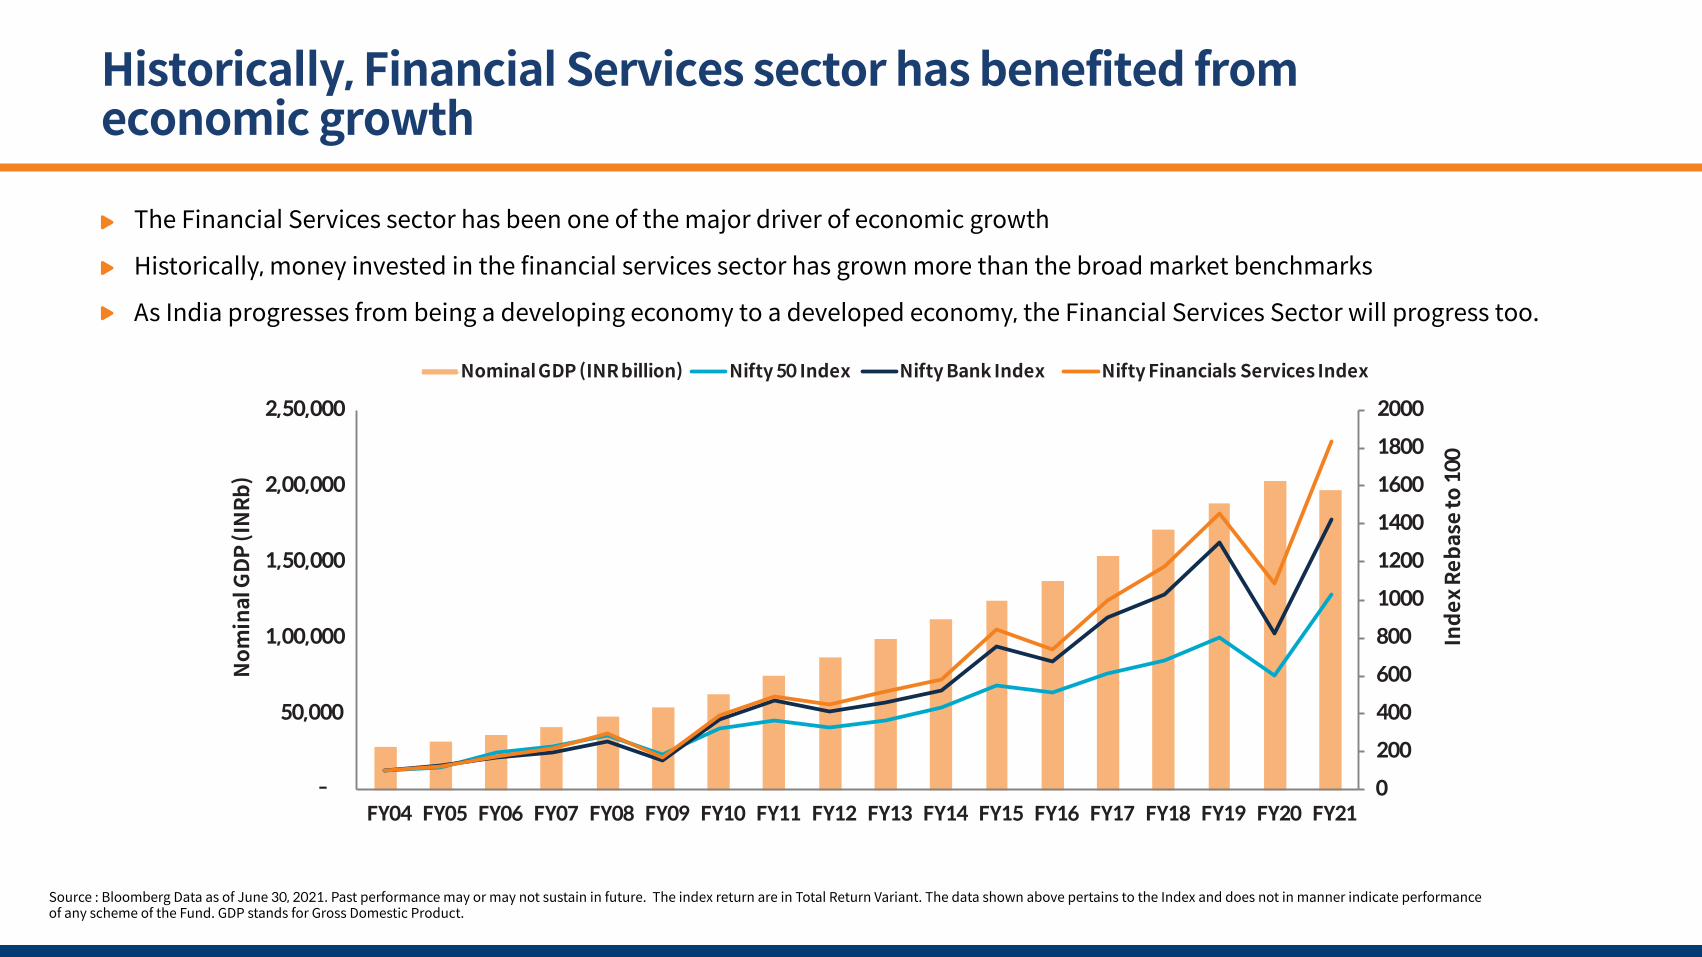
Historically, Financial Services sector has benefited fromeconomic growth
Source : Bloomberg Data as of June 30, 2021. Past performance may or may not sustain in future. The index return are in Total Return Variant. The data shown above pertains to the Index and does not in manner indicate performanceof any scheme of the Fund. GDP stands for Gross Domestic Product.
The Financial Services sector has been one of the major driver of economic growth
Historically, money invested in the financial services sector has grown more than the broad market benchmarks
As India progresses from being a developing economy to a developed economy, the Financial Services Sector will progress too.
Nominal GDP (INR billion) Nifty 50 Index Nifty Bank Index Nifty Financials Services Index
Market penetration across financial products very low
source : CRISIL Research, CEIC, IRDAI, GIC Council, as of Dec 2019.
Credit to GDP (%)Country
India 56 12.4 2.7 12
74 17.1 3.9 68
73 21.4 10.3 48
205 26.4 2.3 13
198 47.5 6.1 58
150 62.6 2.9 121
164 67.0 8.3 67
Brazil
South Africa
China
Korea
USA
UK
Mortgage Penetrationto GDP(%)
Life Insurance Premium to GDP (%)
Mutual Fund AUM to GDP (%)
Banks – Well capitalised, Improving asset quality
Source : RBI, Banks data as of Sep2020 ; NPA : Non-Performing Assets , OECD : Organization for Economic Co-operation and Development (OECD)
Capital position of Indian banks have strengthened in the last few years with Tier 1 capital at 13% in FY20 (v/s regulatory 9.25%). Further few banks have raised capital even in FY21, thereby fortifying their balance sheet
Significant reduction seen in the NPA levels from the peak of 2018
Asset quality improved significantly with credit bureau coverage reaching OECD average (65% of adult population)
8
9 9 9 9
11 11 11
13
10 10
11
12
13
14
2013 2014 2015 2016 2017 2018 2019 2020-
2.0 2.5 2.5 2.5 2.5
3.1 3.5 3.8 4.0
7.18.0
10.8
8.27.8
4.0
6.0
8.0
10.0
12.0
2008 2010 2012 2014 2016 2018 2020
Gross NPA Trend of Banks (%)Tier-1 capital positioning of Banks (%)
NBFCs – Alternative financier to the economy, huge addressable market
India houses large number of NBFCs (9,600+), of which ~100 are listed. Share in total credit moved from 15% to 25% in last decadeNBFCs primarily cater to underbanked/ new-to-bank customers, in rural/semi-urban locationsNBFCs market share in credit improved from ~12% in FY08 to ~20% in FY20NBFCs are now dominating players in auto, housing and gold financing business
Source : RBI, CRISIL Research, KIE, Cognizant Data as of Sep 2020 / NBFCs include Housing loans as well as LAP
4338
34 36 3639 39
41 43
3639 40
42 44 4244
41 40
4749 48
50 50 51 5255 56
2012 2013 2014 2015 2016 2017 2018 2019 2020
NBFC’s Market Share (in %) Product WiseGold Loan Housing Loan Auto Financing
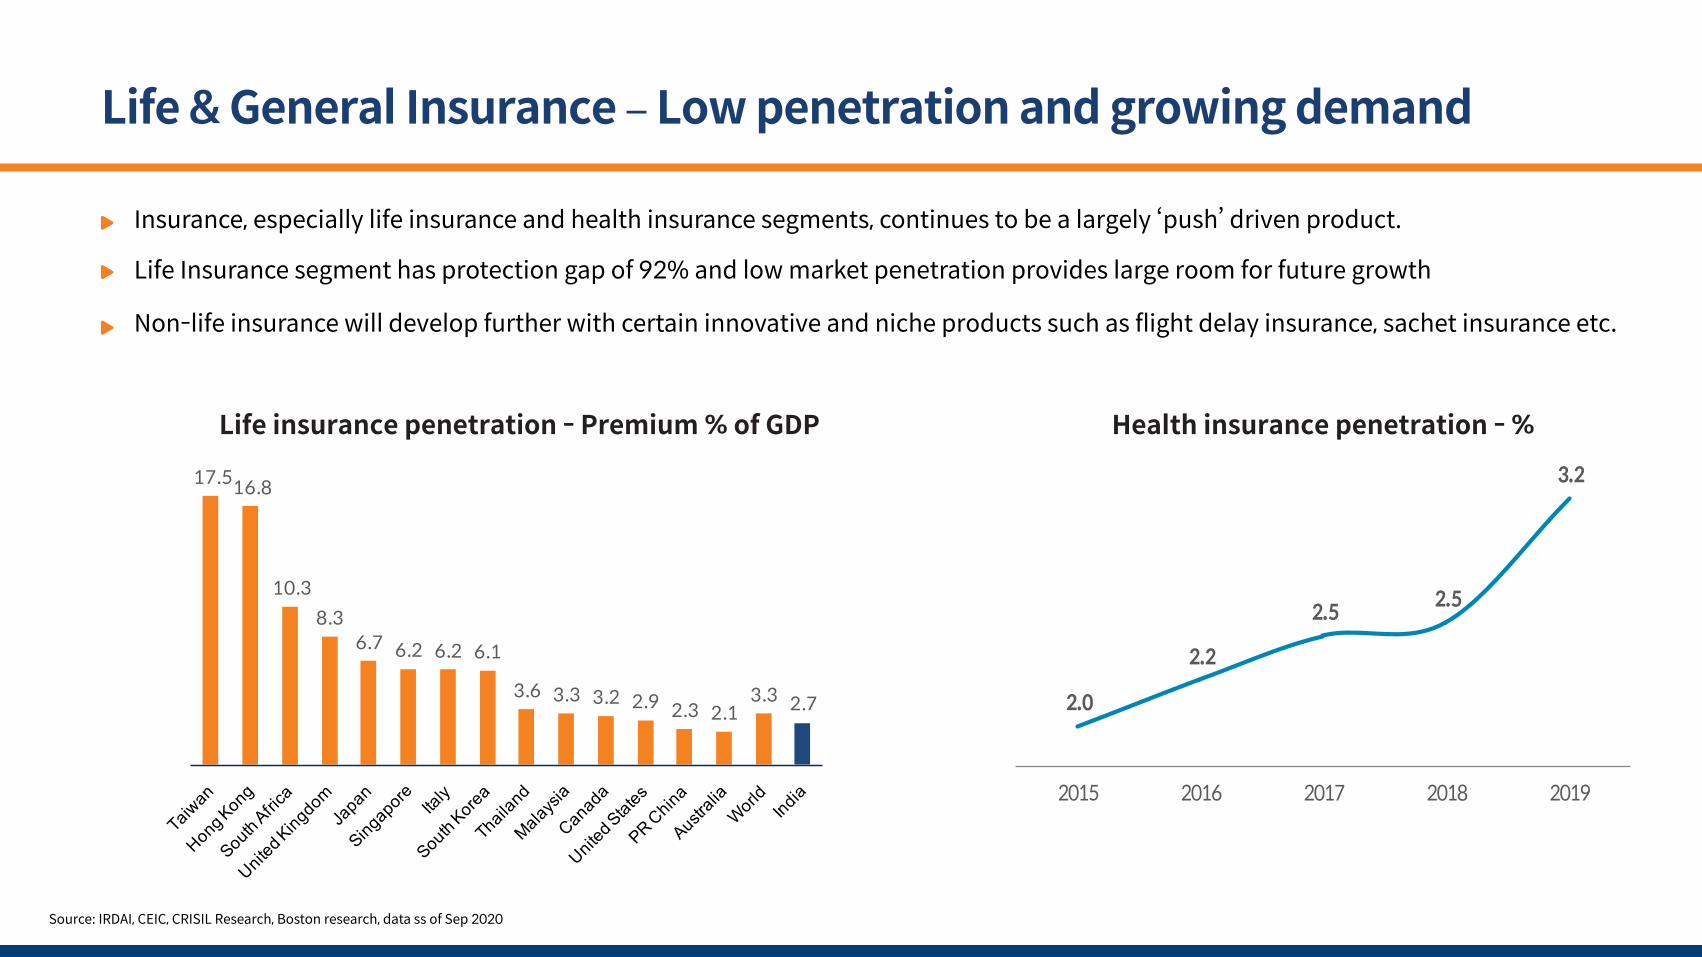
Life & General Insurance – Low penetration and growing demand
Insurance, especially life insurance and health insurance segments, continues to be a largely ‘push’ driven product.
Life Insurance segment has protection gap of 92% and low market penetration provides large room for future growth
Non-life insurance will develop further with certain innovative and niche products such as flight delay insurance, sachet insurance etc.
Life insurance penetration - Premium % of GDP
17.516.8
10.38.3
6.7 6.2 6.2 6.1
3.6 3.3 3.2 2.9 2.3 2.13.3 2.7
Source: IRDAI, CEIC, CRISIL Research, Boston research, data ss of Sep 2020
Health insurance penetration - %
2.0
2.2
2.5 2.5
3.2
2015 2016 2017 2018 2019
Why Financial Services Now ?
Disclaimer: The aforesaid information contained in the document is based on assumption that impact of COVID-19 would be behind us in FY 2022 and economic is expected to bounce back by FY 2023. However, if impact of COVID-19continues beyond the extended period, the information presented aforesaid may undergo significant change.
Post pandemic, economic growth is expected to bounce back significantly aided by growth in the financial services
Segments with lower penetration within financial services sector is expected to potentially grow at a faster rate
Quicker adoption of technology and digitalization is expected to potentially bring down the cost for companies
Improvement in asset quality of bank along with revival of corporate sector is potentially expected to improve the profitability of financial services sector
Mirae Asset Nifty Financial ServicesETF offering
About Nifty Financial Services Index
Source: NSE Indices Index methodology
The Nifty Financial Services Index is designed to reflect the behavior and performance of large companies in financial services sector. The Nifty Financial Services Index comprises of 20 stocks that are listed on the National Stock Exchange (NSE)
Eligibility Criteria for Selection of Constituent Stocks:
Company should belong to Financial Services sector and form part of NIFTY 500 Index at the time of review.
The company should have a listing history of 6 months
Final selection of 20 companies shall be done based on the free float market capitalization after considering the adequate representation of each segment.
Weightage of each stock in the index is calculated based on its free-float market capitalization
No single stock shall be more than 33% of the total and weightage of top 3 stocks cumulatively shall not be more than 62% of the total at the time of rebalancing.
Index is re-balanced on semi-annual basis in March and September
Source NSE; Data as on June 30, 2021. Past performance may or may not sustain in future. The index return are in Total Return Variant. The data shown above pertains to the Index and does not inmanner indicate performance of any scheme of the Fund.
Nifty Financial Services Index has outperformed with strong correlation
20437
10402
15820
0
5000
10000
15000
20000
25000
Nifty Financial Service Index Nifty 50 Index Nifty Bank Index
Jun2004
Jun2005
Jun2006
Jun2007
Jun2008
Jun2009
Jun2010
Jun2011
Jun2012
Jun2013
Jun2014
Jun2015
Jun2016
Jun2017
Jun2018
Jun2019
Jun2020
Jun2021
Nifty Financial Services Index Correlation (Since Inception)Nifty50 Index (Total Return Index) 0.91
Nifty Bank Index (Total Return Index) 0.98
Nifty Financial Services Index has historically outperformed Nifty 50 Index and Nifty Bank Index.Also, it has exhibited a very strong correlation with both the indices.
Nifty Financial Services Index has generated historically higher return forperiods greater than one year along with lower volatility than Nifty Bank Index.
Source: NSE, as on June 30, 2021 Returns of period more than 1 year are CAGR returns. Past performance may or may not sustain in future. The above is performance of the Index and does not in any mannerindicate the performance of any individual scheme of Mutual Fund.
Nifty Financial Services Index : Return and risk profile
Nifty FinancialServices Index
Nifty 50 Index
Nifty Bank Index
PeriodReturns
15 Years
10 Years
07 Years
05 Years
03 Years
01 Years
6 months
3 months
18.5% 12.7% 17.2%
Nifty FinancialServices Index
Nifty 50 Index
Nifty Bank Index
Risk (Annualized standard deviation)
29.1% 22.3% 30.1%
14.9% 12.2% 12.7% 23.6% 17.5% 25.0%
15.7% 12.3% 13.1% 23.2% 17.5% 24.3%
18.3% 15.1% 14.6% 24.1% 18.2% 25.2%
15.1% 15.6% 10.0% 29.1% 21.9% 25.2%
56.6% 54.6% 63.1% 24.8% 16.8% 27.5%
8.5% 13.2% 11.5% 25.7% 18.1% 27.6%
5.0% 7.5% 4.7% 22.3% 14.4% 24.6%
Source: NSE Data as on June 30, 2021. Past performance may or may not sustain in future. The index return are in Total Return Variant. The data shown above pertains to the Index and does not in manner indicate performance of any scheme ofthe Fund. Risk is nothing but computed as annualized standard deviation of daily return observation for specific investment horizon for all the indices using their INR total return variant
Nifty Financial Services Index: Calendar year performance
Nifty Financial Services Index has outperformed Nifty 50 Index and Nifty BankIndex in 6 out of 11 and 7 out of 11 calendar years respectively.
NIFTY 50 Index Nifty Bank Index Nifty Financial Services Index
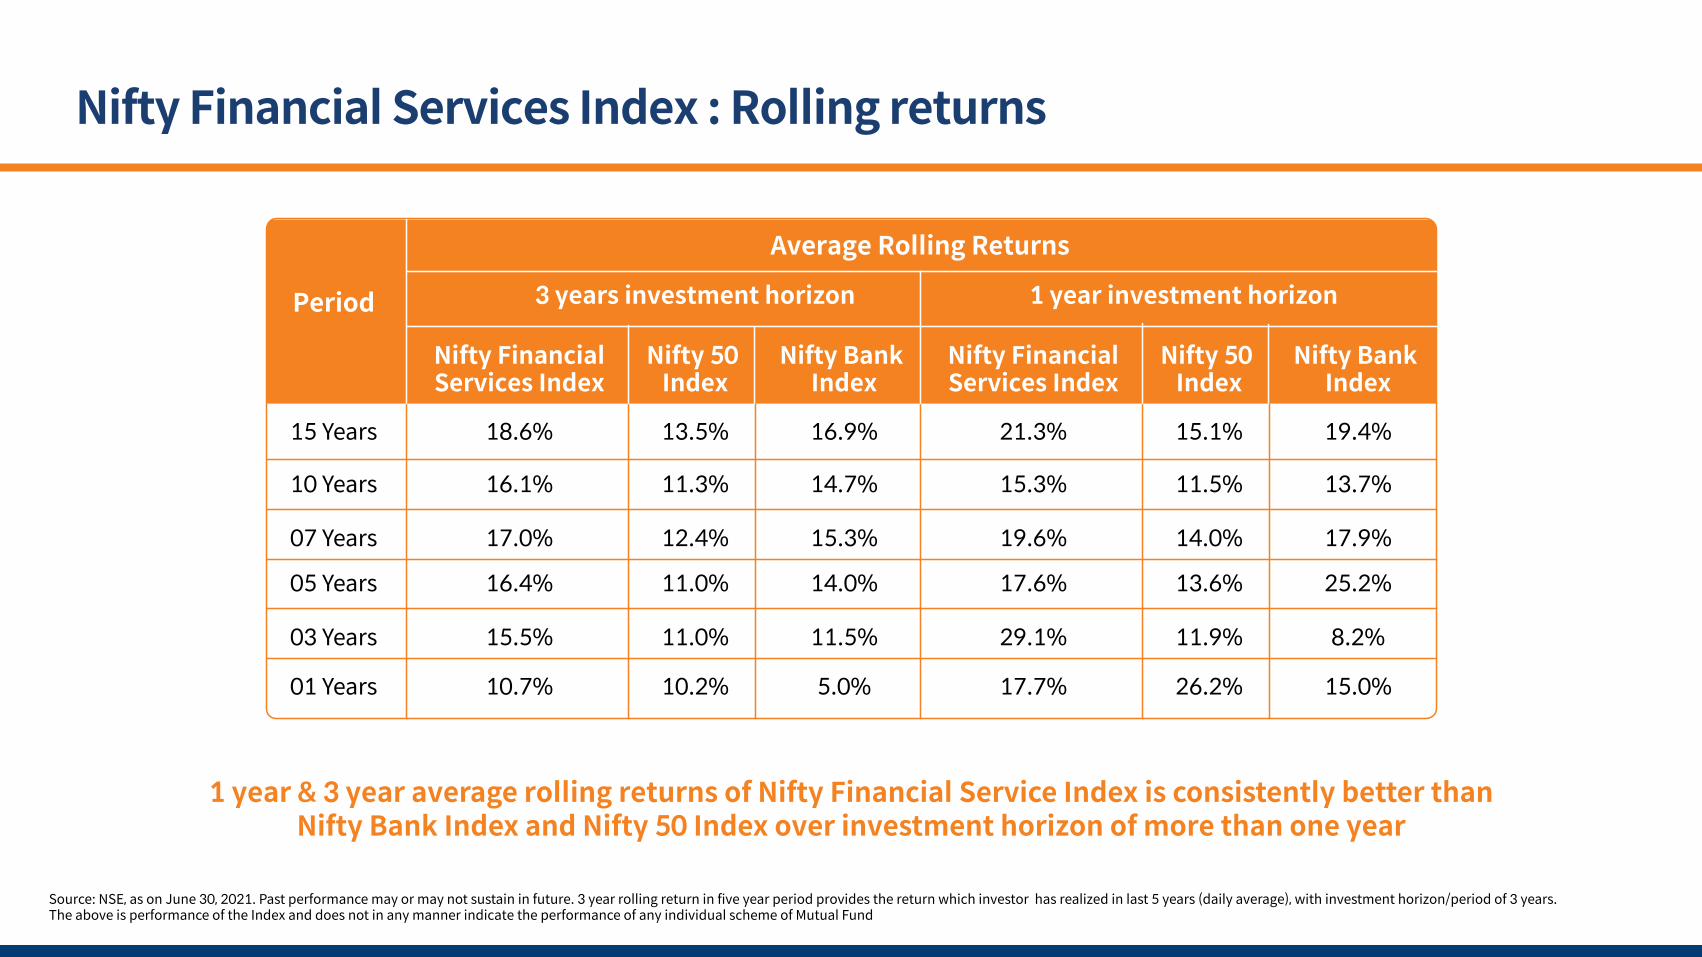
Source: NSE, as on June 30, 2021. Past performance may or may not sustain in future. 3 year rolling return in five year period provides the return which investor has realized in last 5 years (daily average), with investment horizon/period of 3 years. The above is performance of the Index and does not in any manner indicate the performance of any individual scheme of Mutual Fund
Nifty Financial Services Index : Rolling returns
1 year & 3 year average rolling returns of Nifty Financial Service Index is consistently better thanNifty Bank Index and Nifty 50 Index over investment horizon of more than one year
Nifty FinancialServices Index
Nifty 50 Index
Nifty Bank Index
Period 3 years investment horizon
Average Rolling Returns
15 Years
10 Years
07 Years
05 Years
03 Years
01 Years
18.6% 13.5% 16.9%
Nifty FinancialServices Index
Nifty 50 Index
Nifty Bank Index
1 year investment horizon
21.3% 15.1% 19.4%
16.1% 11.3% 14.7% 15.3% 11.5% 13.7%
17.0% 12.4% 15.3% 19.6% 14.0% 17.9%
16.4% 11.0% 14.0% 17.6% 13.6% 25.2%
15.5% 11.0% 11.5% 29.1% 11.9% 8.2%
10.7% 10.2% 5.0% 17.7% 26.2% 15.0%
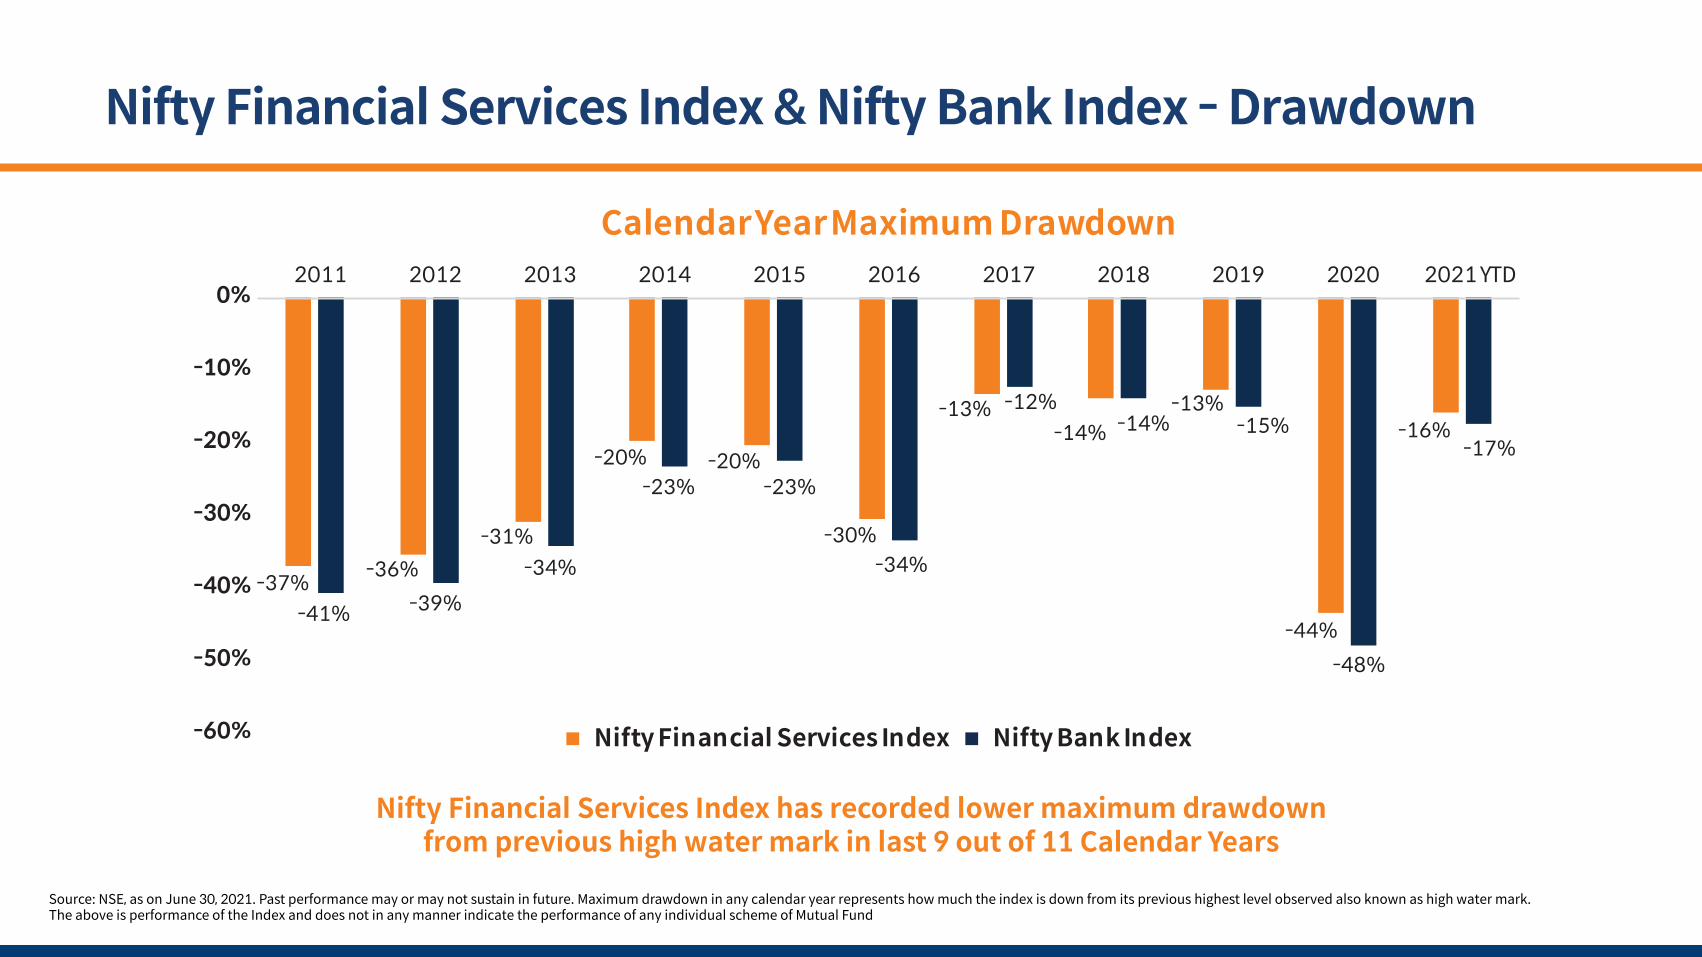
Nifty Financial Services Index & Nifty Bank Index - Drawdown
Source: NSE, as on June 30, 2021. Past performance may or may not sustain in future. Maximum drawdown in any calendar year represents how much the index is down from its previous highest level observed also known as high water mark.The above is performance of the Index and does not in any manner indicate the performance of any individual scheme of Mutual Fund
Nifty Financial Services Index has recorded lower maximum drawdownfrom previous high water mark in last 9 out of 11 Calendar Years
Index1 Year 3 Year 5 Year 7 Year 10 Year 1 Year 3 Year 5 Year 7 Year 10 Year
Nifty Financial Services Index
Nifty Bank Index
50% 100% 100% 100% 80%
75%
-2.2
4.3
4.8
-0.2
4.9
1.2
3.2
0.2
2.4
0.650% 64% 50% 60%
Nifty Financial Services Index has outperformed 100% of BFSI mutual funds over previous 3,5 and 7 year period
% of funds finding difficult to beat Nifty Financial Services Index are in greater proportion than % of funds finding difficult to beat Nifty Bank Index.
For investment horizon of more than one year, on an average basis, active BFSI funds have underperformed the index by at least 240bps
Source: ACE MF, as on June 30, 2021. * Based on 12 Banking & Financial Services, funds (Regular: Growth). *Banking & Financial Services Funds based on ACE MF classification. BFSI is defined as minimum investment in equity &equity related instruments of a banking & financial services theme is at least 80% of total assets. Past performance may or may not sustain in future. The above is performance of the category and does not in any manner indicatethe performance of any individual scheme of Mirae Asset Mutual Fund
Difficult to outperform Nifty Financial Services Index
% of BFSI MF schemes outperformed by Index* Excess return of Index over average returns of MF'
*BFSI MF : Banking, Financial Service & Insurance Mutual Fund scheme
Nifty Financial Services Index Portfolio
Source: NSE, Portfolio as on June 30, 2021 Add: The sector(s)/stock(s)/issuer(s) mentioned in this presentation do not constitute any research report/recommendation of the same and the Fund may or may not have anyfuture position in these sector(s)/stock(s)/issuer(s).
Fairly diversified portfolio vis-à-vis Nifty Bank Index.Adequate representation of various sub-industries forming part of Financial Service Sector.
Existing constituents represents large & midcap stocks forming part of Nifty200 Index.
INDUSTRYPrivate sector bank
Housing financeNBFC
Public sector bankLife insurance
General insuranceFinancial services
Other financial servicesAsset management
Companies
WEIGHT57.3%16.7%6.6%6.0%4.7%4.0%3.2%1.0%
0.6%
S.No. Company Name Weight1 24.4%2 16.7%3 16.3%4 9.3%5 7.2%6 6.0%7 6.0%8 2.7%9 2.1%
ICICI Lombard General Insurance Piramal Enterprises
Shriram Transport Finance Co. ICICI Prudential Life Insurance
Cholamandalam Investment and Finance HDFC Asset Management
Muthoot Finance Power Finance Corporation
REC Mahindra & Mahindra Financial Services 0.3%
Why invest in Mirae Asset Nifty Financial Services ETF ?
Past performance may or may not sustain in future. The data pertains to the Index and does not in manner indicate performance of any scheme of the Fund.
Opportunity to participate in the sector which is essential for the overall growth of the economy
Financial Services encompasses not only banks but also other segments such as NBFC, Insurance,Capital Market etc. which are currently under-penetrated among masses.
Nifty Financial Services Index has exhibited better return to risk profile along with lower drawdownvis-à-vis Nifty Bank Index
Overall actively managed BFSI funds are finding difficult to outperform Nifty Financial Services Indexacross longer investment horizon
Relatively low cost option to participate in Financial Services Sector
NFO Details for Mirae Asset Nifty Financial Services ETF
Authorized Participant:Mirae Asset Capital Markets(India) Private Limited
Taxation:Equity
TAX Allotment Price:Offer for Sale of Units at 1/1000thvalue of the Nifty Financial ServicesIndex on the date of allotment
NFO Period : 22nd July 2021 – 29th July 2021Allotment Date : 30th July 2021Scheme re-open: 03rd August 2021
Listing:NSE & BSE (Maximum within 5 business daysfrom the date of allotment)
Fund Manager:Ms. Ekta Gala
Benchmark Index:Nifty Financial Services Total Return Index (TRI)
Minimum Investment Amount(During NFO Period): 5,000/- and in multiples of 1/- thereafter.
Post NFO:On exchange ( in multiple of 1 units), Directly with AMC ( in multiple of 3,00,000 units)
NSE Indices Ltd Disclaimer: NSE INDICES LIMITED do not guarantee the accuracy and/or the completeness of the Nifty Financial Services Index or any data included therein and NSE INDICES LIMITED shall have not have any responsibility or liability for any errors, omissions, or interruptions therein. NSE INDICES LIMITED does not make any warranty, express or implied, as to results to be obtained by the Issuer, owners of the product(s), or any other person or entity from the use of the Nifty Financial Services Index or any data included therein. NSE INDICES LIMITED makes no express or implied warranties, and expressly disclaims all warranties of merchantability or fitness for a particular purpose or use with respect to the index or any data included therein. Without limiting any of the foregoing, NSE INDICES LIMITED expressly disclaim any and all liability for any claims ,damages or losses arising out of or related to the Products, including any and all direct, special, punitive, indirect, or consequential damages (including lost profits), even if notified of the possibility of such damages.
BSE/NSE Disclaimer: �Every person who desires to apply for or otherwise acquires any unit of this Fund may do so pursuant to independent inquiry, investigation and analysis and shall not have any claim against the Exchange whatsoever by reason of any loss which may be suffered by such person consequent to or in connection with such subscription/ acquisition whether by reason of anything stated or omitted to be stated herein or any other reason whatsoever
Statutory Details: Trustee: Mirae Asset Trustee Company Private Limited; Investment Manager: Mirae Asset Investment Managers (India) Private Limited (AMC); Sponsor: Mirae Asset Global Investments Company Limited.
The information contained in this document is compiled from third party and publically available sources and is included for general information purposes only. There can be no assurance and guarantee on the yields. Views expressed by the Fund Manager cannot be construed to be a decision to invest. The statements contained herein are based on current views and involve known and unknown risks and uncertainties. Whilst Mirae Asset Investment Managers (India) Private Limited (the AMC) shall have no responsibility/liability whatsoever for the accuracy or any use or reliance thereof of such information. The AMC, its associate or sponsors or group companies, its Directors or employees accepts no liability for any loss or damage of any kind resulting out of the use of this document. The recipient(s) before acting on any information herein should make his/her/their own investigation and seek appropriate professional advice and shall alone be fully responsible / liable for any decision taken on the basis of information contained herein. Any reliance on the accuracy or use of such information shall be done only after consultation to the financial consultant to understand the specific legal, tax or financial implications.
Disclaimer
Mutual fund investments are subject to market risks, read all scheme related documents carefully.
Please consult your financial advisor before investingFor further information about other schemes (product labelling and performance of the fund) please visit the website of the AMC: www.miraeassetmf.co.in
*Investors should consult their �nancial advisors if they are not clear about the suitability of the product.
PRODUCT LABELLING
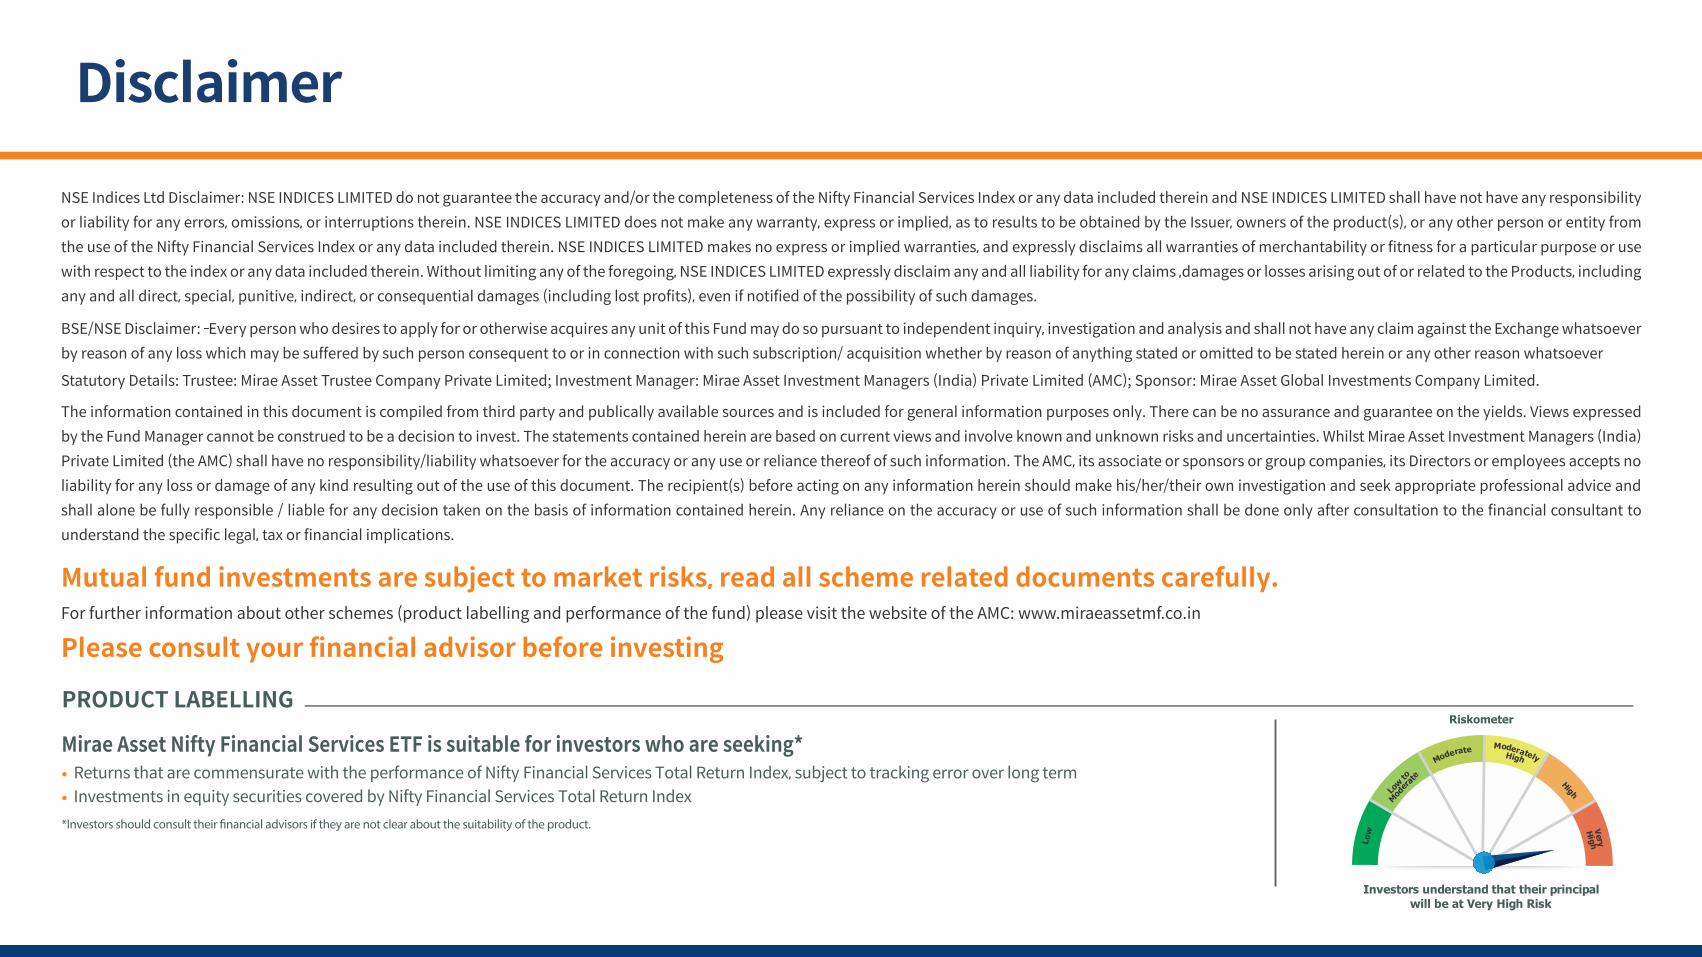
Mirae Asset Nifty Financial Services ETF is suitable for investors who are seeking* • Returns that are commensurate with the performance of Nifty Financial Services Total Return Index, subject to tracking error over long term• Investments in equity securities covered by Nifty Financial Services Total Return Index
Investors understand that their principal will be at Very High Risk


![Ch 1 Nbfc [m.y.khan]](https://static.documents.pub/doc/80x56/563dbb52550346aa9aac2648/ch-1-nbfc-mykhan.jpg)