NATIONAL BUREAU OF STANDARDS REPORT 8331 A Study of the Characteristics of Refrigerant-Pressure-Actuated Water Regulating Valves for Refrigerant Condensers by Selden D. Cole Clinton W. Phillips Paul R. Achenbach to Mechanical Engineering Division Quartermaster Research and Engineering Command Natick Laboratories, U. S. Army Natick, Mass. U. S. DEPARTMENT OF COMMERCE NATIONAL BUREAU OF STANDARDS
Transcript
NATIONAL BUREAU OF STANDARDS REPORT
8331
A Study of the Characteristicsof
Refrigerant-Pressure-Actuated Water Regulating Valvesfor Refrigerant Condensers
by
Selden D. ColeClinton W. PhillipsPaul R. Achenbach
toMechanical Engineering Division
Quartermaster Research and Engineering CommandNatick Laboratories, U. S. Army
Natick, Mass.
U. S. DEPARTMENT OF COMMERCE
NATIONAL BUREAU OF STANDARDS
NATIONAL BUREAU OF STANDARDS REPORT
NBS PROJECT NBS REPORT
1003-20-10435 April 4, 1964 8331
A Study of the Characteristicsof
Refrigerant-Pressure-Actuated Water Regulating Valvesfor Refrigerant Condensers
by
S. D. Cole, C. W. Phillips, and P. R. AchenbachMechanical Systems SectionBuilding Research Division
to
Mechanical Engineering DivisionQuartermaster Research and Engineering Command
Natick Laboratories, U. S. ArmyNatick, Mass.
IMPORTANT NOTICE
NATIONAL BUREAU OF S
for use within the Government,
and review. For this reason, tl
whole or in part, is not authi
Bureau of Standards, Washing
the Report has been specificall
Approved for public release by the
Director of the National Institute of
Standards and Technology (NIST)
on October 9, 2015.
ess accounting documents intended
s subjected to additional evaluation
e listing of this Report, either in
he Office of the Director, National
iy the Government agency for which
copies for its own use.
U. S. DEPARTMENT OF COMMERCE
NATIONAL BUREAU OF STANDARDS
A STUDY OF THE CHARACTERISTICSOF
REFRIGERANT- PRESSURE-ACTUATED WATER REGULATING VALVESFOR REFRIGERANT CONDENSERS
byS B. Cole, C. W. Phillips, and P. R. Achenbach
1 . 0 Introduction
At the request of the Quartermaster Research and EngineeringCommand, the National Bureau of Standards investigated the performancecharacteristics of refrigerant-pressure-actuated valves designed for
regulating the flow of water through refrigerant condensers. Thistype of valve, widely used in water-cooled refrigerating systems, hastwo principal functions, namely, (a) to maintain a refrigerant con-
densing pressure in the compression system that will produce an ade-quate flow of liquid refrigerant through the expansion device, and
(b) to conserve water. These same purposes can be accomplished by
temperature-actuated valves which control the condenser water flowin response to the temperature of the refrigerant in the condenseror to the difference in water temperature between condenser inlet and
outlet. However, each type of valve has somewhat different operatingcharacteristics
.
A proposed Military Specification, "Valves, Water Regulating,Refrigerant R-12", prepared by the Quartermaster Corps and datedAugust 31, I960 classifies these water-regulating valves as follows:
Size 1 - 3/8 inch National Pipe Thread (NPT) , 6 gallons
per minute (GPM) capacitySize 2-1/2 inch NPT, 10 GPM capacitySize 3 - 3/4 inch NPT, 25 GPM capacity
In addition, the specification incorporates material requirements
designed to provide strength, durability, corrosion resistance, sta-
bility of performance, and ease of maintenance and repair.
A proposed Military Standard, "Valves, Water Regulating, Refrig-
erant R-12", also prepared by the Quartermaster Corps and dated Au-
gust 31, 1960 cites the above classification and includes the follow-
ing rating conditions:
Condenser Hot Gas Pressure to be Maintained 126.55 psig
Pressure Drop across Valve for Rated Capacity 25 psig
Allowable Water Pressures 125 psig (Max), 35 psig (Min)
Maximum Water Temperature in Condenser Based on
Temperature Rise in Condenser of 10F - 85F.
- 1 -
The principal purpose of this investigation was to study theperformance characteristics of refrigerant-pressure-actuated water-valves that are of significance with respect to the two broad func-tions of refrigerant condensing pressure control and water conserva-tion, and included the following characteristics:
(a) The range of condensing pressure adjustment provided bythe valve.
(b) The change in condensing pressure required to move thevalve from fully closed to fully open position for a
range of inlet water pressures.(c) The water flow rate through the valve in its fully open
position for a range of pressure drops across the valve.(d) The hysteresis in the control mechanism on rising and
falling condensing pressures.(e) The difference between the condensing pressure required
to commence opening the valve and that required to fullystop the water flow.
(f) The effect of inlet water pressure on the condensingpressure required to open and close the valve for a
given setting of the adjustment spring.
Pressure-actuated valves of 3/8-inch, 1/2-inch, and 3/4-inchpipe size from each of three valve manufacturers were used for the
study. The relation of condensing pressure to water flow rate wasobserved for each valve for three settings of the adjustment springand for three values of water pressure drop through the valve
In addition, the results obtained from the test specimens werecompared with the requirements of the proposed Military Specificationand Military Standard, as a basis for possible revision of thesedocuments and as a basis for suggesting new design criteria to the
manufacturers of this type of valves
2 . 0 Descr ipt ion of Test Specimens
Nine refrigerant pressure-actuated water flow regulating valvessubmitted by Quartermaster Research and Engineering Command were in-
vestigated. These valves were manufactured by the following companies
1. Controls Company of America, Milwaukee, Wisconsin2. Marsh Instrument Company of America, Skokie, Illinois
3. Penn Controls, Inc., Goshen, Indiana
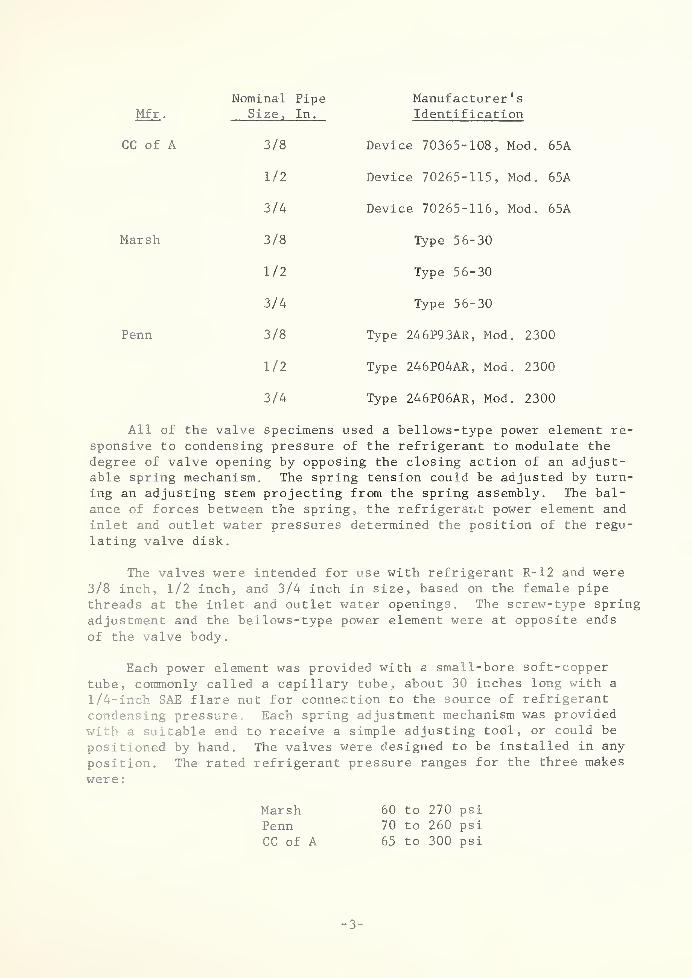
The valve sizes (nominal N.P.T.), and manufacturer's identifica-tion were as follows:
- 2 -
Mfr
.
Nominal PipeSize, In.
Manufacturer 1
s
Identification
CC of A 3/8 Device 70365-108, Mod. 65A
1/2 Device 70265-115, Mod. 65A
3/4 Device 70265-116, Mod. 65A
Marsh 3/8 Type 56-30
1/2 Type 56-30
3/4 Type 56-30
Penn 3/8 Type 246P93AR, Mod. 2300
1/2 Type 246P04AR, Mod. 2300
3/4 Type 246P06AR, Mod. 2300
All of the valve specimens used a bellows-type power element re-sponsive to condensing pressure of the refrigerant to modulate the
degree of valve opening by opposing the closing action of an adjust-able spring mechanism. The spring tension could be adjusted by turn-ing an adjusting stem projecting from the spring assembly. The bal-
ance of forces between the spring, the refrigerant power element and
inlet and outlet water pressures determined the position of the regu-lating valve disk.
The valves were intended for use with refrigerant R-12 and were3/8 inch, 1/2 inch, and 3/4 inch in size, based on the female pipethreads at the inlet and outlet water openings. The screw-type spring
adjustment and the bellows-type power element were at opposite ends
of the valve body.
Each power element was provided with a small-bore soft-copper
tube, commonly called a capillary tube, about 30 inches long with a
1/4-inch SAE flare nut for connection to the source of refrigerant
condensing pressure. Each spring adjustment mechanism was provided
with a suitable end to receive a simple adjusting tool, or could be
positioned by hand. The valves were designed to be installed in any
position. The rated refrigerant pressure ranges for the three makes
were
:
MarshPennCC of A
60 to 270 psi70 to 260 psi
65 to 300 psi
- 3 -
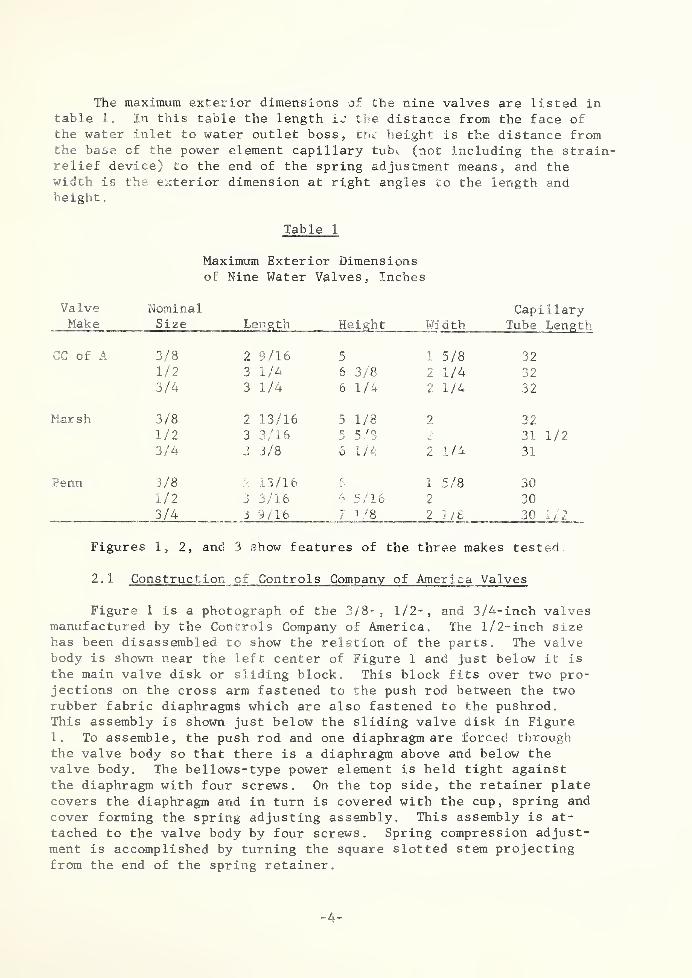
The maximum exterior dimensions of the nine valves are listed intable 1. In this table the length ij the distance from the face ofthe water inlet to water outlet boss, trn. height is the distance fromthe base of the power element capillary tuK (not including the strain-relief device) to the end of the spring adjustment means, and thewidth is the exterior dimension at right angles to the length andheight
.
Table 1
Maximum Exterior Dimensionsof Nine Water Valves, Inches
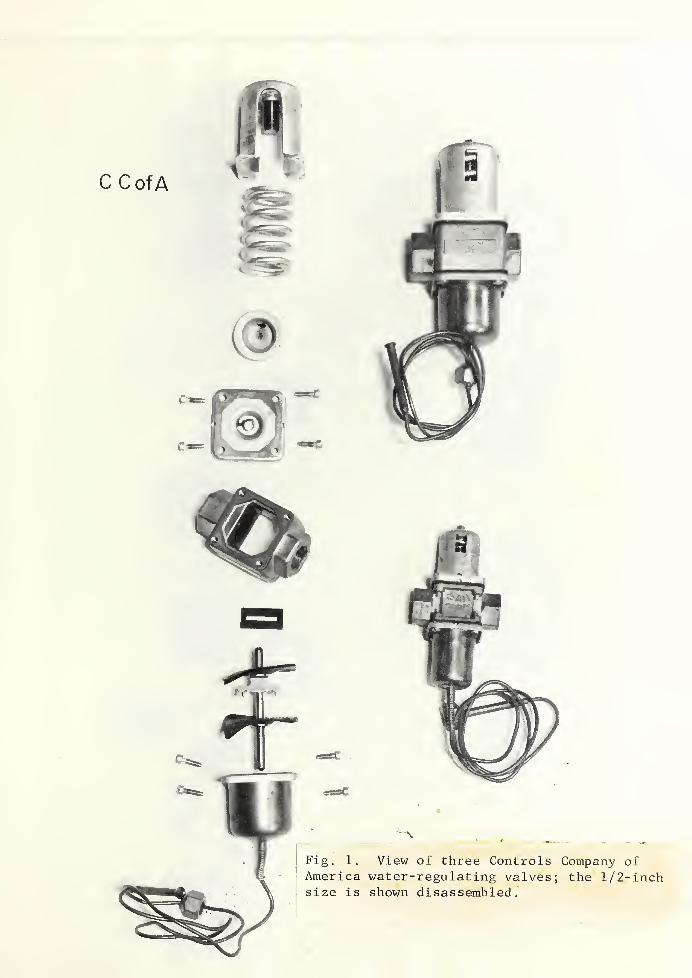
Figures 1, 2, and 3 show features of the three makes tested
2 . 1 Construction of Controls Company of America Valves
Figure 1 is a photograph of the 3/8-, 1/2-,and 3/4-inch valves
manufactured by the Controls Company of America. The 1/2- inch sizehas been disassembled to show the relation of the parts. The valvebody is shown near the left center of Figure 1 and just below it is
the main valve disk or sliding block. This block fits over two pro-jections on the cross arm fastened to the push rod between the tworubber fabric diaphragms which are also fastened to the pushrod.This assembly is shown just below the sliding valve disk in Figure1. To assemble, the push rod and one diaphragm are forced throughthe valve body so that there is a diaphragm above and below thevalve body. The bellows-type power element is held tight againstthe diaphragm with four screws. On the top side, the retainer platecovers the diaphragm and in turn is covered with the cup, spring and
cover forming the spring adjusting assembly. This assembly is at-
tached to the valve body by four screws. Spring compression adjust-ment is accomplished by turning the square slotted stem projectingfrom the end of the spring retainer.
- 4 -
The sliding-block valve disk is held against the valve orificeor seat by the inlet water pressure and is held in alignment by thepush rod guided in turn by the diaphragms and retaining plates.
The 3/8-inch valve has one valve orifice slot and the 1/2- and
3/4-inch sizes have two valve orifice slots, each sealed by one of
two bars of the sliding-block valve disk when the valve is closed.
According to literature furnished by the manufacturer, the valveseat was stainless steel, the valve disk was called a "sliding graphi-tar block", and the valve body was cast brass.
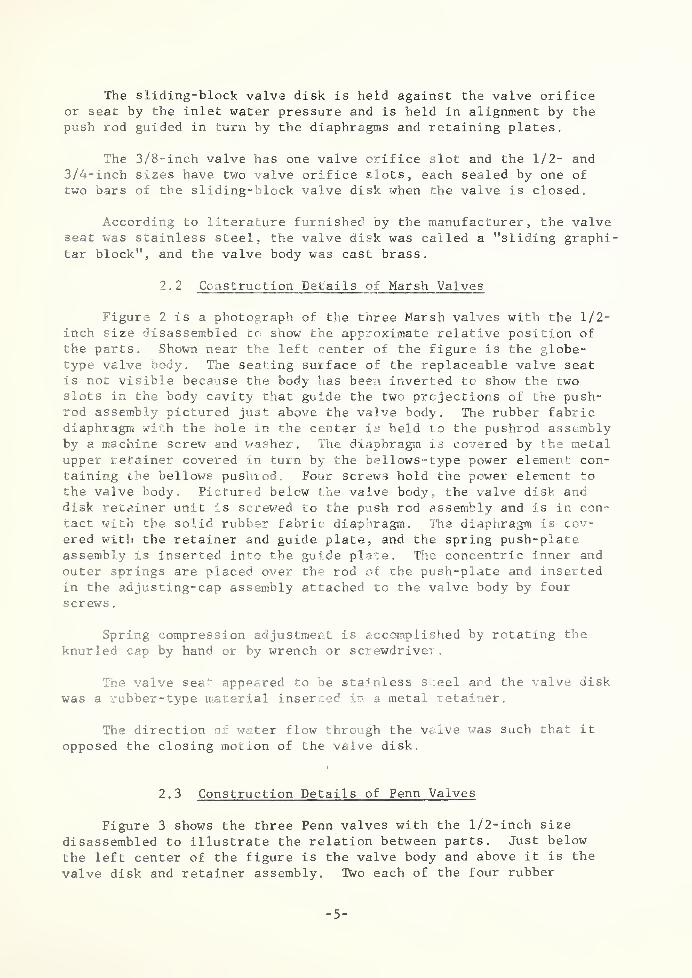
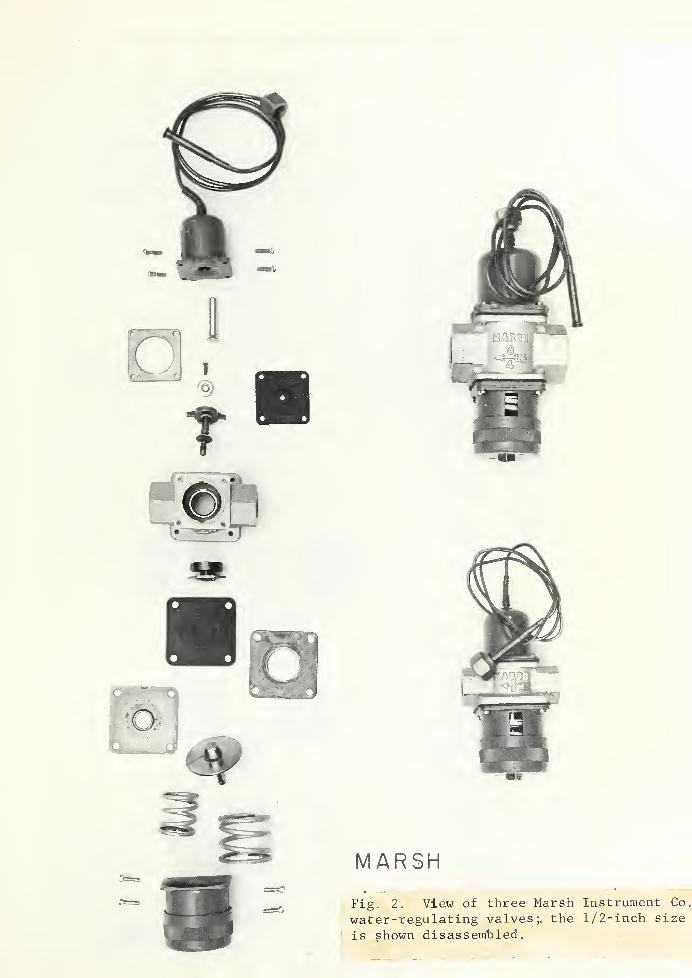
2 . 2 Constru c tion Details of Marsh Valves
Figure 2 is a photograph of the three Marsh valves with the 1/2-
inch size disassembled to show the approximate relative position ofthe parts. Shown near the left center of the figure is the globe-type valve body. The seating surface of the replaceable valve seatis not visible because the body has been inverted to show the twoslots in the body cavity that guide the two projections of the push-rod assembly pictured just above the valve body. The rubber fabricdiaphragm with the hole in the center is held to the pushrod assemblyby a machine screw and washer. The diaphragm is covered by the metalupper retainer covered in turn by the be blows -type power element con-taining the bellows pushrod. Four screws hold the power element to
the valve body. Pictured below the valve body, the valve disk anddisk retainer unit is screwed to the push rod assembly and is in con-
tact with the solid rubber fabric diaphragm. The diaphragm is cov-
ered with the retainer and guide plate, and the spring push-plateassembly is inserted into the guide plate. The concentric inner and
outer springs are placed over the rod of the push-plate and insertedin the adjusting- cap assembly attached to the valve body by four
screws
.
Spring compression adjustment is accomplished by rotating the
knurled cap by hand or by wrench or screwdriver
.
The valve seat appeared to be stainless steel and the valve disk
was a rubber-type material inserted in a metal retainer.
The direction of water flow through the valve was such that it
opposed the closing motion of the valve disk.
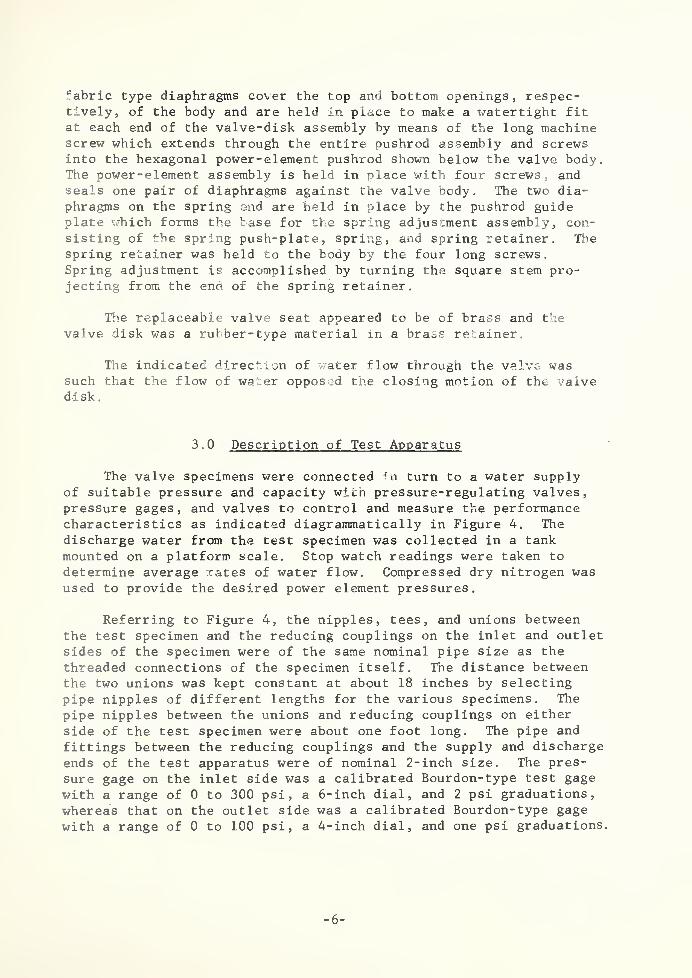
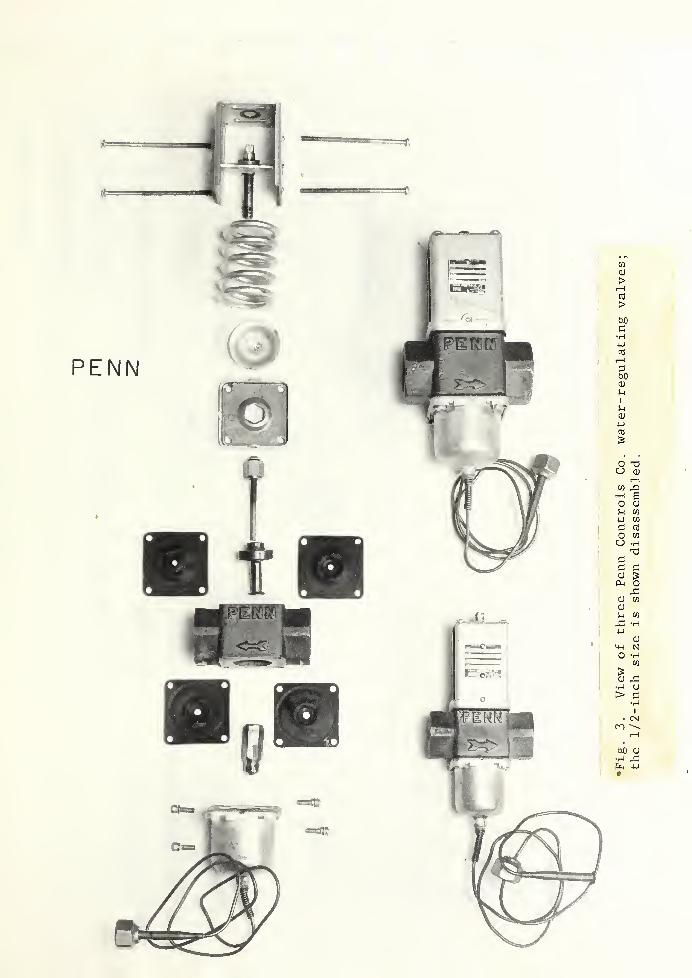
2 . 3 Construction Details of Penn Valves
Figure 3 shows the three Penn valves with the 1/2-inch size
disassembled to illustrate the relation between parts. Just below
the left center of the figure is the valve body and above it is the
valve disk and retainer assembly. TWo each of the four rubber
- 5 -
fabric type diaphragms cover the top and bottom openings, respec-tively, of the body and are held in place to make a watertight fitat each end of the valve-disk assembly by means of the long machinescrew which extends through the entire pushrod assembly and screwsinto the hexagonal power-element pushrod shown below the valve body.The power-element assembly is held in place with four screws, andseals one pair of diaphragms against the valve body. The two dia-phragms on the spring end are held in place by the pushrod guideplate which forms the base for the spring adjuscment assembly, con-
sisting of the spring push-plate, spring, and spring retainer. Thespring retainer was held to the body by the four long screws.
Spring adjustment is accomplished by turning the square stem pro-jecting from the end of the spring retainer.
The replaceable valve seat appeared to be of brass and thevalve disk was a rubber- type material in a brass retainer.
The indicated direction of water flow through the valve wassuch that the flow of water opposed the closing motion of the valved i sk
.
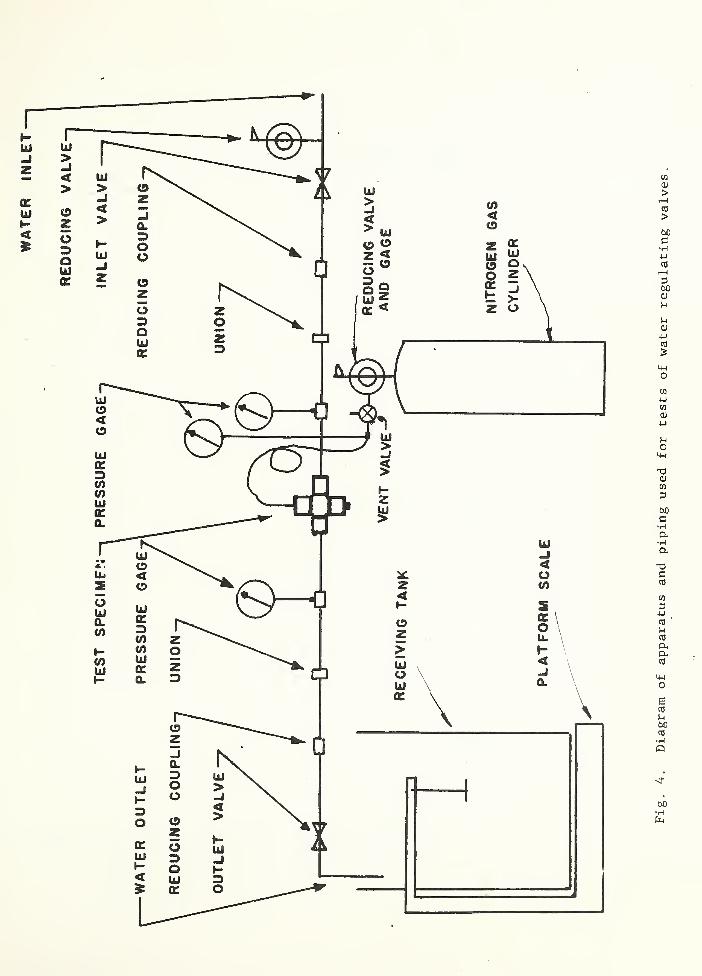
3 . 0 Description of Test Apparatus
The valve specimens were connected in turn to a water supplyof suitable pressure and capacity wicn pressure-regulating valves,pressure gages, and valves to control and measure the performancecharacteristics as indicated diagrammatically in Figure 4. Thedischarge water from the test specimen was collected in a tankmounted on a platform scale. Stop watch readings were taken to
determine average rates of water flow. Compressed dry nitrogen wasused to provide the desired power element pressures.
Referring to Figure 4, the nipples, tees, and unions betweenthe test specimen and the reducing couplings on the inlet and outletsides of the specimen were of the same nominal pipe size as the
threaded connections of the specimen itself. The distance betweenthe two unions was kept constant at about 18 inches by selectingpipe nipples of different lengths for the various specimens. The
pipe nipples between the unions and reducing couplings on either
side of the test specimen were about one foot long. The pipe and
fittings between the reducing couplings and the supply and dischargeends of the test apparatus were of nominal 2-inch size. The pres-
sure gage on the inlet side was a calibrated Bourdon-type test gage
with a range of 0 to 300 psi, a 6-inch dial, and 2 psi graduations,
whereas that on the outlet side was a calibrated Bourdon-type gage
with a range of 0 to 100 psi, a 4-inch dial, and one psi graduations.
- 6 -
The capillary tube to the power element of the test specimen wasconnected to a cylinder of dry nitrogen gas through a pressure-reducingvalve. Pressure at the inlet to the capillary tube was measured witha gage of the same range and size as that at the water inlet to the testspecimen. The pressure-reducing valve on the nitrogen cylinder wasadjusted to maintain the desired pressure at the inlet to the capil-lary tube. A vent valve on the nitrogen line was used in some teststo waste a little nitrogen gas in order to maintain a floating con-
dition in the pressure-reducing valve.
4.0 Test Procedure
Each specimen valve was similarly installed in the test apparatusas shown in Figure 4. Each valve was operated at three settings of the
pressure-adjusting spring and three inlet water pressures for a totalof nine tests for each vaive. The three spring settings were:
1. Full retraction of spring adjustment mechanism2. A setting which produced an initial valve opening at about
80 psig nitrogen pressure on the power element, and 30 psiginlet water pressure.
3. A setting which produced an initial valve opening at 150 to
160 psig nitrogen pressure on the power element, in mostcases, and 30 psig inlet water pressure.
The three inlet water pressures were:
1. 30 psig2. 60 to 70 psig3. 90 to 100 psig
In addition, the water flow rate was measured for a range of waterpressure drops from 0 to above 80 psi with the valve set for an openposition. For these tests, the open position was obtained by main-taining a nitrogen gas pressure of 300 psig in the power element and
the spring adjustment was in the fully-retracted position.
The following procedure was used for obtaining the three spring
adjustments described above. The spring adjustment device was first
set in the fully-retracted position. The minimum gas pressure re-
quired to open the valve was determined by slowly increasing the
nitrogen gas pressure, starting at 0 psig, and observing the pressureat the instant the inlet water pressure started to drop from an ini-
tial value of 30 psig. This pressure drop indication was made verysensitive by closing the shutoff valve on the inlet water line (see
Fig. 4) with water at 30 psig pressure trapped between the inlet
water shutoff valve and the test specimen. A similar procedure was
used for the two higher settings of the spring adjustment. Several
- 7 -
adjustments of spring compression were usually required to obtainthe desired nominal opening gas pressures of 80 and 160 psig. Oncethe desired opening pressure was obtained, the same spring compres-sion setting was used for all tests at that nominal opening pres-sure.
At each of the three settings of the spring adjustment, waterflow rate measurements were made at three inlet water pressures-- JO
,
60 to 70, and as near to 100 psig as the laboratory supply could pro-vide. While each of these inlet water pressures was maintained on
the upstream side of the valve specimen, the outlet valve on the
downstream side was manually adjusted to maintain a pressure of 10
psig at the outlet of the test specimen, so the pressure drop acrossthe valve was 10 psi less than the entering water pressure at all
times. This was done to test all the valves under similar conditionsand to simulate, for each data point, the resistance to the flow of
water of a condenser downstream of the test valve.
Each series of measurements at a particular inlet water pres-sure was conducted generally in the following manner. After deter-mining the minimum nitrogen gas pressure required to open the valveunder test, as described above, the gas pressure on the power elementwas raised an increment of 5 psi, the inlet water shutoff valve wasopened, and the outlet water shutoff valve partially closed until
10 psig was indicated by the gauge on the outlet side of the test
specimen. When the conditions had stabilized, a moving tare weightwas obtained for the water receiving tank and the time required,not less than 2 minutes, to collect an even multiple of 100 pounds
of water was recorded, using a stop watch. The stop watch was
started as the tare weight tipped the scale arrn and stopped whenthe collected water again tipped the scale arm, with the necessary
added weights. The receiving tank was then drained while the gas
pressure was increased an increment of 5 to 10 psi. The waterpressures were adjusted again to the desired inlet and 10 psig
outlet, and when stabilized, the weighing procedure was repeated.
This procedure was repeated at selected increments of higher nitrogen
pressure up to a maximum of J0Q psig.
Water flow races were then similarly determined for descend-
ing values of nitrogen pressure from ^00 psig to a pressure which
allowed the valve to close. The nitrogen pressure in the power
element of the valve was reduced by manual operation of the vent
valve shown in Figure 4. The water valve under test was considered
closed at the final 5 psi incremental setting of nitrogen pressure
at which no water flowed from the outlet pipe into the receiving
tank after the previous higher increment at which a very slow flow
was obtained. In most cases, this procedure resulted in a definite
closing pressure determination within a 5 psi range.
- 8 -
5 . 0 Test Results
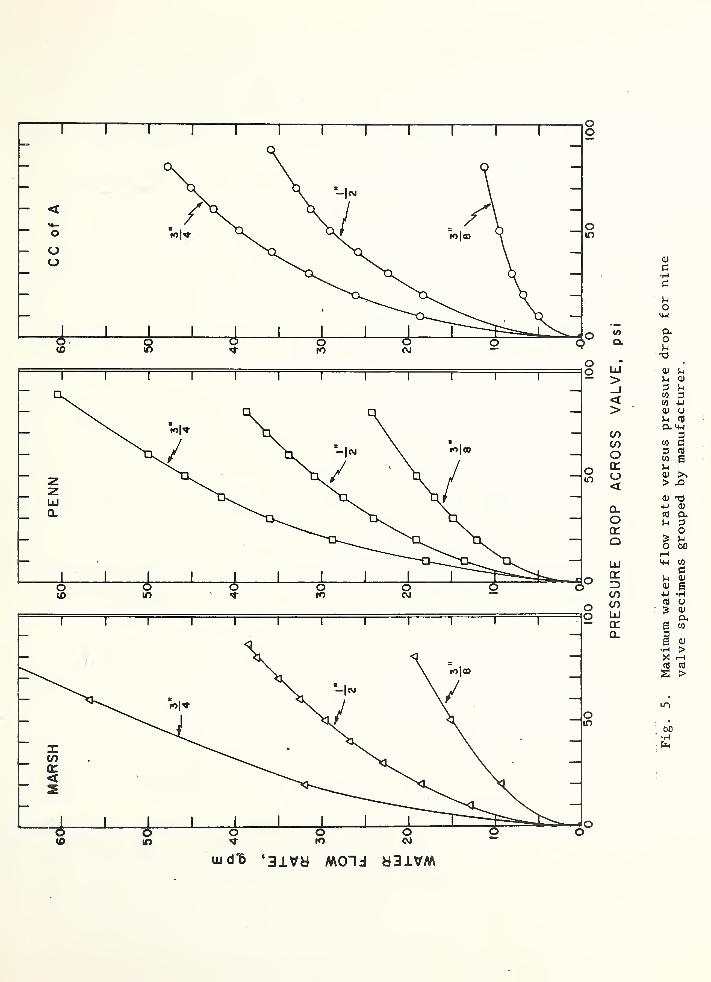
5 . 1 Water Flow Rate at Full-Open Valve Position
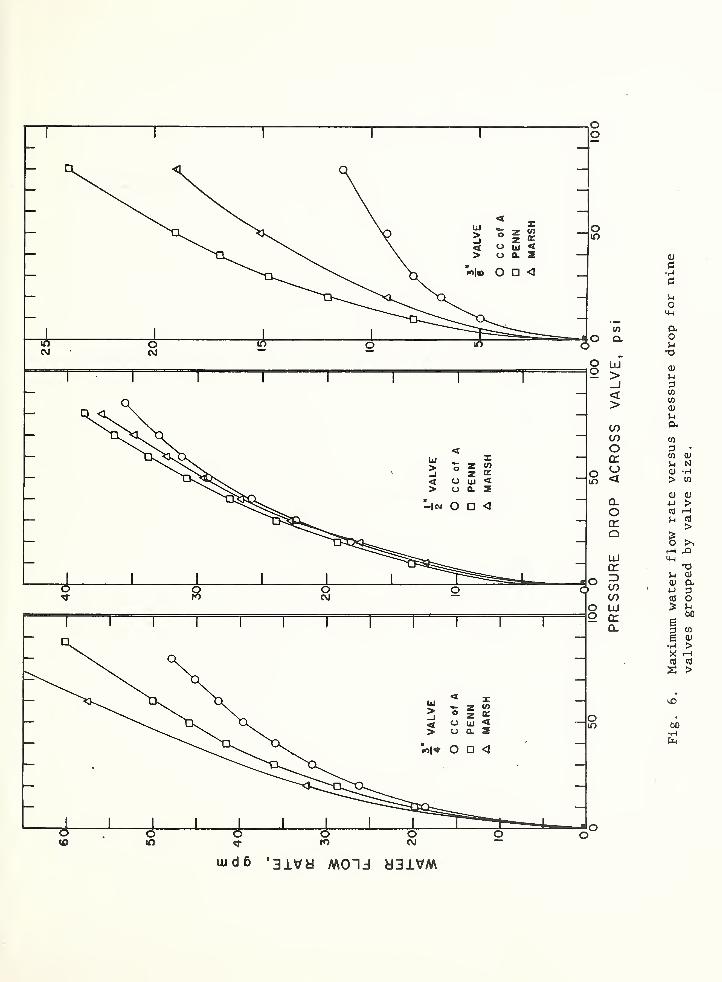
Water flow rates were determined for the nine valve specimensfor a range of water pressure drops with the valve in the open posi-tion produced by a high power element pressure. The water flow rateis plotted in Figures 5 and 6 as the dependent variable against the
pressure drop across the valve in the water circuit. In Figure 5,
each group of three curves shows the performance of the three valvesizes from one manufacturer. In Figure 6, each group of three curvesshows the performance of three similar-sized valves, one from eachof the three manufacturers.
The water flow rate data shown in Figures 5 and 6 were obtainedwith the spring adjustment device fully-retracted and a nitrogen gaspressure on the power element of 300 psig. For most of the valves,this produced a maximum valve opening. For the 1/2- inch and 3/4- inchvalves manufactured by Controls Company of America, the maximum waterflow rate was obtained with a valve disk travel slightly less thanthe maximum possible travel of the disk pushrod assembly. The valuesplotted in Figures 5 and 6 for these two valves are the water floi*?
rates obtained with the maximum travel of the valve disk pushrod.
Each value of water flow rate was determined by collecting,for a measured duration of about two minutes, the water dischargedthrough the valve at the various inlet water pressures against a
constant outlet water pressure of 10 psig. The water pressure dropacross the valve was increased by increments of 10 psi to a maximumof about 100 psig water pressure at the inlet side of the valve.
Figure 5 indicates that the water flow rate curves for the
different-sized valves of each manufacturer, were generally para-bolic in shape and that water flow rate increased with valve size,
other conditions being equal. It was determined that the waterflow rate for each valve in the full-open position was essential!}?
proportional to the squat e root of the water pressure drop across
the valve.
Figure 6 provides a comparison of the water flow rates of
valves of the same nominal pipe size from different manufacturers.It will be noted that the 1/2-inch size valves from the three manu-facturers had almost the same capacity throughout the range of
pressure drop employed in the tests. For example, at a water pres-
sure drop of 75 psi the water flow capacity of the three 1/2-inch
valves differed by only 10 percent, with the Penn valve having the
highest capacity and the Controls Company of America valve, the
lowest capacity.
- 9 -
In the 3 / 8 -inch size, the water flow capacity of the threemakes of valves differed widely. At a water pressure drop of 25psi the highest capacity was 1.8 times the lowest, whereas at a
water pressure drop of 75 psi this ratio was 2.1. In this sizevalve, the Penn valve also had the highest capacity and the Con-trols Company of America valve had the lowest capacity.
For the three 3/4-inch size valves, the ratio of the highestwater flow capacity to the lowest capacity ranged from 1,24 at a
water pressure drop of 25 psi to 1.41 at a pressure drop of 75 psi.
In this size valve, the Marsh valve had the highest capacity andthe Controls Company of America valve had the lowest capacity.
It appears that the single orifice opening in the 3 / 8 -inchvalve of the Controls Company of America did not permit water flowrates comparable to the 3 / 8 -inch globe-type valves of the othertwo makes to the same degree that the double orifice opening per-mitted in the larger size valves.
5.2 Valve Performance for Modulated Waterand Refrigerant Pressures
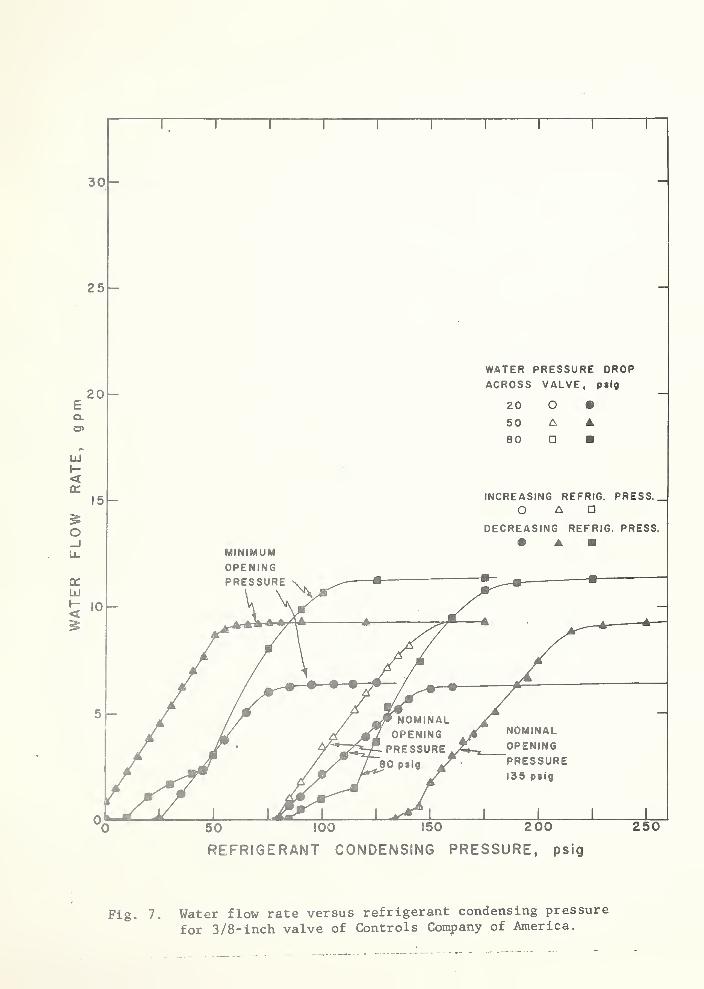
The water flow rates of each of the nine valve specimens for a
range of refrigerant condensing pressure and at three settings ofthe spring adjustment mechanism are shown graphically in Figs. 7 to
15, inclusive. In these figures the water flow rate is plotted as
a dependent variable against the refrigerant condensing pressure,produced by the pressure of dry nitrogen gas in the power elementof the valve during these tests. In most cases the performance ofthe valves was determined for both increasing and decreasing valuesof refrigerant condensing pressure. The test procedures used in this
investigation were developed during the course of the tests of the
3 / 8-inch valves, so the results on this size valve are not quite as
comprehensive as those for the other sizes. Only the test resultsof the 3 / 8-inch valves that were obtained by procedures essentiallysimilar to those finally used for the larger valves are Bhown in this
group of figures.
In each of Figures 7 through 15, the observed data are presentedin three groups of curves corresponding to the three settings of the
spring adjustment mechanism, except in a few cases where the perform-ance of the valve prevented completing the three series of tests.
Different symbols were used in the figures to show the results for
increasing and decreasing refrigerant condensing pressures, and also
for different pressure drops across the valves.
The several performance features of the refrigerant-pressure-actuated water valves that were of interest in this investigationincluded the following:
- 10 -
(a) The ratio of the change in water flow rate to the change in
refrigerant-condensing pressure in the central modulating rangeof the valve, from about 10% to 90% of the maximum water flowrate
.
(b) The total change in refrigerant condensing pressure required from90% maximum water flow rate to valve shutoff.
(c) The opening and closing characteristics of the valves, from shut-off to about 10% of the maximum water flow rate.
(d) The water flow versus refrigerant condensing pressure character-istics from 90% to 100% of the maximum water flow rate.
(e) The frictional characteristics of the movable elements of thevalves, as indicated by the difference in water flow rate foridentical increasing and decreasing values of refrigerant con-densing pressure.
(f) The effect of supply water pressure on the performance of thevalves
.
An inspection of the curves in Figs. 7 to 15, inclusive, showsthat the water flow rate was approximately proportional to the refrig-erant condensing pressure throughout a broad central range of water flowrate, since the central portions of the curves approximate straight lines.
This approximation appeared to be less exact for the 3/8- inch Marsh valvethan for the other specimens, and appeared to be less exact for the low-
est inlet water pressure than for the higher water pressures for several
of the specimens.
For purposes of analysis and discussion, each of the performancecurves in Figs. 7 to 15 can be divided into three sections, namely: the
section from valve shutoff to 10 percent maximum flow rate, the sectionfrom 10 percent to 90 percent flow? rate, and the section from 90 percentto 100 percent maximum flow/ rate. The first section indicates the open-
ing and closing characteristics of the valve. The middle section com-
prises the operating range of the valve and is the section in which the
water flow rate is most nearly proportional to the refrigerant condens-
ing pressure. The third section reveals the operating characteristics
of the valve near its wide open position. For most of the specimens
tested, the change in refrigerant condensing pressure required to obtain
the last 10 percent of the maximum water flow rate was much larger than
that required for a similar increment of water flow rate in the working
range. For this reason it is considered undesirable to rate a water
regulating valve on the basis of its maximum water flow rate since it
would require an abnormally high refrigerant condensing pressure to pro-
duce the maximum water flow rate.
- 11 -
5.2.1 Sensitivity Factor
As used in this report, the ratio of the change in water flowrate to the change in refrigerant condensing pressure in the operatingrange of a water regulating valve from 10 percent to 90 percent of
the maximum water flow rate is defined as the 1 sensitivity factor 1
for the valve. It represents the change in water flow rate in gallonsper minute per unit change in refrigerant condensing pressure expressedin pounds per square inch. The sensitivity factor is directly relatedto the slope of the curves in Figs. 7 to 15 in the working range of
the valves, that is, a steeper slope represents greater sensitivityand vice versa.
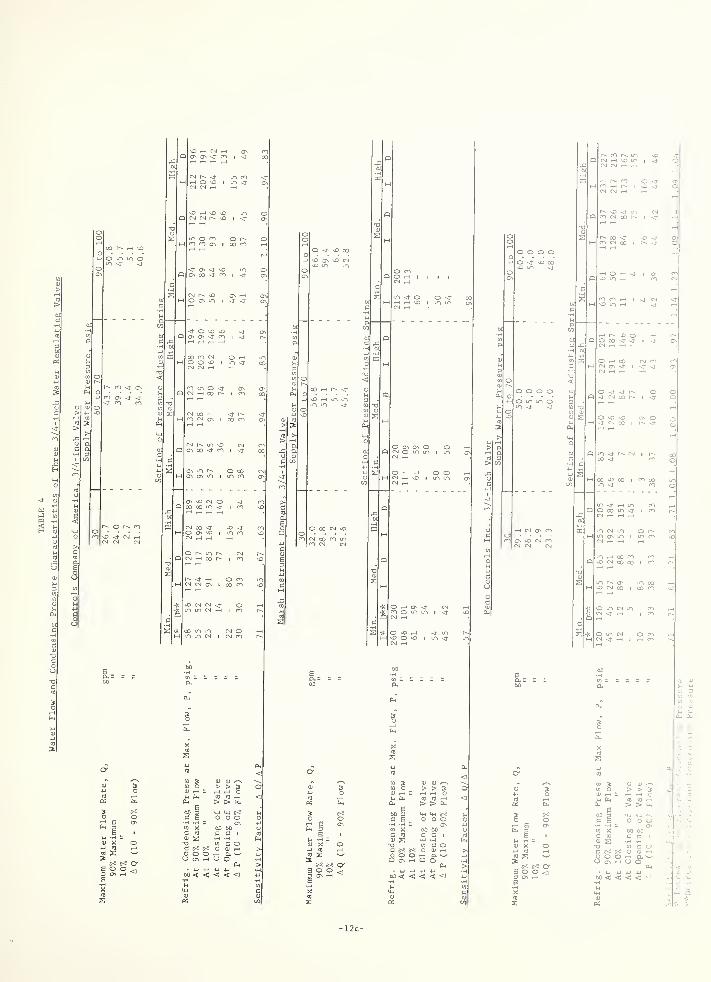
The water flow rates at 10%-, 90% and 100% maximum flow rate,the corresponding refrigerant condensing pressures at these flowrates and at valve opening and closing, and the sensitivity factorfor each valve specimen are summarized in Tables 2-4, inclusive.Study of these tables indicates that the sensitivity factor differedonly slightly with the direction of change of the refrigerant con-densing pressure, and only slightly for the range of refrigerantcondensing pressure from the minimum setting to the high setting of
the pressure adjusting spring.
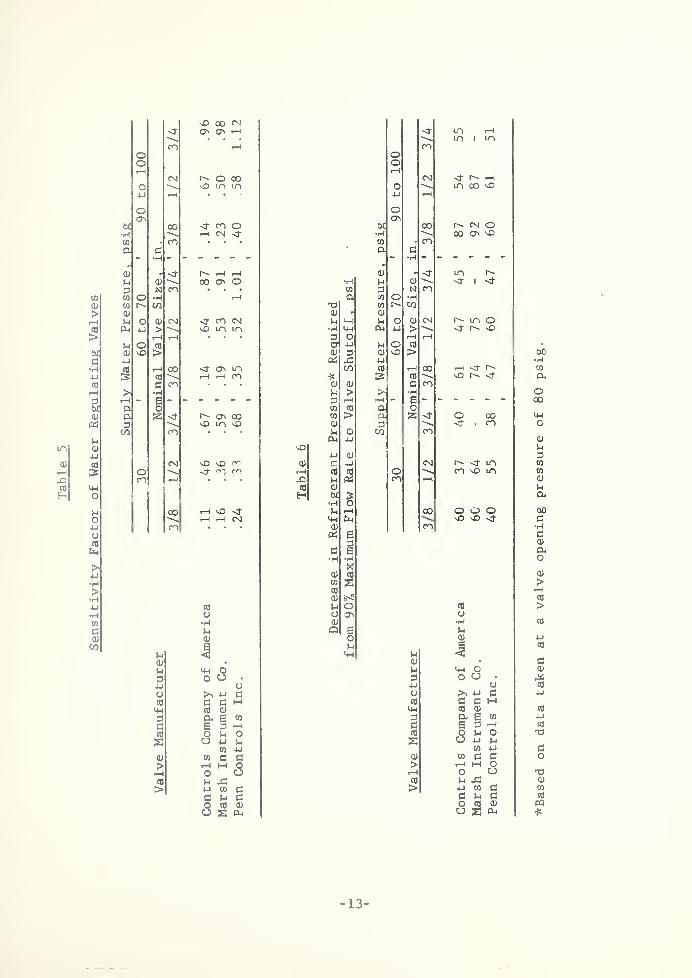
Table 5 is a summary of the sensitivity factors for the ninevalve specimens, in which all the values obtained for a given supplywater pressure range were averaged for each valve. This table shows
a variation of about 2 to 1 in the sensitivity factors of the differ-ent models of the 3/8-inch valves at a supply water pressure of 30
psig and a variation of nearly 3 to 1 for the same size valves at
the highest supply water pressure. The sensitivity factors for the
two larger size valves varied from 15 to 40% among the differentmodels over the range of supply Twater pressures used. For any givenvalve specimen, the sensitivity factor tended to increase as the
water supply pressure increased, but the rate of increase in sensi-
tivity was not consistent among different specimens. The sensitivityfactor was as low as 0.1 gpm per unit change in refrigerant condensingpressure for one make of 3/8- inch valve and ranged upward to about
1 gpm per unit change in refrigerant condensing pressure for all
three 3/4-inch valves at the highest supply water pressure.
5.2.2 Refrigerant Condensing Pressurein Operating Range of Valves
The sensitivity factor for any given make of valve increased rather
sharply with the size of the valve. This characteristic might be antic-
ipated since the larger valves had larger water passages. However, the
higher sensitivity factors for the larger valves does not necessarily
indicate that the operating levels of refrigerant condensing pressure
would be lower for larger capacity installations since these require a
d id d o 03 CN in o*H G G 4-J > \ NO3 o rH rHo 4-J d o co
03 3 03 nO >od -d 4-J
c/3 CO rH 00 rHX Ds CO NO03 03 c cnd > *> •H3 rH rH - BCO cO Q 0CO > G z o 0003 3 i COd o C/3 cn0-i 4-J
4-J 03
d H CM <r mto d o cn nO ind od CO tH03
w 5*H od rH 00 o o Omh Ih nO NO0) cnod 6
3d B•H •H
x03 cO
CO 2CO
03
d o co
o ON o0) •Ho B d
o 03
did d <
03 •
d Md o3 0 G3 •
4-J Go fn -u dCO d B Mid cO 03
3 G B CO
d B 3 rHd o d o2 OJ 4-J d
CO 4-J
03 CO d d> rH H orH o CJco d -d> 4-J CO d
d d do co 0)
CJ 2 G
13
*Based
on
data
taken
at
a
valve
opening
pressure
of
80
psig.
higher water flow rate. Table 6 summarizes the decrease in refrigerantcondensing pressure to change the water flow rate from 90 percent of themaximum rate to valve shutoff. The values in Table 6 were taken fromTables 2-4, inclusive, from the data observed at the medium setting ofthe pressure adjusting spring, that is, a valve opening pressure of
about 80 psig; and for decreasing values of refrigerant condensing pres-sure in most cases. Table 6 shows a considerable variation in the re-frigerant pressure change required to move the valve from 90 percentmaximum flow rate to the closed position. This pressure increment washigher for the Marsh valves than for the other two makes in 5 out of
the 6 cases for which comparisons could be made. This pressure incre-ment was significantly higher for the 3/8-inch size valve of the Con-trols Company of America than for the other two sizes of the same make;whereas this pressure increment was highest in the 1/2-inch size of thePenn valves. Reference to Tables 2-4 inclusive show that the refriger-ant condensing pressure at 90 percent maximum flow rate would range from108 psig to 177 psig for eight of the nine valve specimens on which datawere observed when they were set for an opening refrigerant condensingpressure of 80 psig.
5.2.3 Opening and Closing Character Istlcs
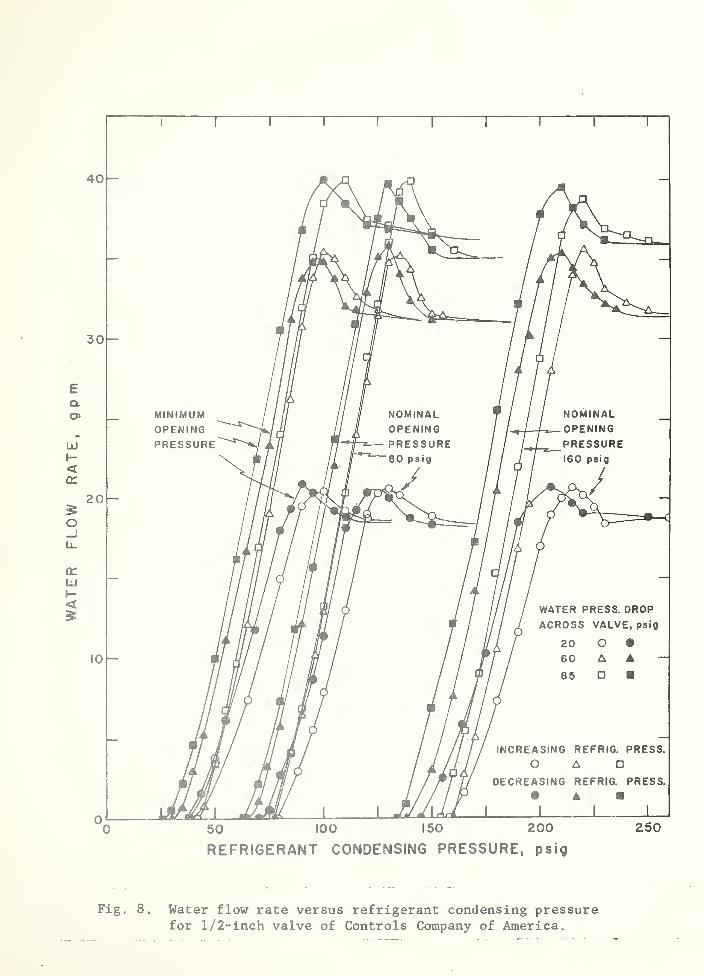
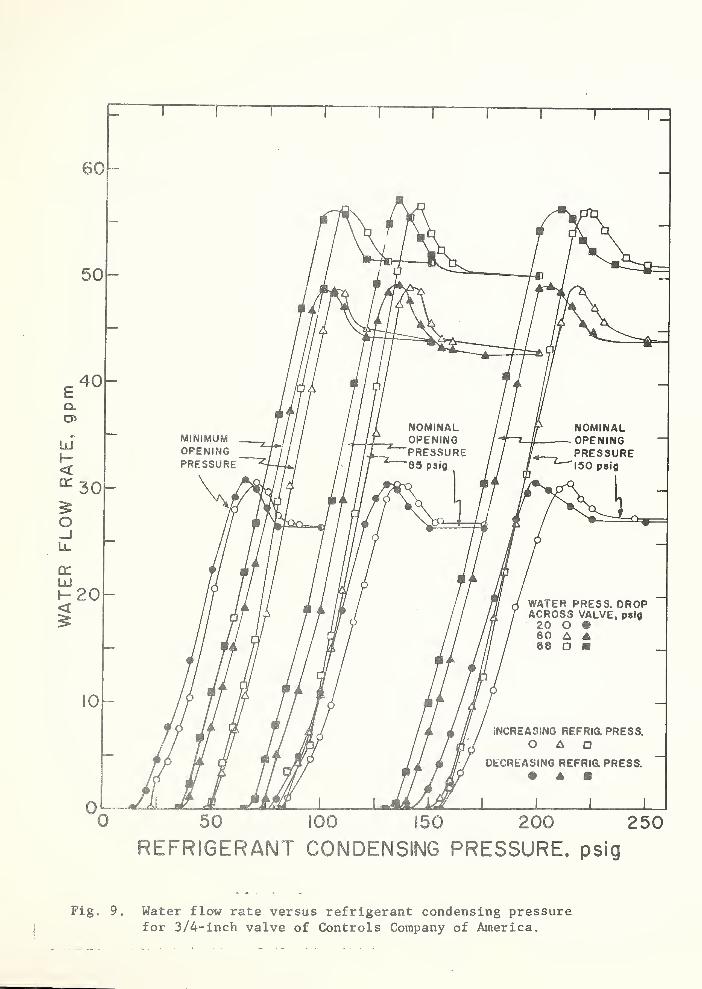
It was observed during the tests that the refrigerant condensingpressure had to be reduced to a somewhat lower value to completely stopthe water flow in some instances than that required to initiate waterflow as the refrigerant condensing pressure was rising. This character-istic is illustrated for the 1/2-inch and 3/4-inch valves of each of thethree manufacturers by the plotted data at zero water flow rate in Figs.
8 and 9, 11 and 12, and 14 and 15. A summary of the difference betweenthe opening and closing pressures for the 1/2-inch and 3/4-inch valvesis reported in Table 7.
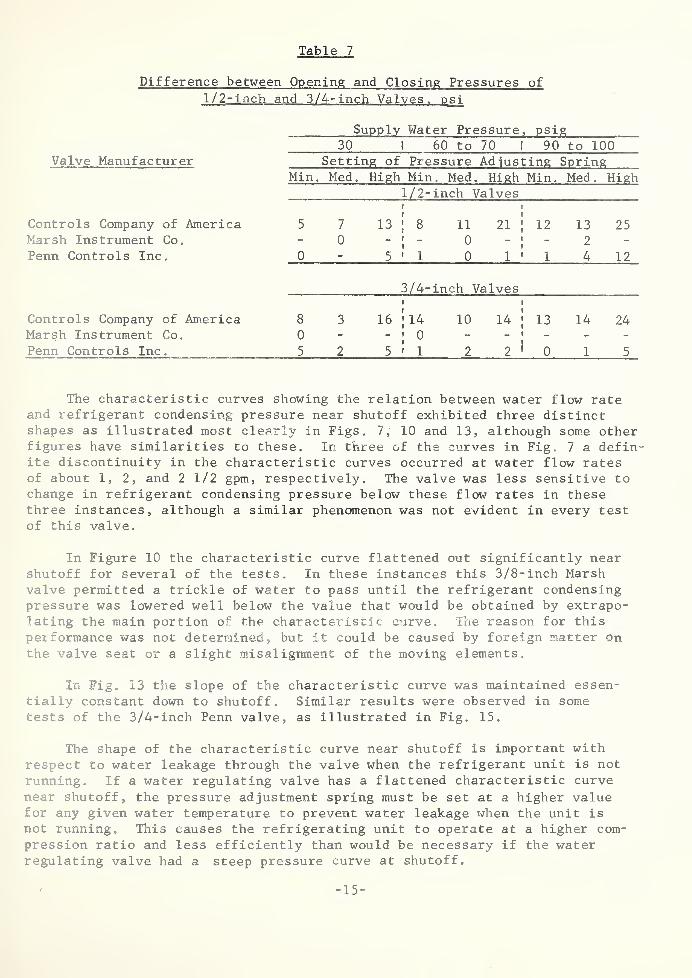
Table 7 indicates that the difference between the opening and clos-
ing pressures for the two valves manufactured by Controls Company of
America was significantly greater than for the other two valves. The
number of possible comparisons with the Marsh valves was limited becausemalfunctioning of these valves caused early termination of the tests.
The valve action in the Controls Company of America specimens was ob-
tained by a slotted movable block sliding over a slotted stainless steel
seat with the supply water pressure holding the block against the seat.
In the Marsh and Penn valves the supply water exerted forces opposingboth the spring pressure and the power element pressure but did not
involve sliding further between the moving valve element and the seat.
The difference in construction of the valves may account for the varia-
tions in opening and closing performance shown in table 7.
- 14 -
Table 7
Difference between Opening and Closing Pressures of
1/2-inch and 3/4-inch Valves, psi
Supply Water Pressure, psig
Valve Manufacturer30 1 60 to 70 1 90 to 100
Setting of Pressure Ad justing SpringMin Med. High Min. Med. High Min. Med. High
1/2-inch Valves
Controls Company of America 5 7 13\
8 11
t
21;
12 13 25Marsh Instrument Co. - 0 -
;
- 0 - 2 -
Penn Controls Inc. 0 - 5 ' 1 0 1 ' 1 4 12
3/4-inch Valves
Controls Company of America 8 3 16;
14 10 14i
13 14 24Marsh Instrument Co. 0 - -
;
0 - - -
Penn Controls Inc. 5 2 5 * 1 2 2 * 0 1 5
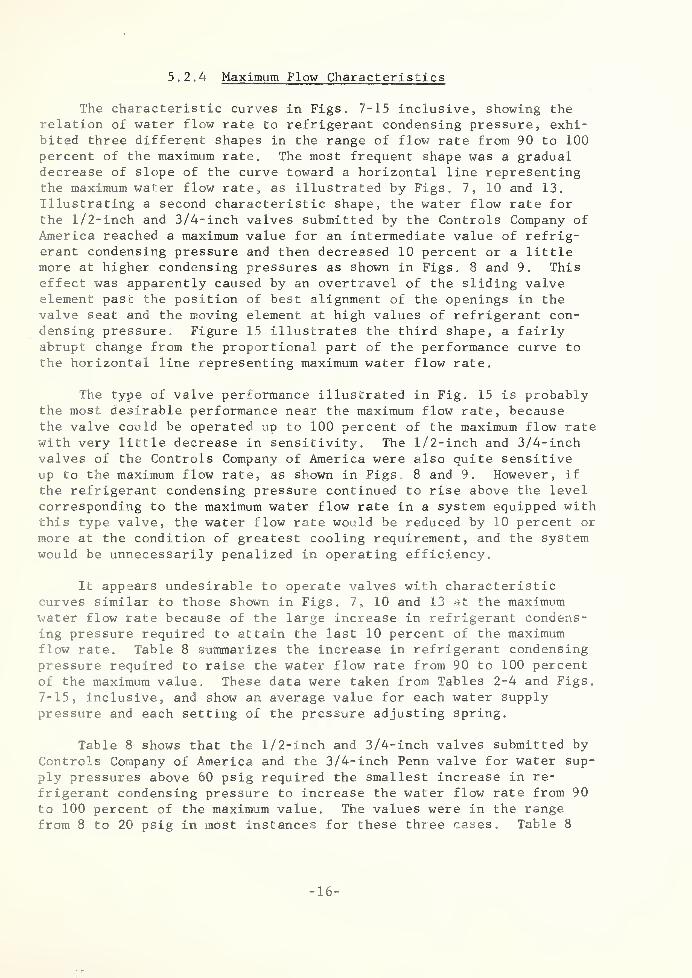
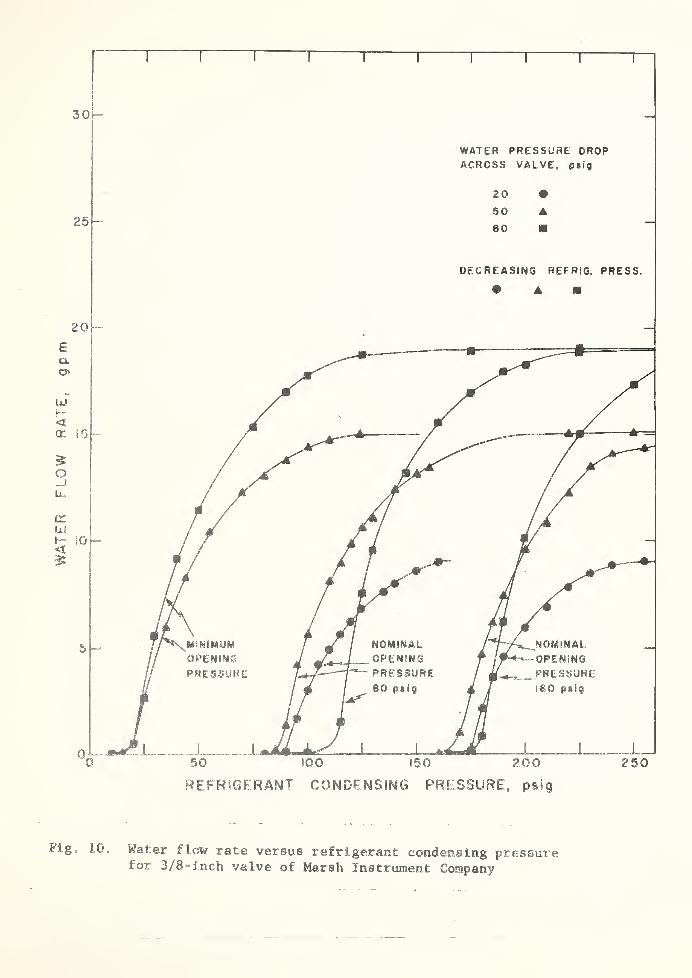
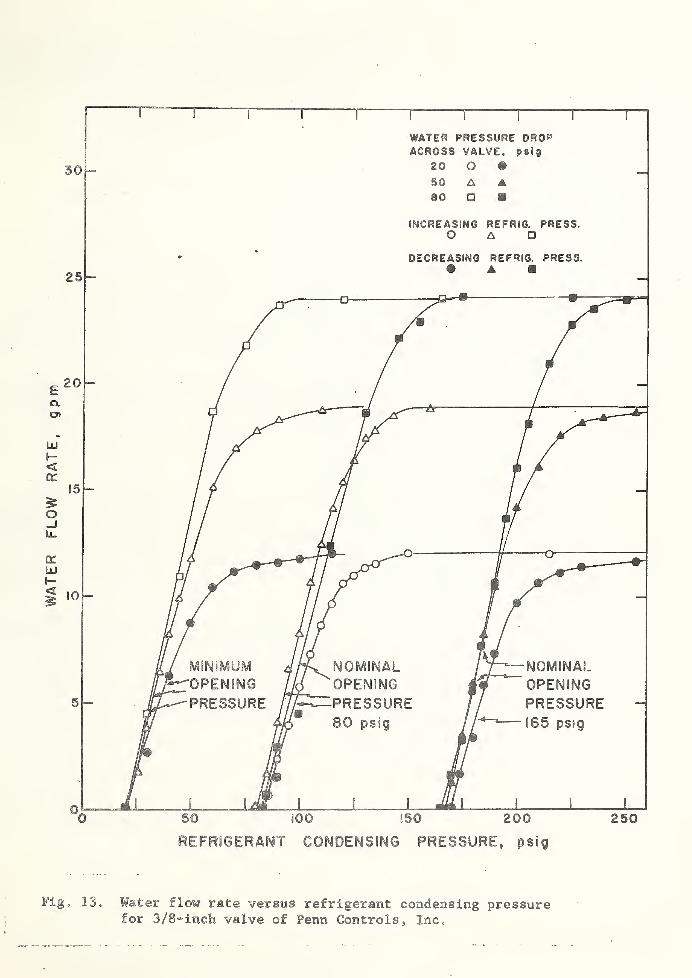
The characteristic curves showing the relation between water flow rateand refrigerant condensing pressure near shutoff exhibited three distinctshapes as illustrated most clearly in Figs. 7, 10 and 13, although some otherfigures have similarities to these. In three of the curves in Fig. 7 a defin-ite discontinuity in the characteristic curves occurred at water flow ratesof about 1, 2, and 21/2 gpm, respectively. The valve was less sensitive tochange in refrigerant condensing pressure below these flow rates in thesethree instances, although a similar phenomenon was not evident in every testof this valve.
In Figure 10 the characteristic curve flattened out significantly nearshutoff for several of the tests. In these instances this 3/8-inch Marshvalve permitted a trickle of water to pass until the refrigerant condensingpressure was lowered well below the value that would be obtained by extrapo-lating the main portion of the characteristic curve. The reason for this
performance was not determined, but it could be caused by foreign matter Onthe valve seat or a slight misalignment of the moving elements.
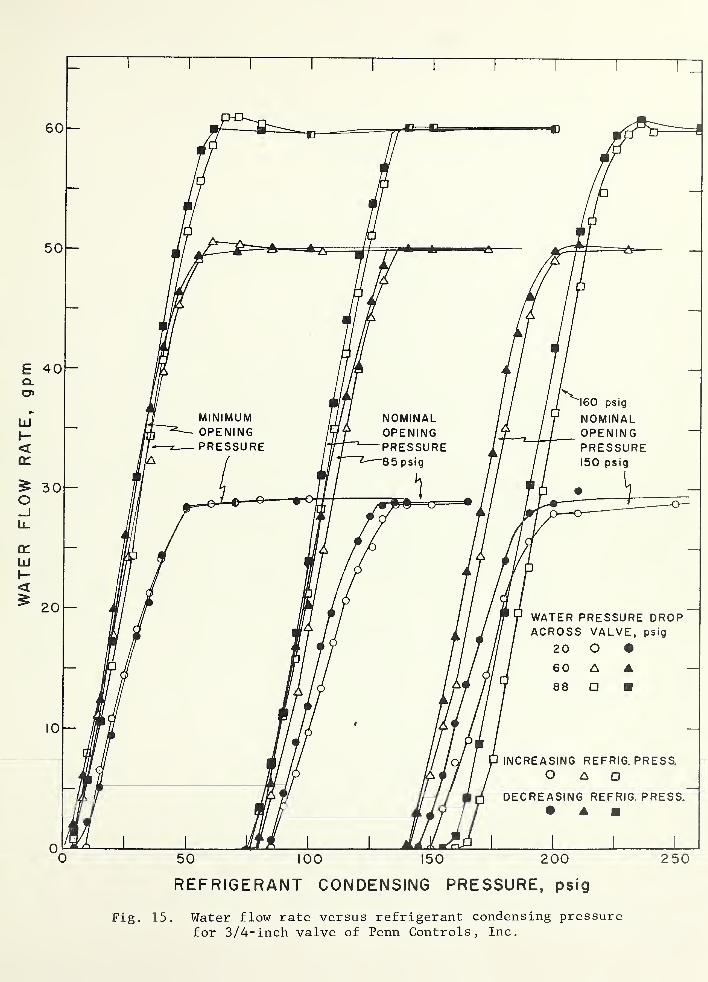
In Fig. 13 the slope of the characteristic curve was maintained essen-
tially constant down to shutoff. Similar results were observed in sometests of the 3/4-inch Penn valve, as illustrated in Fig. 15.
The shape of the characteristic curve near shutoff is important withrespect to water leakage through the valve when the refrigerant unit is not
running. If a water regulating valve has a flattened characteristic curve
near shutoff, the pressure adjustment spring must be set at a higher valuefor any given water temperature to prevent water leakage when the unit is
not running. This causes the refrigerating unit to operate at a higher com-
pression ratio and less efficiently than would be necessary if the waterregulating valve had a steep pressure curve at shutoff.
- 15 -
5.2.4 Maximum Flow Characteristics
The characteristic curves in Figs. 7-15 inclusive, showing therelation of water flow rata to refrigerant condensing pressure, exhi-bited three different shapes in the range of flow rate from 90 to 100
percent of the maximum rate. The most frequent shape was a gradualdecrease of slope of the curve toward a horizontal line representingthe maximum water flow rate, as illustrated by Figs. 7, 10 and 13.
Illustrating a second characteristic shape, the water flow rate for
the 1/2-inch and 3/4-inch valves submitted by the Controls Company of
America reached a maximum value for an intermediate value of refrig-erant condensing pressure and then decreased 10 percent or a littlemore at higher condensing pressures as shown in Figs. 8 and 9. Thiseffect was apparently caused by an overtravel of the sliding valveelement past the position of best alignment of the openings in thevalve seat and the moving element at high values of refrigerant con-densing pressure. Figure 15 illustrates the third shape, a fairlyabrupt change from the proportional part of the performance curve to
the horizontal line representing maximum water flow rate.
The type of valve performance illustrated in Fig. 15 is probablythe most desirable performance near the maximum flow rate, becausethe valve could be operated up to 100 percent of the maximum flow ratewith very little decrease in sensitivity. The 1/2-inch and 3/4-inchvalves of the Controls Company of America were also quite sensitiveup to the maximum flow rate, as shown in Figs. 8 and 9. However, if
the refrigerant condensing pressure continued to rise above the level
corresponding to the maximum water flow rate in a system equipped withthis type valve, the water flow rate would be reduced by 10 percent or
more at the condition of greatest cooling requirement, and the systemwould be unnecessarily penalized in operating efficienc}/.
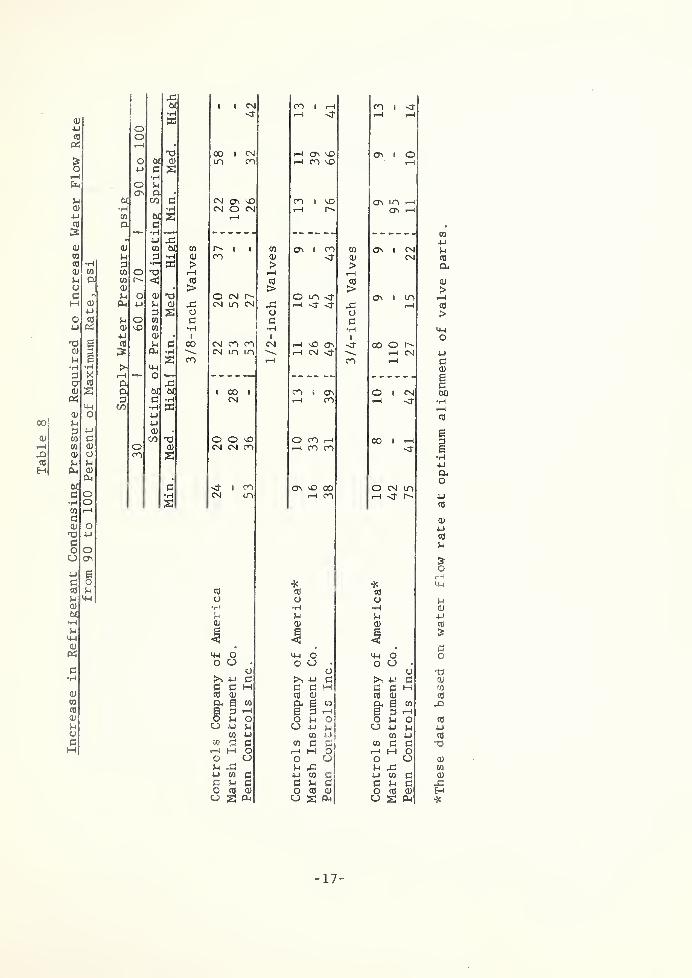
It appears undesirable to operate valves with characteristiccurves similar to those shown in Figs. 7, 10 and 13 at the maximumwater flow rate because of the large increase in refrigerant condens-ing pressure required to attain the last 10 percent of the maximumflow rate. Table 8 summarizes the increase in refrigerant condensingpressure required to raise the water flow rate from 90 to 100 percentof the maximum value. These data were taken from Tables 2-4 and Figs.
7-15, inclusive, and show an average value for each water supplypressure and each setting of the pressure adjusting spring.
Table 8 shows that the 1/2-inch and 3/4-inch valves submitted by
Controls Company of America and the 3/4- inch Penn valve for water sup-
ply pressures above 60 psig required the smallest increase in re-
frigerant condensing pressure to increase the water flow rate from 90
to 100 percent of the maximum value. The values were in the rangefrom 8 to 20 psig in most instances for these three cases. Table 8
- 16 -
Increase
in
Refrigerant
Condensing
Pressure
Required
to
Increase
Water
Flow
Rate
from
90
to
100
Percent
of
Maximum
Rate,
psi
-G0E 0 0 CM CO 1 rH co g
•H <t 7—1 7—
1
7—
ooT”H •
-o 00 0 CM rH O' MO ON 0 Oo Of cu LO CO rH CO MO4J G e
4-1 -Ccu CO w w o- 0 8 CO CTn 1 co CO O' o CMG G •H cu CO cu D CMG °r— 3J > > >03 o t—
1
T—
1
7—1
03 < G cO cacu • > > >5-i o <U T3 o CM o- O LO Ht O'n 0 LOPG 4-1 5-4 CU -C Csl in CM rG rH <t -C rH
G E u O uG o CO G c cCU MO CO •H •H4-J cu § 1 8
CO 5-1 G 00 CM CO co CM rH NO ON 00 o3 P-1 *r4 \ 04 in uo \ 7—1 CN <fr 7—
1
CME CO rH CO 7—1
4-1
c—
H
•»a» o — a. — —a -Ca bC ot 8 00 0 CO 3 CTn o 0 CMG c •H CM s—
1
CO rHCO •H X
-U4-J
cu 0
CO T3 o o M5 o co rH 00 0 1“
1
O CU CM CM CO rH co COco E
c 8 CO on nO 00 o CM m•H CM LD I—
1
co rHE
* *CO co CO
o o o•H •rl •iH
G 5-4 )-i
CU'
1CU CU
14-4 o 4-1 o 4-4 Oo u • O u • o u •
u CJ oPo 4J G Po 4—1 c P^ 4-» Gc c M G G H H c Mg CD G CU G CJa e CO C4 6 CO a e CO
s G r—
1
6 G rH| 6 G 7—4
o 5-i o o 5-< o o G oa 4J !-i o •u G o 4-» GCO u CO U CO 4->
CO r* c CO c CO G c7—1 M o r-H M O rH M oo u o CJ o o5-4 „G 5-i -C G -G4J CO G 4-1 CO G 4J CO Gc 5-4 G c G C c G Go G cu o G cu o G cuu E P-i u E a u E Ph
w4-1
GItf
aa)
>r—
I
g>
4-1
O
GCU
00
G
S3
ao
CO
cu
uCO
G
&orH
4-
1
5-
4
CU
4-1
CO>
GO
"GCU
CO
CO
Jb
CO
uCO
to
<u
CO
CU
-CH*
17
shows several instances where the required increase in condensing pres-
sure was in the range from 60 to 110 psig. An examination of Figs. 7-
15 shows that these unusually high values corresponded to situations
where substantially 100 percent maximum flow rate was obtained with a
more moderate rise in refrigerant condensing pressure, but there con-
tinued to be a slight increase in water flow rate for greater increases
in condensing pressure, perhaps caused by an increased elastic deforma-tion of some of the moving parts other than the springs. Most of the
values of pressure increase in Table 8 for all the 3/8-inch valves and
for the 1/2-inch Marsh and Penn valves were in the range from 20 to
55 psig.
5.2.5 Hysteresis on Reversal of RefrigerantCondensing Pressure
Data were obtained on each of the 1/2- inch and 3/4- inch valves forboth increasing and decreasing values of the refrigerant condensingpressure in the range from shutoff to maximum water flow rate. The re-sults for increasing and decreasing refrigerant condensing pressure aredifferentiated in Figs. 8, 9, 11, 12, 14 and 15 by using open and closedsymbols, and are also tabulated separately in Tables 2-4, inclusive.
An examination of the data in Tables 3 and 4 shows that the sensi-tivity factor and the change in refrigerant condensing pressure requiredto change the water flow rate from 10 to 90 percent of the maximum flowrate was comparable for increasing and decreasing values of refrigerantcondensing pressure. The variation in sensitivity factor and AP (10 -
90?/ flow) for increasing and decreasing refrigerant condensing pressureswas 10 percent or greater in 10 cases out of 43 cases where comparisonswere possible, and was less than 10 percent for the other 33 test con-ditions .
An examination of the difference in refrigerant condensing pressureat 90 percent maximum water flow rate for increasing and decreasing val-ues of refrigerant condensing pressure in Tables 3 and 4 shows that this
difference was negligible for the 1/2-inch and 3/4-inch Marsh valves,it averaged from 4 to 6 psig for the two Penn valves of the same nominalsize, and it averaged 9 to 10 psig for the same size valves submittedby Controls Company of America. These pressure differences representthe smallest change in refrigerant condensing pressure, produced by a
change in refrigerating load or a change in the condensing water tem-
perature, that would cause a readjustment cf the valve position and a
change in water flow rate.
The greater hysteresis in the valves of the Controls Company of
America may have been due to the design of the valves in which slidingfriction between the valve seat and moving element was involved in
- 18 -
every change in valve position, whereas in the other two makes the valvewas of a globe type in which the turbulence of the water flow would helpto overcome static friction in repositioning the moving valve element.The importance of the hysteresis may be judged by the fact that the
product of the pressure change required to change the valve positionand the sensitivity factor for the valve indicates how much the waterflow rate may depart from a design value. For example, a valve with a
pressure hysteresis of 10 psig and a sensitivity factor of 0.5 could be
using 5 gpm more water than required for limited periods of time whenthe refrigerant condensing pressure was fluctuating.
5.2.6 Effect of Supply Water Pressureon Valve Performance
A review of Table 5 shows that the sensitivity factor of all thevalve specimens increased for increased supply water pressure, but notalways throughout the whole range of water pressure. The decrease in
refrigerant condensing pressure required to change the water flow ratefrom 90 percent maximum to shutoff also increased somewhat with in-
creasing water supply pressure as shown in Table 6. The differencebetween opening and closing pressures for the 1/2-inch and 3/4-inchvalves of the Controls Company of America increased with supply waterpressure in most instances, and for the Penn valves at some test con-
ditions .
The sensitivity factor increases with water supply pressure becausethe outlet water pressure was maintained constant for the tests and, as
the data in tables 2-4 show, the refrigerant condensing pressure re-
quired to obtain 90 percent maximum flow rate was only slightly affectedby supply water pressure. Thus the numerator of the ratio A Q/AP, de-
fining the sensitivity factor, increased with increasing supply waterpressure while the denominator remained nearly constant.
The greater changes in refrigerant condensing pressure required to
move the valve between two fixed positions as the supply water pressure
was increased are probably related to the greater water pressure differ-
ence across the moving element of the valves, which caused greater slid-
ing friction in the case of the specimens submitted by the Controls
Company of America and greater direct resistance to closure of the other
two makes of valves.
- 19 -
I. ;
6 . 0 Comparison of Valve Performancewith Military Standard Requirements
The requirements in the proposed Military Standard, summarizedin the Introduction, are interpreted to mean that water-regulatingvalves for refrigerant condensers of 3/8-inch, 1/2-inch, and 3/4-inchpipe size should provide water flow rates of 6, 10, and 25 gpm, res-pectively, with an increase in refrigerant condensing pressure notto exceed 25 psi above a valve-opening condensing pressure of 101.55psig for a water pressure drop of 25 psi between valve inlet and out-let .
The maximum water flow rate corresponding to a water pressuredrop of 25 psi between inlet and outlet of the test specimens can bedetermined from Figs. 5 or 6. These values are summarized in Table 9
for comparison with the requirements stated in the proposed MilitaryStandard. It will be seen in Table 9 that the maximum water flowrates ranged from 125% to more than 200% of the requirement for the3/8-inch valves, averaged about 200 percent of the requirement forthe 1/2-inch valves, and ranged from about 115 percent to 150 percentfor the 3/4-inch valves.
If the valves were rated at 90 percent of the maximum flow rateto avoid low sensitivity near the wide open position, as discussedearlier in this report, three of the specimens would have less than
17 percent excess capacity and the other six specimens would havefrom 30 to 100 percent excess capacity. The water flow rates cor-
responding to 90% maximum are also shown in Table 9 for comparisonwith the proposed Military Standard requirements.
The rise in refrigei'ant condensing pressure required to obtainthe water flow rates specified in the proposed Military Standard for
the various size valves with a water pressure drop of 25 psi is shownin Table 10. These valves were obtained from the performance curvesin Figs. 7-15 by interpolating between the data for the low and mediumvalues of water supply pressure and between the medium and high set-
tings of the pressure adjusting spring. It was found that the risein refrigerant condensing pressure required to obtain a given percent-age of maximum water flow rate, i.e. a given fraction of maximumvalve opening, varied only a little with water supply pressure, and
with the setting of the pressure adjustment spring. Thus, the inter-
polation involved only small deviations from observed data. In a fewcases, extrapolation was necessary because the observed data did not
bracket the specified water pressure difference of 25 psi or the
specified valve opening pressure of 101.55 psig.
- 20 -
;:.v v~
XdCO
XccO
faC/3
>dce
fa
fa
5X<U
>d<u
co
M3oCMO
*doCO
•HdSO
ro
<2 Xd
5c C/3
o
X sca
a w0)
4-J 0»
d 6CU
<j od d0)
Oh
in<r
in
ooo
r-'-
O'Ml-
O''d
-
ONsO
s£>
00
Z o •d dOl co d H CO co
CU
aCU d 3
CU d d >d* m m M3 cu <Ud eg d a • • « id X) XM3 fa H3 cu 00 CO rM CM •d M3 d 0)CO cu CU fa T—
1
CM CO CO CO Q dH S > d fa H O uo d eg CUrH CU fa JZ m d rHfa co CO a uo CO o CM d cu
dcu d a • • • fa e> cu 00 CM On O' ad <U fa pH pH CM oo a<y d d “dco co •d XM3 fa M3 co coo CO 8 m cn Mf d a- £ d fa • • • cu
CO a o cO 00 ON 00 CM X 6^u 3 id a pH CO d od a fa O O'01 •H ua X d < dcu « <U • • *Hd a d fa a 00 CO id CU 00 CO•H cO o a • • . > •d fa3 3 00 vO 00 sO id d facr o c_> pH CM co fa <<<y o' C_) > CU
d•H
CU
co
•Hfa
cu
d CU
3 dCO CO
CO fa0)
d sfa o
fH00 fad•d dCO cu
d dcu CO
S 3O XO CU
d• *d
00 3•d CTd CU
fa fa<U
fa d•H
d co
•d dd
cu <CO
•d ofa d
XIdco
co X dco d & d(U CO O CU
d d id afa C/3 fa <U
dd >» d •H0) d CU 3fa <0 d Dco d CO a!
* id aid
fa
d •do aX0) <U
CO > <u
CO rH NCQ (0 •d
* > C/3
•dCO
fa
CO
fa
CO
fa
CO
fa
I00
CMMt
mm co
•d CMCO sOfa
O'sD
on-
sQO'CO
MfMf
M3 CMCM
mco
CMCO
oMt
CMm
O'mMOCM
comt
nO mCM
oo
co
CM MT
00
- 21 -
*Based
on
water
pressure
difference
of
25
psi
between
inlet
and
outlet
of
valve
and
opening
refrig-
erant
condensing
pressure
of
101.55
psig.
:*
vi
The data in Table 10 indicate that the rise in refrigerant con-densing pressure required to produce the specified water flow rateswas 26 psi or less for three of the nine valve specimens, and that it
ranged from 32 to 59 psi for the other six specimens. Thus, for anopening pressure of 101.55 psig, the operating level of condensingpressure would range from about 118 to 161 psig for the various valvespecimens at the required water flow rate.
The rise in refrigerant condensing pressure required to obtain90 percent of the maximum water flow rate for each valve with a waterpressure difference of 25 psi and a valve opening pressure of 101.55psig is also shown in Table 10. These pressure increments ranged from39 to 70 psi for the nine valves, indicating that undesirably highoperating pressures would occur in attempting to use 90 percent of
the maximum capacity of the valves.
7 . 0 Mechanical Performance of Valve Specimens
Some difficulties with chattering and water leakage developed intwo sizes of the Marsh valves during the tests.
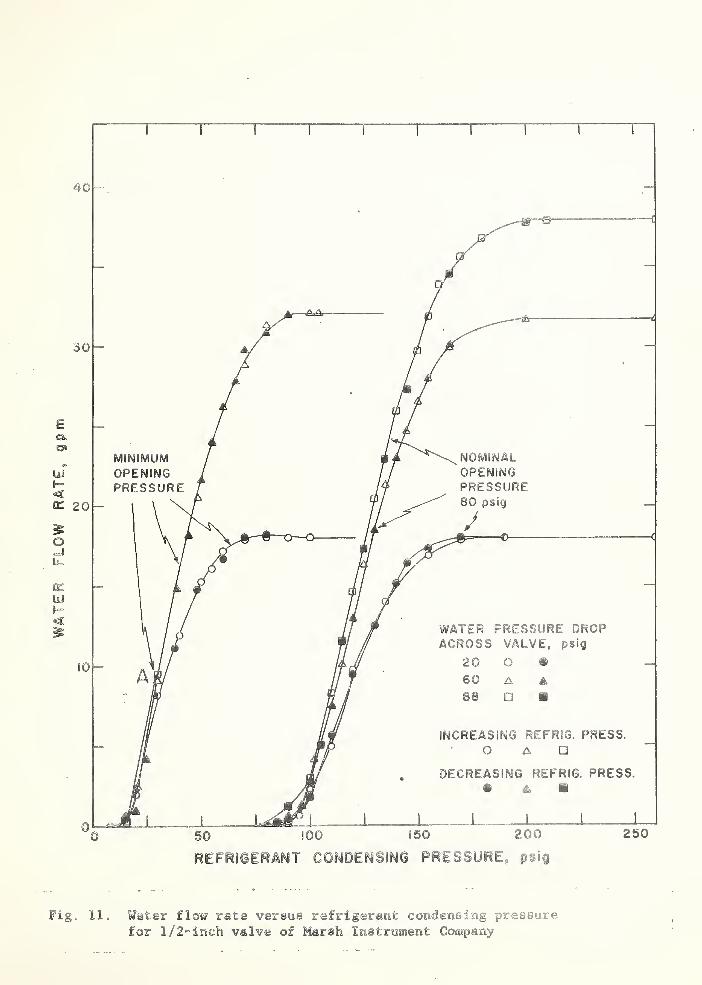
Figure 11 shows the results obtained with the 1/2-inch valvemanufactured by Marsh Instrument Co. The first test runs were madewith a nominal valve opening pressure of 80 psig and with supply waterpressures of 30, 70, and 98 psig, followed in turn by a series withminimum valve opening pressure, with the same three supply water pres-sures. At the test conditions indicated by "A" in Figure 11 with a
minimum valve opening pressure and increasing values of refrigerantcondensing pressure, severe chattering of the valve occurred whichcaused a water leak to develop at one edge of the diaphragm under the
power element assembly and water was discharged to the atmosphere.The tests of this valve were terminated at this time.
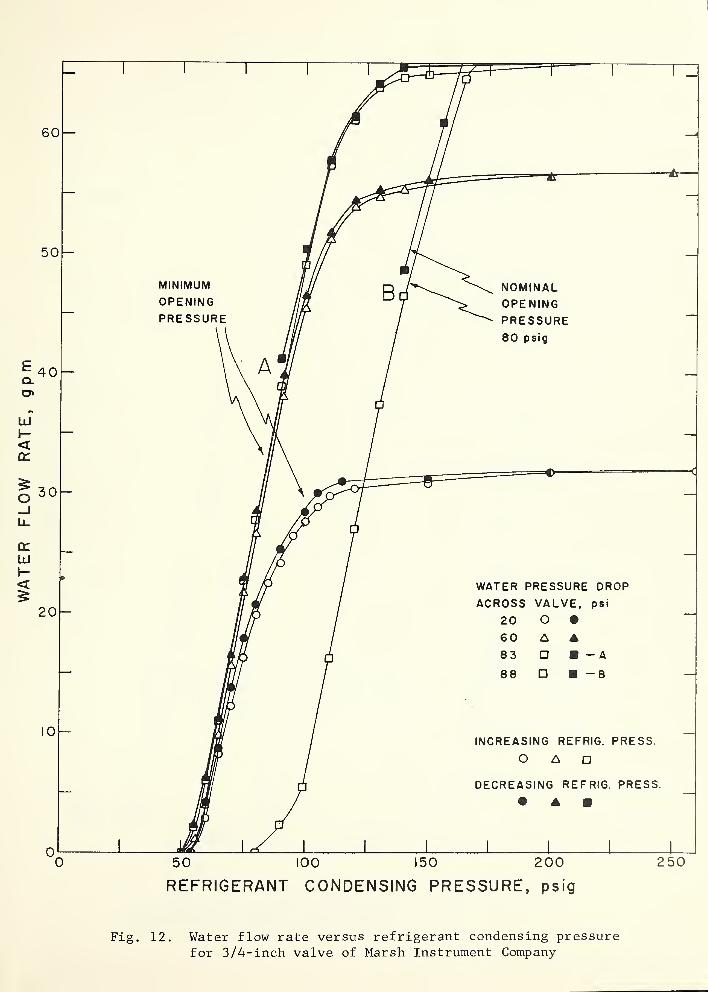
Figure 12 shows the results obtained with two specimens of the
3/4-inch water-regulating valve manufactured by Marsh Instrument Co.
Both specimens developed water leaks after severe chattering in simi-
lar fashion to that described for the 1/2-inch valve from the same
manufacturer
.
Test runs at increasing and decreasing refrigerant pressures weremade with the 3/4-inch valve submitted by the Quartermaster Research
and Engineering Command at the minimum opening refrigerant pressureand at water supply pressures of 30, 70, and 93 psig. While the re-
frigerant condensing pressure was being decreased during the run at
93 psig Supply water pressure, at the conditions indicated by "A" in
Figure 12, the valve chattered causing a water leak to develop. No
further capacity tests were made of this valve. Another valve of the
- 22 -
same make and model was obtained from a commercial supplier in Washing-ton, D.C. During a test run at 98 psig supply water pressure with thevalve set to open at 80 psig refrigerant condensing pressure, this
valve chattered and developed a water leak at the conditions indicatedby "B" in Figure 12. No further capacity tests were made with this
valve. The curve for the second 3/4-inch valve extends above thegraph in Figure 12. It essentially leveled off at a water flow rateof 68 gpm at a refrigerant pressure of 250 psig.
It is not known what caused these three valves to chatter and
develop water leaks in this manner. The chattering apparently pro-
duced dynamic pressures which forced water through the diaphragm seals
at an edge and at the valve stem permitting water to leak out at thediaphragm seal between the power element assembly and the valve body.
The body screws were checked for tightness before each test, but notthe screw and washer on the valve stem. No mechanical damage was evi-
dent when the valves were disassembled after testing. The chatteringoccurred both with and without a booster pump in operation and only at
supply water pressures in excess of 80 psig.
8 . 0 Discussion and Conclusions
The tests described in this report were made to explore the per-formance characteristics of pressure-actuated valves designed to regu-late the flow of cooling water through refrigerant condensers. Commer-cial valves were used as test specimens, but the tests were not in-
tended to be acceptance tests for commercial products.
Supply water pressures of about 30, 70, and 90 psig and valveopening pressures of minimum, 80, and 160 psig were selected for thetests to bracket the probable range of application and use. A con-
stant water pressure at the valve outlet of 10 psig was selected to
simulate the pressure drop of a condenser and associated piping down-stream of the valve, although it was recognized that the pressure dropin any given condenser system would increase approximately as the
square of the water flow rate. The inlet water pressure was also keptconstant at all water flow rates although this condition would onlybe approximated in actual use.
The investigation indicated that the following characteristicsof a pressure-actuated water-regulating valve were of importance in
meeting the functional purposes of such a valve:
(1) The maximum water flow rate of the valve versus water pres-sure drop through the valve.
- 23 -
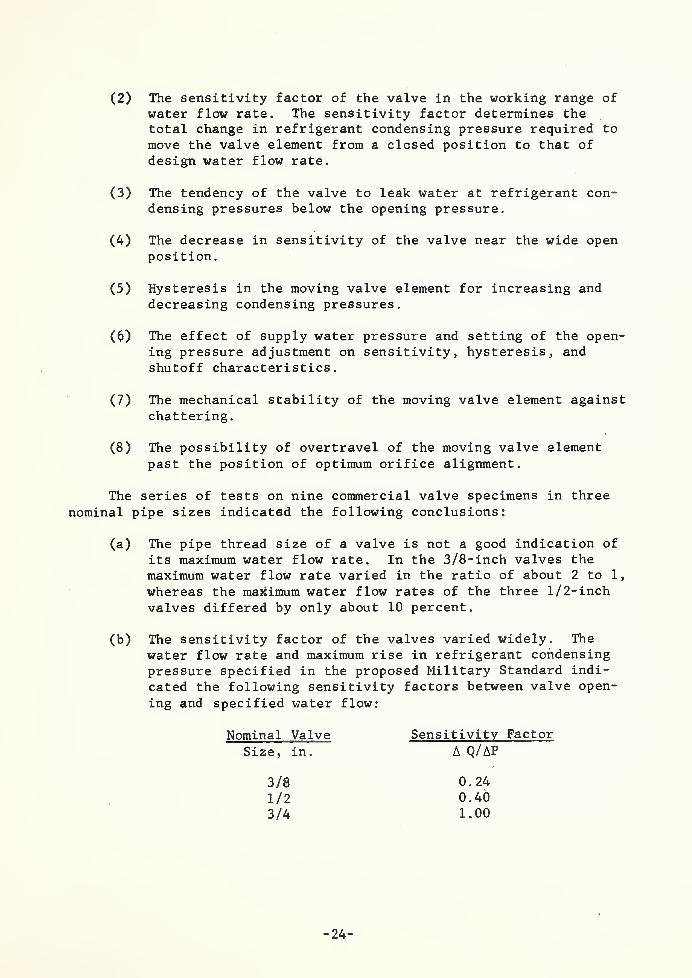
(2) The sensitivity factor of the valve in the working range of
water flow rate. The sensitivity factor determines thetotal change in refrigerant condensing pressure required to
move the valve element from a closed position to that of
design water flow rate.
(3) The tendency of the valve to leak water at refrigerant con-densing pressures below the opening pressure.
(4) The decrease in sensitivity of the valve near the wide openposition.
(5) Hysteresis in the moving valve element for increasing anddecreasing condensing pressures.
(0) The effect of supply water pressure and setting of the open-ing pressure adjustment on sensitivity, hysteresis, andshutoff characteristics.
(7) The mechanical stability of the moving valve element againstchattering
.
(8) The possibility of overtravel of the moving valve elementpast the position of optimum orifice alignment.
The series of tests on nine commercial valve specimens in three
nominal pipe sizes indicated the following conclusions:
(a) The pipe thread size of a valve is not a good indication of
its maximum water flow rate. In the 3/8- inch valves the
maximum water flow rate varied in the ratio of about 2 to 1
,
whereas the maximum water flow rates of the three 1/2-inch
valves differed by only about 10 percent.
(b) The sensitivity factor of the valves varied widely. The
water flow rate and maximum rise in refrigerant condensingpressure specified in the proposed Military Standard indi-
cated the following sensitivity factors between valve open-
ing and specified water flow:
Nominal ValveSize, in.
Sensitivity Factor
A Q/AP
3/8
1/23/4
0.240.401.00
- 24 -
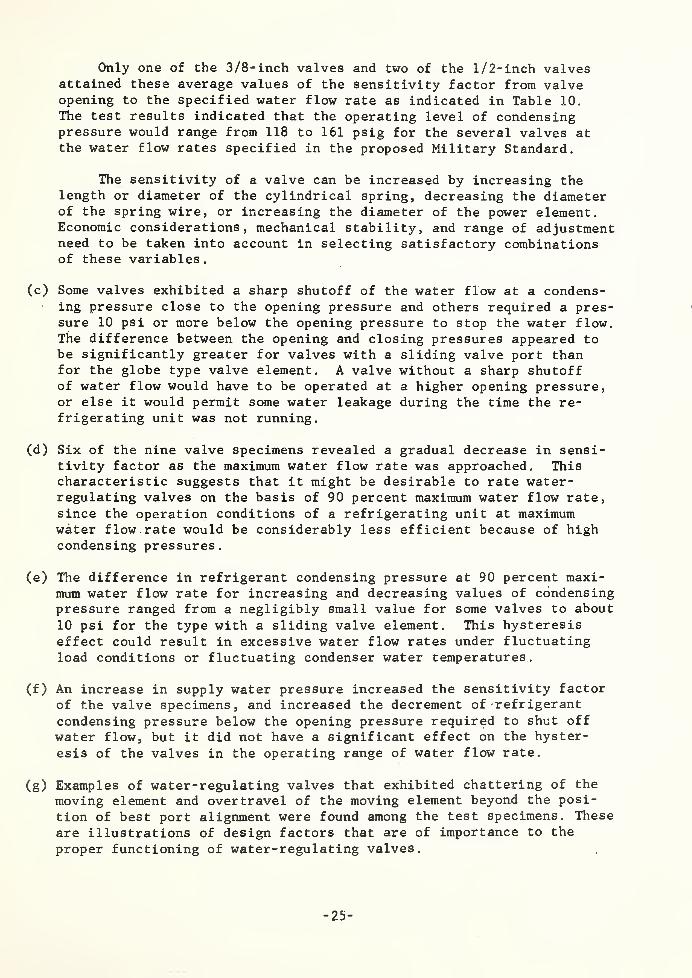
Only one of the 3/8-inch valves and two of the 1/2-inch valvesattained these average values of the sensitivity factor from valveopening to the specified water flow rate as indicated in Table 10.
The test results indicated that the operating level of condensingpressure would range from 118 to 161 psig for the several valves atthe water flow rates specified in the proposed Military Standard.
The sensitivity of a valve can be increased by increasing thelength or diameter of the cylindrical spring, decreasing the diameterof the spring wire, or increasing the diameter of the power element.Economic considerations, mechanical stability, and range of adjustmentneed to be taken into account in selecting satisfactory combinationsof these variables.
(c) Some valves exhibited a sharp shutoff of the water flow at a condens-ing pressure close to the opening pressure and others required a pres-sure 10 psi or more below the opening pressure to stop the water flow.The difference between the opening and closing pressures appeared tobe significantly greater for valves with a sliding valve port thanfor the globe type valve element. A valve without a sharp shutoffof water flow would have to be operated at a higher opening pressure,or else it would permit some water leakage during the time the re-frigerating unit was not running.
(d) Six of the nine valve specimens revealed a gradual decrease in sensi-tivity factor as the maximum water flow rate was approached. Thischaracteristic suggests that it might be desirable to rate water-regulating valves on the basis of 90 percent maximum water flow rate,
since the operation conditions of a refrigerating unit at maximumwater flow rate would be considerably less efficient because of highcondensing pressures.
(e) The difference in refrigerant condensing pressure at 90 percent maxi-mum water flow rate for increasing and decreasing values of condensingpressure ranged from a negligibly small value for some valves to about
10 psi for the type with a sliding valve element. This hysteresiseffect could result in excessive water flow rates under fluctuatingload conditions or fluctuating condenser water temperatures.
(f) An increase in supply water pressure increased the sensitivity factor
of the valve specimens, and increased the decrement of refrigerant
condensing pressure below the opening pressure required to shut off
water flow, but it did not have a significant effect on the hyster-
esis of the valves in the operating range of water flow rate.
(g) Examples of water-regulating valves that exhibited chattering of the
moving element and overtravel of the moving element beyond the posi-
tion of best port alignment were found among the test specimens. These
are illustrations of design factors that are of importance to the
proper functioning of water-regulating valves.
- 25 -
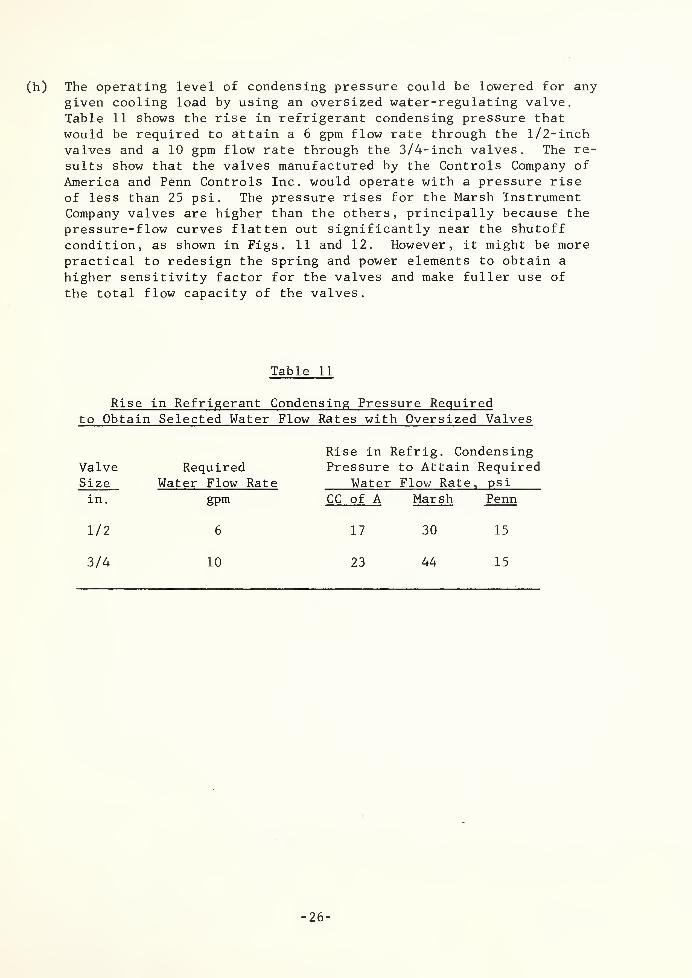
(h) The operating level of condensing pressure could be lowered for anygiven cooling load by using an oversized water-regulating valve.Table 11 shows the rise in refrigerant condensing pressure that
would be required to attain a 6 gpm flow rate through the 1/2-inchvalves and a 10 gpm flow rate through the 3/4-inch valves. The re-
sults show that the valves manufactured by the Controls Company of
America and Penn Controls Inc. would operate with a pressure riseof less than 25 psi. The pressure rises for the Marsh InstrumentCompany valves are higher than the others, principally because the
pressure-flow curves flatten out significantly near the shutoffcondition, as shown in Figs. 11 and 12. However, it might be morepractical to redesign the spring and power elements to obtain a
higher sensitivity factor for the valves and make fuller use of
the total flow capacity of the valves.
Table 11
Rise in Refrigerant Condensing Pressure Requiredto Obtain Selected Water Flow Rates with Oversized Valves
ValveSize
RequiredWater Flow Rate
in
.
gpm
1/2 6
3/4 10
Rise in Refrig. CondensingPressure to Attain Required
Water Flow Rate, psi
CC of A Marsh Penn
17 30 15
23 44 15
- 26 -
9 . 0 Recommendations for Specification Requirements
In the preparation of performance requirements and tests in futureMilitary standards and specifications, this investigation indicates that
the following factors should be considered:
1. Valve sizes should be based on desired water flow rate at ratingconditions with type and size of pipe connections a secondary con-
sideration based on application.
2. The rating conditions should include:
(a) Valve opening pressure,(b) Maximum rise in condensing pressure above opening pressure
to attain required water flow rate,
(c) Inlet water pressure and temperature,(d) Pressure drop across the valve.
3. The water flow capacity of a valve should be based on 90 percent of
the maximum flow rate to avoid use of the zone of low sensitivitylikely to occur near the wide-open position of the valve.
4. Maximum hysteresis effect for increasing and decreasing refrigerantpressures at rated water flow conditions should be specified. Amaximum value of 5 psi is probably reasonable.
5. Maximum difference between opening and closing pressures, at the rat-
ing conditions listed in item 2, should be specified. A maximumvalue of 5 psi is probably reasonable for globe-type valves.
6. The range of conditions under which valve stability, and freedom from
chatter, resonance, and water hammer is required.
7. The required working range of water and refrigerant pressures should
be specified.
8. Safety requirements for strength and freedom from water leakage under
working and test pressures should be included.
9. Sampling and test procedures should be included or referenced.
10.
The requirements of the Military Standard should be referenced in the
specification, if they are applicable.
USCOMM-NBS-DC
- 27 -
Fig. 1. View of three Controls Company ofAmerica water-regulating valves; the 1/2-inchsize is shown disassembled.
MARSH
Fig. 2. View of three Marsh Instrument Co.
water-regulating valves;, the 1/2-inch size
is shown disassembled.
Fig.
3.
View
of
three
Penn
Controls
Co.
water-regulating
valves;
the
1/2-inch
size
is
shown
disassembled
£ 7? 0
Fig.
4.
Diagram
of
apparatus
and
piping
used
for
tests
of
water
regulating
valves.
.
<u
G•Hc
o4-1
•H >X r-4
G Gs >
LO
;
60' -Hfa
PRESSURE
DROP
ACROSS
VALVE,
psi
CO
Cl
LU>_l
<>
COCOocro<
CL
oQCQ
LlI
cc3COCOLlI
cr0-
<u
c•Hc
i-i
oMH
CLoLi
X<13
Li
3w03
<13
Li
aw3 •
to 03
Li N<13 •H> 03
03 <u
LI >m r—
1
Li cfl
>&Or—
1
£>>4-1
XLi <13
<13 a4-1 3tfl o£f Li
00B3 03
B <13
>t-H
cO <0
S >
00•Hp-l
WATER
FLOW
RATE,
gpm
REFRIGERANT CONDENSING PRESSURE, psig
Fig. 7. Water flow rate versus refrigerant condensing pressure
for 3/8- inch valve of Controls Company of America.
REFRIGERANT CONDENSING PRESSURE, psig
Water flow rate versus refrigerant condensing pressurefor 1/2-inch valve of Controls Company of America.
Fig. 8.
WATER
FLOW
RATE,
gpm
REFRIGERANT CONDENSING PRESSURE, psig
Fig. 9. Water flow rate versus refrigerant condensing pressurefor 3/4-inch valve of Controls Company of America.
WATER
FLOW
RATE,
gpm
REFRIGERANT CONDENSING PRESSURE, psig
Mg, 10c Water flow rate versus refrigerant condensing pressurefor 3/8-inch valve of Marsh Instrument Company
Fig. 11. Water flow rate versus refrigerant condensing pressurefor l/2=inch valve of Marsh Instrument Company
WATER
FLOW
RATE,
gpm
REFRIGERANT CONDENSING PRESSURE, psig
Fig. 12. Water flow rate versus refrigerant condensing pressurefor 3/4-inch valve of Marsh Instrument Company
i
.
:.*•y-M
!
-
>
'
•'4
-
WATER
FLOW
RATE
,
gpm
Fig. 13. Water flow rate versus refrigerant condensing pressurefor 3/8-xncfa valve of Penn Controls, Inc.
WATER
FLOW
RATE,
gpm
REFRIGERANT CONDENSING PRESSURE, psig
Fig. 14. Water flow rate versus refrigerant condensing pressurefor 1/2-inch valve of Penn Controls, Inc.
WATER
FLOW
RATE,
gpm
REFRIGERANT CONDENSING PRESSURE, psig
Fig. 15. Water flow rate versus refrigerant condensing pressurefor 3/4- inch valve of Penn Controls, Inc.