ANNUAL REPORT 2009-10 National Bureau of Soil Survey and Land Use Planning (I.C.A.R.), Nagpur - 440010 ` q jk”Vªh¸k enk los{ Z k.k ,o a Hkwfe mi;k¢x fu;kstu C;wjks ¼Òk-Ñ-vuq-i-½] ukxij &440010
Transcript
ANNUAL REPORT 2009-10
National Bureau of Soil Survey and Land Use Planning (I.C.A.R.), Nagpur - 440010
HET National Bureau of Soil Survey and Land Use Planning (ICAR), Nagpur, in continuation of its journey for inventorising natural resources for land use
planning with special reference to soils, focused on soil survey and mapping activities at the levels of village, block, watershed and district during 2009-10.
The institute is also engaged itself in two research programmes of the National Agricultural Innovative Project (NAIP). The first one is on developing a georeferenced soil information system in two most important food growing zones of the country, namely, the Indo-Gangetic Plains and Black Soils Region (under Component 4) and is first of its kind ever undertaken in the country and the other is on addressing livelihood issues in selected clusters of villages in three disadvantaged districts of Maharashtra (under Component 3).
The year has been especially significant for the institute in that it was involved in three important network projects, two of them being intra-institutional, involving the HQrs. and all the regional centres. The projects are namely, district level land use planning and improvising methods for soil survey and its interpretation for land evaluation. The latter will bring uniformity in the methods of inventorising natural resources. Besides, the institute HQrs. also worked as a cooperating centre in the ICAR network project on climate change, its influence in agriculture.
The present report briefly mentions the research achievements of this institute in the fields of soil survey and mapping, remote sensing and GIS, pedology, soil carbon, land evaluation and land use planning.
As many as 42 research papers were published including a few in international journals. Besides, 31 book chapters, 9 research bulletins and soil survey reports were also published. In recognition of outstanding research contributions, a number of scientists were honoured by various professional bodies.
The institute was actively involved in human resource development through imparting training in soil survey as well as deputing its staff for various training programmes and conducting teaching and research programmes for M.Sc. and Ph.D. students of different State Agricultural Universities.
Preface
I acknowledge the sincere efforts put in by my staff in achieving the work target. I also compliment the members of the Editorial Committee for bringing out the report in time.
I take this opportunity to put on record the overwhelming support received from the ICAR in accomplishing our target.
It gives me immense satisfaction in placing the Annual Report (2009-10) for public scrutiny.
(DIPAK SARKAR)DIRECTOR
July, 2010
Nagpur
ANNUAL REPORT 2009-10
National Bureau of Soil Survey and Land Use Planning (I.C.A.R.), Nagpur - 440010
Divisions/Sections/Unit 2.1 Division of Land Use Planning 52.2 Division of Remote Sensing Applications 92.3 Division of Soil Resource Studies 152.4 Geographical Information System (GIS) 312.5 Cartography Section 36
5. Section and Unit5.1 Technical Cell 1665.2 Library and Documentation Unit 1665.3 Printing Section 1685.4 Publication Sale Unit 1695.5 ARIS Cell 1725.6 fgUnh vuqHkkx 173
6. Awards and Recognitions 1757. Publications 1768. Participation of scientists in conferences, meetings, workshops, 184
Symposia etc. in India and abroad9. Approved on-going projects 18710. Consultancy, patents, commercialisation of technology 19211. Meetings 19312. Workshops, Seminars, Farmers’ Day and other events 19413. Distinguished Visitors 19614. Personnel (Managerial Position) 198
As a part of natural resource management studysoil survey, soil classification, correlation and mappinghas been the major thrust areas of work both atHQrs., Nagpur and other five regional centres.Utilization of soil survey data sets for land evaluationand land use planning received a focused attention withthe initiation of a network project of the instituteinvolving many scientists at HQrs. and regionalcentres. Besides NBSS&LUP is also addressing thecontemporary issues of climate change and itsinfluence in soil carbon and its sequestration and alsocrop yield. Such effort find more value due to theapplication of computerized models on soil carbon andcrop yield. The other burning issues addressed byNBSS&LUP are revision of agroclimatic zoneboundaries, soil degradation and livelihood security offarmers through the modern technologies of remotesensing and GIS. Bureau is also involved indisseminating state-of-art information to post-graduatestudents of M.Sc. and Ph.D. (Land ResourceManagement) from Dr. PDKV, Akola. The staffs of thisinstitute were also deputed for various trainingprogrammes to improve their skills and technicalknowledge.
Research Highlights
Soil Survey and Mapping : Soil survey for differentdistricts, blocks, villages and watersheds were carriedout during 2009-10 to generate various soil andthematic maps.
• Soil database of Yavatmal district on 1:50,000 scalewas generated. In total 28 soil series were identified
Executive Summary
representing the soil orders of Vertisol, Inceptisoland Entisol.
• The soils of Jabalpur district were correlated. Total42 soil series were identified in 23 physiographicunits. The soil map was generated with 21 soilseries association.
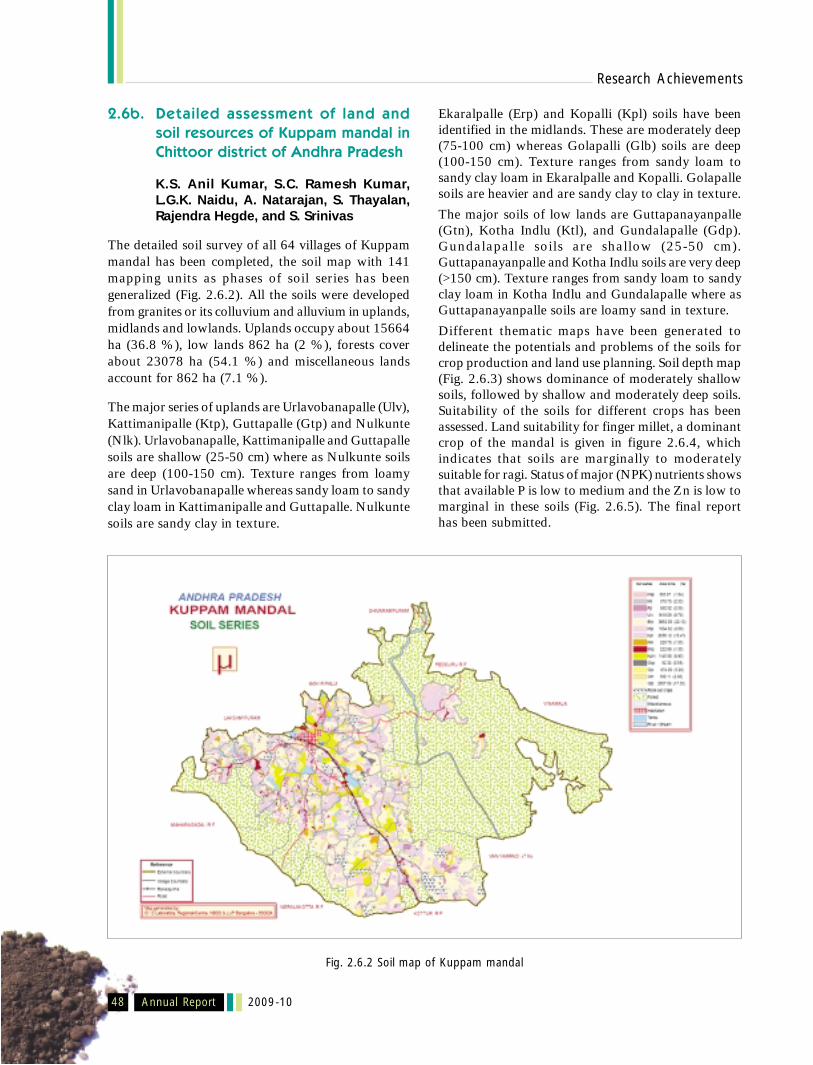
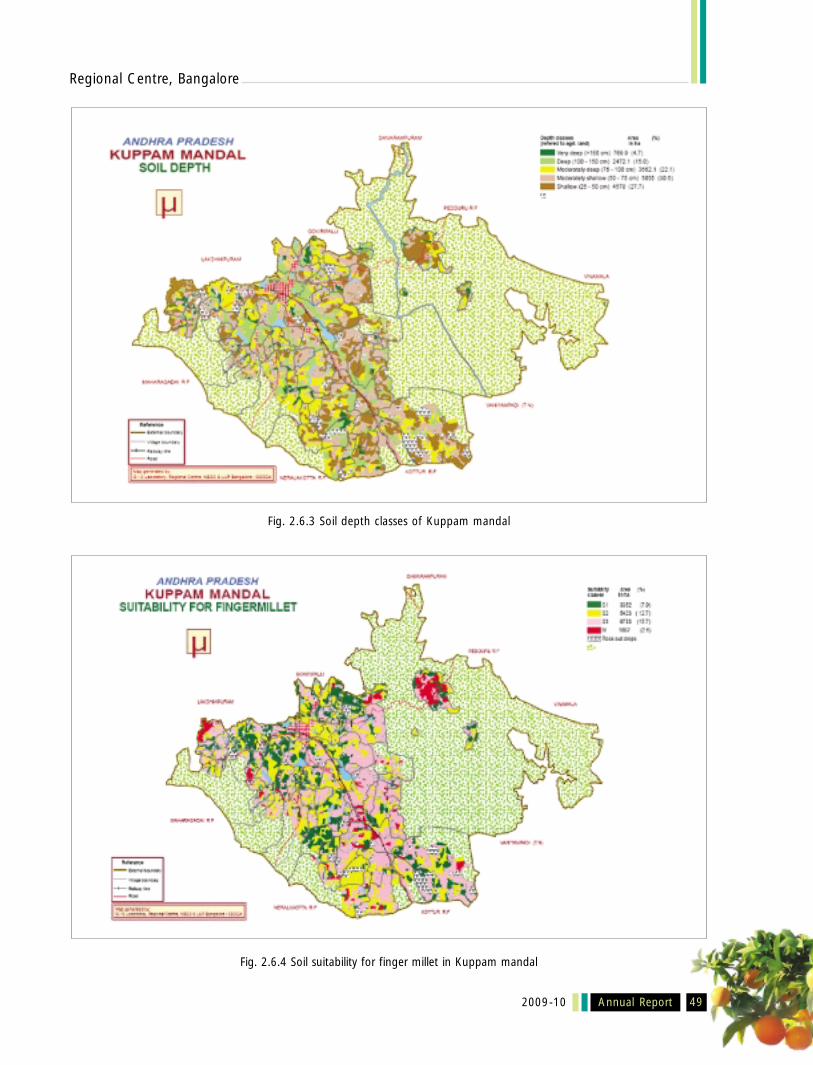
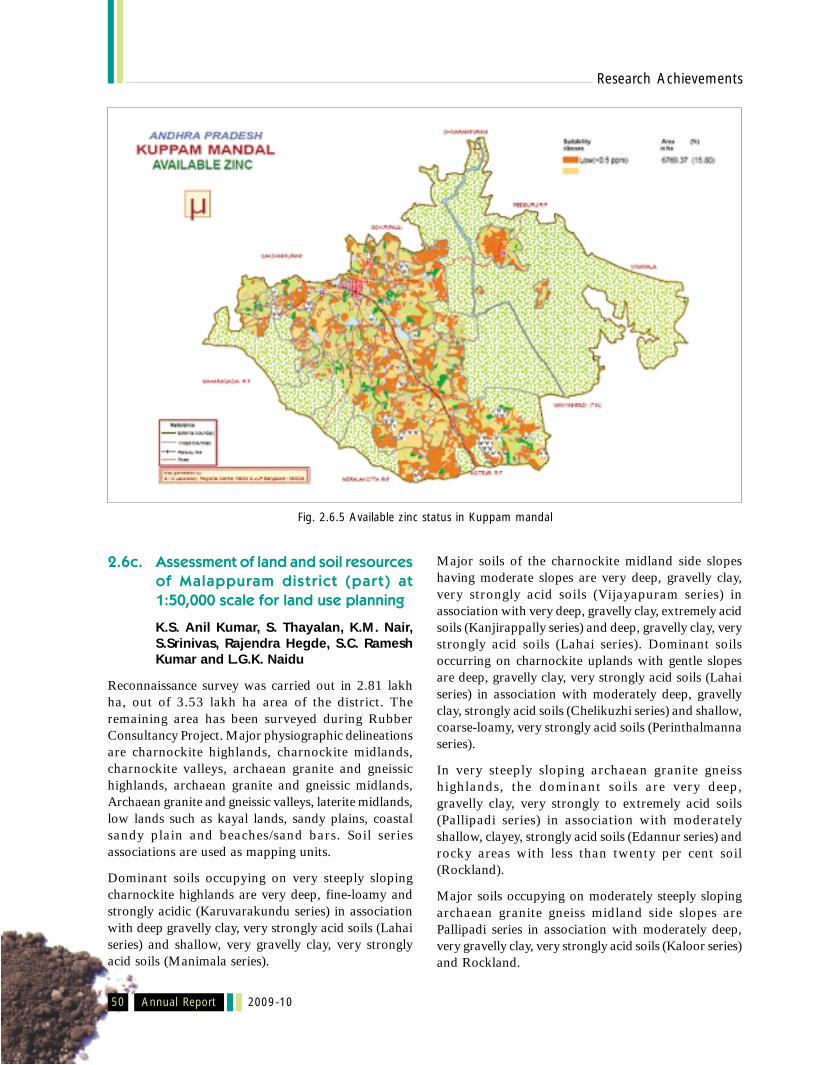
• Detailed soil survey of 64 villages of KuppamMandal was completed. Soil maps were developedshowing 141 phases representing 14 soil series.Nutrient status shows that available P is low tomedium, whereas Zn is low to marginal in thesesoils.
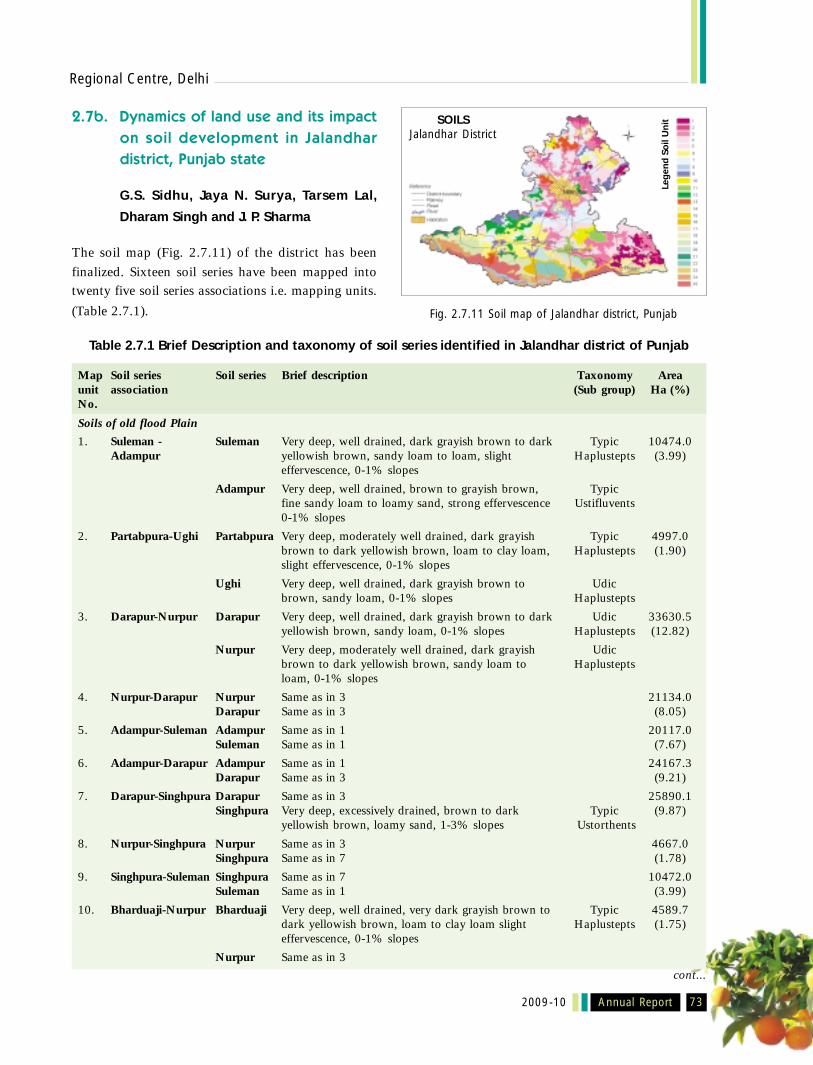
• Total 2.624 lakh ha area was surveyed forJalandhar district, Punjab. In total 16 soil serieswere identified to finalize the soil map.
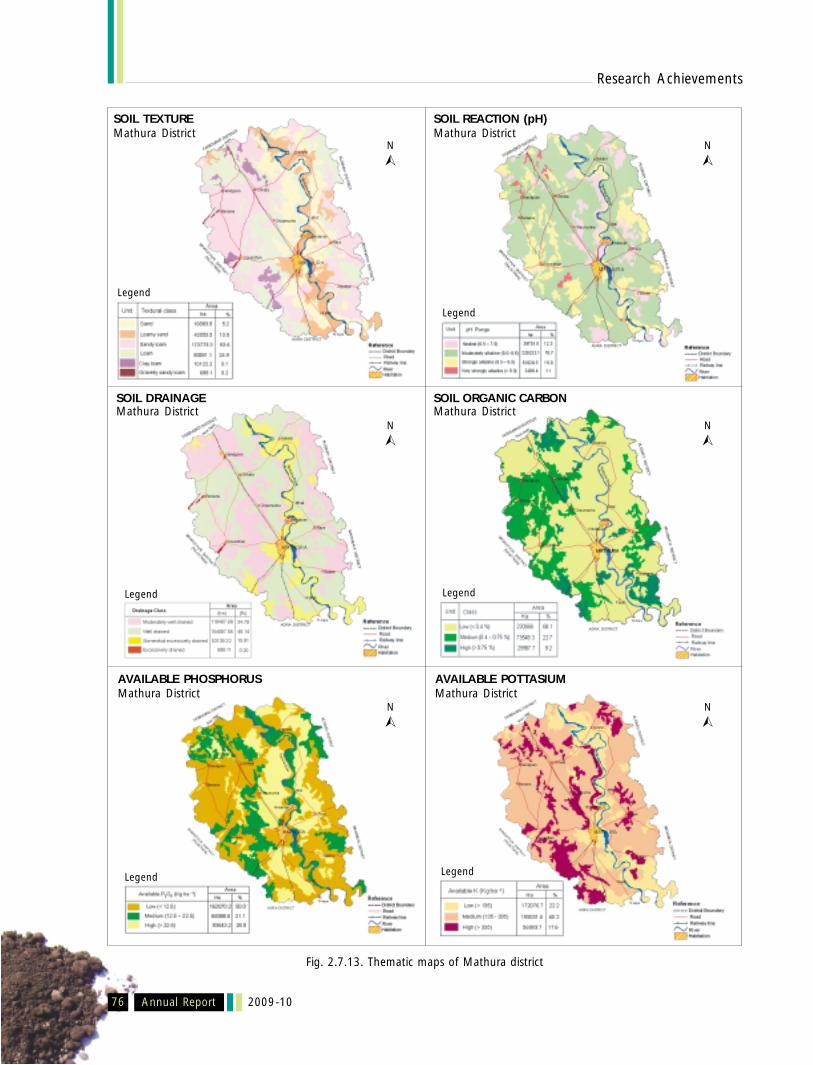
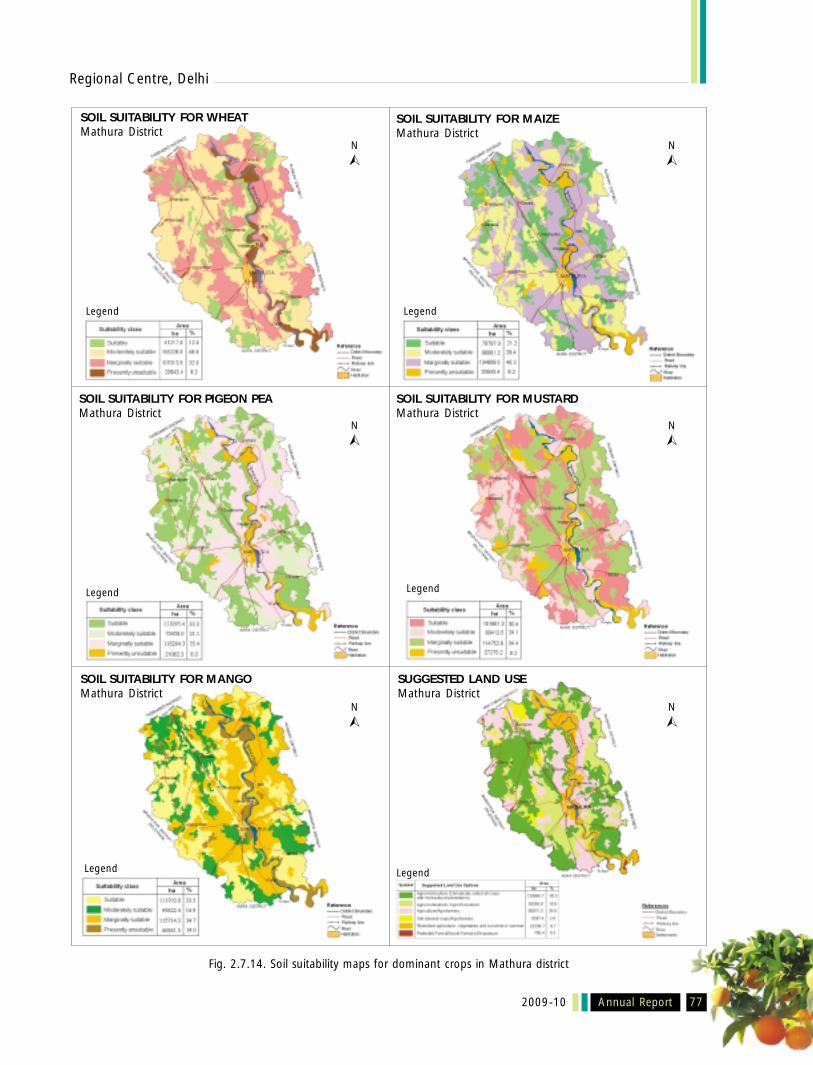
• Nearly 3.33 lakh ha area was surveyed forMathura district, Uttar Pradesh for perspectiveland use planning. About 50% area of the districtfalls under low soil P category. Available K in soilsis medium to high. Suitability of major crops wasworked out for the district.
• Detailed soil survey of Dholi microwatershed wascarried out for the lower reaches of a few selectedvillages. The univariate statistical results showedthat soils under paddy had higher pH than adjacentsoils under forests and tea.
• Kamrup district, Assam was surveyed and 40 soilseries were identified to finalise the soil map in 33soil series association.
Annual Report 2009-10
Executive Summary
viii
Detailed soil survey has resulted in identifying 5 soilseries. The information on natural resources will beutilized to address the major objectives of value chainfor coconut fibre and its byproducts to enhanceeconomic returns to farmers.
• To provide a common methodology for cadastraland block level survey a network project wasundertaken simultaneously at all the six sites of theBureau. The study areas identified are Labhamajrablock, Haryana (Delhi Centre), Chikka-aninakereLboli, Karnataka (Bangalore Centre), Tuli watershed,Nagaland (Jorhat Centre), Badua watershed, Bihar(Kolkata Centre), Parseoni block, Maharashtra(Cartography Unit, Nagpur) and part of Dungletehsil, Rajasthan (Udaipur Centre).
• Thematic maps of the contaminated sites inMorigaon, Dibrugarh and Tinsukia districts ofAssam were developed to assess heavy metalpollution. The study areas were affected due tocoal mining effluents, oil refinery, paper mills andfertilizer effluents.
• Soil information of 353 soil profiles of BSR in termsof physical, chemical, microbiological propertiesof soils in different terrains in Soil and Terraindatabase.
• As a part of soil quality monitoring the hotspotsof 13 BSR and 14 IGP benchmark sites wererevisited and resampled for analyzing soil parameters.
Soil Genesis and Correlation
• Geomorphological studies in Bengaluru districtshows that a close relationship exists betweenlandform position and the soil parameters on a toe
slope sequence at right angles to the contour fromthe waxing crust to the waning valley floors.
• The pedotransfer functions (PTFs) were developedto relate saturated hydraulic conductivity and othersoil variables such as clay, ESP and SAR. Statisticaland neural PTFs were derived to estimate bulkdensity. The best functioning PTF (input sand, silt,fine clay and permanent wilting point) showed thelowest RMSE (root mean square error) (0.01), MAE(maximum absolute error) (0.01), and the highestdegree of agreement (0.95) and R2 (0.83) values.Predicted variables such as silt, clay, pH, organiccarbon, CaCO3, ESP, EMP, ECP, Exch. Ca/Mg wereselected to develop a few other PTFs based on thecause and effect relationships for the shrink-swellsoils of central India. Correlation coefficient (r) ofsand showed significant positive correlation withderivative soil reflectance at all the wavelengthswith some exception. This is in sharp contrast withsilt and clay samples of soils in Nagpur district,Maharashtra. Calibration models for predicting soilproperties from soil reflectance dataset weredeveloped.
• Historical soil-climate-crop data bank for the Indo-Gangetic Plains (IGP) was developed to help in fine-tuning the existing management intervention forthe National Agricultural Research System. Thedatasets discount role of soluble Ca2+ ions and thepresence of CaCO3 in preventing the movementand the accumulation of clay particles. Theformation of impure clay pedofeatures andpedogenic carbonates are identified as twosimultaneously occurring pedogenetic processes insoils of the IGP which may be accepted as anexample of pedogenic threshold in both dry andwet climates since the last 5000 year B.P.
Soil survey and mapping (with areas) accomplished during the time period as shown below:
Sr. No. State (District) Watershed/Farm/Village Scale of mapping Area surveyed (ha)
7. Kerala (Thiruvananthapuram) Thirupuram-Konjisamkulam 1:10,000 4000Kadinankulam
Executive Summary
Annual Report2009-10 ix
• X-ray diffraction studies of Vijaypura benchmarkferruginous soils indicate kaolinite as the dominantmineral along with subdominant proportion ofmica. This observation is in contrast with otherferruginous soil i.e. Jamakhandi where smectite isthe dominant mineral in the clay fraction. InHayatnagar farm of CRIDA. Hyderabad the claysmectites are interstratified with kaolin and havesimilarity with Jamakhandi.
• The protocols for digestion, standards and methodsfor determining elements in soils and sedimentsusing inductively coupled plasma spectrometry(ICP-ACE) have been developed.
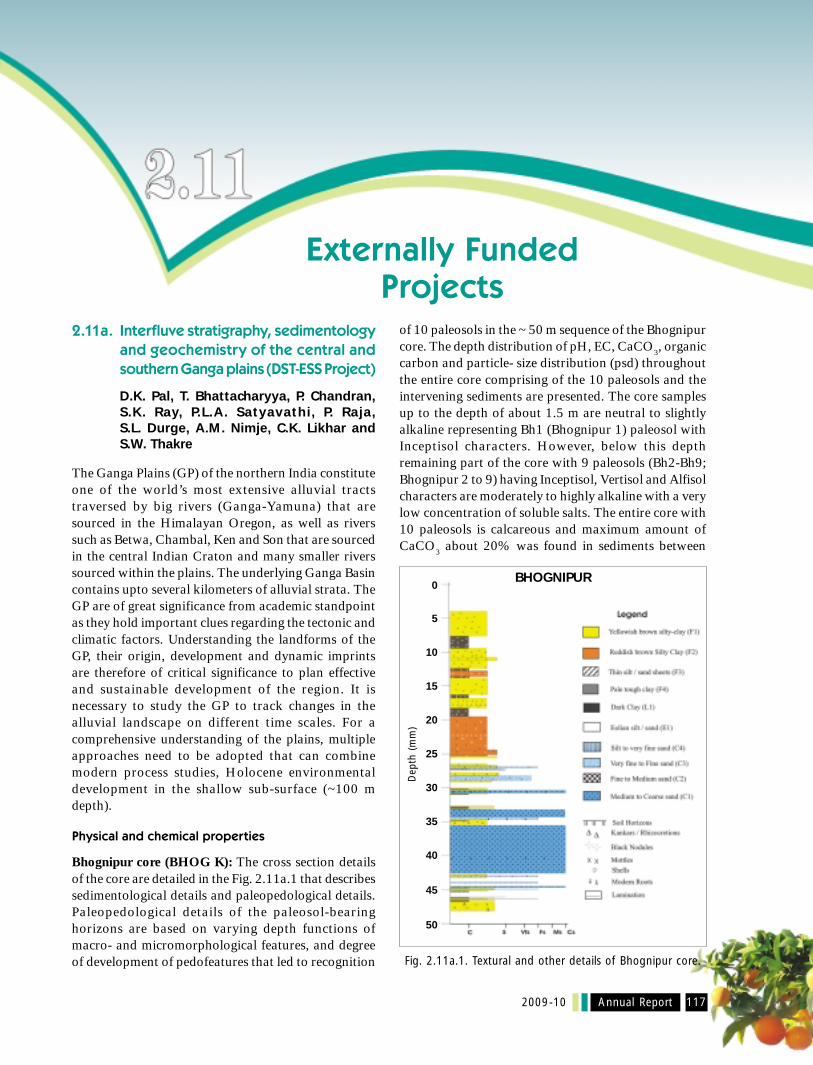
• Interfluves statigraphy, sedimentology andgeochemistry of the central and southern GangaPlains showed similarity of the sediments insouthern and northern parts of Ganga-Yamunainterfluves. Interestingly, however, the trans-formation of smectite to hydroxy-interlayeredsmectites and few other minerals can take placeonly in acidic soil environment of humid climate.Thus the preservation of hydroxy-interlayeredsmectites can be considered as an indicator ofclimate change.
• The national register for soil series was enrichedby the inclusion of 28 soil series representing 12states. The total number of soil series in the nationalregister is 253 at the time of this report. A soilseries correlation software (SoilCor) has beendeveloped which is undergoing tests.
Land Evaluation and Land Use Planning
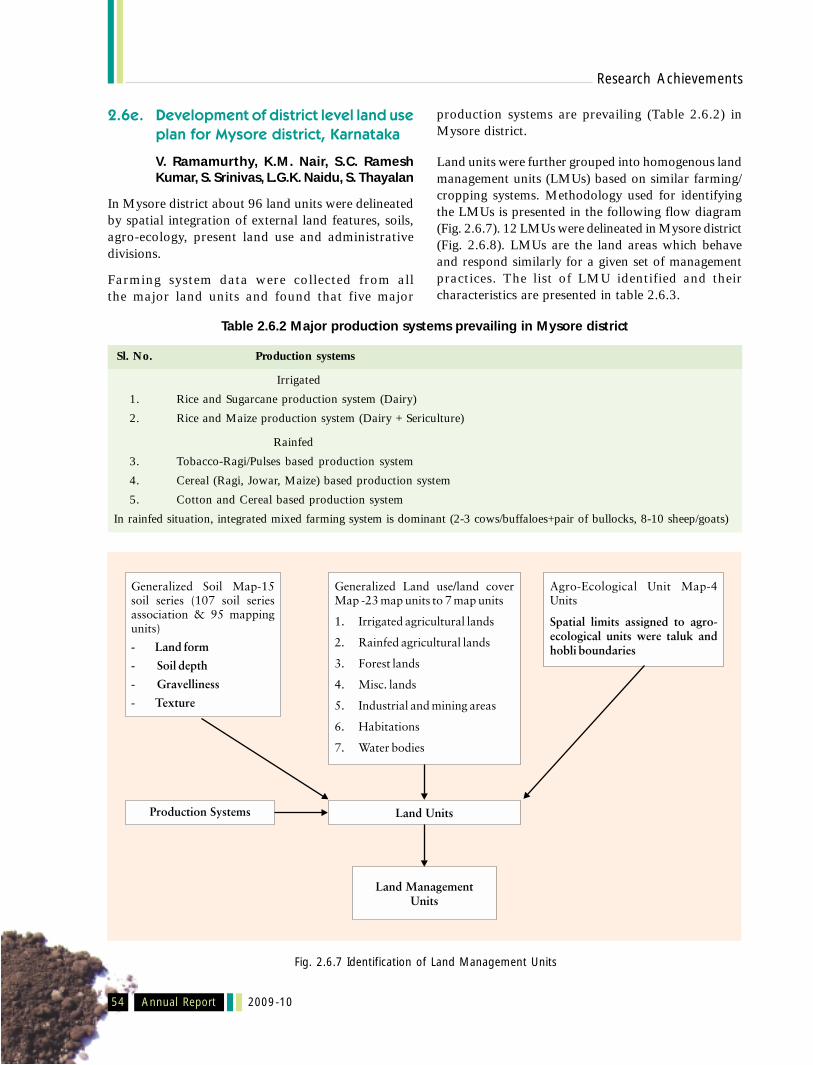
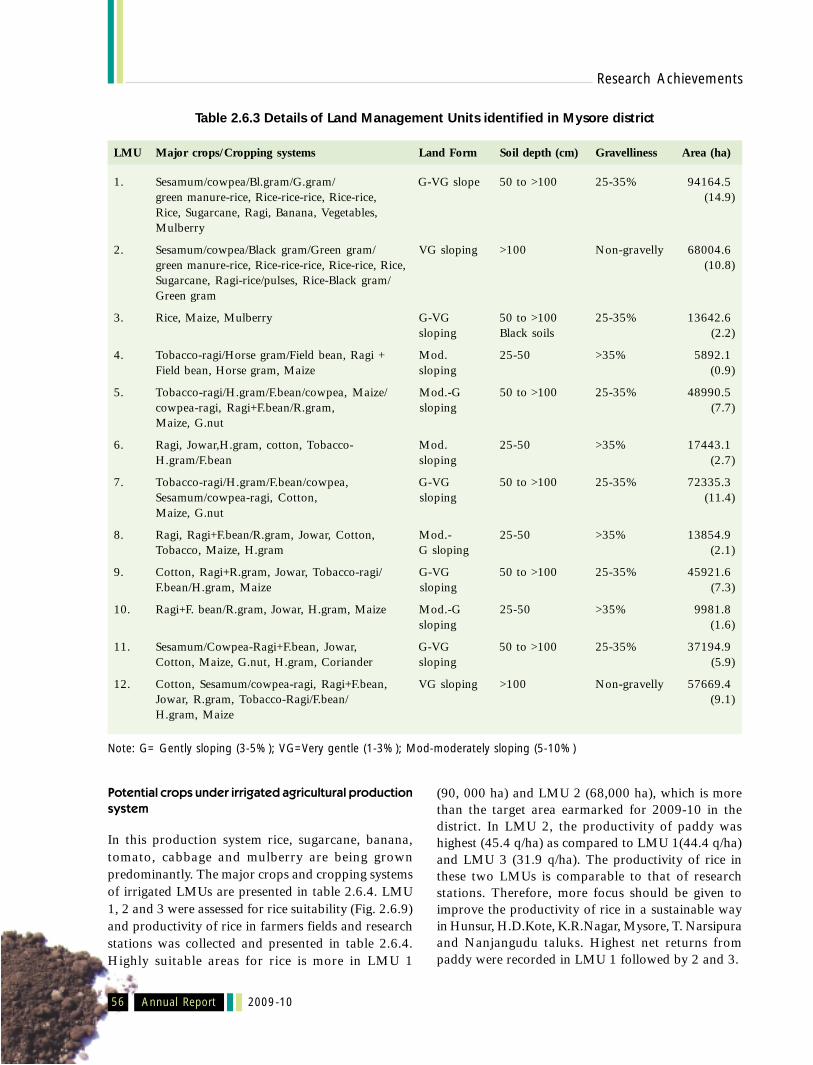
• Total 170 soil series were initially grouped into195 mapping units and thereafter regroupedinto 15 land management units (LMUs).The revised methodological framework wasdeveloped for identifying LMUs in Mysore districtof Karnataka.
• In Gondia district net area sown increasedmarginally, whereas area sown more than oncedeclined.
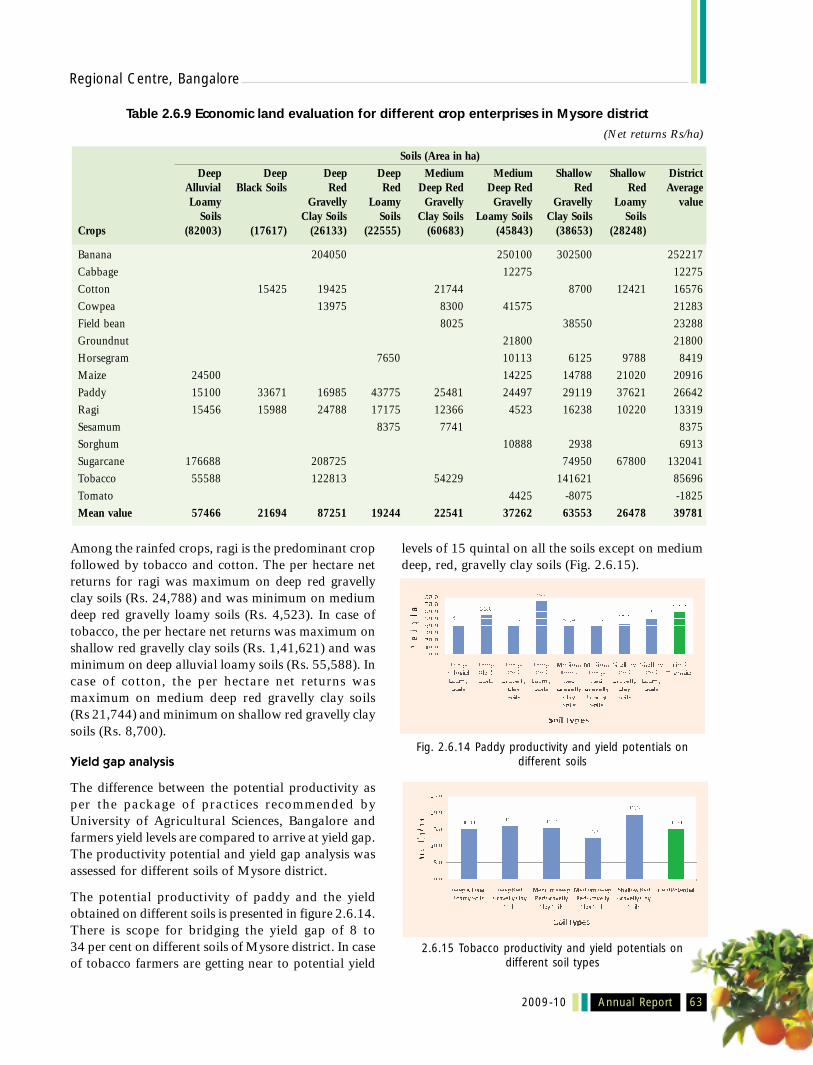
• Five major production systems were found inMysore district of Karnataka and 12 landmanagement units were delineated in this district.The potential productivity of paddy indicates ascope of bridging the yield gap of 8-34% indifferent soils of Mysore district.
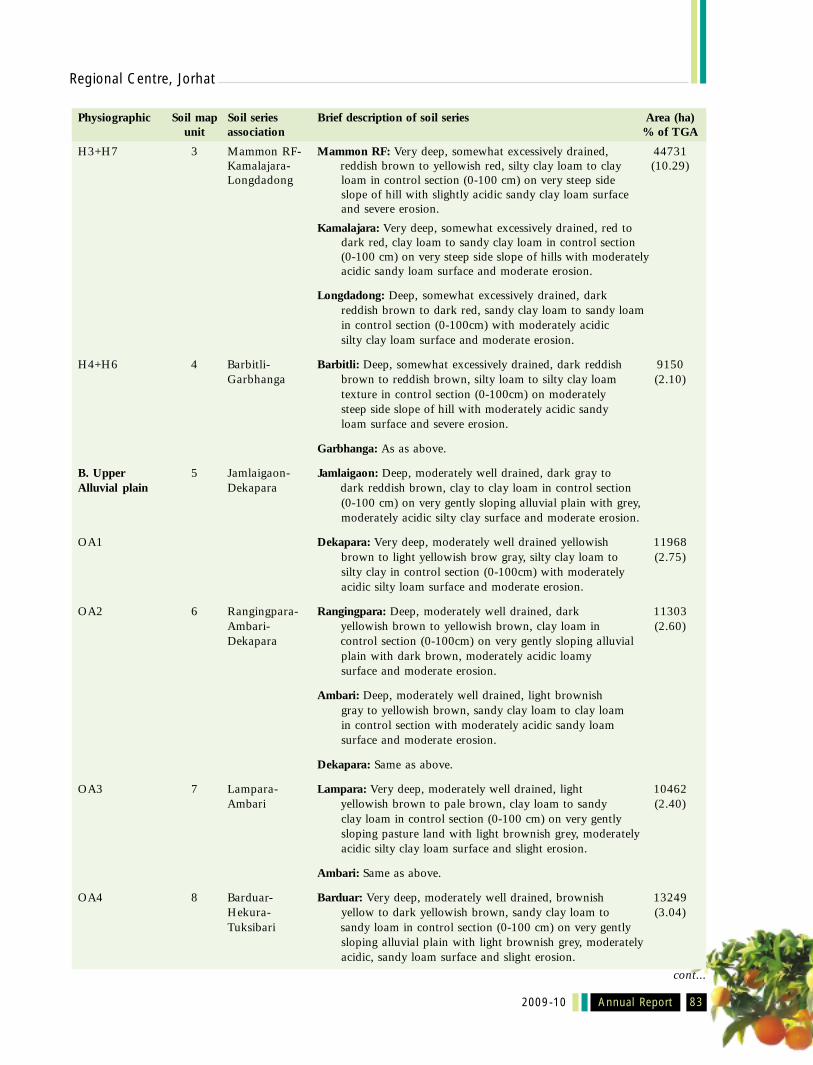
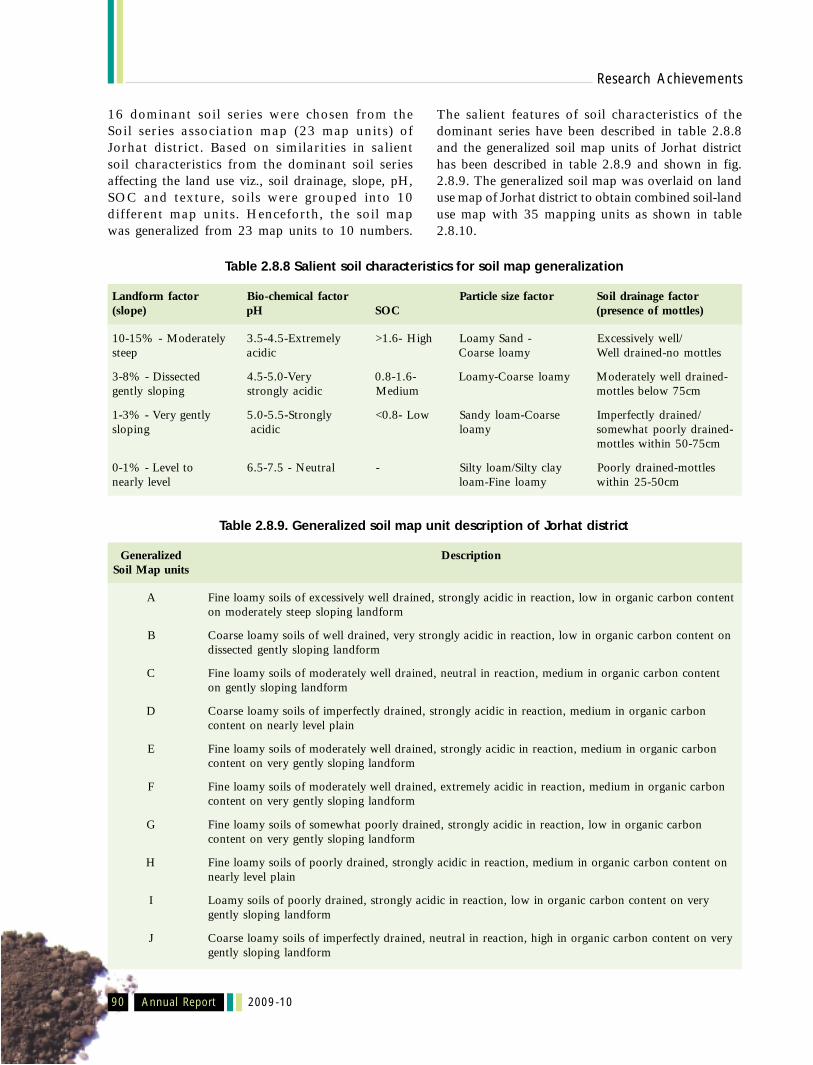
• Sixteen dominant soil series were chosen fromJorhat district soil map to develop 10 generalisedsoil map units which was used to develop a soil-landuse map with 35 mapping units.
• Soil and land use data and their interpretationsuggested that adoption of managementinterventions like drainage improvement, irrigationand addition of inorganic and organic amendmentsmay change the potential productivity index of soilsfrom good to excellent level.
• Digital elevation model was generated using pointdata on altitude, slope, aspect and curvature oftwo microwatersheds in Utkal Plain, Khurde blockof Orissa and Chotanagpur plateau, West Bengaland a landform map was prepared.
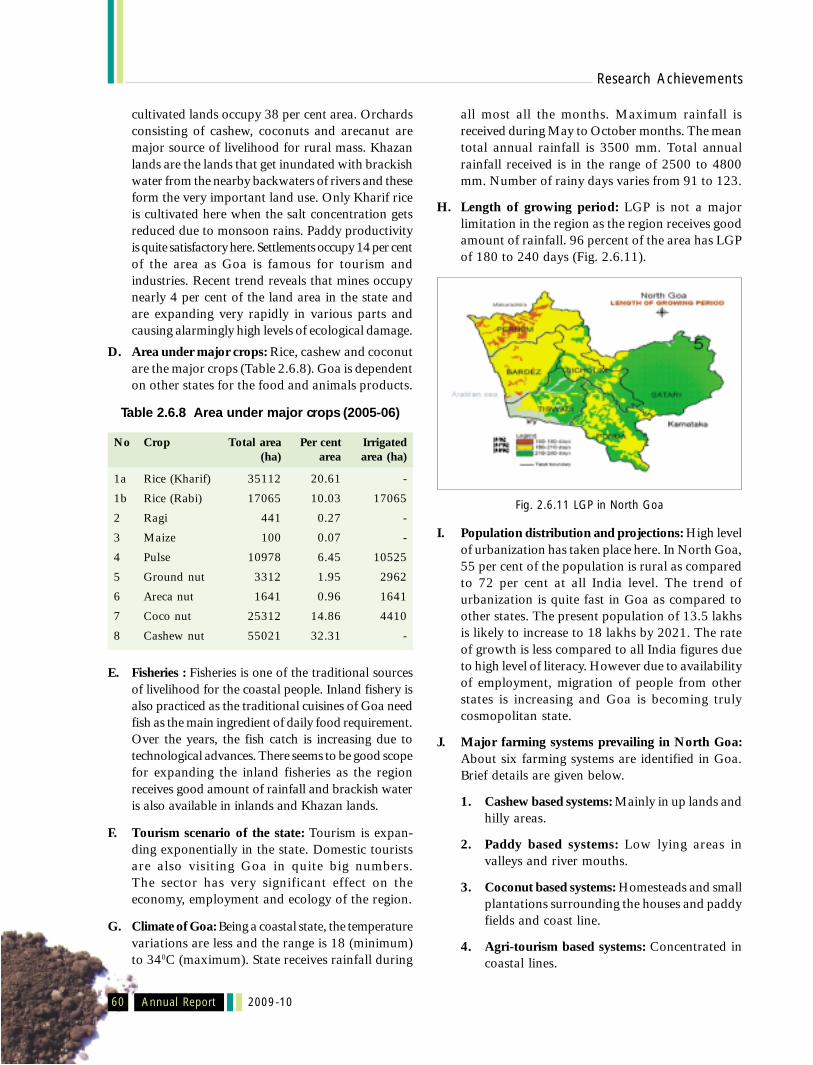
• The LGP is not a major limitation in North Goadistrict as 95% area of the district has LGP of 180-240 days. Six major farming systems such ascashew, paddy, coconut, agri-tourism, spices-basedsystems are identified in this district.
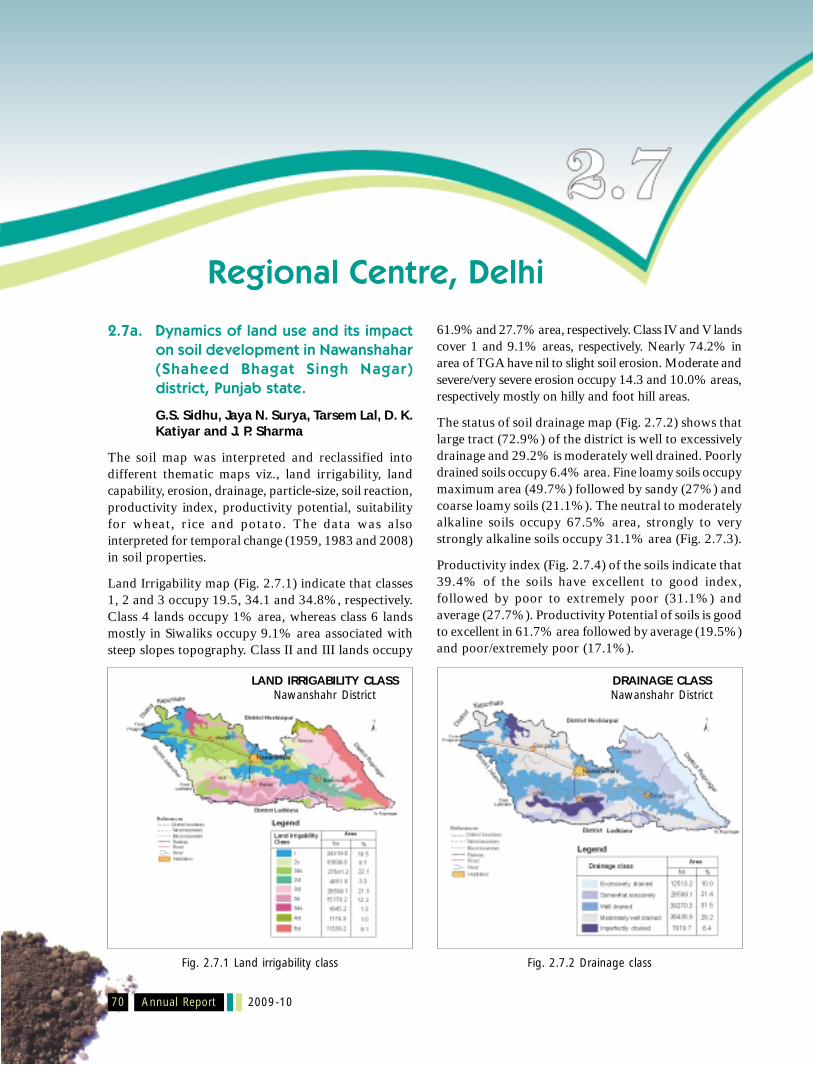
• Soil and landuse data of Shaheed Bhagat SinghNagar district, Punjab, indicated that 39% soilshave excellent to good index showing good toexcellent productivity potential.
• Soil and landuse map of Bundi district, Rajasthanwas spatially integrated to generate 19 landmanagement units showing significantcoverage (1.0%).
• In Dhule cluster the recommended practice ofsystem of rice intensification (SRI) effectedreduction of paddy seed by more than 50%resulting in substantial savings.
• A training on value addition, market linkages andmicroenterprises was conducted in both the clustersof Aurangabad district.
Remote Sensing and GIS
• Landuse-land cover classes were identified in theSaraswati watershed in Buldhana district ofMaharashtra showing cultivated land (81%), scrubland (7.5%), and forests (8.6%).
• Image processing of Hyperion data of Buldhanadistrict, Maharashtra showed good interactionbetween spatial structure of the data and thenoise when the noise good has spatial structure.
Annual Report 2009-10
Executive Summary
x
First MNF (minimum noise fraction) of 139 bandHyperion data (without destripping) showedstrong brightness gradient that corresponds to thespectral (smile) in the VNIR (very near infrared)array.
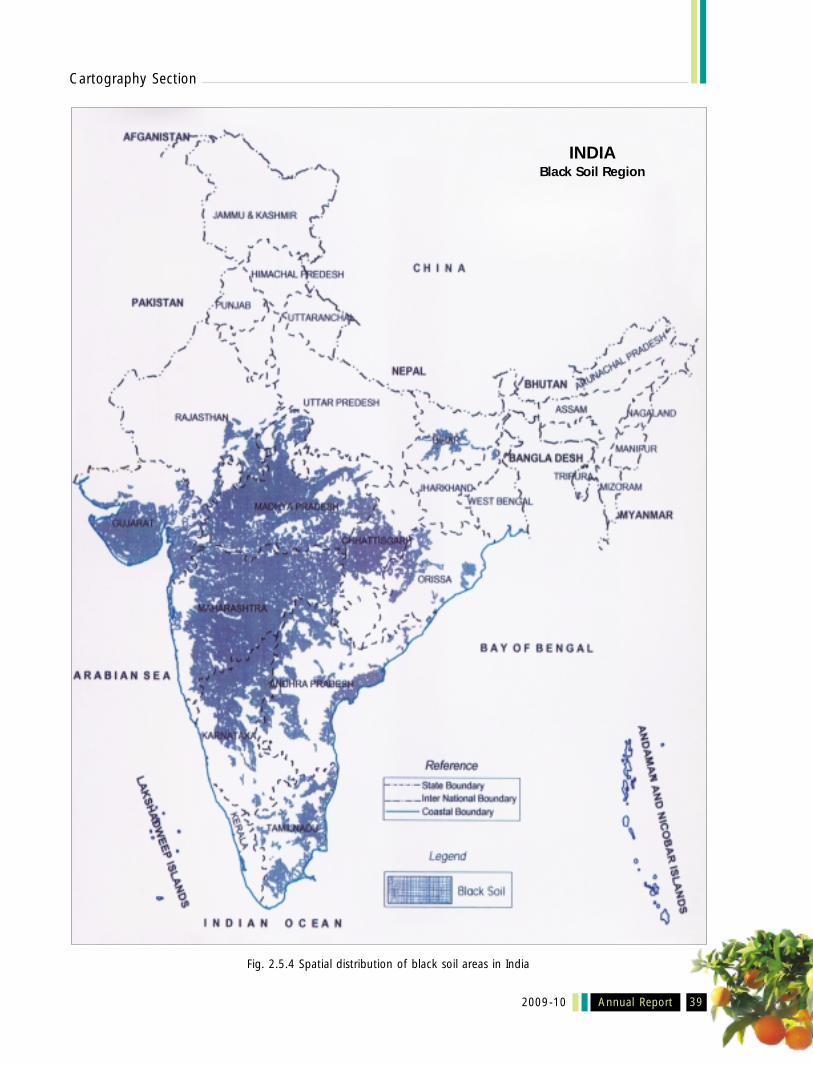
• A georeferenced soil information system of theblack soil region was developed at 1:1 m scaleshowing 343 datasets.
• The satellite data of IRS LISS IV for the selectedsix clusters was georeferenced to generate mosaicfile for the clusterts.
• Spectral curves of 60 soil samples from Ludhianaand Karnal showed prominent absorption featuresat 1400, 1900 and 2200 nm. Salt-affected soils ofKarnal showed stronger absorption featuresaround 1900 nm as compared to non-salineLudhiana soils.
Soil Nutrient Mapping
• Soil nutrient status map for the districts of Howrah,Nadia, Burdhamann, Birbhum, North 24 Parganasand Hooghly of West Bengal were completed andreleased during December, 2009.
• More than 25,000 surface soil samples of variousdistricts of Assam were analysed for developedmacro and micro nutrient maps.
• The spatial variability maps of available N, P weregenerated.
Soil Carbon and Crop Modelling
• Using stepwise regression a pedotransfer function(PTF) for estimating saturated hydraulicconductivity was developed from 200 soilobservations.
• Improved PTF helped to correct the length ofgrowing period based on antecedent moisture inthe soil after the cessation of rains and subsequentlyfor modifying the existing AESR boundaries.
• The level of soil organic carbon has beenreported to increase in paddy and tea soils ascompared to forest soils in tarai region (humid toperhumid) of West Bengal over a period of twodecades.
• The RothC and Century model evaluationindicated that these models can capture the trends
of experimental data in tropical soils.Parameterization of the Century model forapplications to different kinds of cropping systemsin contrasting bioclimatic conditions showed aclose agreement of experimental data withsimulated values.
• InfoCrop model output indicated the averagedecadal (1991-2000) under scenario of no climatechange is 33% which decreases to 32% underscenario of increase in minimum temperatureof 0.25oC. The scenario shifts to increase inconcentration of atmospheric CO2 from 370 to 410ppm to indicate yield gap of 34%. Since most ofthe global climate change over the last 50 years isvery likely to have been caused by increasedemissions of CO2, continuation of such climatechange shall demand for more irrigation todiminish the yield gap.
Agro-Climatic Zonation
• A software was developed to calculate waterbalance for both monthly and weekly datasets.Programme modules are also written for LGP andprobability of each week favourable for growingcrops.
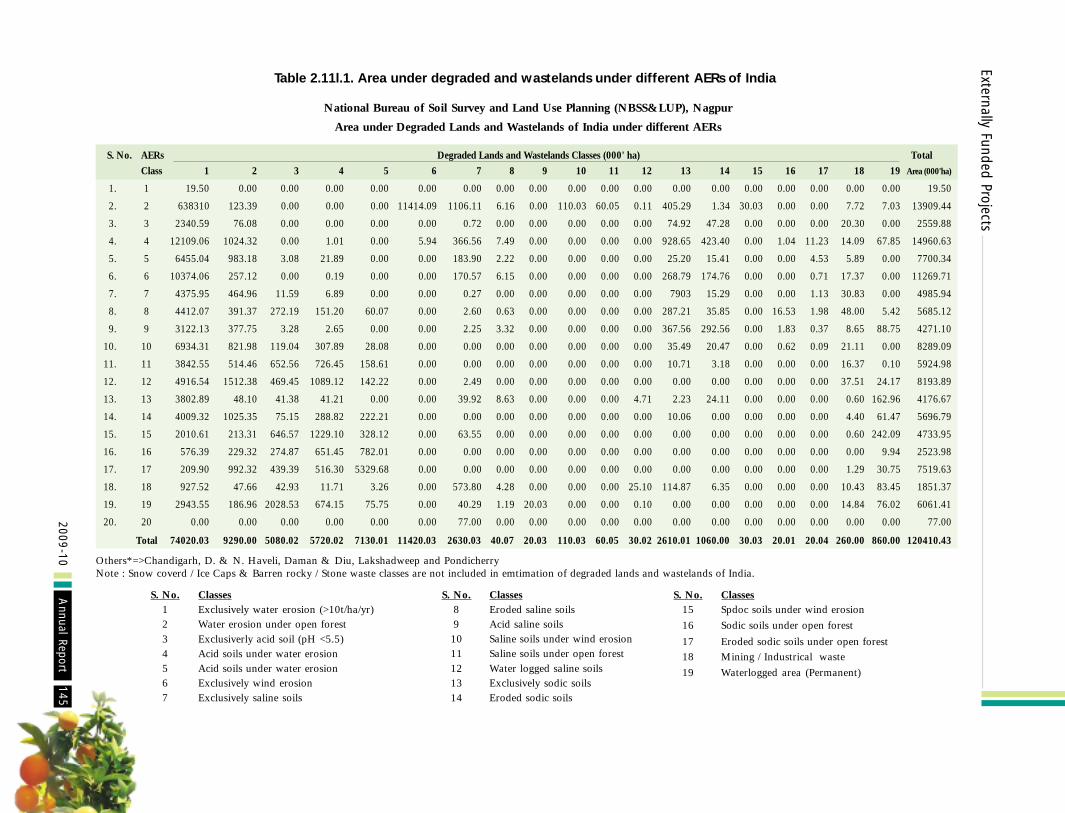
• Degradation and wasteland map of India indifferent agro-ecological regions showed arevised figure of 120.4 mha as degraded andwasteland.
Post Graduate Education
• Four M.Sc. (LRM) and two Ph.D. (LRM) studentssubmitted their thesis during the current academicsession. This is in collaboration with Dr. PDKV,Akola. Besides 4 courses each for M.Sc. and Ph.D.were revised in line with Dr. PDKV, Akola.
Training Organised
• During the year 65 officials from differentorganizations were trained in the field of latesttechniques of Remote Sensing, GIS, Soil Survey andMapping and Land Resource Management.
Training Received
• Total 36 officials from the Bureau recived trainingin various fields.
Executive Summary
Annual Report2009-10 xi
Projects undertaken• Institutional (ongoing) : 38
• New (proposal) : 24
• DST : 02
• Sponsored NAIP Projects : 04
• Sponsored (State Govts.) : 06
• Network project on Climate : 01Change (ICAR)
Linkages• NBSS&LUP – Dr. PDKV
• NBSS&LUP – CICR
• NBSS&LUP – NRSC
• NBSS&LUP – State Agricultural Department
• NBSS&LUP – IISS
• NBSS&LUP – CSWCRTI
• NBSS&LUP – SAC
• NBSS&LUP – SAU
• NBSS&LUP - DST
Publication
• Research papers published : 42
• Technical / popular/ Leaflets : 13
• Seminar/Symposia papers : 27
• Soil Survey Reports/Bulletins : 09
• Book chapters/ Books : 31
• Invited lectures delivered : 16
Awards and Recognition• This year has particularly rewarding for the Bureau
as its scientists and staff were decorated with anumber of Awards and Recognitions.
Introduction
Annual Report 12009-10
THE National Bureau of Soil Survey and Land UsePlanning has its Headquarters at Nagpur with
three research divisions. These are Land Use Planning,Remote Sensing Applications, Soil Resource Studieswhich undertake fundamental and applied research,remote sensing applications and land use planning.These divisions also extend necessary support to variousregional centres. These five regional centres located atBangalore, Delhi, Jorhat, Kolkata and Udaipur, areinvolved in soil resource mapping, soil correlation andclassification and land use planning.
Mandate• To conduct soil survey and mapping of the soils of
the country to promote scientific and optimal landuse programmes in collaboration with relevantinstitutions and agencies.
• To conduct and promote research in the NationalAgricultural Research System in the areas ofpedology, soil survey, remote sensing applications,land degradation, land evaluation and land useplanning, in collaboration with other relevantagencies.
• To impart training and education to createawareness on soil and land resources and their stateof health.
Major Research Achievements
The resource inventorisation of soils remain the majorfocus of the institute during this year. Most of the areaswere surveyed in 1:10,000 scale for various farms,villages, watershed, etc. Besides a few districts weresurveyed in 1:50,000 scale.
The Bureau has initiated a network project on cadastraland block level survey to provide a commonmethodology. Besides the HQrs. all the five regionalcentres are involved in this effort.
As a part of World Bank sponsored National AgriculturalInnovation Project (NAIP) (Component 4) soil
Introductioninformation system is being developed for black soilregion and the Indo-Gangetic Plains in terms ofphysical, chemical and microbiological properties.
The Bureau is engaged in another NAIP (Component3) to develop the package of practice of livelihoodsecurity of farmers in few selected clusters ofMaharashtra. The Bureau has also initiated a NationalNetwork Project on Land Use Planning. Preliminaryinformation on soils and land use have been generatedfor selected districts across the country.
The Bureau has enriched the National Register for soilseries by the inclusion of 28 soil series representing 12states to make the total number of soil series in theNational Register as 253.
The Bureau has been consistently catering to the needof various State Agricultural Universities, StateGovernment Officials and others. In terms of teachingand training, using soil survey data for planning andusing various types of soil and crop models.
In total 42 number of research papers were publishedduring this year besides other publication in the formof symposia papers, popular articles, book chapters,bulletins and soil survey reports.
Budget for the year 2009-10(Rs. In lakhs)
Budget Sanctioned Actual Expenditure
PLAN 400.00 400.00NON-PLAN 3519.28 3473.84Total 3919.28 3873.84
Staff Strength as on 31.3.2010Category Sanctioned Strength In Position
The objective of the project is to develop a methodologyfor evaluating the current and future land utilizationtypes considering the components of agriculture as wellas allied enterprises under different policy options andtechnological constraints.
A methodological framework (Fig. 2.1.1) for achievingthe targets was developed at the Division and tested in
Mysore District involving Regional centre, Bangalore.The case study was presented in a working groupmeeting at Headquarter in May, 2009.
The soil map of Mysore district with 195 mapping unitswere regrouped into 15 mapping units throughgeneralization and bio-climate map was superimposedover the generated soil map for delineation of landmanagement units (LMUs). Landform, soil depth,texture and gravelliness were considered as criticalvariables for land use. A revised methodologicalframework was developed for identifying landmanagement units (Fig. 2.1.1). It was proposed thatone district will be taken up by each regional centrefor developing the methodology. The resource personswere identified for each regional centre.
Fig. 2.1.1 Identification of land management units – A revised methodological framework
Division ofLand Use Planning
Annual Report6 2009-10
Research Achievements
2.1ai. National network sub-projecton development of district levelland use plan for Gondia district,Maharashtra
T.K. Sen, S. Chatterji, T.N. Hajare,S.N. Goswami, N.G. Patil, P.N. Dubey,A. Chaturvedi and D. Sarkar
Gondia district has been identified as a target districtas it is dominated by tribals who draw theirlivelihood from forest produce and/or subsistencefarming of paddy and millets. It is situated in theEastern part of Vidarbha, Maharashtra and liesbetween 80o0’ to 80o42’ E Longitudes and 20o40’ to21o38’ N Latitudes.
The soil resource map of Gondia district has beencarved out from that of erstwhile undividedBhandara district, (1:63,000 scale) prepared byNBSS&LUP (Soil Survey Report No. 520). The soilboundaries are being checked refined, wherevernecessary.
Land use change scenario analysis of Gondiadistrict
The change in land use during the period 2000-01 to2005-06 has been analyzed. The area under forest hasdeclined by 3.69 per cent in 2005-06 as compared tothat in 2000-01 (Table 2.1.1). Similarly, waste land hasalso declined by 6.56 per cent in 2000-01 as comparedto that in 2005-06. The decline in forest land and wasteland is due to utilization of these lands for non-agricultural purposes. The permanent pasture and othergrazing land, land under miscellaneous tree crops andgroves and culturable waste land has increased by 38.50per cent in 2005-06. Current fallow has increased by1.62 per cent in 2005-06 as compared to 2000-01.Contrary to this, land under other fallow has shown asharp decline by 94.82 per cent in 2005-06 as comparedto 2000-01. Net area sown has shown a marginalincrease of 4.88 per cent in 2005-06 as compared to2000-01, whereas area sown more than once hasdeclined by 5.89 per cent in 2005-06. As a resultcropping intensity in 2005-06 has declined to 125.42per cent in 2005-06 from 128.30 per cent in 2000-01.
Table 2.1.1 Land use change scenario of Gondia district(Area in ha)
Land use categories 2000-01 2005-06 Percentage increase (+)/decrease (-)
Total geographical area 585895 (100.00) 585900 (100.00)
Forest 215115 (36.72) 207500 (35.41) -3.69
Not for cultivation
Non-Agril. Land 49467 (8.44) 53200 (9.08) +7.05
Waste land 22002 (3.76) 13300 (2.27) -6.56
Other uncultivated land 92087 (15.72) 112000 (11.35) +38.50
(Permanent pasture +Misc. tree crops and groves +culturable wasteland)
Fallow land
Current fallow 10720 (1.83) 10900 (1.86) +1.62
Other fallow 22365 (3.82) 6100 (1.04) -267.34
Area under agricultural use
Net sown area 173959 (29.69) 182900 (31.21) +4.88
Total cropped area 223198 229400 +2.70
Total (More than once) 49239 46500 -5.89
Cropping Intensity (%) 128.30 125.42 -2.30
Figures in parentheses indicate percentage of reporting area.Source: Socio-economic review of Gondia district, Maharashtra, 2009)
Division of Land Use Planning
Annual Report 72009-10
Table 2.1.3 Regression coefficients indicatinginfluence on SHC of Vertisols
Soil property Regression coefficients
Sand 0.32
Silt 0.13
Clay -0.42
BD -0.10
COLE 0.07
FC -0.14
CEC -0.17
Exch Ca/Mg -0.12
ECP -0.09
EMP -0.10
ESP 0.25
SAR 0.21
PWP -0.18
Statistical and neural regression PTFs were alsoderived to estimate bulk density. Five levels of inputinformation were identified for establishingdependencies between basic soil properties and bulkdensity. Logarithmic transformation was applied tothe bulk density values for better representation of thedata. Following inputs were used for developinghierarchical PTFs.
• Input level 1 Textural data (data on sand, silt,and clay fraction-SSC)
Evaluation of the performance of PTFs showed thatthe equations were not in reliance with the data.However, neural PTFs performed better than statisticalPTFs. PTF utilizing minimum information (sand, silt,and clay) were of lowest value as indicated by thestatistical indices for testing. It was observed that thenetworks fitted to the observed data well with lowerRMSE (0.02) and other errors, d (0.81) and R2 (0.52).But, when tested against subset, the magnitude oferror(s) increased with poor R2 (0.05) and d (0.19).The inclusion of FC as an input variable, the PTFperformance declined. In fact, amongst all PTFs, thePTF using textural information and FC was observed
2.1b. Estimating saturated hydraulicconductivity, and bulk density of theVertisols and vertic intergrades frompublished research and soil surveydata
N. G. Patil, C. Mandal, D. K. Mandal and
D. K. Pal
Seven water retention functions were fitted to themeasured soil water retention data available in DSTproject report. Four of them, namely, Brooks-Corey(BC), Campbell, Campbell-Hutson (CH) and VanGenuchten (VG) were found to be acceptable basedon statistical criteria. The statistical indices (Table 2.1.2)indicate that the Campbell-Hutson (CH) functiondescribed water retention characteristics of the soilsbetter than other functions. However, the differenceamong the four functions was narrow. All the fourfunctions exhibited RMSE < 0.05 m3m-3 and henceconsidered at par.
Table 2.1.2 Statistical indices to judge efficacy ofwater retention functions
Function BC CAMPBELL CH VG
RMSE 0.0279 0.0212 0.0189 0.02356
D 0.9251 0.9609 0.9666 0.93914
ME 0.0992 0.0983 0.0561 0.07206
MAE 0.0203 0.0145 0.0146 0.01977
D-degree of agreement, ME-maximum error,
MAE-maximum absolute error
Statistical regression equations developed torelate saturated hydraulic conductivity (SHC)and other soil properties indicated that thestructural properties as well as chemical propertiesinfluenced the SHC (Table 2.1.3). However,regression pedotransfer functions (PTF) showedlarge estimation errors. Robust regressions couldnot be developed from the data. However it wasevident from the regression coefficients presentedbelow that the variables influencing SHC inorder of magnitude were clay, sand, ESP andSAR.
Annual Report8 2009-10
Research Achievements
to be of lowest utility value. Highest prediction errorwas indicated by RMSE, R2, ME and MAE values. Theincrease in input variables by inclusion of permanentwilting point (PWP) led to reduced RMSE but indiceswere not better than that of basic PTF based on texture.When clay was excluded as an input variable, therewas definite improvement in PTF performance. Thebest performing PTF included sand, silt, FC and PWPas input variables implying that the measures ofstructure as well as information on pore structure wasessential to predict bulk density accurately. Exclusionof clay as an input variable led to improvement in PTFperformance probably due to the fact that the claycontent was always above 40% with low coefficientof variation that caused difficulty in training networks.The best performing PTF (input sand, silt, FC and PWP)had lowest RMSE (0.01), MAE (0.01) the highest d(0.95) and R2 (0.83) when networks were fitted to themeasured data. It also had the lowest RMSE (0.01),MAE (0.01) and the highest d (0.7) and R2 (0.65) whentested for predictive ability (Fig. 2.1.2).
2.1c. Development of pedotransfer functionsfor estimation of saturated hydraulicconductivity of VertisolsN.G. Patil
Pedotransfer functions were developed for estimatingsaturated hydraulic conductivity of Vertisols usingavailable data on soil properties. Soil profileinformation of 26 representative sites comprising 157soil samples was used for PTF development. Four levelsof input information were used namely, 1) Texturaldata (data on sand, silt, and clay fraction-SSC) 2) Level1+bulk density data (SSCBD) 3) Level 2+organic matter(SSCBDOM) and 4) Level 3+organic matter (SSCOM).PTFs for estimating field capacity and permanentwilting point were also calibrated. Irrespective of theinput variables (texture, bulk density, organic carboncontent etc.), the root mean square error in predictingsaturated hydraulic conductivity using PTFs resultedin high magnitude (>2 cm d-1). The PTFs were thereforeconsidered unacceptable.
Fig. 2.1.2 Correspondence between measured and predicted bulk density values with sand, silt fractions and moistureconstants (FC and PWP) data as an input in derived PTF
Division of Remote Sensing Applications
Annual Report 92009-10
2.2a. Development of soil reflectancelibraries for characterization of soilproperties in Nagpur district,Maharashtra
Rajeev Srivastava, A.K. Maji, M.S.S.Nagaraju and A.K. Barthwal
The soil samples collected were analysed andinterpreted to establish relationships between varioussoil and their reflectance properties:
Correlation between derivative reflectance dataand soil properties
The correlation coefficient (r) between different soilproperties and derivative soil reflectance data atdifferent wavelength indicate that sand had significantpositive correlation with derivative soil reflectance atall the wavelengths except between 1370-1400, 1850-1900, 2130-2200 and 2250-3500 nm where it showednegative correlation. On the contrary, the silt and clayshowed negative correlation with soil reflectance atmost of the wavelength except 1370-1400, 1850-1900,2130-2200 and 2250-3500 nm where the correlationwas positive.
Division ofRemote Sensing Applications
Soil pH, EC, organic C, CaCO3, Fe2O3, CEC,exchangeable cations (Ca, Mg, Na, K), DTPA-Zn andCu showed significant negative correlation withderivative soil reflectance at most of the wavelengthswhereas the effect of DTPA extractable Fe and Mn waspositive on derivative soil reflectance.
Data indicated that most of the soil properties showedhigh correlation with derivative soil reflectance valuesnear principal absorption features within the visible(400-600 nm) and short-wave infrared (1400, 1900,2200, 2300, and 2400 nm) wavelength regions.
Prediction of soil properties from soil reflectancedata
Development of calibration models for prediction ofsoil properties from soil reflectance dataset was doneby dividing the whole dataset into two viz. calibrationdataset and validation dataset. Derivative soilreflectance data of calibration dataset were calibratedwith soil properties using stepwise multiple linearregression analysis. The number of samples used forcalibration model, standard deviation (s.d.), coefficientof determination (R2) and standard error of calibration(SEC) values for different soil properties have beenpresented in table 2.2.1.
Table 2.2.1 Statistical parameters of calibration datasets and multiple linear regression equations ofdifferent soil properties using derivative soil reflectance data
Soil properties No. of Samples used s.d. R2 SEC
*Sand (%) 91 22.34 0.87 7.91
*Silt (%) 91 8.80 0.61 6.03
*Clay (%) 91 17.63 0.89 6.81
#Soil pH (1:2.5 ) 145 0.78 0.79 0.36
*EC (dSm-1) 145 0.13 0.37 0.13
*OC (%) 140 0.32 0.78 0.15Cont...
Annual Report10 2009-10
Research Achievements
The data indicate that coefficient of determination (R2)values of different models of soil properties rangedbetween 0.61 and 0.91 with acceptable SEC values.Calibration R2 value of <0.50 was consideredunacceptable in this study, suggesting that calibrationmodels of EC, and DTPA extractable Zn were poorand was dropped from further validation.
The calibration models of soil properties with R2 valuesof >0.5 were used to predict the soil properties in thevalidation datasets. The statistical parameters viz. r2,
standard deviation (s.d.), standard error of prediction(SEP) and ratio of performance deviation (RPD) valuesobtained in the validation datasets for various soilproperties are given in (Table 2.2.2).
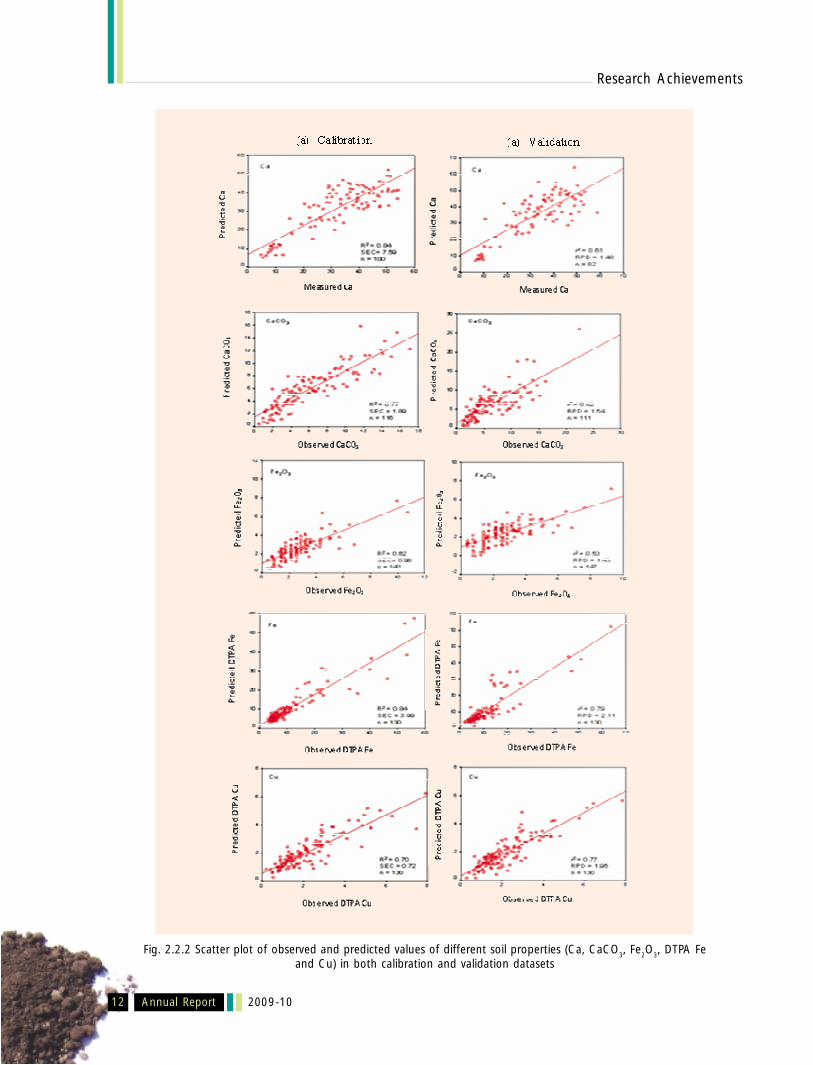
The application of calibration models on the validationdataset resulted r2 values for regression between 0.61and 0.79 (Table 2.2.2). The scatter plot for observedand predicted values of different soil properties in bothcalibration and validation datasets are given in figures2.2.1 and 2.2.2.
Table 2.2.2 Statistical parameters of validation datasets
Variable No. of prediction Samples Standard deviation r2 SEP RPD
Fig. 2.2.1 Scatter plot of observed and predicted values of different soil properties (sand, clay, OC, pH, CEC)in both (a) calibration and (b) validation datasets
Annual Report12 2009-10
Research Achievements
Fig. 2.2.2 Scatter plot of observed and predicted values of different soil properties (Ca, CaCO3, Fe2O3, DTPA Feand Cu) in both calibration and validation datasets
Division of Remote Sensing Applications
Annual Report 132009-10
Validation r2 value of <0.50 for silt, EC, exch Mg, Na,K and DTPA-Zn and Mn indicate that the calibrationmodel for these parameters are not suitable for reliableprediction of soil properties.
Usually in most of the spectroscopy techniques, the bestcalibration model is one which gives high coefficientof determination (r2) and high RPD values and lowstandard error of calibration (SEP) in the validationdataset. There are some reports which states that NIRreflectance spectroscopy technique had the ability topredict various properties of soil and which used 3categories based on RPD in the ranges >2.0, 1.4-2.0and <1.4 to indicate decreasing reliability of theprediction using this technique.
The data indicate that RPD values are more than2.0 for CEC (2.16) and DTPA- Fe (2.11) whichindicates good prediction of these properties fromspectral data. The RPD values within 1.4 – 2.0, forsand (1.86), clay (1.85), soil pH (1.87), org. carbon(1.82), exch. Ca (1.48), Exh. K (1.50), CEC (2.16),CaCO3 (1.54), DTPA-Fe (2.11) and DTPA-Cu (1.96)indicates reliable prediction of these soil propertieswhereas RPD values less than 1.4 for silt (1.33), exchMg (1.19), exch Na (1.18), DTPA-Mn (1.02) and Zn(1.07) suggest that the prediction of these propertiesare not reliable.
2.2b. Integrated approach of remotesensing and GIS in land resourcescharacterization, evaluation andmapping of Saraswati watershed inBuldana district of Maharashtra
M.S.S. Nagaraju, Rajeev Srivastava,A.K. Maji and A.K. Bartwal
Geographically, the Saraswati watershed is locatedbetween 19o 09' to 20o 01' N latitudes and 76o 26' to76o 35' E longitudes in Mehkar tehsil of Buldanadistrict, Maharashtra. The total area of the watershedis 10787.4 ha. The study area falls in the SOI ToposheetNo. 55 D/12, 55 D/8, 56 A/5 and 56 A/9.
Land Use/Land Cover mapping
Cultivated land
Cultivated land mainly occurs on very gently slopingplateau, very gently sloping and gently slopingpediments, very gently sloping broad valley and narrowvalley. On satellite data, crop land exhibits medium todark gray with pink and red patches with bold
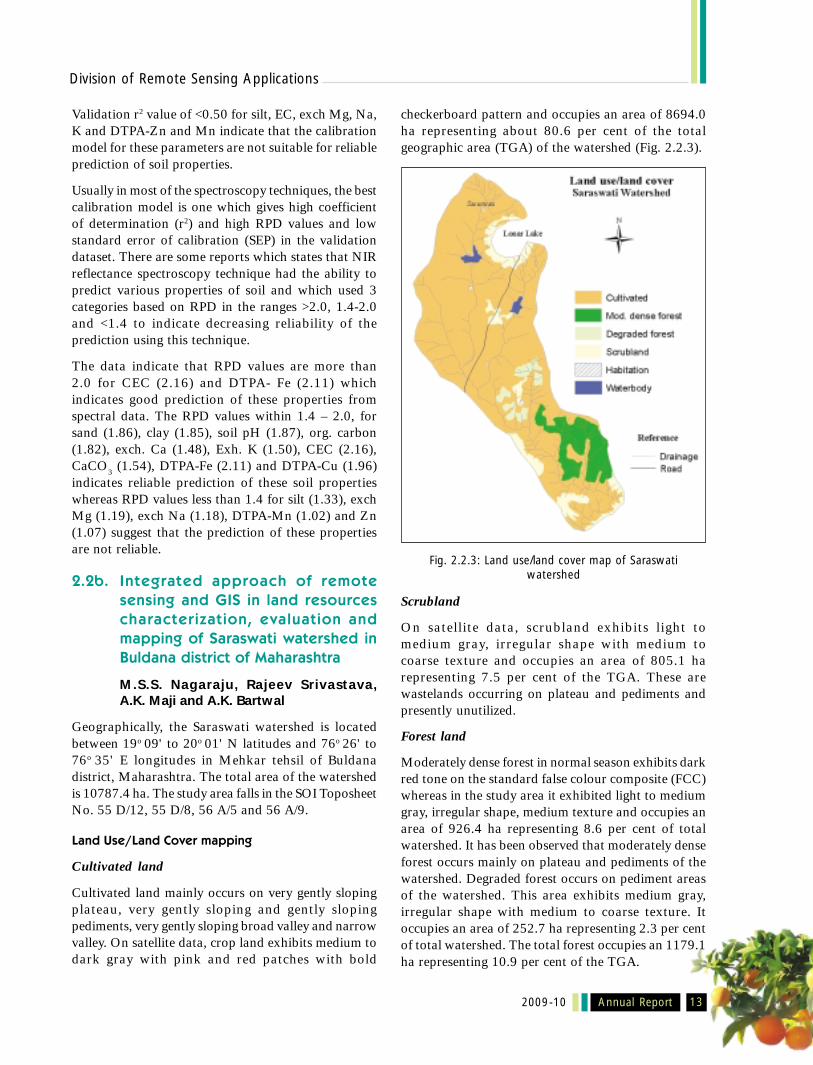
checkerboard pattern and occupies an area of 8694.0ha representing about 80.6 per cent of the totalgeographic area (TGA) of the watershed (Fig. 2.2.3).
Fig. 2.2.3: Land use/land cover map of Saraswatiwatershed
Scrubland
On satellite data, scrubland exhibits light tomedium gray, irregular shape with medium tocoarse texture and occupies an area of 805.1 harepresenting 7.5 per cent of the TGA. These arewastelands occurring on plateau and pediments andpresently unutilized.
Forest land
Moderately dense forest in normal season exhibits darkred tone on the standard false colour composite (FCC)whereas in the study area it exhibited light to mediumgray, irregular shape, medium texture and occupies anarea of 926.4 ha representing 8.6 per cent of totalwatershed. It has been observed that moderately denseforest occurs mainly on plateau and pediments of thewatershed. Degraded forest occurs on pediment areasof the watershed. This area exhibits medium gray,irregular shape with medium to coarse texture. Itoccupies an area of 252.7 ha representing 2.3 per centof total watershed. The total forest occupies an 1179.1ha representing 10.9 per cent of the TGA.
Annual Report14 2009-10
Research Achievements
Slope
Slope map of the watershed was prepared from contourinformation available on SOI toposheet and usingground truth information. Two slope classes wereidentified as very gentle (1-3%) and gentle (3-8%) slopewith 73.0 and 26.0 per cent area of the watershedrespectively.
Physiography mapping
Based on interpretation of IRS-P6 LISS-III of March,2008 data and subsequent ground truth verification,four major physiographic units viz. Plateau (P),Pediments (D), Broad valley (B) and Narrow valley (N)were identified. The major physiographic units werefurther sub-divided into eleven mapping units basedon slope and land use/land cover. The physiographymap is presented in figure 2.2.4.
Fig. 2.2.4 Physiography map of Saraswati watershed
Plateau
The plateau is located in the upper reaches of thewatershed with very gentle slope (1-3%). Theelevation ranges from 540-580 m above MSL. Itoccupies an area of 3517.6 ha representing 32.6 percent of the total watershed. The plateau is divided intothree sub physiographic units viz. very gently slopingcropland (P1c1) and very gently sloping scrubland(P1s2).
Pediments
The pediment is moderately elevated area occurat middle reaches of the watershed with elevationranging from 500-540 m above MSL. It is verygently sloping (1-3 %) and gently sloping (3-8%)land and occupies an area of 4571.5 ha representing42.4 per cent of the total area of watershed.The pediment is subdivided into five sub physiographicunits viz. very gently sloping crop land (D1c1),very gently sloping scrubland (D1s2), gentlysloping crop land (D2c1), gently sloping scrubland(D2s2) and gently sloping moderately dense forest(D2F3).
Narrow valley
The narrow valley occurs at an elevation ranging from500-520 m above MSL. It is very gently sloping(1-3 %) land and occupies 648.8 ha representing 6.0per cent of total geographic area of the watershed.Narrow valley is divided into very gently sloping singlecrop land (N1c1).
Broad valley
This physiographic unit occurs at lower reaches of thewatershed at an elevation ranging from 480-500 mabove MSL. It is very gently sloping (1-3%) land andoccupies an area of 1940.3 ha representing 18.0 per centof the total geographic area of the watershed. The broadvalley is mainly divided into very gently sloping cropland (B1c1).
Division of Soil Resource Studies
Annual Report2009-10 15
2.3a. Pedogenic threshold in benchmarksoils under rice-wheat croppingsequence in a climosequence of theIndo-Gangetic Plains
D.K. Pal, S. Lal, T. Bhattacharyya,P. Chandran, S.K. Ray, P.L.A. Satyavathi,P. Raja, S.L. Durge and G.K. Kamble
Acquisition of data on the trends of climatic changessetting pedogenic thresholds may have decisiveimplications in the management of agriculturalproduction of the IGP on the next millennium. For thisbasic information on soils with regard to theirgeomorphology and age and also their physical,chemical, mineralogical, micromorphologicalproperties is necessary. Gathering such organizeddatasets on benchmark soils of the IGP appears to bemandatory to find out yield influencing soil and climaticparameters that would help to build up the futureprojections for the sustainability of R-W croppingsystem. At present information available in these areasis unorganized and incomplete. Therefore, a newinitiatives in registering the relevant pedogenicthresholds and their interaction in a landscape arenecessary to predict the crop behaviour. This way asoil-climate-crop data bank can be established forR-W system. Such data bank will have a unique statusand value in providing a basic information platform todevelop new and comprehensive system model requiredfor the sustainability of R-W cropping system in theIGP.
The final project report (alongwith RPF III) has beensubmitted. The project report describes themorphological, physical, chemical, mineralogical andmicromorphological properties of 30 benchmark
Division ofSoil Resource Studies
pedons spread in 7 states (Rajasthan, Punjab, Haryana,Uttarakhand, Uttar Pradesh, Bihar and West Bengal).In addition, information on the soil age is also available.The soils of the Indo-Gangetic Alluvial Plains (IGP)represent a climosequences from hot arid to perhumidclimatic regions. The major pedogenic processes thatare being operated during the Holocene period arereported. It also correlates the events of tectonic andclimate to pedogenic processes leading to soildegradation e.g. development of soil sodicity. Thetectonic and climate change events have been identifiedusing tools of mineralogy and micromorphology. Thesetools have also helped in inferring the role of the riverssourced in Rajmahal Deccan trap area and theirinfluence in depositing the smectite clay mineral in theformation of soils with vertic character amidst themicaceous parent material brought by the rivers thatare sourced in the Himalayan Oregon. These soils arebeing grown to mainly rice and wheat for the lastseveral years and the use of agricultural implementshas been for the last few decades to enhance theproductivity. However, the recent trends of eitherdeclining or stagnation in the rice-wheat productivityneeded an explanation. Investigations has revealed thatthe use of agricultural implements has causedremarkable enhancement of bulk density of subsoils,leading to impaired drainage of the soils in some casesto the extent of less than 10 mm h-1, even in non-sodicsoils. Such situation may help in maintaining theproductivity of rice and also in the sequestration oforganic carbon. But the impairment of drainage appearsto cause the decline in wheat productivity. Use of waterfor supplemental irrigation has caused the increase incarbonate and bicarbonate ions of soil solution thatcaused dispersion of clay colloids and as a resultdrainage was impaired.
Annual Report16 2009-10
Research Achievements
Thus this report provides a historical soil-climate-cropdatabank that may help in fine tuning the existingmanagement intervention for the National AgriculturalResearch System. It also provides a robust datasetfor the system modelers who are associated inresearch in predicting the future projections on thesustainability issues of the rice-wheat cropping systemin the IGP.
Pedogenetic Process and Pedogenic threshold in aclimosequence
Out of 30 soils undertaken for the study 4 soils belongto humid tropics (HT), 9 to semi-arid dry, 2 to semi-arid moist – sub-humid dry, 2 to sub-humid dry, 10 tosemi-arid moist, 1 to humid moist and 2 to perhumidclimate. Soils belong to Entisols, Inceptisols, Alfisolsand Vertisols. It is observed that irrespective ofbioclimate 25 soils are Alfisols with (11 soils) andwithout (14 soils) vertic character. One soil belongs toVertisols. The occurrence of variety of soil orders amidstmicaceous alluvium of the IGP indicates that bothpedogenetic processes and the parent material are notidentical in all soils of the IGP under study. Among 30soils, 2 (Zarifa Viran and Hirapur) still qualify for sodicsoils. Sakit soils which were sodic, after reclamationthey qualify for Haplustalfs. Similarly Haldi soils whichwere Mollisols, after about 25 years of cultivation theynow qualify for Typic Haplustalfs.
In view of classification of these soils, it is realized thatthe major pedogenetic processes in these soils duringthe Holocene are addition and depletion (Haldi soils)of organic carbon, formation of CaCO3, illuviation ofclay particles and argilli-pedoturbation. Majority ofthe soils indicate their micaceous mineralogy exceptinghowever in soils with vertic character. It is observedthat Vertisols (Chunchura) have smectitic mineralogyappears not to have originated from micaceousminerals. Had micas weathered to so much amount ofsmectite in Chunchura soils, then all other non-verticsoils could have also smectitic mineralogy. Theformation of Vertisols (Chunchura) and verticintergrade (Hanrgram, Konarpara, Madhpur, Sasanga,Mohanpur, Sagar) thus needs to be understood in viewof source area of the alluvium and the shifting of therivers. The Old Fluvial/Deltaic Plain includes theBhagirathi-Ajay Plain and Ajay-Silai Plain which trendalong the northwest-southeast direction. Most of the
rivers originate in the western highlands and flowsdown the gentle slopes. However, towards southernpart of Ajay-Silai Plain, the Dwarkeshwar, Silai andKasai rivers show an angular drainage pattern and theflood plains of most of the rivers are incised. Moreover,some rivers are currently flowing along the southernmargins of their flood plains. The Old Fluvial/DeltaicPlain also includes the Damodar Deltaic Plain whichlies between the Damodar river in the west and theHooghly river in the east. The Vertisols and verticintergrades are represented by this plain. The Damodarriver like other rivers stated above was flowing in theeasterly direction to meet Bhagirathi during themiddle of the 18th Century had since shifted its mouth12 km to the south. These rivers flow from the west tothe east draining the Rajmahal Trap area. The RajmahalTraps consist of 2000 feet of bedded basalts or dolerites,with about 100 feet of interstratified sedimentarybeds (intertrappean beds) of siliceous and carbonaceousclays and sand stones. The basalt is amygdaloidalfilled with chalcedonic varieties of silica, calcite,zeolites or other secondary minerals. The rivers flowingin the vicinity of Rajmahal Trap are perennial in natureand huge amount of smectites were formed presumablydue to higher rainfall. Therefore, in view of thegeomorphic history and similar nature of smectitesbetween Vertisols of Chunchura and Deccan basaltarea, it is most likely that Vertisols of Chunchura andvertic intergrades at other places in Bihar (Ekchari,Sarthua) and West Bengal (Hanrgram, Konarpara,Madhpur, Sasanga, Mohanpur and Sagar) have beendeveloped in the smectite-rich alluvium that has beencarried from the Rajmahal Traps by the rivers onceflowed towards the east and are flowing towardthe south in the Bay of Bengal. Soils with verticcharacter in Uttar Pradesh (Hirapur, Sakit) andPunjab (Dhadde) might have also received smectiteminerals as alluvium brought through riversoriginated at base-rich rocks. Details are not knownyet.
Weathering of micas, especially of biotite wassubstantial. Preferential movement of weatheredproducts of biotite (trioctahedral expanding minerals)resulting in decreasing trend of clay mica is a sure testof clay illuviation, even when clay skins are absent.Clay illuviation in soils of the IGP has not alwaysresulted in clay skins or, where present, in pure void
Division of Soil Resource Studies
Annual Report2009-10 17
argillans. Instead impure clay pedofeatures (ICPFs)are typical in these soils because of impairment ofparallel orientation of clay platelets, a specific processdifferent from those described so far for the genesis ofless-oriented void argillans. The presence of ICPFs insoils with vertic character brings out a fact that theclay illviation is a more important pedogenetic processthan argilli-turbation. Presence of pedogenic carbonates(PC) in soils (except Seoraguri soils) indicates thatilluviation of clay particles and their subsequentaccumulation in the Bt horizons of soils, especially ofdry climate (HT, SAD, SAM, SHD & SHM) haveoccurred in a favourable pH condition higher than thezero point of charge required for full dispersion of clay,caused by the precipitation of soluble Ca2+ ions asCaCO3. This discounts any role of soluble Ca2+ ionsand the presence of CaCO3 in preventing the movementand the accumulation of clay particles. The presenceof compound clay pedofeatures (CCPF) bears thetestimony to this fact. Thus the formation of ICPF andPC are two pedogenetic processes occurringsimultaneously in soils of the IGP as contemporarypedogenetic events and may act as an example ofpedogenic threshold in both dry and wet climates sincethe last 5000 yr BP.
Evidence of climate change and neotectonics
Fluvial landforms and alluvial sediments in the IGPare important Quaternary continental records, whichhold potential for the examination of climatic, tectonicand lithological controls over their formation. Inresponse to the global climatic event during theQuaternary, the IGP too witnessed climaticfluctuations, especially in the last post-glacial period.Frequent climatic changes occurred during theQuaternary. This paleoclimatic record has beendocumented from the NW and SW parts of India.Climatic variations has also been inferred fromHolocene soils.
Presence of non-pedogenic carbonates (NPC) in soilsof both dry and wet climates indicates its pedorelictfeatures. The 14C dates of carbonate nodules studiedby some authors indicate that soils with Fe-Mn coatedglaebules are older than those with white glaebules(PC). PCs are generally formed in dry climates,
suggesting the NPCs were formed in a climate muchwetter than the present, which ensured adequate soilwater for reduction and oxidation of iron andmanganese to form Fe-Mn coatings. During this time,the formation of kaolin as kaolinite-interstratifiedminerals of kaolinite and HIV/HIS might have occurredas the transformation of vermiculite and/or smectiteto kaolin requires much wetter climate. The formationof ICPF and especially CCPF amidst the formation ofPC however indicates the occurrence of dry phasein the climate when the clay illuviation was mostactive.
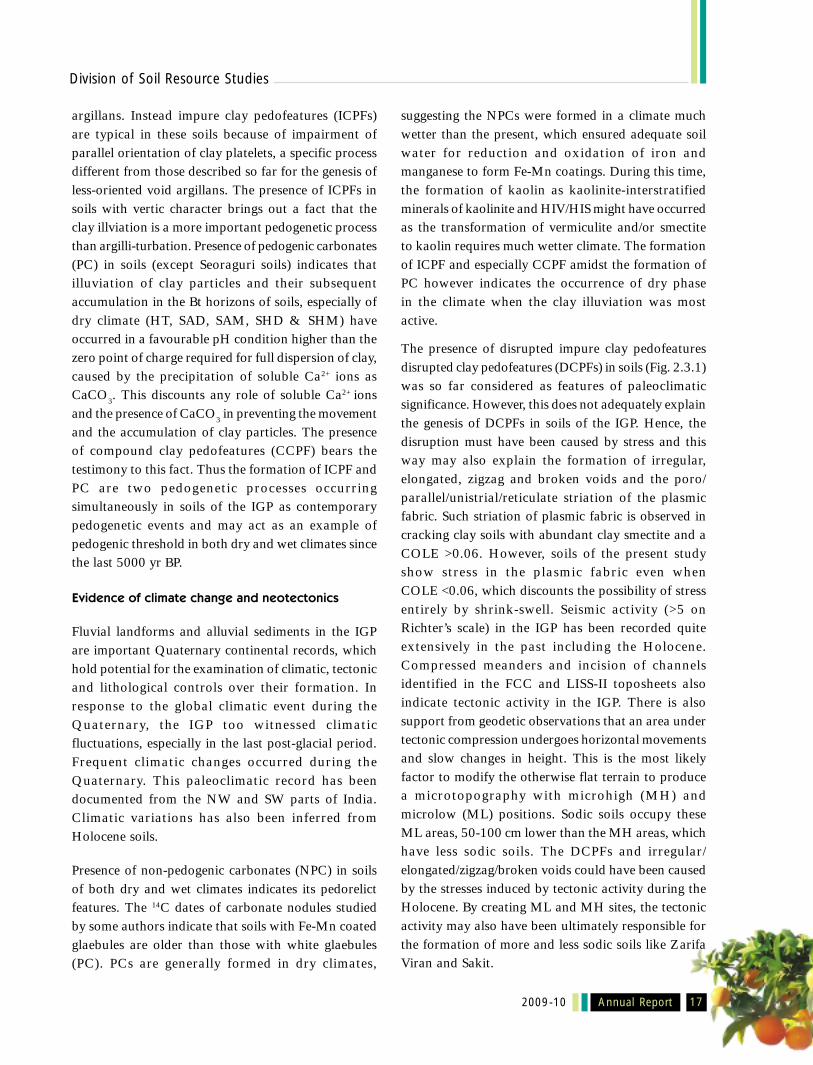
The presence of disrupted impure clay pedofeaturesdisrupted clay pedofeatures (DCPFs) in soils (Fig. 2.3.1)was so far considered as features of paleoclimaticsignificance. However, this does not adequately explainthe genesis of DCPFs in soils of the IGP. Hence, thedisruption must have been caused by stress and thisway may also explain the formation of irregular,elongated, zigzag and broken voids and the poro/parallel/unistrial/reticulate striation of the plasmicfabric. Such striation of plasmic fabric is observed incracking clay soils with abundant clay smectite and aCOLE >0.06. However, soils of the present studyshow stress in the plasmic fabric even whenCOLE <0.06, which discounts the possibility of stressentirely by shrink-swell. Seismic activity (>5 onRichter’s scale) in the IGP has been recorded quiteextensively in the past including the Holocene.Compressed meanders and incision of channelsidentified in the FCC and LISS-II toposheets alsoindicate tectonic activity in the IGP. There is alsosupport from geodetic observations that an area undertectonic compression undergoes horizontal movementsand slow changes in height. This is the most likelyfactor to modify the otherwise flat terrain to producea microtopography with microhigh (MH) andmicrolow (ML) positions. Sodic soils occupy theseML areas, 50-100 cm lower than the MH areas, whichhave less sodic soils. The DCPFs and irregular/elongated/zigzag/broken voids could have been causedby the stresses induced by tectonic activity during theHolocene. By creating ML and MH sites, the tectonicactivity may also have been ultimately responsible forthe formation of more and less sodic soils like ZarifaViran and Sakit.
a. Clay pedofeatures, stretched and broken in Dhadde soils (Pedon 9,122-130cm), Punjab.
b. Impure clay pedofeatures (pf) coated over calcitic pf in unistrial bfabric in Dhadde soils (Pedon 9,122-130cm), Punjab.
c. Crenulations in pedogenic carbonates in Sakit soils (Pedon 12,54-62cm), Uttar Pradesh (U.P.).
d. Zig-zag voids in Simri soils (Pedon 15, 108-116cm), U.P.
e. Pygmatic folding in Simri soils (Pedon 15,108-116 cm), U.P.
f. Papules and zig-zag voids in Belsar soils (Pedon 16, 93-101cm), Bihar.
g. Elongated voids in Sarthua soils (Pedon 18, 106-114cm), Bihar.
h. Offsetting in argillans of Sarthua soils (Pedon 18, 106-114cm) Bihar.
i. Compressed argillans in Sarthua soils (Pedon 18,106-114cm) Bihar.
j. Elongated voids in Konarpara soils (Pedon 23, 19-27cm), West Bengal.
k. Broken clay pedofeature voids in Konarpara soils (Pedon 23,19-27cm),West Bengal.
l. Pinch and swell voids in Mohanpur soils (Pedon 27, 82-88cm), West Bengal.
Division of Soil Resource Studies
Annual Report2009-10 19
Degradation of soils and sustainability of rice-wheatcropping system
Soils under study had low organic carbon due to highrate of decomposition. In addition, the managementinterventions of the National Agricultural ResearchSystems (NARS) has caused depletion of soil organiccarbon in erstwhile Mollisol (Haldi soils). The adverseclimatic condition and excessive use of well/deep tubewell waters induce precipitation of CaCO3, therebydepriving the soils of Ca2+ ions on the soil exchangecomplex with a concomitant development of sodicityin the subsoils (Hirapur, Ghabdan, Sakit and ZarifaViran soils). The subsoil sodicity impairs the hydraulicconductivity (sHC) of soils. The impairment ofpercolative moisture regime provides an example of asoil where gains exceeds losses. This self-terminatingprocess leads to the formation of sodic soils withexchangeable sodium percentage (ESP) decreasing withdepth. After reclamation with gypsum some sodic soils(Sakit) classified earlier as Typic Natrustalfs, now areOxyaquic Vertic Haplustalfs. Formation of PC, a basicprocess initiating the development of sodicity, shouldbe considered as a basic and natural process of soildegradation. It is noticed that despite being non-sodic,many of the soils have sHC <10 mm/hr. Impairment ofsHC in such soils may possibly be attributed to theincrease in bulk density (BD) in the subsoil layers. Toproduce bumper rice, wheat and potato crops, thesesoils under cultivation for the last 3 decades used allmodern agricultural implements and irrigation. The risein BD in subsoils may thus possibly be due to thecompaction caused by implements used for cultivation.This situation, however, may be helping in maintainingyield of rice in rainy season and also in sequesteringmore soil organic carbon under sub-merged condition.But the yield of the subsequent crop like wheat is eitherplateuing or declining due to restriction of entry of airand water in the subsoils. Comparison of the data setsfor 1980, 2005 and 2010 indicate an overall increasein soil organic carbon (SOC) stock in these benchmarkspots under agriculture for more than two and a halfdecades. Although the level of soil inorganic carbon(SIC) has increased indicating an initiation of chemicaldegradation mainly in the wetter climates. Soildegradation in terms of development of sodicity in dryparts and also the rise in SIC and BD inspite of improvedof SOC sequestration in such areas is a matter of seriousconcern. This warrants a fine-tuning of the existingmanagement interventions the high crop productivityregions especially the north-west parts of the IGPfollowing intensive rice-wheat cropping pattern.
In view of stagnating food grain production, themaintenance of the national buffer stock has
become more dependent on the countributions by thestates with high crop productivity regions. Thus otherstates of the IGP deserve immediate attention so as toavoid the pitfalls encountered in the high productivityregions.
2.3b. Genesis and classification ofbenchmark ferruginous soils of India
P. Chandran, S.K. Ray, T. Bhattacharyya,D. K. Pal and D. Sarkar
Ferruginous soils of Karnataka state developed fromtwo different parent materials were studied for chemicalas well as mineralogical properties to understand thegenesis of these soils.
The Vijaypura soils (Bangalore) are presently insub-humid dry ecosystem and formed from granite-gneiss whereas Jamakhandi (Bijapur dist) soils aredeveloped in the valleys filled in alluvium of sandstoneand quartzite under semi-arid climate. Morphologicalproperties indicate that the Vijaypura soils are redwith 2.5 YR hue have sandy loam to sandy clay texturewith well developed argillic horizons whereasJamakhandi soils are reddish brown in colour (5YRhue).
Vijaypura soils are very strongly to moderately acid(pH: 4.6-5.6) with low organic carbon of 0.1 to 0.8%and CEC of 4.6 - 5.5 cmol(p)kg-1. In contrast, the soilsof Jamkhandi are moderately to strongly alkaline(pH 8.1 to 8.6), medium in organic carbon and highin CEC (15 to 32 cmol p(+)kg-1) with depth wiseincreasing CaCO3. These soils have base saturation>65% and dominance of Ca2+ ions on the exchangecomplex followed by Mg, Na and K. Well developedargillic horizons and high base saturation werereasons for grouping these soils in the subgroups ofAlfisols.
X-ray diffraction studies indicate that kaolinite is thedominant mineral in all the size fractions of Vijaypurasoils followed by small amounts of mica, whereas thesoils of Jamakhandi are dominated by smectite, micaand kaolin along with feldspar. The behaviour of the0.7nm peak to K-treatment and heating indicate thatthis mineral is interstratified with smectite. Fine claysmectites of the Bijapur soils are of both high and lowcharge density.
The climate and geomorphic history of the landscapeplayed an important role in weathering and mineraltransformation in these soils. The presence of discretekaolinite, and absence of feldspars and other 2:1mineral in Vijaypura soils indicate that these soils were
Annual Report20 2009-10
Research Achievements
developed on stable plateau surface in an earlier humidtropical climate. However, in the Jamkhandi soilsdeveloped in valley fills the presence of kaolin mineralis indicative of earlier humid climate and the presenceof smectite and CaCO3 indicates the change of climateto arid in the recent past.
Thus it is clear that research endeavours in soil scienceis required to unravel the geomorphic and climatichistory of the landscape wherein soils are beingdeveloped. Such studies are indicative of polygenesisof soils that has relevance in managing their nutritionand irrigation requirements.
The analytical work of the project has been completed.The data is being compiled and interpretation ofthe result and the writing of project report is being done.
2.3c. Detailed Resource Soil Survey ofHayatnagar Research Farm of CRIDA,Hyderabad
P. Chandran, S.K. Ray, P. Raja, U.K. Maurya,S.L. Durge, A. M. Nimkar, D. K. Pal,T. Bhattacharyya, C. Mandal, M.S.S.Nagaraju and D. Sarkar
This project was initiated as per the request from theDirector, CRIDA, Hyderabad to generate detailed soilinformation to carryout field experiments.
The farm was surveyed on 1:5000 scale using IKONOSimagery received from CRIDA. The soil map wasfinalized. The soils of the farm are shallow to deep,red, sandy loam to clay textured with well developedargillic horizon. These soils are developed fromgranite gneiss. The truncated soils have a thin A horizonand clay enriched B horizon with well developedargillans.
The laboratory analysis of the samples has beencompleted. The bulk density of the soils varies from 1.4to 1.9 Mg m-3. Available water content of the soil is lowand ranges from 2.46 to 12.0%. EC of the soils are low.The calcium carbonate content varies from 0.8 to 8.5%.
The soils have high ESP in subsurface layers. This maybe due to the prevailing aridic climate where incarbonate is precipitated from soil solution and therelative proportion of Na in the exchange sample isincreasing. CEC of the subsoils are relatively highindicating the presence of active group of minerals. Thestatus of micronutrients DTPA (Cu, Zn, Fe, Mn)indicate that majority of the surface soils are deficientin Zn (<0.5 mg/kg) but adequate in Cu, Fe and Mn.
Mineralogy: The silt and total clay fractions of the soilswere subjected to X- ray diffraction analysis to identifythe minerals present. X-ray diffraction patterns of theCa-saturated samples of silt fraction (Fig. 2.3.2) indicatea dominant peak at 1.0 nm followed by 0.7 nm and1.4 nm along with the peaks at 0.42nm and 0.32 to0.31 nm. On glycolation, the 1.4 nm peak expands to1.7 nm indicating the presence of swelling type minerali.e. smectite. On K treatment, the 1.4 nm peakdisappears and reinforces the 1.0 nm peak indicating ahigh-charge smectite. The intensity of the 1.0 nm peakof mica decreases slightly on glycolation indicating thatthe interstratifications of 1.0 nm and 1.4 nm mineral.This is more prominent in the fine clay fractions. Thepersistence of 0.7 nm peaks in glycolated samples andits collapse after heating at 5500C indicate the presenceof kaolin. However, the 0.7 nm peak is branched at itstip and has a broad base stretching towards the lowangle side. This clearly indicates that this mineral isnot a true kaolinite but interstratified with 2:1 mineral.The small peaks at 0.32 to .031 indicate the presenceof feldspars.
Fig. 2.3.2. Diffraction pattern of silt (Bt horizon) fraction.(Ca=Ca saturated; Ca-EG=Ca-saturated and ethylene-glycolsolvated, K25, 110,300 and 500 are K-saturated and heatedat 25,110,300 and 500oC respectively; Sm=smectite; M=mica;K=kaolin, Q=quartz, F=feldspars)
The X-ray pattern of the clay fraction (Fig. 2.3.3)indicates the presence of mica (1.0 nm), and kaolin(0.7 nm) along with small amount of 1.4 nm mineral.The 1.4 nm peak on glycolation shifts entirely to1.7 nm indicating the presence of smectite. On Ktreatment and subsequent heating, this peak disappearsand reinforces the 1.0 nm peak. This confirms that1.4 nm mineral is a smectite. The decrease in intensitiesof 1.0 nm and 0.7 nm peaks on glycolation indicatethat the mica and kaolin are interstratified with swellingtype of minerals. This is more prominent for 0.7 nm
Division of Soil Resource Studies
Annual Report2009-10 21
mineral than the 1.0 nm minerals. The presence of0.7 nm minerals interstratified with 1.4 nm minerals ismore common in the ferruginous soils of India.
Fig. 2.3.3. Diffraction pattern of total clay (Ca=Ca saturated;Ca-EG=Ca-saturated and ethylene-glycol solvated, K25,110,300 and 500 are K-saturated and heated at 25,110,300and 500oC respectively; Sm=smectite; M=mica; K=kaolin,Q=quartz, F=feldspars)
Thus the morphological, physical, chemical andmineralogical properties clearly indicate that due totruncation of the soils developed in the earlier humidtropical climate, the present day soils are the relativelyunweathered part of the profile developed on granite-gneiss. Thus the present soils have a distinct advantagefrom the resource point of view and are better placedin terms of water and nutrient management
2.3d. Development of protocols fordigestion, standards and methods todetermine elements in soil andsediments using Inductively CoupledPlasma Spectrometry (ICP-AES).
S.K. Ray, P. Chandran, T. Bhattacharyya,P.L.A. Satyavathi, D.K. Pal, S. G. Anantwarand P. Raja,
Microwave digestion of soil samples
One of the objectives of the project includes preparationof digestion protocols for analysis in the ICP. We triedthis experiment with Si using the following methodology.
1.0 ml of standard 10.000 ppm solution of silica,0.0540 gm SiO2 (A.R. grade) and 5 ml of claysuspension of known weight were weighed into thedifferent teflon vessels (bombs) of the microwavedigestor. Then 4 ml of HF solution (48%) and 2 mlHClO4 solution (70%) were added to each Teflon vesseland then digested in a microwave digester system usingfollowing programme (Table 2.3.1).
Table 2.3.1 Programme for digestion of siliconand other clay samples in a microwave
After cooling at air temperature (with the lids closedintact), all teflon vessels were kept in fridge for 24 hoursin order to condense the SiF4 vapours. Then 4% boricacid solution was added and digested in the microwavedigestor using the same above programme. After cooling,the contents of the teflon vessel was quantitativelytransferred to 100 ml plastic volumetric flask anddiluted to the mark with double distilled water.
Analysis on ICP
These extract were read on ICP (Prodigy) (TeledyneLeeman Labs Prodigy High dispersion ICP) for Sifollowing instrument operating conditions shown intable 2.3.2.
Maximum plasma position was fixed by using a 10ppm Mn standard automatically selected by theProdigy’s software (Salsa). After ignition of the plasma,the ICP was calibrated using 2, 6 and 12 ppm Sistandard solution and the matrix of the standards werematched to calibrate the standards. Single elementstandards for Si was used for calibration of the element.
Analysis of high solid containing solution on ICP
Solutions containing high solids and organic extractswere tested on the ICP. High solids include 0.25 NEDTA solution. The high Na in this extract posesproblem of spattering of the plasma and ultimately itis put off. A v-groove nebulizer is used for the purposeto enable least obstruction. The EDTA extracts wereanalysed for Fe, Al, Mg, Ca and K. Standards wereused with same concentration of EDTA.
Annual Report22 2009-10
Research Achievements
2.3e. Ascertaining the pedogeneticprocesses for the clay enriched Bsshorizons of Vertisols
P.L.A. Satyavathi, S.K. Ray, P. Chandran,P. Raja, S.L. Durge and D.K. Pal
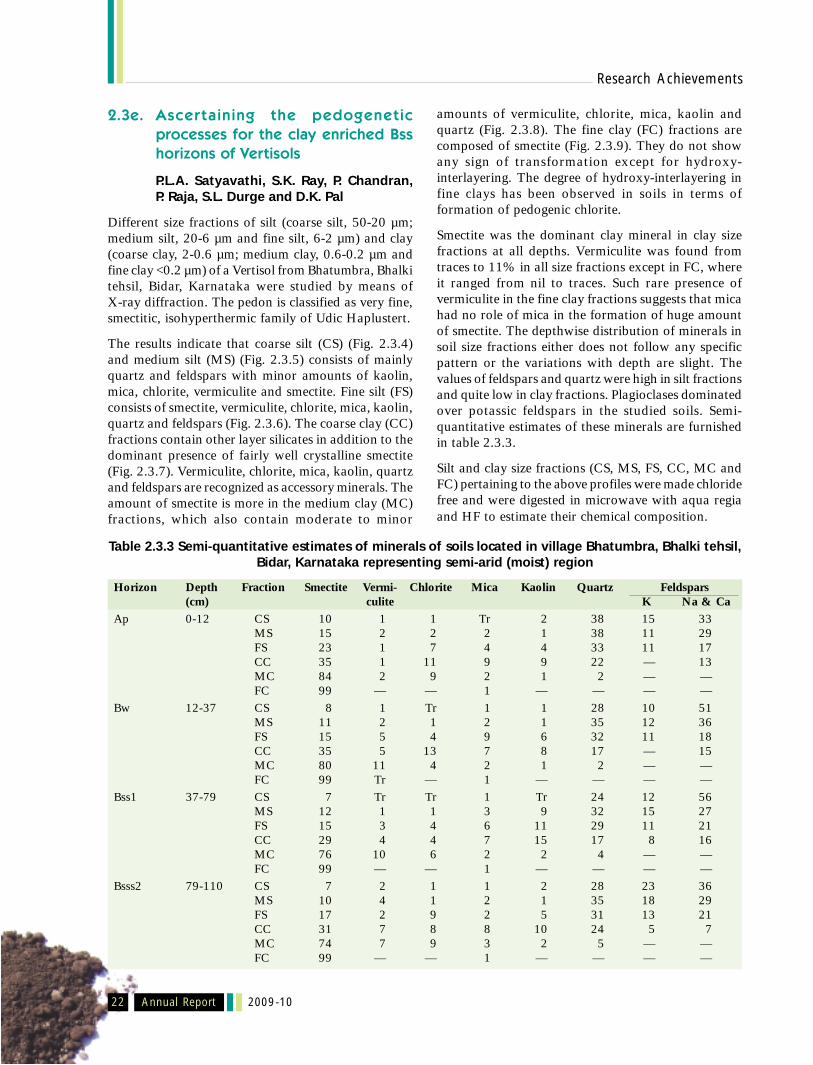
Different size fractions of silt (coarse silt, 50-20 µm;medium silt, 20-6 µm and fine silt, 6-2 µm) and clay(coarse clay, 2-0.6 µm; medium clay, 0.6-0.2 µm andfine clay <0.2 µm) of a Vertisol from Bhatumbra, Bhalkitehsil, Bidar, Karnataka were studied by means ofX-ray diffraction. The pedon is classified as very fine,smectitic, isohyperthermic family of Udic Haplustert.
The results indicate that coarse silt (CS) (Fig. 2.3.4)and medium silt (MS) (Fig. 2.3.5) consists of mainlyquartz and feldspars with minor amounts of kaolin,mica, chlorite, vermiculite and smectite. Fine silt (FS)consists of smectite, vermiculite, chlorite, mica, kaolin,quartz and feldspars (Fig. 2.3.6). The coarse clay (CC)fractions contain other layer silicates in addition to thedominant presence of fairly well crystalline smectite(Fig. 2.3.7). Vermiculite, chlorite, mica, kaolin, quartzand feldspars are recognized as accessory minerals. Theamount of smectite is more in the medium clay (MC)fractions, which also contain moderate to minor
amounts of vermiculite, chlorite, mica, kaolin andquartz (Fig. 2.3.8). The fine clay (FC) fractions arecomposed of smectite (Fig. 2.3.9). They do not showany sign of transformation except for hydroxy-interlayering. The degree of hydroxy-interlayering infine clays has been observed in soils in terms offormation of pedogenic chlorite.
Smectite was the dominant clay mineral in clay sizefractions at all depths. Vermiculite was found fromtraces to 11% in all size fractions except in FC, whereit ranged from nil to traces. Such rare presence ofvermiculite in the fine clay fractions suggests that micahad no role of mica in the formation of huge amountof smectite. The depthwise distribution of minerals insoil size fractions either does not follow any specificpattern or the variations with depth are slight. Thevalues of feldspars and quartz were high in silt fractionsand quite low in clay fractions. Plagioclases dominatedover potassic feldspars in the studied soils. Semi-quantitative estimates of these minerals are furnishedin table 2.3.3.
Silt and clay size fractions (CS, MS, FS, CC, MC andFC) pertaining to the above profiles were made chloridefree and were digested in microwave with aqua regiaand HF to estimate their chemical composition.
Table 2.3.3 Semi-quantitative estimates of minerals of soils located in village Bhatumbra, Bhalki tehsil,Bidar, Karnataka representing semi-arid (moist) region
Horizon Depth Fraction Smectite Vermi- Chlorite Mica Kaolin Quartz Feldspars(cm) culite K Na & Ca
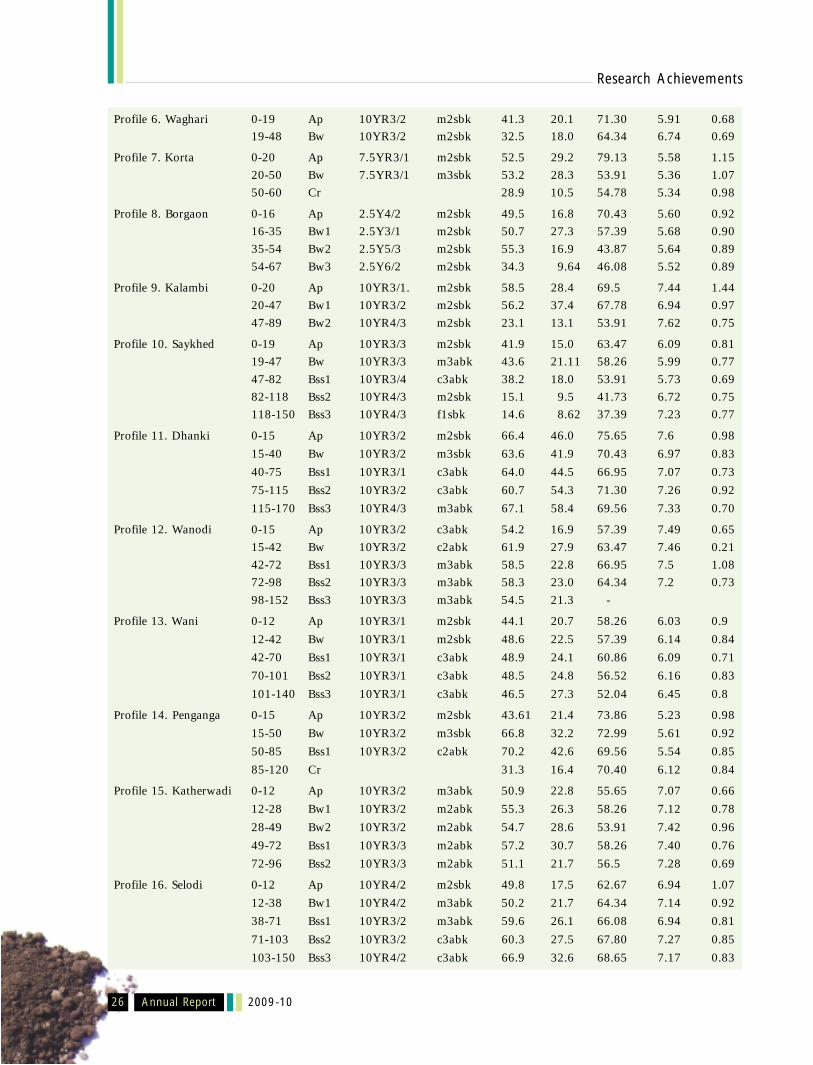
B.P. Bhaskar, M.S. Gaikwad, S.V. Bobadeand S.S. Gaikwad
A soil database of Yavatmal district on 1:50000 scalewas generated to evaluate the ability of land units tosupport cotton production. Soil and a topographic mapwere combined to provide information on spatialvariability of soils, terrain type and land use. The lowregional cotton yields require relooking into the crop -
soil management program with the knowledge of sitevariables that affect cotton yield. 10.1 lakh hectares(74% of total area) of area covered duringReconnaissance survey of reporting period andidentified 28 soil series. 39 soil mapping units (Seriesassociation) are derived to generate soil map. Out of28 identified soil series, 16 soil series are described andpresented selected morphological, particle size andchemical properties in tables 2.3.4 and 2.3.5. Thesesoils are classified upto family level in the soil ordersof Entisols, Inceptisols and Vertisols.
Table 2.3.4 Selected morphology, clay, CEC and DTPA extractable iron and zinc contents in soils
1. Moho series is a member of loamy, mixed,hyperthermic, family of Typic Ustorthents. This soilhas dark yellowish brown (7.5YR 3/2), neutral,sandy clay loam A horizons and dark reddish brown(5YR3/2) AC horizons with partially weatherdbasaltic Cr horizons. These soils are moderatelyshallow, excessively drained and mostly occur on steepslopes (15 to 30 per cent slopes) under thin tomoderately dense mixed forest cover of teak, yen, tendu,bharati and palas. Ca(23 to 26 cmol(+)kg-1) isdominanat cation on exchange complex followed byMg(13 to 17 cmol+kg-1) and potassium (0.28 to0.31cmol(+)kg-1).
Soil series of Inceptisols
Eight soil series are classified in the subgroups ofInceptisols viz. Lithic Haplustepts (Dhanora andJamwadi series), Typic Calciustepts (Arunavathi andPandhurna soil series), Typic Haplustepts (Waghari,Korta and Borgaon series) and Vertic Haplustepts(Kalambi series).
Dhanora and Jamwadi Series are members of fine,mixed, hyperthermic, calcareous, family of LithicHaplustepts. These soils have very dark grayish brown(10YR 3/2), moderately alkaline in dhanora series butmildly alkaline in Jamwadi series, clayeyA horizons andvery dark grayish brown (10YR 3/2, in Dhnora series)to very dark gray(10YR3/1, Jamwadi series), clayey,cambic B horizons. These soils have exchangeable Camore than 40 cmol(+)kg-1 and high exchangeable K(0.35 coml(+)kg-1 with a lithic contact within 50 cm.These soils are used for jowar, cotton, redgram andsoybean cultivation.
Arunavati and Pandhurna series are members of fine,smectitic, hyperthermic, calcareous family of TypicCalciustepts. These soils have brown (10YR 4\3) ordark brown (10YR 3/3) clayey A horizons and darkbrown(10YR 3/3) clayey to very dark brown (10YR 2/2) clayey B horizons. Arunavati series is stronglyalkaline where as pandhurna series is slightly alkalinewith low electrical conductivity and high exchangeableCa of 49 to 74 cmol(+)kg-, Mg of 7 to 12 cmol(+)kg-1
and medium amounts of exchangeable K(0.25 to 0.17cmol(+)kg-1). Arunavati is deep but pandhrna series isvery deep and occurs mostly in flood plains of Pus andPenganga river. These soils are used for jowar-cotton-redgram during kharif, wheat, bengal gram in rabi andgroundnut in summer.
Waghari, Korta and Borgaon series are members offine, mixed, montmorillonitic, hyperthermic,calcareous, family of Typic Haplustepts where as Kortaseries is a member of clayey, mixed, hyperthermic familyof Typic Haplustepts. Waghari series has very darkgrayish brown (10YR 3/2), clayey A horizons and verydark grayish brown (10YR 3/2 M), clayey B horizonwhere as Borgaon series has grayish brown (2.5Y 5/2),clayey, A horizons and very dark gray (2.5Y 3/1 ),clayey to light brownish gray (2.5Y 6/2 ), gravely claye,B horizons and Korta series has very dark gray (7.5YR3/1) clay A and B horizons. Moderately deep Korta seriesdeveloped over granite is mildly alkaline whereasshallow Waghari and deep Borgaon on basalt aremoderately to strongly alkaline with low electricalconductivity and high exchangeable Ca and Mg. Thesesoils are well drained and found on upper pediplainshaving 3-8 per cent slopes. These soils are mostly underthe cultivation of cotton, redgram, wheat, sugarcaneand groundnut.
Kolambi series is a member of fine, smectitic,hyperthermic family of Vertic Haplustepts. This soilhas very dark gray (10YR 3/1) clayey A horizons andvery dark grayish brown (10YR 3|2 ) clayey B horizonspossessing wedge shaped shiny pressure faces on pedsurfaces. This soil is moderately deep, well drained andoccur on moderately eroded middle plateaus having 3to 5 per cent slopes. They are mostly under cultivationof jowar and cotton.
Soil Series of Vertisols
Seven soil series are classified in the subgroups ofVertisols viz. Typic Haplusterts( Saykheda, Dhanki andWanodi series), Leptic Haplusterts(Penganga series) andSodic Haplusterts (Katharwadi and Selodi series).
Saykheda, Dhanki, Wanodi(on basalt) and Wani (onsandstone) series are members of is fine,montmorillonitic, hyperthermic, calcareous family ofTypic Haplusterts These soils have dark brown (10YR3/3) clayey; A horizons and dark brown (10YR 3/3)clayey to dark yellowish brown (10YR 3/4) and brown(10YR 4/3 D) B horizon. These soils have mildlyalkaline Ap horizons with moderately alkaline cambicand slickensided horizons. These soils generally foundon gently sloping middle plateau tops of basalticlandscapes at an elevation of 380 to 420m above meansea level. Only patches of plateaus are under thecultivation of pigeon pea, soybean and jowar.
Penganga series is a member of fine, smectitic(calcareous), hyperthermic family of Leptic Haplusterts
Annual Report28 2009-10
Research Achievements
cont...
This soil has very dark grayish brown (10YR3/2) clayA horizons and. very dark grayish brown (10YR3/2)clay B horizon underlain by Cr horizon. This soil ismoderately deep and moderately well drained.. Thissoil is found on gently to moderately sloping alluvialplains having slopes of 3 to 8 per cent at an elevationof 300 to 420 m above mean sea level. The soils havemoderately developed strongly slickensides zone within1meter and are mostly cultivated to cotton, jowar, bajra,pigeonpea and soybean in kharif and occasionally towheat, gram, sugarcane in patches under irrigation.The natural vegetation comprises of thin to moderatelydense mixed forest with teak, salai, ber, tembhi, mahua,neem, and palas in upper plateaus. In southern part ofYavatmal (Ralegaon and Hirni areas), these soils occuron stony phase.
Kather wadi and Selodi series are members of fine,montmorillonitic, hyperthermic, calcareous family ofSodic Haplusterts. These soils have very darkgrayish brown (10YR 3|2 M), clayey A horizons andvery dark grayish brown (10YR 3|2 M), clayey, withwell expressed slickensides and sodium enrichedstrongly alkaline B horizons. These soils are very deepand moderately well drained. They occur on alluvial
upper pediplains with slopes of 3-8 per cent. Theyare mostly under cultivation of jowar, cotton andpigeon pea.
2.3g. Reconnaissance soil survey, mappingand classification of soils of Jabalpurdistrict, Madhya Pradesh
Jagdish Prasad and A.M. Nimkar
Jabalpur district with TGA of 519700 ha is situatedbetween 22o49’ to 24o81’ N and 78o21’ to 80o50’ E.Although the district is associated with diversegeological formations, the soils in general do reflectthe geology and majority of soils are shrink-swell innature owing to sediments running from high basalticplateaux to lower elements of topography. In general,high plateau has been reported to have 14-22 flows oftraps. A total of fifty four soil series were identifiedbut after correlation only forty two have been retained.There were twenty three physiographic units and theseunits were mapped with twenty one soil seriesassociation.
The soil series, their taxonomy (family level) and theirland use have been shown in the table 2.3.6.
Table 2.3.6 Soil physiographic relationship
Soil series association Taxonomy (at family level) Land use
Upper Vindhyan Cuddapah System & Bijawar series Upper Precambrian Gondawana Supergroup and Lameta beds ofCretaceous and Laterites of Quarternary (Dolomite, metabasics, metalawa, shale, sandstone, conglomerate, limestone,clay etc.)
The occurrence of clayey-skeletal Vertic Haplusteptson moderately steep slope (15-30%) having a depth of56 cm underlain by weathered basalt and stones, clay
content (50-54%), surface stoniness (40-75%), fine andcoarse gravels (15-25%) and stones (10-20%), as anunique soil, encountered during survey.
Annual Report30 2009-10
Research Achievements
2.3h. Development of a soil water balancemodel for shrink-swell soils of CentralIndia
P. Tiwary, D. K. Mandal and T. N. Hajare
Out of 62 soil profiles, the number of soil profiles usedfor developing PTFs was 39 with 200 layer observationsin case of water retention and 54 with 230 layerobservations for saturated hydraulic conductivity.Initially, based on the cause and effect relationship,correlation coefficient between the dependent variableand independent variables, and F values, the soilparameters viz. silt, clay, pH, organic carbon, CaCO3,exchangeable sodium percentage (ESP), exchangeablemagnesium percentage (EMP), exchangeable calciumpercentage (ECP) and Ex. Ca/Mg were selected aspredictor variables for developing PTFs. These soilparameters greatly influence the movement of soil waterand water retention characteristics of a soil.
Using the step-wise regression and test of significancein SPSS, multiple regression models were developed asPTFs for estimating saturated hydraulic conductivityand water retention at 33 kPa and 1500 kPa. The soilparameters used as predictor variables in pedo-transferfunctions are given in table 2.3.7.
Table 2.3.7 Predictor variables used in PTFs and R2
PTF Predictor variables R2
Water retention at 33 kPa Clay and ECP 0.51Water retention at 1500 kPa Clay and ECP 0.56Saturated hydraulic Clay, pH and Ex. Ca/Mg 0.61conductivity
2.3i. Characterization and evaluation ofcarbon (SOC) and sulphur status insoybean growing areas of Dhardistrict, Madhya Pradesh tosuggest an alternate croppingpattern
K. Karthikeyan, Jagdish Prasad, Pushpanjaliand Dipak Sarkar
After having a detailed ground truth verification of thesoybean growing areas of Dhar district, MadhyaPradesh, three window areas have been marked basedon its concentration and its intensity of soyabeancultivation. The whole district comes under twophysiographic units i.e., Malwa plateau and Nimadvalley, of which Malwa plateau has more areaunder soybean crop particularly in three tehsils viz.Sardarpur (58,500 ha), Badnawar (55,000 ha) andDhar (43,315 ha).
Three window areas were demarcated in the abovementioned tehsils i.e. Sardarpur, Badnawar and Dhar.Seven soil profiles were studied based on thephysiographic variations as well as the soybeanconcentrations in the Malwa regions. Surface sampleswere also collected at regular interval from the windowareas to have a depletion pattern of the sulphur andthe organic carbon in the soybean growing areas.Physical and chemical analysis of these samples are inprogress. Evaluation of alternate cropping pattern isalso being worked out.
Geographical Information System (GIS)
Annual Report2009-10 31
2.4a. Design and development of spatialsoil database and analysis in GIS
A.K. Maji, G.P. Obi Reddy and SunilMeshram
The project aimed to generate the spatial database ofsoils at 1:250,000 scale for different states in thecountry. Soil information of states generated earlier on1:500,000 scale were redigitized on a uniform scale of
GeographicalInformation System (GIS)
1:250,000 using SOI toposheets of the same scale asthe base in the GIS environment. The state wise soilinformation for the whole country has been generated.Presently, the compilation of state wise soil informationis in progress in GIS to make the soil information ofIndia on 1:250,000 scale in a single file. Correctionsfor errors in line layer have been completed for all thestates except Jammu & Kashmir (Fig.2.4.1) and thework for finalization of database is in progress.
Fig. 2.4.1. Seamless maosaic soil resource database of India on 1:250,000 scale (in progress)
Annual Report32 2009-10
Research Achievements
District level soil information: The digital levelthematic information for agricultural planning on1:250,000 scale generated by clipping the statethematic maps based on the district boundary.
Various thematic maps of soil parameters likeslope soil depth and soil reaction (pH) generatedfor Thane district, Maharashtra has been depicted infig. 2.4.2.
Fig. 2.4.2. Soil information at district level for Thane district of Maharashtra
Geographical Information System (GIS)
Annual Report2009-10 33
2.4b. Digital maps of derived soil quality ofdifferent states of India
A.K. Maji, G.P. Obi Reddy and SunilMeshram
The technical report on “Acid Soils of India” alongwithmaps of 15 states showing the degree and areal
extent of acid soils has been submitted for review.The acid soil map of Chhattisgarh and ArunachalPradesh is shown in figure 2.4.3. The class wisedistribution of acid soils in these two states isshown in figure 2.4.4. The areal distribution ofacid soils in these states is reported in tables 2.4.1and 2.4.2.
Fig. 2.4.3 Acid soil maps of Chattisgarh and Arunachal Pradesh
Fig. 2.4.4 Distribution of acid soils in Chattisgarh and Arunachal Pradesh
Annual Report34 2009-10
Research Achievements
Table : 2.4.1 District wise area analysis of acid soils in Chhattisgarh state
Area Analysis of Acid Soils of Chhattisgarh State [District wise]
District Stongly acidic Moderately acidic Slightly acidic Non acidic Total
pH < 4.5 pH 4.5-5.5 pH 5.5-6-5 pH> 6-5
Area Area Area Area Area Area Area Area Area Area(sq.km) (%) (sq.km) (%) (sq.km) (%) (sq.km) (%) (sq.km) (%)
2.4c. Soil resource data and theirinterpretation for implementation ofriver link projects - Ken – Betwa riverlink project
A.K. Maji, G.P. Obi Reddy, S. Thayalan,M.S.S. Nagaraju and A.K. Barthwal
During the reporting year, the soil resource databasefor the Ken – Betwa river basin has been derived fromthe SRM maps of Madhya Pradesh and Uttar Pradesh.The seamless mosaic of master soil resource databasehas been generated for the area. The soil based thematicmaps like slope, soil depth, texture, parent materialand soil reaction ( pH ) were generated (Fig. 2.4.5).
Fig. 2.4.5 Thematic maps of Ken-Betwa River Basin
Annual Report36 2009-10
Research Achievements
2.5a. Generation of digital soil thematicmaps and preparation of soil atlas atnational level
C. Mandal, D.K. Mandal, T. Bhattacharyya,Jagdish Prasad, R. Srivastava and Associates
The project was initiated during 2003 and completedin Dec. 2009. The objective was to generate mapsrelated to different soils groups and thematic maps.
Cartography SectionThe digital maps generated in this project can begrouped into three parts i.e. maps of physical attribute,climatic attribute and soil attributes.
Some of the thematic maps (slope, soil drainage, soildepth class, black soil, red soil, sandy soil, dominantcropping system and net irrigated to total cropped area)generated in this project and their aerial distributionare depicted in fig. 2.5.1 to 2.5.4 and table 2.5.1 totable 2.5.4.
Fig. 2.5.1 Slope map of India
INDIASlope
Cartography Section
Annual Report2009-10 37
Fig. 2.5.2 Soil depth map of India
INDIASoil Depth
Annual Report38 2009-10
Research Achievements
Fig. 2.5.3 Soil drainage map of India
INDIASoil Drainage
Cartography Section
Annual Report2009-10 39
Fig. 2.5.4 Spatial distribution of black soil areas in India
INDIABlack Soil Region
Annual Report40 2009-10
Research Achievements
Table 2.5.1 Distribution of black soils in India(Area in ha.)
State Black Soils Dominant Black Soils Sub-dominant Black Soils Total
Total 25827141.1 61851594.42 8391030.32 96069765.84
Annual Report42 2009-10
Research Achievements
2.5b. Documentation and storing of mapsand photographs- concept of digitalmap library
C. Mandal, Pushpanjali, D.K. Mandal,Jagdish Prasad, T. Bhattacharyya,R. Srivastava and D. Sarkar
The project was initiated in January, 2009 to developa digital database system for storing and retrieval ofmaps and photographs and preparation of web basedlibrary for data transmission (Fig. 2.5.5).
The software and hardware required to run the projecthas been procured. Nearly 53 documents/maps havealready been segregated, scanned and image check andenhancement has been done.
Fig. 2.5.5 Execution process of digital map library –An overview
2.5c. Land resource inventory for farmplanning in Parseoni mandal ofParseoni taluk, Nagpur district,Maharashtra
Pushpanjali, K. Kartikeyan, C. Mandal, JagdishPrasad, J.D. Giri and Malathi Bommidi
To generate the site-specific database suitable for farmlevel planning, this project (pilot study) was taken inParseoni mandal of Parseoni taluk, Nagpur district,Maharashtra. Total area of Parseoni mandal is 16,493ha and it falls in AESR 10.2. The mean annual rainfallranges from 1000-1300 mm of which around 80 percent rainfall is in the month of July to September. Tworivers (Pench and Kanhan), flowing through Parseonierode uplands which is of serious concern. The problemof water logging and in turn sodicity in canal irrigatedarea is a common feature. A preliminary traverse ofvillages have been undertaken using Survey of Indiatoposheets (1:50,000) and cadastral maps to identifythe broad landforms and physiographic units occurringin the area and for verifying the boundaries (Fig. 2.5.6)
Fig. 2.5.6 Map of Parseoni mandal with village boundaries
Cartographic support: Agro-ecological regions ofUttar Pradesh
In collaboration with Uttar Pradesh Council ofAgriculture Research, Lucknow (UPCAR) the projectwas under taken. The project report along with themap was submitted to UPCAR (Lucknow). During thereporting period, AER map of the state was preparedshowing 18 regions within the state (Fig. 2.5.7). Themap shows AER with numerals (1,2,3 etc) and themapping unit within each delineated region has beenabbreviated eg. B4D1 indicating physiography (B), Soil(4), Bio-climate (D) and LGP (1).
Cartography Section
Annual Report2009-10 43
Fig. 2.5.7 Agro-ecological regions of Uttar Pradesh
Cartographic support: (Tobacco project)
Collaborative project was undertaken by National Bureauof Soil Survey and Land Use Planning, Nagpur and CentralTobacco Research Institute, Rajamundry to preparecomprehensive atlas showing the tobacco growing areasand soils, their production and productivity. The projecthas been completed and the atlas has been prepareddepicting the maps at state/district level and data basegenerated for tobacco development in India.
preparing Resource Atlas of Vidarbha region. Theregion has a total area of 97 lakh hectare covering11 district i.e. Buldhana, Amravati, Akola, Washim,Wardha, Yavatmal, Nagpur, Bhandara, Gondia,Chandrapur and Gadchiroli. Based on soil seriesdata (146 soil series), maps of different soil attributeshave been prepared. The other thematic maps has beengenerated using the socio-economic data in GISenvironment. Database generated for surfacesoil (0-30 cm) properties and maps of NPK status,organic carbon, pH maps have been prepared(Fig. 2.5.8).
UTTAR PRADESHAgro-Ecological Regions
Annual Report44 2009-10
Research Achievements
Fig. 2.5.8 Soil pH map of Vidarbha region, Maharashtra
Other miscellaneous work
As a centralized service centre the following work hasbeen undertaken:
Designing work of cover page
• Annual Report-2009-2010
• Agropedology
• Assessment of soil Loss for Priorization of sub -watersheds
• Soil Resource Atlas for Tobacco growing area ofIndia
• Perspective Land Use- Puducherry
• Soil Series of India
• Dharti 2008
• Mrida Darpan
• Soil Based Agro Technologies for LivelihoodImprovement
• Benchmark Soil Series of India
• Soil Survey Manual
• Soil Taxonomic Database of India and States
• Soil Survey Field Guide
• Study of the Drainage Morphology for Developmentof Water Resource of the Waghari River Cathment,Yeotmal Distt.
• ICAR Zonal Tournament 2010
Map redesigned for offset printing (CMYK Format inA0 Size)
• Soil Loss - (Uttarakhand)• Soil Loss - (Orissa)• Soil Loss - (Jharkhand)
VIDARBHASoil pH
Cartography Section
Annual Report2009-10 45
Prepared exhibition posters
• Fourteen Poster designed for printing ready formatfor flex printing for Delhi Exhibition (Nos. Finalart work).
• Nine Poster designed and printed for the differentnational and international seminar.
• Posters and Banner designed for different programmeand national festival celebrated by the Bureau.
• Designs prepared for different material likeInvitation card, Certificates, Banner, DisplayBoards etc. for ICAR Zonal Tournament 2010organized by the Bureau.
Brochure
• NBSS&LUP Publication
• Services Offered
Plotting and scanning
Total 69 maps (Ao size) were scanned and plotting wascarried pertaining to following:
• Soil loss maps of Orissa, Jharkhand andUttarakhand
• Soil map of Hayatnagar farm, Hyderabad• Maps of Vidarbha Soil Resource Atlas• Soils of seed farm Chuchura, West Bengal• Physiography map of Buldhana district• Soils of Hugli district, West Bengal
• Mauza maps of Devari tahsil, Bhandara
• Poster for different National and Internationalseminar
Other printing work
Total 4450 prints (A3 and A4 size) was carried outpertaining to following:
• Tobacco Atlas of India
• Agro-ecological regions of UP (draft report)
• Watershed development programme map (Rajkotand Dhule district)
• AESR, LGP, soil, bio-climate, crop feasibility mapsof Tamil Nadu state
• Soil series location in India
• Land Resource Atlas of West Bengal
• Field guide for soil survey
• Taxonomic database
• Soil Information System for Resource Managementas a case study
• Different media coverage regarding activities andachievement of NBSS&LUP
• Other miscellaneous work
Xeroxing
About 47922 copies (black & white) and 2736 colorXeroxing was done.
Annual Report46 2009-10
Research Achievements
2.6a.2.6a.2.6a.2.6a.2.6a. AAAAAgrgrgrgrgro ecological zo ecological zo ecological zo ecological zo ecological zones of Tones of Tones of Tones of Tones of TamilamilamilamilamilNNNNNaduaduaduaduadu
L.G.K. Naidu, S. Srinivas, A. Natarajan,S. Thayalan, V. Ramamurthy
Tamil Nadu state has been broadly divided into 5 majorland forms i.e. Nilgiris, South Sahyadri, Eastern Ghats,Tamil Nadu Uplands and Tamil Nadu Plains. TamilNadu plains have 2 distinct topographic situations,namely, Inland plains and coastal plains.
The weekly rainfall data collected from 130 stationswere used for assessing length of growing period. TheLGP was calculated using PET, soil available watercapacity and rainfall as per Thornthwaite and Mather(1955) and Higgins and Kassam (1981) model.
1) Nilgiris : Nilgiri hills are extension of WesternGhats and cover an area of 4000 Sq.Km inUdagamandalam and Coimbatore districts.Maximum elevation reaches upto 2700 M. Thesoils are deep to very deep, clayey and gravellyclay. Length of growing period ranges from210-270.
2) South Sahyadri : South Sahyadri is the southernpart of Western Ghats covering an area of 7500Sq. Km. encomposing part of Dindigul, Madurai,Tirunelveli and Kanyakumari districts all alongKerala state. Soils are shallow to moderately deep,with rocky phases and loamy to gravelly clay soils.Rainfall ranges from 900-1700 mm with LGPof >270 days.
3) Eastern Ghats: The Eastern Ghats are dissected intoisolated hill ranges trending north east, south westdirection in the northern parts of North Arcot,Dharmapuri and Erode districts. The elevationranges from 1100 to 1600m. Soils are shallow tomoderately deep, with rocky phases and loamy to
Regional Centre, Bangalore
clayey soils. The annual rainfall ranges from 750to 1000 mm and length of growing period rangesfrom 120-180 days and in small pockets ofShervory and Javadi hills, it exceeds > 240 days.
4) Tamil Nadu uplands: Tamil Nadu uplands coveran area of 40,000 Sq.km. with relief ranging from150 to 450 m. This landform encompasses northand central parts of the state covering parts ofNorth Arcot, Dharmapuri, Salem, Erode, Karur,Coimbatore and Dindigul districts. Soils aremoderately deep to deep gravelly loam to gravellyclay soils associated with cracking clay soils inpockets. Rainfall ranges from 600 to 1000 mm.Length of growing period varies from 120 to 180days in a large extent. There are few very drypockets in Coimbatore and Erode with LGP of <90 days.
5) Tamil Nadu plains: Tamil Nadu plains cover fromKannyakumari in the south to Thiruvallur in thenorth. Based on the geographic position, the plainsare further divided into
a. Northern plains: Northern plains coveringparts of Tiruchirapalli, South Arcot,Villupuram, Thiruvannamalai, North Arcotand Chengalpattu districts. Dominantly, soilsare moderately deep to deep, gravelly loam togravelly clay soils and also deep to very deep,clayey soils in Perambalur and Villupuramdistricts. Rainfall varies from 750-1500mmwith LGP ranging from 150 to 210 days.
b. Southern plains: The southern plains cover thedistricts of Pudukottai, Sivaganga, Easternparts of Madurai and Western parts ofThanjavur, Tuticorin and Ramanathapuram aswell as Tirunelveli and Kanyakumari districts.Rainfall ranges from 750 to 1000 mm with awide variability. Soils are moderately deep to
Regional Centre, Bangalore
Annual Report2009-10 47
very deep, red and lateritic type in northernparts deep to very deep clayey black soils inRamanathapuram and Tuticorin districts andgravelly clay to gravelly red loamy soils inTirunelveli and Kanyakumari districts. LGPranges from 90 to 120 days in southern parts(Vaigai delta area) and progressively increasesto 150-180 days in Thanjavur delta.
c. Coastal plains: Coastal plains is a very narrowstrip of land covering from Kanyakumari inthe South to Pulicot lake in Thiruvallur district.In the northern portion, especially inThiruvallur and Kanchipuram districts, soilsare deep to moderately deep, sandy gravelly
clay to gravelly loam soils. The rainfall rangesfrom 1000 to 1500 mm with LGP of 180-210days.
The coastal areas of Pudukottai, Thanjavur,Ramanathapuram, Sivaganga districts have deep sandyand loamy soils. The rainfall is < 1000 mm with LGPranging from 150-180 days. In the coastal areas ofTuticorin, Tirunelveli and Ramanathapuram (part)districts, sandy soils predominte. LGP is < 90 days inNagarcoil and Radhapuram areas and 90-120 days inSathankulam and Thiruchandur areas.
The agro-ecological zones of Tamil Nadu are presentedin Fig. 2.6.1
Fig. 2.6.1 Agro-ecological zones of Tamil Nadu
TAMIL NADUAgro-ecological zones
Annual Report48 2009-10
Research Achievements
2.6b. Detailed assessment of land andsoil resources of Kuppam mandal inChittoor district of Andhra Pradesh
K.S. Anil Kumar, S.C. Ramesh Kumar,L.G.K. Naidu, A. Natarajan, S. Thayalan,Rajendra Hegde, and S. Srinivas
The detailed soil survey of all 64 villages of Kuppammandal has been completed, the soil map with 141mapping units as phases of soil series has beengeneralized (Fig. 2.6.2). All the soils were developedfrom granites or its colluvium and alluvium in uplands,midlands and lowlands. Uplands occupy about 15664ha (36.8 %), low lands 862 ha (2 %), forests coverabout 23078 ha (54.1 %) and miscellaneous landsaccount for 862 ha (7.1 %).
The major series of uplands are Urlavobanapalle (Ulv),Kattimanipalle (Ktp), Guttapalle (Gtp) and Nulkunte(Nlk). Urlavobanapalle, Kattimanipalle and Guttapallesoils are shallow (25-50 cm) where as Nulkunte soilsare deep (100-150 cm). Texture ranges from loamysand in Urlavobanapalle whereas sandy loam to sandyclay loam in Kattimanipalle and Guttapalle. Nulkuntesoils are sandy clay in texture.
Ekaralpalle (Erp) and Kopalli (Kpl) soils have beenidentified in the midlands. These are moderately deep(75-100 cm) whereas Golapalli (Glb) soils are deep(100-150 cm). Texture ranges from sandy loam tosandy clay loam in Ekaralpalle and Kopalli. Golapallesoils are heavier and are sandy clay to clay in texture.
The major soils of low lands are Guttapanayanpalle(Gtn), Kotha Indlu (Ktl), and Gundalapalle (Gdp).Gundalapalle soils are shallow (25-50 cm).Guttapanayanpalle and Kotha Indlu soils are very deep(>150 cm). Texture ranges from sandy loam to sandyclay loam in Kotha Indlu and Gundalapalle where asGuttapanayanpalle soils are loamy sand in texture.
Different thematic maps have been generated todelineate the potentials and problems of the soils forcrop production and land use planning. Soil depth map(Fig. 2.6.3) shows dominance of moderately shallowsoils, followed by shallow and moderately deep soils.Suitability of the soils for different crops has beenassessed. Land suitability for finger millet, a dominantcrop of the mandal is given in figure 2.6.4, whichindicates that soils are marginally to moderatelysuitable for ragi. Status of major (NPK) nutrients showsthat available P is low to medium and the Zn is low tomarginal in these soils (Fig. 2.6.5). The final reporthas been submitted.
Fig. 2.6.2 Soil map of Kuppam mandal
Regional Centre, Bangalore
Annual Report2009-10 49
Fig. 2.6.3 Soil depth classes of Kuppam mandal
Fig. 2.6.4 Soil suitability for finger millet in Kuppam mandal
Annual Report50 2009-10
Research Achievements
2.6c. Assessment of land and soil resourcesof Malappuram district (part) at1:50,000 scale for land use planning
K.S. Anil Kumar, S. Thayalan, K.M. Nair,S.Srinivas, Rajendra Hegde, S.C. RameshKumar and L.G.K. Naidu
Reconnaissance survey was carried out in 2.81 lakhha, out of 3.53 lakh ha area of the district. Theremaining area has been surveyed during RubberConsultancy Project. Major physiographic delineationsare charnockite highlands, charnockite midlands,charnockite valleys, archaean granite and gneissichighlands, archaean granite and gneissic midlands,Archaean granite and gneissic valleys, laterite midlands,low lands such as kayal lands, sandy plains, coastalsandy plain and beaches/sand bars. Soil seriesassociations are used as mapping units.
Dominant soils occupying on very steeply slopingcharnockite highlands are very deep, fine-loamy andstrongly acidic (Karuvarakundu series) in associationwith deep gravelly clay, very strongly acid soils (Lahaiseries) and shallow, very gravelly clay, very stronglyacid soils (Manimala series).
Major soils of the charnockite midland side slopeshaving moderate slopes are very deep, gravelly clay,very strongly acid soils (Vijayapuram series) inassociation with very deep, gravelly clay, extremely acidsoils (Kanjirappally series) and deep, gravelly clay, verystrongly acid soils (Lahai series). Dominant soilsoccurring on charnockite uplands with gentle slopesare deep, gravelly clay, very strongly acid soils (Lahaiseries) in association with moderately deep, gravellyclay, strongly acid soils (Chelikuzhi series) and shallow,coarse-loamy, very strongly acid soils (Perinthalmannaseries).
In very steeply sloping archaean granite gneisshighlands, the dominant soils are very deep,gravelly clay, very strongly to extremely acid soils(Pallipadi series) in association with moderatelyshallow, clayey, strongly acid soils (Edannur series) androcky areas with less than twenty per cent soil(Rockland).
Major soils occupying on moderately steeply slopingarchaean granite gneiss midland side slopes arePallipadi series in association with moderately deep,very gravelly clay, very strongly acid soils (Kaloor series)and Rockland.
Fig. 2.6.5 Available zinc status in Kuppam mandal
Regional Centre, Bangalore
Annual Report2009-10 51
Dominant soils occurring on moderately slopingarchaean granite gneiss uplands are deep, very gravellyclay very strongly acid soils (Ezhallur series) inassociation with Pallipudi series.
Soils occurring on rolling laterite mound side slopesare moderately shallow, very gravelly clay, very stronglyacid soils (Kaipuzha series) in association with deep,gravelly clay, strongly to very strongly acid soils (Kaladyseries).
Soils occurring on gently sloping laterite uplands arevery deep, clayey, strongly acid to very strongly acidsoils (Anayadi series) in association with moderatelydeep, very gravelly clayey, very strongly to extremelyacid soils (Mannanam series) and very deep, verygravelly clay, strongly acid to very strongly acid soils(Chingavanam series).
Soils in valleys in general are very deep, moderatelywell drained, silty-clay and strongly acid soils(Kolathur series) and very deep, moderately well
drained, fine-loamy and moderately acid soils(Atavanadu series).
Soils of low lands of kayal (water logged soils connectedto sea) origin are very deep, imperfectly drained, clayand very strongly acid soils (Mangattur series)associated with very deep, imperfectly drained, fine-loamy and very strongly to strongly acid soils(Changaramkulam series).
Soils in sandy plains are very deep, well drained, coarse-loamy and very strongly acid (Keraladisapuram series).
Soils in coastal sandy plains are very deep, moderatelywell drained, loamy and slightly acid (Pallipuramseries).
Dominant soils of beaches/sand bars are very deep,moderately well drained, sandy and strongly acid tomoderately acid (Parivarapuram series).
Soil map of Malappuram district (a part) and correspondinglegend are given in Fig. 2.6.6 and Table 2.6.1.
Table 2.6.1 Soil legend of Malappuram district (Ponnani Taluk)
Map Unit Series name Descriptive legend
87 Laterite mound side slopes ( 3-5 %)
Mannanam (Mnn) Moderately deep, welldrained, extremely acid, gravelly sandy clay loam, gravellysandy clay or gravelly clay surface layer with 30 to 60 % gravel, very stronglyacid and extremely acid, gravelly sandy clay and gravelly clay subsoil layerswith 35 to 70 % gravel.
Kaladi (Kld) Deep, welldrained, very strongly acid, gravelly clay surface layer with 15 to30 % gravel and very strongly acid and strongly acid gravelly clay subsoillayers with 15 to 30 % gravel.
88 Laterite mound side slopes (5-10 %)
Kaipuzha (Kpa) Moderately shallow, welldrained, very strongly acid, gravelly sandy clay loam,gravelly sandy clay or gravelly clay surface layer with 30 to 65 % gravel andvery strongly acid gravelly sandy clay and gravelly clay subsoil layers with 35to 70 % gravel.
Panachikkad (Pck) Deep, welldrained, very strongly acid gravelly sandy clay loam, gravelly sandyclay or gravelly clay surface layer with 30 to 70 % gravel and very strongly acidgravelly sandy clay and gravelly clay subsoil layers with 30 to 70 % gravel.
Kaladi (Kld) Deep, welldrained, very strongly acid, gravelly clay surface layer with 15 to30 % gravel and very strongly acid and strongly acid gravelly clay subsoillayers with 15 to 30 % gravel.
97 Laterite uplands on very gentle slopes (1-3 %)
Veliyangode (Vlg) Very deep, welldrained, strongly acid, loamy sand surface layer and very stronglyacid sandy clay loam and sandy loam subsoil layers.
Anayadi (Ayd) Very deep, welldrained, very strongly acid, sandy loam or sandy clay loamsurface layer with 5 to 10 % gravel and strongly acid and very strongly acidsandy clay loam, clay and sandy clay subsoil layers with 5 to 15 % gravel.
cont...
Annual Report52 2009-10
Research Achievements
100 Laterite uplands on gentle slopes (3-5 %)
Panachikkad (Pck) Deep, welldrained, very strongly acid, gravelly sandy clay loam, gravellysandy clay or gravelly clay surface layer with 30 to 70 % gravel and verystrongly acid gravelly sandy clay and gravelly clay subsoil layers with30 to 70 % gravel.
Kaipuzha (Kpa) Moderately shallow, welldrained, very strongly acid, gravelly sandy clay loam,gravelly sandy clay or gravelly clay surface layer with 30 to 65 % gravel andvery strongly acid gravelly sandy clay and gravelly clay subsoil layers with 35to 70 % gravel.
Mannanam (Mnn) Moderately deep, welldrained, extremely acid, gravelly sandy clay loam, gravellysandy clay or gravelly clay surface layer with 30 to 60 % gravel and very stronglyacid and extremely acid gravelly sandy clay and gravelly clay subsoil layerswith 35 to 70 % gravel.
102 Panachikkad (Pck) Deep, welldrained, very strongly acid, gravelly sandy clay loam, gravellysandy clay or gravelly clay surface layer with 30 to 70 % gravel and verystrongly acid gravelly sandy clay and gravelly clay subsoil layers with30 to 70 % gravel.
Chingavanam (Cgn) Very deep, welldrained, very strongly acid, gravelly sandy clay loam, gravellyclay loam, gravelly sandy clay or gravelly clay surface layer with 25 to 60 %gravel and strongly acid and very strongly acid gravelly sandy clay and gravellyclay subsoil layers with 35 to 70 % gravel.
106 Laterite valleys
Atavanadu (Atn) Very deep, moderately welldrained, very strongly acid sandy clay loam surfacelayer and moderately acid sandy clay loam subsoil layers.
107 Low lands- Kayal lands
Mangattur (Mgt) Very deep, imperfectly drained, very strongly acid clay surface layer and verystrongly acid clay subsoil layers.
Changaramkulam (Cgk) Very deep, imperfectly drained, strongly acid sandy loam surface layerand very strongly acid and strongly acid sandy clay loam subsoillayers.
108 Changaramkulam (Cgk) Very deep, imperfectly drained, strongly acid sandy loam surface layerand very strongly acid and strongly acid sandy clay loam subsoillayers.
Mangattur (Mgt) Very deep, imperfectly drained, very strongly acid clay surface layer and verystrongly acid clay subsoil layers.
109 Low lands- Sandy plains
Keraladisapuram (Kdp) Very deep, welldrained, strongly acid loamy sand surface layer and very stronglyacid loamy sand and sandy loam subsoil layers.
111 Pallippuram (Plp) Very deep, moderately welldrained, very strongly acid sandy loamsurface layer and slightly acid sandy loam and sandy clay loam subsoillayers.
113 Low lands- Beaches/sandbars
Parivarapuram (Prp) Very deep, moderately welldrained, moderately acid sand surface layer andstrongly acid and moderately acid sand subsoil layers.
Coverage of area under each series in the map unit is 80-100 per cent if single, 60:40 if two soils and 50:30:20 ifthree soils.
Regional Centre, Bangalore
Annual Report2009-10 53
Fig. 2.6.6 Soil map (part) of Malappuram district
2.6d. Development of software modulesfor land evaluation and agro-climaticanalysis
S. Srinivas, K.M. Nair, L.G.K. Naidu,Rajendra Hegde and V. Ramamurthy
Agro climatic analysis for preparation of agro-ecological zones/units map requires calculation of LGP(Length of Growing Period) which is done based onwater balance calculation. As part of software
development project, water balance calculation for bothmonthly and weekly data sets using Thornthwaite andMather method was programmed using Dbase IVsoftware. The software takes input of Rainfall, PotentialEvapotranspiration (PET) and Available WaterCapacity (AWC) of soil and calculates the period offavorable moisture availability (LGP). Programmodules are also written for Length of Growing Period(LGP) and probability of each week favorable forgrowing crops.
MALAPPURAM DISTRICTPonnani Taluk
N
�
Annual Report54 2009-10
Research Achievements
2.6e. Development of district level land useplan for Mysore district, Karnataka
V. Ramamurthy, K.M. Nair, S.C. RameshKumar, S. Srinivas, L.G.K. Naidu, S. Thayalan
In Mysore district about 96 land units were delineatedby spatial integration of external land features, soils,agro-ecology, present land use and administrativedivisions.
Farming system data were collected from allthe major land units and found that five major
production systems are prevailing (Table 2.6.2) inMysore district.
Land units were further grouped into homogenous landmanagement units (LMUs) based on similar farming/cropping systems. Methodology used for identifyingthe LMUs is presented in the following flow diagram(Fig. 2.6.7). 12 LMUs were delineated in Mysore district(Fig. 2.6.8). LMUs are the land areas which behaveand respond similarly for a given set of managementpractices. The list of LMU identified and theircharacteristics are presented in table 2.6.3.
Fig. 2.6.7 Identification of Land Management Units
Table 2.6.2 Major production systems prevailing in Mysore district
Sl. No. Production systems
Irrigated
1. Rice and Sugarcane production system (Dairy)
2. Rice and Maize production system (Dairy + Sericulture)
Rainfed
3. Tobacco-Ragi/Pulses based production system
4. Cereal (Ragi, Jowar, Maize) based production system
5. Cotton and Cereal based production system
In rainfed situation, integrated mixed farming system is dominant (2-3 cows/buffaloes+pair of bullocks, 8-10 sheep/goats)
Regional Centre, Bangalore
Annual Report2009-10 55
The 12 LMUs identified in Mysore district are
1. Irrigated (Command area); Rice/sugarcane/banana/vegetables production systems on red, shallow,moderately deep and deep soils occurring in AEUII, III & IV
2. Irrigated (Command area); Rice/sugarcane/Banana/Vegetables production systems on black,moderately deep to deep clayey soils in AEU II, IIIand IV
3. Irrigated (Ground water); Rice/maize productionsystems on red, shallow, moderately deep and deepsoils in AEU I
4. Rainfed, Tobacco -Ragi/pulses production systemson red and shallow soils in AEU I
5. Rainfed; Tobacco-Ragi/pulse productionsystems on red, moderately deep to deep soils inAEU I
6. Rainfed, ragi based production systems on red andshallow soils in AEU II
7. Rainfed; Tobacco-ragi/pulses/cotton productionsystems on red, moderately deep to deep soils inAEU II
8. Rainfed; Ragi/Jowar/Cotton production systems onred, shallow soils in AEU III
9. Rainfed; Cotton/ragi/Jowar production systems onred, moderately deep to deep soils in AEU III
10. Rainfed; Ragi/Jowar/Maize production systems onred, shallow soils in AEU IV
11. Rainfed; Pulses-Ragi/Jowar/cotton productionsystems on red, moderately deep to deep soils inAEU IV
12. Rainfed; Cotton/Ragi/maize/Jowar productionsystems on black, moderately deep to deep clayeysoils in AEU III & IV
Fig. 2.6.8. Land management units of Mysore district
Annual Report56 2009-10
Research Achievements
Potential crops under irrigated agricultural productionsystem
In this production system rice, sugarcane, banana,tomato, cabbage and mulberry are being grownpredominantly. The major crops and cropping systemsof irrigated LMUs are presented in table 2.6.4. LMU1, 2 and 3 were assessed for rice suitability (Fig. 2.6.9)and productivity of rice in farmers fields and researchstations was collected and presented in table 2.6.4.Highly suitable areas for rice is more in LMU 1
(90, 000 ha) and LMU 2 (68,000 ha), which is morethan the target area earmarked for 2009-10 in thedistrict. In LMU 2, the productivity of paddy washighest (45.4 q/ha) as compared to LMU 1(44.4 q/ha)and LMU 3 (31.9 q/ha). The productivity of rice inthese two LMUs is comparable to that of researchstations. Therefore, more focus should be given toimprove the productivity of rice in a sustainable wayin Hunsur, H.D.Kote, K.R.Nagar, Mysore, T. Narsipuraand Nanjangudu taluks. Highest net returns frompaddy were recorded in LMU 1 followed by 2 and 3.
Table 2.6.3 Details of Land Management Units identified in Mysore district
LMU Major crops/Cropping systems Land Form Soil depth (cm) Gravelliness Area (ha)
Fig. 2.6.9 Suitable areas for rice production in Mysore district in LMU 1, 2 and 3
Table 2.6.4 Potential area for paddy production under irrigated production system
LMU Suitable area for Rice Productivity Net income(ha) (q/ha) (Rs/ha)
S1 S2 FF* RS* YG* At FF
1 90000.0 4164.0 44.4 48.0 3.6 24148.8
2 68004.6 - 45.4 48.0 2.6 21017.5
3 13042.0 600.6 31.9 48.0 16.1 1356.5
Total 1, 71, 046.6 4764.6
Target area 1, 08, 400for 2009-10
*FF=Farmers Field; RS=Research Station; YG=Yield Gap
Specific problems related to paddy production inLMU 1, 2 and 3 are
• High incidence of blast and BPH
• Non - availability of irrigation water intime
• Non-availability of late planting varieties withresistance to diseases
• Labour scarcity
• Non remunerative price for produce
• Lack of saline resistant HYV in LMU 3
Annual Report58 2009-10
Research Achievements
Potential crops under rainfed agricultural productionsystem
Under rainfed production system, tobacco, cotton, ragi,maize, horsegram, sesamum, field bean, jowar, cowpeaand groundnut are the major crops. Potential areas forragi cultivation was assessed under rainfed productionsystem in the following LMUs 4, 5, 6, 7, 8, 9, 10, 11and 12. The areas suitable for ragi in different LMUs
and their productivity and net returns is presented intable 2.6.5. Highly suitable areas for ragi productionare occurring in LMU 5 and LMU 7 (Fig. 2.6.10) andtargeted area earmarked for ragi cultivation in 2009-10 was 60090 ha. Since LMU 7 has higher productivityand net returns from ragi, more focus on ragiproduction and related programmes can beimplemented in LMU 7, which comprises of Hunsurand H.D.Kote taluks.
Table 2.6.5 Potential areas for ragi production under rainfed production system
LMU Suitable area for ragi Productivity Net income(ha) (q/ha) (Rs/ha)
Fig 2.6.10 Suitable areas for ragi production in Mysore district
Regional Centre, Bangalore
Annual Report2009-10 59
Analysis of potential crops and identification ofpotential areas in each LMU is in progress. Socio-economic data collected from farmers representingmajor soil series have been linked to LMUs.
2.6f. Land use planning for North Goadistrict, Goa
Rajendra Hegde, K.S. Anil Kumar,S.C.Ramesh Kumar and S. Srinivas
A study on identification of constraints affecting diverserural enterprises, inputs, technologies and fundsrequired for addressing the constraints and forpreparing district level LUP for North Goa district ofGoa state is undertaken.
A. Sector wise contribution to GDP: Agriculture,forestry and fisheries all together contribute only10 percent to the GDP. Manufacture and tertiarysectors (service sector) contribute substantially tothe GDP in the state. Over the years, due to severalfactors the contribution of primary sector to GDPis declining.
B. Ecological zones of Goa: For protecting theecological assets in the Goa, the localgovernment has classified the lands into twoecologically sensitive zones (Table 2.6.7). In thesensitive zone 1 (54% of total area), forests,water bodies and Khazan lands are included. The
conversion of these lands for other uses isprohibited by law. In the Eco-zone 2 (26% of area),orchards, cultivated lands saltpans and mudflatsare included.
Table 2.6.7 Ecological zones of Goa
No. Land use category Area in Per centsq. km area
1 ECO zone I 54
a Forests & wild life sanctuaries 1315 35.62
b Mangrove forests 5.64 0.15
c Private forests 45 1.22
d Water bodies 197 5.32
e Paddy fields/Khazan lands 431.63 11.66
2 ECO zone II 26
a Orchards 843 22.77
b Cultivable lands 123 3.32
c Salt pans 2.34 0.06
d Fish farms/mud flats 5 0.13
3 Settlements 526.31 14.22
4 Industries 41.96 1.13
5 Transport 151 4.08
6 Miscellaneous 15.22 0.41
C. General land utilization pattern in Goa: Forestsoccupy largest portion of geographical area. Paddylands (including Khazan lands), orchards and
Specific problems related to ragi production in different LMUs are presented in table 2.6.6.
Table 2.6.6 Specific problems related to Ragi production system
Late onset Lack of Late onset Lack of Late onset Late onset Late onset Late onset Late onsetand HYV for and HYV for and of monsoon and of monsoon of monsoonintermittent late kharif intermittent late kharif intermittent intermittentdry spells dry spells dry spells dry spells
Lack of SWC Lack of SWC Lack of SWC Lack of SWC Lack of SWC Lack of SWC Lack of SWC Lack of SWC Lack of SWCmeasures measures measures measures measures measures measures measures measures
cultivated lands occupy 38 per cent area. Orchardsconsisting of cashew, coconuts and arecanut aremajor source of livelihood for rural mass. Khazanlands are the lands that get inundated with brackishwater from the nearby backwaters of rivers and theseform the very important land use. Only Kharif riceis cultivated here when the salt concentration getsreduced due to monsoon rains. Paddy productivityis quite satisfactory here. Settlements occupy 14 per centof the area as Goa is famous for tourism andindustries. Recent trend reveals that mines occupynearly 4 per cent of the land area in the state andare expanding very rapidly in various parts andcausing alarmingly high levels of ecological damage.
D. Area under major crops: Rice, cashew and coconutare the major crops (Table 2.6.8). Goa is dependenton other states for the food and animals products.
Table 2.6.8 Area under major crops (2005-06)
No Crop Total area Per cent Irrigated(ha) area area (ha)
1a Rice (Kharif) 35112 20.61 -
1b Rice (Rabi) 17065 10.03 17065
2 Ragi 441 0.27 -
3 Maize 100 0.07 -
4 Pulse 10978 6.45 10525
5 Ground nut 3312 1.95 2962
6 Areca nut 1641 0.96 1641
7 Coco nut 25312 14.86 4410
8 Cashew nut 55021 32.31 -
E. Fisheries : Fisheries is one of the traditional sourcesof livelihood for the coastal people. Inland fishery isalso practiced as the traditional cuisines of Goa needfish as the main ingredient of daily food requirement.Over the years, the fish catch is increasing due totechnological advances. There seems to be good scopefor expanding the inland fisheries as the regionreceives good amount of rainfall and brackish wateris also available in inlands and Khazan lands.
F. Tourism scenario of the state: Tourism is expan-ding exponentially in the state. Domestic touristsare also visiting Goa in quite big numbers.The sector has very significant effect on theeconomy, employment and ecology of the region.
G. Climate of Goa: Being a coastal state, the temperaturevariations are less and the range is 18 (minimum)to 340C (maximum). State receives rainfall during
all most all the months. Maximum rainfall isreceived during May to October months. The meantotal annual rainfall is 3500 mm. Total annualrainfall received is in the range of 2500 to 4800mm. Number of rainy days varies from 91 to 123.
H. Length of growing period: LGP is not a majorlimitation in the region as the region receives goodamount of rainfall. 96 percent of the area has LGPof 180 to 240 days (Fig. 2.6.11).
Fig. 2.6.11 LGP in North Goa
I. Population distribution and projections: High levelof urbanization has taken place here. In North Goa,55 per cent of the population is rural as comparedto 72 per cent at all India level. The trend ofurbanization is quite fast in Goa as compared toother states. The present population of 13.5 lakhsis likely to increase to 18 lakhs by 2021. The rateof growth is less compared to all India figures dueto high level of literacy. However due to availabilityof employment, migration of people from otherstates is increasing and Goa is becoming trulycosmopolitan state.
J. Major farming systems prevailing in North Goa:About six farming systems are identified in Goa.Brief details are given below.
1. Cashew based systems: Mainly in up lands andhilly areas.
2. Paddy based systems: Low lying areas invalleys and river mouths.
3. Coconut based systems: Homesteads and smallplantations surrounding the houses and paddyfields and coast line.
4. Agri-tourism based systems: Concentrated incoastal lines.
Regional Centre, Bangalore
Annual Report2009-10 61
5. Spices based systems: Orchards surroundinghomes and as intercrop between coconuts andarecanut gardens
6. Animal husbandry based systems: Associatedwith other farming systems.
K. Land management units: By over laying land usetypes on the soils 12 land management units werearrived for the entire districts (Fig. 2.6.12). Landuse planning exercise shall be undertaken for theseLMUs.
Fig. 2.6.12 Land Management Units of North Goa district
1. Coconuts of mudflats of beaches: All alongthe coast and river mouths, this LMU can benoticed. Fish farming is another activity in theunit.
2. Swamps: These occupy around 1900 ha areaand are infested with weeds and partly withmangrove vegetation.
3. Salt pans: This unit occupies only 333 ha andis used for salt production from sea water.
4. Rice fields of Khazan lands: This unit occupies7300 ha area and due to salt water inundationduring Kharif season only rice is grown here.The productivity levels of these fields are alsoquite high.
5. Cashews of flat topped mountains: This unitoccupies significant area and is owned byprivate as well as government. Cashew isgrown along with forest species.
6. Cashew and forests of hill slide slopes: Unit issimilar to number 5 and is eroded and poor inproductivity.
7. Coconuts of lateritic coast: This unit occupiessignificant area of the coastline and soils arelateritic in nature due to heavy rains in the region.
8. Cashew and forests of restricted mountains:Forests and cashew are mixed in these regionsand are found in isolated places in the district.
9. Rice fields of interhill basins: This unit is usedfor rice cultivation in Kharif and pulses,vegetables and groundnuts in the rabi. Largetracts of such units are now converted forarecanut cultivation.
10. Rock out crops
11. Cashew and coconuts on lower hills: This unitis found as homesteads everywhere in thedistrict.
12. Water bodies
L. Operational holdings: About 82 per cent of theholdings in North Goa are small and marginal andthey hold 32 per cent of the agricultural lands. 470number of large holdings (above 7.5 ha) hold nearly30 per cent of the lands.
M. Potentials of the district in general
• Homesteads provide better opportunity fordiverse farming based enterprises.
• Productivity levels of many crops can beenhanced.
• Water is not a constraint to take up waterdependent farming enterprises.
• Availability of cosmopolitan consumersprovides bright scope for variety of high techas well as organic farming enterprises.
N. Constraints identified in general
• Extensive areas are going for urban andtourism development.
• Large parts of agricultural lands are underhomesteads.
• Single crop areas dominate and very little areais under double crop.
• Region is vulnerable for climate changes.
• Due to heavy rainfall fertility loss is rapid.
• Expanding Mining industry has become majorthreat to land resources.
Annual Report62 2009-10
Research Achievements
2.6g. Assessment of stakeholder needsand economic evaluation of land usetypes for land use planning of Mysoreand North Goa districts
S.C. Ramesh Kumar, V.Ramamurthy andRajendra Hegde
In order to assess the needs of the stakeholders (farmersand agricultural department) two separate types ofquestionnaires were designed for data collection. Thesoil variability (1:50,000 scale) was the basis forcollecting the data from the farm households.
Mysore district is located at the southern most partof Karnataka state. The district has seven takuks viz.,H.D. Kote, Hunsur, K.R. Nagar, Mysore, Periyapatna,Nanjangud and T.Narasipura. There are 1216inhabited and 124 uninhabited villages. Agriculture isthe main occupation in the district. The total numberof farm households are 630032 of which marginal(< 1 ha) and small (1-2 ha) farmers accounts for16 and 20 per cent to total farm households.
In Mysore district, about 38 soil series associationsrepresenting 80 per cent of areas were studied. Atotal of 342 farm households were interviewed forcollecting data on different land use types. Under canalirrigated land dominant crops were paddy andsugarcane. Under rainfed condition tobacco, cotton,ragi, maize, fieldbean, horsegram, redgram, cowpeaand groundnut were grown along with dairy and sheepenterprises.
Assessment of stakeholders requirements
The details and scale at which the soil information needsfor the department of agriculture was assessed withthe Agricultural Officers, Assistant Directors ofAgriculture and Joint Directors of Agriculture. In thebeginning of the stakeholders meeting the officers wereexplained the purpose of the meeting and aboutNBSS&LUP activities and its roles in land evaluationand land use planning activities. A questionnaire wasgiven to the officers to list the details of informationrequired and the scale at which it is required forimplementing the agricultural programmes. Aboutsixteen soils themes and the scale of soil informationwas reported (Fig. 2.6.13).
From this analysis it was found that the agriculturaldepartment is concerned about the soils, nutrientsmanagement and conservation programmes. Theinformation needs on macro nutrients (NPK) andmicronutrients status (Zn, Cu, Mg, Fe) were requiredat village and farm households level. The informationon soil depth, texture and erosion and soil pH wererequired at panchayat and village level. It was alsoreported that department officials are not feeling/finding the need for information on micro nutrientslike boron, calcium and sulphur and general landcapability classification of soils.
Economic evaluation of soils
The economic evaluation of different types land usescarried out on soils of Mysore district is given in table2.6.9. In Mysore, paddy and sugarcane are thedominant crops under irrigated condition. Paddy iscultivated on all types of soils. The per hectare netreturns in paddy cultivation was maximum on deepred loamy soils (Rs. 43,775) and was minimum on deepalluvial loamy soils (Rs. 15100). In case of sugarcanecultivation per hectare net returns was found maximumon deep red gravelly clay soils (Rs. 2, 08,725) and wasminimum in shallow red loamy soils (Rs. 67,800).
Fig. 2.6.13. Soil information needs for StateAgricultural department
Regional Centre, Bangalore
Annual Report2009-10 63
Among the rainfed crops, ragi is the predominant cropfollowed by tobacco and cotton. The per hectare netreturns for ragi was maximum on deep red gravellyclay soils (Rs. 24,788) and was minimum on mediumdeep red gravelly loamy soils (Rs. 4,523). In case oftobacco, the per hectare net returns was maximum onshallow red gravelly clay soils (Rs. 1,41,621) and wasminimum on deep alluvial loamy soils (Rs. 55,588). Incase of cotton, the per hectare net returns wasmaximum on medium deep red gravelly clay soils(Rs 21,744) and minimum on shallow red gravelly claysoils (Rs. 8,700).
Yield gap analysis
The difference between the potential productivity asper the package of practices recommended byUniversity of Agricultural Sciences, Bangalore andfarmers yield levels are compared to arrive at yield gap.The productivity potential and yield gap analysis wasassessed for different soils of Mysore district.
The potential productivity of paddy and the yieldobtained on different soils is presented in figure 2.6.14.There is scope for bridging the yield gap of 8 to34 per cent on different soils of Mysore district. In caseof tobacco farmers are getting near to potential yield
Table 2.6.9 Economic land evaluation for different crop enterprises in Mysore district
(Net returns Rs/ha)
Soils (Area in ha)Deep Deep Deep Deep Medium Medium Shallow Shallow District
Alluvial Black Soils Red Red Deep Red Deep Red Red Red AverageLoamy Gravelly Loamy Gravelly Gravelly Gravelly Loamy value
levels of 15 quintal on all the soils except on mediumdeep, red, gravelly clay soils (Fig. 2.6.15).
Fig. 2.6.14 Paddy productivity and yield potentials ondifferent soils
2.6.15 Tobacco productivity and yield potentials ondifferent soil types
Annual Report64 2009-10
Research Achievements
2.6h. Land resource inventory for farmplanning in different agro-ecologicalregions of India
A. Natarajan, Jaya N. Surya, R.S. MeenaS.K. Reza, S . Bandyopadhyay, S .Dharmarajan, Pushpanjali, Karthikeyanand T.P. Verma
The present project aims to provide the requiredsite-specific database needed for farm planning, inselected blocks located in six regions of the country asa pilot study. The detailed database generated at villagelevel will form the basis and provide the requiredinformation needed for prioritising, initiating andexecuting any land-based developmental programmesby the line departments, extension officers, soil testinglabs and others in the blocks surveyed under thisproject. So, this network project has been taken upsimultaneously in all the five centres of the Bureau toprovide a common methodology and platform for allthe scientists of the Institute to work as a team notonly in specifying the protocols for undertakingcadastral level survey but also to come out with arealistic work plan to take up this work in all the blocksof the country.
Blocks/mandals identified in different regionsfor Land Resource Inventory Project
Northern region Delhi Centre Lakhamajra block,Rohtak dist, Haryana,16000ha
Southern region Bangalore Chikka-ArsinakereCentre hobli, Mandya dist.,
Karnataka 17000 ha
North eastern Jorhat Tuli watershed,region Centre Nagaland, 5000 ha
Eastern region Kolkata Badua Watershed,Centre Bihar, 1064 ha
Central region Nagpur Parseoni Block,Nagpur dist.,Maharashtra 16493 ha
Western region Udaipur Dungla tehsil (a part),Centre Chittorgarh dist.,
Rajsthan 15,000 ha
Survey and mapping of soils in Chikka-Arsinakerehobli, Mandya dist, Karnataka state has beencompleted. Laboratory characterization of soil samplesand the GIS work are in progress. In all the other blocksselected in different regions of the country, the soilsurvey and mapping work has been initiated and thesurvey work is in progress.
2.6h(i). Land resource inventionary for farmplanning in Chikk-Arsinkere hobli ofMaddur taluk, Mandya district ofKarnataka
R. S. Meena , A. Natrajan, S. Thayalan,S. C. Ramesh Kumar, V. Ramamurthy,S. Srinivas
Total area of Chikarsinkere Hobli of Moddur taluk is16,873 ha. Major part of the area (7,478 ha) is undercanal irrigation. Rainfed area occupies about 4,367 ha.It is one of the four hoblis of Maddur taluk in Mandyadistrict (Fig. 2.6.16). The climate of the hobli anddistrict is hot moist semi arid with average annualrainfall of 770.9 mm. September and October are thewettest months receiving about 45% of the total rainfallof 771 mm. The mean annual temperature varies from20 to 270C.
Geology of the area is dominantly of granite. Majorpart of the hobli is under Kaveri and Hemavathi canalirrigation. The major crops of the area are rice andsugarcane in the irrigated track and ragi, pulses andoilseeds in uplands under rainfed conditions.
Soil survey was carried out using base map of scale1: 8000. A detailed traverse of the area was made toidentify the physiographic units like uplands, midlandsand lowlands. Pedon sites were located in transectsalong the slope from the upper slope to lower slopes.About 700 profiles were studied for mapping of soils,based on variation in morphological characteristics andsoil development in relation to physiography. On thewhole, 14 soil series were identified as per the criteriagiven in soil survey manual and their phases wereidentified and mapped.
Fig. 2.6.16 Location map of Chikka-Arsinakere Hobli inMandya district
MANDYAKarnataka
Chikkaarsinakere Hobli
Regional Centre, Bangalore
Annual Report2009-10 65
Site characteristics Soil characteristics Calcareousness
Out of 14 soil series, 6 series were identified in uplands and 8 series in mid and lowland area. A brief descriptionof the soil series is given below and soil-site characterstics are presented in table 2.6.10.
Table 2.6.10 Soil-site charaterstics of Chikk-arsinakere hobli
Sl. SoilNo. series Slope Erosion Drainage Depth Texture Coarse fragments Surface Sub
(cm) Surface Sub Surface Sub surfacesurface surface
very dark grayish brown, sandy clay loam to sandyclay surface followed by yellowish red to darkreddish brown, sandy clay to clay with 35 to 60per cent gravel occurring on nearly level to gentlysloping uplands developed from weathered granite.
5. Kudagere (Kgr) : Deep (100-150), well drained,dark reddish brown to yellowish red loamy sandto sandy clay loam surface followed by yellowishred to dark reddish brown, sandy clay to claysubsoil with gravelly horizon occurring between50 to 100 cm depth, occurring on nearly level tovery gently sloping uplands from weathered granite.
6. Yadaganahalli (Ydh) : Deep (100-150 cm), welldrained, reddish brown to dark reddish brown,sandy loam to sandy clay loam surface followedby dark red to dark reddish brown, sandy clay toclay sub soil with 35 to 60 per cent gravel occurringon nearly level to very gently sloping uplands,developed on weathered granite.
7. Hagalhalli (Hgl) : Deep (100-150 cm), moderatelywell drained, brown to dark reddish brown, sandyloam to sandy clay surface horizon followed bydark yellowish brown to grey, sandy clay to clay,
1. Honnanaya Kanahalli (Hnl) : Moderately shallow( 50 – 75 cm ), well drained, reddish brown sandyclay loam to sandy clay surface followed by darkred to dark reddish brown, sandy clay to claysubsoil with 10 to 30 per cent gravel developed onweathered granite occurring on nearly level to verygently sloping mid and uplands.
2. Manigere (Mgr) : Moderately shallow ( 50-75 cm),well drained, dark brown to dark reddish brown,sandy loam to sandy clay loam surface followedby dark brown to dark reddish brown, gravellysandy clay to gravelly clay with 35 to 60 per centgravel, occurring on nearly level to very gently slopingmid and uplands developed from weathered granite.
3. Bidarahalli (Bdh) : Moderately deep (75-100 cm),well drained, dark brown to reddish brown, sandyloam to sandy clay loam surface followed by darkred to dark reddish brown, sandy clay to clay with< 35 per cent gravel, occurring on nearly level tovery gently slopping uplands and developed fromweathered granite.
4. Torebommanahalli (Tbl) : Moderately deep(75-100 cm), well drained dark grayish brown to
Annual Report66 2009-10
Research Achievements
calcareous subsoil occurring on nearly level to verygently sloping midlands developed on granite.
8. Kyathaghatta (Kgt) : Deep (100-150 cm),moderately well drained, very dark grayish brownto very dark grey sandy loam to sandy clay surfacefollowed by brownish yellow to very dark greysandy clay loam to sandy clay calcareous subsoilhorizon occurring on nearly level to very gentlysloping midlands developed from granite.
9. Aravanahalli (Avl) : Very deep ( >150 cm), welldrained, dark brown to yellowish red loamy sandto sandy clay loam surface followed by dark redto dark reddish brown sandy clay to clay subsoiloccurring on nearly level to very gently slopinguplands developed from granite.
10. Doddarasinkere (Dak) : Very deep ( >150 cm),moderately well drained somewhat poorly drainedto dark brown to very dark grey, sandy loam toclay, calcareous surface followed by yellowishbrown to very dark grey, sandy clay to clay,calcareous subsoil occurring on nearly level lowlands developed from alluvium.
11. Chikka-Arsinkere (Cak) : Very deep (>150 cm),moderately well to somewhat poorly drained,brown to very dark grayish brown, sandy clay toclay, calcareous surface followed by dark yellowishto brown to very dark grey clay, calcareous subsoiland with pressure falls occurring on nearly levellow lands, developed from alluvium.
12. Honnalagere (Hlr) : Very deep (>150), moderatelywell to somewhat poor drained, brown to darkgrayish brown, sandy clay loam to sandy claysurface horizon followed by yellowish brown todark grayish brown, sandy loam to clay loamsubsoil horizon occurring on nearly level low landsdeveloped from alluvium.
13. Madenahalli (Mnl): Very deep (150), moderatelywell drained to somewhat poorly drained, verydark grayish brown to dark gray, sandy clay loamto sandy clay, surface horizon followed by lightolive brown to very dark gray sand to clay stratifiedsoil, calcareous subsoil horizon occurring on nearlylevel low land developed from alluvium.
14. Kadakothanahalli (Kkh): Deep (100-150),moderately well drained, very dark grayish brownclay surface horizon followed by very dark grayishbrown to dark brown clay, calcareous subsoil withslightly developed slickenside and occur on nearlylevel midlands of uplands.
2.6i. Correlation of soil series of India andtheir placement in National Register– Southern states (AP, Karnataka,Kerala, Tamil Nadu, Goa, Puducherryand Lakshadweep)
L.G.K. Naidu, A. Natarajan, K.M. Nair,K.S.Anil Kumar and R.S.Meena
During the period under report 10 soil series werecorrelated and forwarded to Soil CorrelationCommittee for incorporation in the National Soil SeriesRegister. Out of these, two Aisandra and Arikunte areentered in National Registor. Short description of theseseries are given below.
1. AISANDRA SERIES: The Aisandra series is amember of loamy-skeletal, mixed, isohyperthermicfamily of Lithic Ustorthents. Aisandra soils areshallow, reddish brown to dark reddish brown,slightly acid, gravelly sandy clay loam horizons,and dark reddish brown slightly acid, gravellysandy loam AC horizons over chlorite schist.Extensively distributed (about 4,000 ha) inBangarpet taluks of Kolar district, Karnataka
2. ARIKUNTE SERIES: The Arikunte series is amember of clayey-skeletal, mixed, isohyperthermicfamily of Oxic Haplustepts. Arikunte soils aremoderately deep, yellowish red to red, moderatelyacid to neutral, gravelly clay B horizons overlaterite. Extensively distributed (about 38,600 ha)in Kolar, Chintamani, Srinivaspur, Mulbagal,Sidlaghatta and Malur taluks of Kolar district,Karnataka
2.6j. Geomorphological analysis andstudy on landform – soils – land userelationships in Karnataka State.
S. Thayalan, L.G.K. Naidu, A. Natarajan,K.M. Nair, K.S. Anil Kumar, S.C. RameshKumar, V. Ramamurthy and R.S. Meena
Ghatti Subramanya area of Doddaballapur taluk,Bengaluru Rural district was selected for understandingthe landform-soil variability (Fig. 2.6.17). It extendsfrom 130 20’to 130 25’ N Latitude and 770 30’ to 770
35’ E Longitude and covers a total area of about 150sq km. Geologically, it belongs to the Archaeansconsisting of peninsular gneiss and granites, whichforms the basement complex. The northern half of the
Regional Centre, Bangalore
Annual Report2009-10 67
study area consists of Clospet granites, which are oflater intrusions, whereas, the southern half belongs tothe ancient gneissic complex. This is clearly reflectedin the landforms identified as well. The first fourlandforms namely, structural hills and ridges, isolatedhills and local rises, rolling lands and undulating terrainbelongs dominantly to the Clospet granite group, whilethe gently sloping terrain and majority of the narrowvalley floor falls under the gneissic complex. Elevationwise the gently sloping terrain has a range of 900 to920 m above MSL, whereas the landforms of theclosepet granites reach up to 1000 m above MSL.Numerous dolerite dikes cutting across the northernparts indicate later intrusions and its influence onregional metamorphism (Fig. 2.6.18). Subarealspheroidal weathering and the process of itsexhumation resulted in the formation of ruwars, whichis reflected in the availability of numerous Tor bouldersand castellated domical rises. Granular disintegration,joint plan expansion, shattering and exfoliation are thedominant geomorphic processes prevalent among theclosepet granites. On the basal knicks of the isolatedhills and local rises, however, an interesting weatheringprocess has been identified. The underside of the torboulders develop numerous gnammas and pans whichare further enlarged to stone-lattice (Fig. 2.6.19a&b).Since the granites are rich in feldspars, the selectiveweathering of this permits a loosening of the less solublecomponents, which are then dispersed mechanically,leaving corroded surfaces, the larger ones frequentlyexhibit thin, canopy-like overhangs leading to tafonior alveolar weathering.
In order to understand the landform-soil and cropvariability, a measured cross-section was studied indetail near Durgenahalli/Tubagere villages adjoining alocal rise on the gently sloping terrain. Using a SuuntoClinometer the slope angles were measured at 10 to 20m intervals between the elevation of 950 and 920 mabove MSL, for a distance of 320 m trending W-E fromthe crest of the local rise towards the nearest thalweg,an incipient valley floor. The measured slopes weregrouped together and based on the angulardiscontinuity five landform subunits were identified ontoposequence. They are distinctly different from oneanother in their slope form, composition and surficialmaterials. Soil profiles were exposed exactly in thecentre of the indentified landforms and they werestudied for their morphology. Fig. 2.6.20 shows themeasured cross-section and the five pedons studied insequence.
Fig. 2.6.17 Landforms of Ghati Subramanya, Doddaballapurtaluk, Bangalore rural district
Fig. 2.6.18 Granite Rolling lands with steeply dippingdikes in the centre
Annual Report68 2009-10
Research Achievements
Pedon-1 is situated on the centre of the shoulder slopesadjoining the Local Rises. It has an average slope of 10
30’ and the slope length is 35 m. The solum depth itselfis around 80 cm followed by BC horizon to 120 cmand the colour is dominantly of 2.5 YR hue. Highlyweathered granite is exposed upto 150 cm. The texture
Fig. 2.6.19a Formation of gnammas leading tostone-lattice and alveolar weathering
Fig. 2.6.19b Formation of Alveolae (Tafoni) leading tocavernous weathering
of the surface horizon is loamy sand and the subsurfaceis dominantly of sandy clay. The lighter texture on thesurface indicates that the processes of slope wash andsheet wash are very active there by the finer particlesare removed continuously. The presence of argillans inthe sub surface horizons confirms the process of
Fig. 2.6.20 Landform-soils relationship in gently sloping granite-gneissic terrain of Durgenahalli
Regional Centre, Bangalore
Annual Report2009-10 69
illuviation. Fine gravels of quartz and feldspardominantly available on the surface (c. 50%) decreasesto (c. 35 %) on the BC horizon. The existing croppingpattern is finger millet intercropped with field beans.
Pedon-2 is positioned on the centre of Convexo-concaveTor-side slopes having the average slope of 10 50’ andthe slope length is 55 m. The solum depth is 100 cmwith a well defined Bt horizon up to 55 cm. The colourof the soil is in 2.5 YR hue. Highly weathered graniteis available after 100 cm. The texture is dominantly ofgravelly sandy clay with the surface being gravelly sandyloam with the fine gravel content being 55 per cent. Thinpatchy cutans are present in the sub surface horizons.The decreased solum depth may be related directly toits position on the toposequence wherein the slope isslightly increased. The existing cropping pattern isfinger millet and field beans as intercrop.
Pedon-3 is situated on upper sectors of the valley-side,which is the starting point of planar slopes. Here theslope is drastically reduced (00 40’) and becoming muchshallower when compared to the above occurring Tor-side slopes. However, the slope length is increased toabout 65 m. The pedon studied here is well developedwith a solum depth of 160 cm. The colour is dominantlyof 2.5 YR hue and the texture being gravelly sandyclay. The texture of the surface horizon is loamy sandwith less gravel content. However, in the subsurfacehorizons the gravel content is between 35 and 45 percent. Thin, patchy cutans are available throughout thesub surface horizons including the BC horizon and thisconfirms the process of illuviation. The existingcropping pattern is horse gram and finger millet.
Pedon-4 is positioned on the centre of the MiddleSectors of the Valley-side, which is rectilinear in nature.The average slope is similar to that of the Upper Sectorsand the slope length is also reduced to about 55 m.However, the middle position of this unit, half waybetween the Local Rises and that of the incipient valleyfloor, makes this unique with respect to soildevelopment. The solum depth is 150 cm with welldeveloped argillic horizons. The colour is in the hue of2.5 YR. The texture is dominantly of clay to sandyclay in the sub surface. However, the surface has a
lighter texture of clay loam but when compared to theabove occurring pedons of 1, 2 and 3, it has a heaviertexture indicating the process of entrainment. Anotherremarkable feature of this pedon is the total absence ofquartz and feldspar gravels indicating the process ofdisintegration, decomposition and assimilation. Thinto thick patchy cutans are available in the sub surfacehorizons, further confirming the process of clayilluviation and enrichment. The existing land use isfinger millet and field beans as inter crop.
Pedon-5 is excavated on the centre of the Lower Sectorsof the Valley-Side planar slopes, very nearer to themargin of the incipient valley floor. The studied pedonshows remarkable changes in soil development. Thoughthe colour is dominantly of 2.5 YR hue except thesurface horizon where it is in the hue of 5 YR, there arelot of changes with respect to texture and othermorphological characters. Up to a depth of 80 cm thepedon resembles that of the middle sector profile, withtexture ranging from sandy clay loam to sandy claywith the development of thin, patchy cutans indicatingilluviation. However, below 80 cm the pedon showsremarkable changes showing alternate light and heavytexture and the heavy presence of mica makes thetexture feel towards silt. The presence of loamy sandlayer in between silty clay loam horizons indicates theeffect of flash floods. The existing land use is maizeand finger millet.
Taxonomically, the Pedons 1 and 2 belong to clayey-skeletal family of Kandic Paleustalfs; Pedon-3 isclassified as clayey-skeletal, Typic Paleustalfs; Pedon-4belongs to Fine, Typic Paleustalfs and the Pedon-5,situated near the incipient valley floor is a Fine-loamy,Dystric Haplustalf.
The study reveals that a close relationship existsbetween landform position and that of the soilvariability on a true slope sequence at right angles tothe contour from the waxing crust to the waning valleyfloors, on the gently sloping terrains of the Bangalorepleateau. Similar landform-soil relationship studies atWestern Ghats, besalt terrain of North Karnataka willbe taken up in due course of time.
Annual Report70 2009-10
Research Achievements
2.7a. Dynamics of land use and its impacton soil development in Nawanshahar(Shaheed Bhagat Singh Nagar)district, Punjab state.
G.S. Sidhu, Jaya N. Surya, Tarsem Lal, D. K.Katiyar and J. P. Sharma
The soil map was interpreted and reclassified intodifferent thematic maps viz., land irrigability, landcapability, erosion, drainage, particle-size, soil reaction,productivity index, productivity potential, suitabilityfor wheat, rice and potato. The data was alsointerpreted for temporal change (1959, 1983 and 2008)in soil properties.
Land Irrigability map (Fig. 2.7.1) indicate that classes1, 2 and 3 occupy 19.5, 34.1 and 34.8%, respectively.Class 4 lands occupy 1% area, whereas class 6 landsmostly in Siwaliks occupy 9.1% area associated withsteep slopes topography. Class II and III lands occupy
Regional Centre, Delhi
61.9% and 27.7% area, respectively. Class IV and V landscover 1 and 9.1% areas, respectively. Nearly 74.2% inarea of TGA have nil to slight soil erosion. Moderate andsevere/very severe erosion occupy 14.3 and 10.0% areas,respectively mostly on hilly and foot hill areas.
The status of soil drainage map (Fig. 2.7.2) shows thatlarge tract (72.9%) of the district is well to excessivelydrainage and 29.2% is moderately well drained. Poorlydrained soils occupy 6.4% area. Fine loamy soils occupymaximum area (49.7%) followed by sandy (27%) andcoarse loamy soils (21.1%). The neutral to moderatelyalkaline soils occupy 67.5% area, strongly to verystrongly alkaline soils occupy 31.1% area (Fig. 2.7.3).
Productivity index (Fig. 2.7.4) of the soils indicate that39.4% of the soils have excellent to good index,followed by poor to extremely poor (31.1%) andaverage (27.7%). Productivity Potential of soils is goodto excellent in 61.7% area followed by average (19.5%)and poor/extremely poor (17.1%).
Fig. 2.7.1 Land irrigability class Fig. 2.7.2 Drainage class
LAND IRRIGABILITY CLASSNawanshahr District
DRAINAGE CLASSNawanshahr District
Regional Centre, Delhi
Annual Report2009-10 71
Soil suitability for crops
The data indicate that 58.6% of the area is suitable(S1) to moderately suitable (S2) for growing wheat (Fig.2.7.5) followed by 14.2% as marginally suitable (S3)and 25.7% as presently not suitable (S4) which includehilly areas. Nearly 37.3% area is suitable to moderatelysuitable for growing rice (Fig. 2.7.6). Marginally
Fig. 2.7.3 Soil pH
suitable area is 26.6% and remaining 34.7% area ispresently not suitable for rice crop. Maize can be grownin 39.4% area (S1 and S2). Nearly 21.2% area ismarginally suitable (S3) for growing maize crop andremaining area is presently not suitable (S3). The dataindicated that 48.2% area is suitable to moderatelysuitable for potato. Nearly 12.4% area is marginalsuitable and remaining area presently is not suitable.
Fig. 2.7.4 Productivity Potential
Fig. 2.7.5 Suitability for wheat Fig. 2.7.6 Suitability for rice
SOIL REACTION (pH)Nawanshahr District
PRODUCTIVITY INDEXNawanshahr District
SUITABILITY FOR WHEATNawanshahr District
SUITABILITY FOR RICENawanshahr District
Annual Report72 2009-10
Research Achievements
Dynamics of land use and its impact on soilproperties
The data indicate that the area under rice crop increasedfrom 9% in 1959-60 to 30% in 1996-97 and 40% in2006-07 (Fig. 2.7.7). The area under wheat decreasedfrom 78% in 1959-60 to 45% in 1996-97 and increasedto 63% in 2006-07. The decrease in acreage is due toreorganization of district by merging non-wheat areasduring 1996-97. On the other hand, the area undermaize deceased from 42% during 1959-60 to about11% in 1996-97 and 2006-07. The area undersugarcane crop decreased from 18% in 1959-60 to 11%in 1996-97 and 4% in 2006-07. The increase in areaunder rice crop is mainly due to corresponding decreasein area under maize crop during the period under study.
Fig. 2.7.7 Dynamics of land use change inNawanshahr district
Impact of land use change on soil properties
Soil organic carbon: In Naura series, the organiccarbon(OC) was more than 1% in surface soils during2008 as compared to 0.3 and 0.4% during 1959 and1983 respectively (Fig. 2.7.8). The build-up of O.C.was due to extensive practice of rice-wheat croppingsystem. In sub-surface soils, the O.C. was observed tobe less than 0.2%.
Fig. 2.7.8 Temporal change in organic carbon
Soil electrical conductivity (E.C.): The EC was relativelyhigh (0.36 dSm-1) in surface soils during 2008 whichhas decreasing trend (0.1%) in sub-surface soils than0.2 to 0.3% during 1959 and 1983. The high EC insurface soils may be due to salt accumulation throughapplication of chemical fertilizers during 2008 ascompared to 1959 and 1983.
Soil pH: There was decreasing trend in soil pH(Fig. 2.7.9) during 2008 (pH 7.0) than 1959 (pH 7.2to7.3) and 1983 (pH 7.4 to 7.6). The rice-wheat systemmight have contributed towards lowering of soil pH.
Fig. 2.7.9 Temporal change in soil pH
Soil microbiological properties
The data indicated that maximum microbial biomasswas found in sugarcane-wheat-pea cropping system,followed by the forest, fallow land and wheat sugarcanecropping system (Fig. 2.7.10).
Fig. 2.7.10. Soil microbial biomass under different croppingsystems in Nawanshahr district
Minimum biomass was in wheat–potato-maize andwheat-rice-potato systems. The forest soils and pea cropin rice-wheat and sugarcane contributed maximumbiomass in soils.
Regional Centre, Delhi
Annual Report2009-10 73
2.7b. Dynamics of land use and its impacton soil development in Jalandhardistrict, Punjab state
G.S. Sidhu, Jaya N. Surya, Tarsem Lal,
Dharam Singh and J. P. Sharma
The soil map (Fig. 2.7.11) of the district has beenfinalized. Sixteen soil series have been mapped intotwenty five soil series associations i.e. mapping units.
(Table 2.7.1). Fig. 2.7.11 Soil map of Jalandhar district, Punjab
Table 2.7.1 Brief Description and taxonomy of soil series identified in Jalandhar district of Punjab
Map Soil series Soil series Brief description Taxonomy Areaunit association (Sub group) Ha (%)No.
Soils of old flood Plain
1. Suleman - Suleman Very deep, well drained, dark grayish brown to dark Typic 10474.0Adampur yellowish brown, sandy loam to loam, slight Haplustepts (3.99)
effervescence, 0-1% slopes
Adampur Very deep, well drained, brown to grayish brown, Typicfine sandy loam to loamy sand, strong effervescence Ustifluvents0-1% slopes
2. Partabpura-Ughi Partabpura Very deep, moderately well drained, dark grayish Typic 4997.0brown to dark yellowish brown, loam to clay loam, Haplustepts (1.90)slight effervescence, 0-1% slopes
Ughi Very deep, well drained, dark grayish brown to Udicbrown, sandy loam, 0-1% slopes Haplustepts
3. Darapur-Nurpur Darapur Very deep, well drained, dark grayish brown to dark Udic 33630.5yellowish brown, sandy loam, 0-1% slopes Haplustepts (12.82)
Nurpur Very deep, moderately well drained, dark grayish Udicbrown to dark yellowish brown, sandy loam to Haplusteptsloam, 0-1% slopes
4. Nurpur-Darapur Nurpur Same as in 3 21134.0Darapur Same as in 3 (8.05)
5. Adampur-Suleman Adampur Same as in 1 20117.0Suleman Same as in 1 (7.67)
6. Adampur-Darapur Adampur Same as in 1 24167.3Darapur Same as in 3 (9.21)
7. Darapur-Singhpura Darapur Same as in 3 25890.1Singhpura Very deep, excessively drained, brown to dark Typic (9.87)
8. Nurpur-Singhpura Nurpur Same as in 3 4667.0Singhpura Same as in 7 (1.78)
9. Singhpura-Suleman Singhpura Same as in 7 10472.0Suleman Same as in 1 (3.99)
10. Bharduaji-Nurpur Bharduaji Very deep, well drained, very dark grayish brown to Typic 4589.7dark yellowish brown, loam to clay loam slight Haplustepts (1.75)effervescence, 0-1% slopes
Nurpur Same as in 3
cont...
SOILSJalandhar District
Leg
end
So
il U
nit
Annual Report74 2009-10
Research Achievements
11. Bharduaji-Suleman Bharduaji Same as in 10 6115.5Suleman Same as in 1 (2.33)
12. Ughi-Singhpura Ughi Same as in 2 8242.8Singhpura Same as in 7 (3.14)
Soils of old flood plain with sandy patches13. Darapur-Gorsian Darapur Same as in 3 4873.6
Nihal (Inclusion of Gorsian Very deep, well drained, brown, sandy loam to Typic (1.86)Madehpur) Nihal loamy sand, slight effervescence, 0-1% slopes Ustorthents
Soils of old flood plain with old levees14. Gorsian Nihal- Gorsian Same as in 13 3241.1
Shankar (Inclusion Nihal (1.24)of Talwan) Shankar Very deep, well drained, dark grayish brown to Typic/
15. Talwan - Gorsian Talwan Very deep, well drained, brown to yellowish brown, Typic 2962.5Nihal loamy sand to sand, slight effervescence, 0-1% slopes Ustifluvents (1.13)
Gorsian Same as in 13Nihal
16. Talwan- Shankar Talwan Same as in 15 1699.8Shankar Same as in 14 (0.65)
Soils of recent flood plain17. Shankar-Mundhala Shankar Same as in 14 7374.8
Mundhala Very deep, well drained, dark grayish brown to Fluventic (2.81)brown, loam to clay loam/loamy sand, slight Haplusteptseffervescence, 0-1% slopes
18. Shankar-Madhepur Shankar Same as in 14 6269.5Madhepur Very deep, excessively drained, brown to grayish Typic (2.39)
19. Mehatpur-Shankar Mehatpur Very deep, excessively drained, dark grayish brown Typic 9693.8to dark yellowish brown, loamy sand, slight Haplustepts (3.69)effervescence, 0-1% slopes.
Shankar Same as in 1420. Mundhala-Shankar Mundhala Same as in 17 14749.8
Shankar Same as in 14 (5.62)21. Gidar Pindi- Gidar Pindi Very deep, well drained, dark grayish brown to brown, Typic 690.02
Shankar loam to silty clay loam, slight effervescence, 0-1% slopes Haplustepts (0.26)Shankar Same as in 14
22. Gidar Pindi- Gidar Pindi Same as in 21 5173.1Talwandi Talwandi Very deep, well drained, very dark grayish brown, Typic (1.97)
sandy loam to loamy sand, stratified slight Ustifluventseffervescence, 0-1% slopes
Soils of Active Flood Plain
23. Madhepur- Madhepur Same as in 18 3250.1Talwandi Talwandi Same as in 22 (1.24)
24. Talwandi - Talwandi Same as in 22 11018.0Madhepur Madhepur Same as in 18 (4.20)
25. Talwandi-Shankar Talwandi Same as in 22 12452.1Shankar Same as in 14 (4.75)
Habitation 640.0(0.24)
River/water bodies 3815.0(1.45)
Total 262400100
Regional Centre, Delhi
Annual Report2009-10 75
The data indicated that 237488 ha area is underagriculture, 289 ha under other plantation crops, 909ha under water bodies and 24514 ha under other usesincluding wastelands. Area under rice crop is 57.8%,maize (1.32%), vegetables (10.11%) and other cropsoccupy 25.34% of the area in kharif. In rabi wheatoccupy 64.95% followed by vegetables (22.88%), andpulses (0.13%) and other crops (6.61%). In summer,other crops occupy 15.56% and current fallow occupy79.01% area. In general, 5.43% area is under sugarcane(Fig. 2.7.12).
2.7c. Soil resource mapping of Mathuradistrict of Uttar Pradesh forperspective land use planning
S.K. Mahapatra, Jaya N. Surya, Tarsem Lal,G.S. Sidhu and J.P. Sharma
Soil resource data has been interpreted to generatevarious thematic maps (Fig. 2.7.13) in GIS to cater theneeds of different user agencies.
Soils in large part of the district are sandy loam (53.6%)followed by loam (24.9%), loamy sand (13.0%), sand(5.2%), clay loam (3.1%) and gravelly sandy loam(0.2%). Soils with moderately alkaline reaction occupymaximum area of 229232.1 ha (70.7%), followed bystrongly alkaline soils with 51628.5 ha (15.9%), neutral39751.0 ha (12.3%) and very strongly alkaline 3498.4(1.1%) area in the district. About 154088 ha (46.1%)
area is well drained followed by116488 ha (34.8%) moderately welldrained, 53138 ha (15.9%) somewhatexcessively drained and 688 ha (0.2%)excessively drained; Soil organiccarbon has been categorized into threeclasses viz. low (< 0.4%), medium (0.4-0.75%) and high (> 0.75%). About 68per cent area of the district falls underlow soil organic carbon followed bymedium (23%) and high (9%)respectively. Available phosphoruscontent in soils are grouped into threecategories i.e. low (< 12.5 kg ha-1),medium (12.5 – 22.5 kg ha-1) and high(> 22.5 kg ha-1). About 50 per cent areaof the district falls under lowphosphorus followed by 29 per centarea in medium and 21 per cent areain low phosphorous categories.Available potassium is mostly inmedium and low categories. About
60.2 per cent area of the district falls under medium(135-335 kg ha-1) followed by low (< 135 kg ha-1) andhigh (>335 kgha-1) potassium categories respectively.
The suitability of major crops of Mathura district hasbeen worked out on the basis of soil-site characteristicsand the suitability criteria of some important crops andfruit crop (mongo) grown in the district (Fig. 2.7.14).
About 155228 ha (46.5 %) area is rated as undermoderately suitable followed by 107014 ha (32%) asmarginally suitable, 41217 ha (12.4%) as suitable and20643 ha (6.2%) area as presently unsuitable classrespectively. For cultivation of maize, 134609 ha area(40.3%) is found to be marginally suitable, 98061 ha(29.4%) moderately suitable, 70788 ha (21.2%)suitable and 20643 ha (6.2%) area presently unsuitable.For cultivation of pigeon pea, 118264 ha area (35.4%)is found to be marginally suitable, 111095 ha (33.3%)suitable, 70458 ha (21.1%) moderately and 21062 ha(6.3%) area presently unsuitable. About 114753 ha(34.4 %) area falls under marginally suitable class forfollowed by 101681 ha (30.4%) under suitable, 80413ha (24.1%) under moderately suitable and 27275 ha(8.2%) area under presently unsuitable classrespectively for mustard. About 115714 ha (34.7 %)area is grouped as marginally suitable followed by111704 ha (33.5%) as suitable, 49822 ha (14.9%) asmoderately suitable and 46862 ha (14%) area underpresently unsuitable for mango plantation.
Fig. 2.7.12. Cropping systems in Jalandhar district
CROPPING SYSTEMSJalandhar District
Annual Report76 2009-10
Research Achievements
Fig. 2.7.13. Thematic maps of Mathura district
SOIL TEXTUREMathura District
Legend
Legend
N
�
N
�
SOIL REACTION (pH)Mathura District
SOIL DRAINAGEMathura District
Legend Legend
N
�
N
�
SOIL ORGANIC CARBONMathura District
AVAILABLE PHOSPHORUSMathura District
Legend Legend
N
�
N
�
AVAILABLE POTTASIUMMathura District
Regional Centre, Delhi
Annual Report2009-10 77
Fig. 2.7.14. Soil suitability maps for dominant crops in Mathura district
2.7d. Land resource inventory for farmplanning in Lakhan Majra block ofMaham-Rohtak Tehsil, Rohtak district,Haryana
Jaya N. Surya, Tarsem Lal, G.S.Sidhu, S.K.Mahapatra, Dharam Singh and J.P. Sharma
The present project was taken up as a pilot study inLakhan Majra Block of Maham Rohtak Tahsil inRohtak district of Haryana to prepare land resourceinventory of the block and to provide the site-specificdatabase for farm level planning.
The study area Lakhan Majra block is located between28o 55’ to 29o 55’ N latitudes and 76o 35’ E tolongitudes covering an area of 16,690 ha. The block isa part of Maham and Rohtak tehsils, comprising offourteen village, namely Gugaheri, Kharak Jatan,Bainsi, Lakhan Majra, Kharanti, Chandi, IndragarhNandal, Chiri, Kharak and Churangla, Gurauthi, Titoli,Sasrauli Sunderpur. Out of total geographical area ofthe block, 13124 ha (79%) is cultivated and 11590 hais irrigated mainly under canal irrigation. The main
crops are wheat, rice, mustard, sugarcane, pearlmillet and maize. The area has major problems ofsalinity/sodicity and waterlogging (Fig. 2.7.15). Coarsertexture soils occur in patches in the eastern part ofstudy area.
The whole area is grouped into eight physiographicunits viz., undulating sloping dunes, gently tomoderately sloping aeolian plain, gently sloping uplandplain, nearly level old alluvial plain, nearly level oldalluvial plain with saline patches, nearly level oldalluvial plain with concave slope and nearly level oldalluvial plain with low-lying land/depressions.
The physiography of the study area is nearly level tovery gently sloping old alluvial plain and they are sub-divided into eight physiographic units viz., undulatingsloping dunes (3-5%); gently to moderately slopingAeolian plain (1-3%); gently sloping aeo-fluvial plain(1-3%); gently sloping upland plain (1-3%); nearly levelold alluvial plain (01%); nearly level old alluvial plainwith saline patches (01%);nearly level old alluvial plainwith concave slope (01%); nearly level old alluvial plainwith low-lying land/depressions (01%).
Regional Centre, Jorhat
Annual Report2009-10 79
2.8a. Natural resource management inDholi micro-watershed for optimumland use planning
Utpal Baruah and S.K. Reza
The main objectives of the study are to create naturalresource database using remote sensing andconventional techniques and development of alternateland use system based on prospect and limitations ofexisting natural resources.
Detailed soil survey
Detailed soil survey has been carried out byusing cadastral map (1:4000 scale) in the lowerridges of the watershed covering Chungi,Namchungi and Barbam Chungi villages.Traversing has been done in the selectedvillages to identify the landforms. There werethree types of landform namely recent floodplain, gently sloping upland and very gentlysloping upland (Fig. 2.8.1). After carefuldelineation of the various landforms on thecadastral map, the cadastral sheets with newpermanent features were updated andfamiliarization of the area has been made withsurvey numbers and field boundaries. Intensivetraversing of each landform (like ridges,uplands, lowlands/valleys etc.) was undertakento select representative areas for profile study.The results show that Chungi soils have brown,strongly acidic silty clay A horizon and gray tobrown, strongly acidic silty clay B horizonwhereas Nam Chungi soils are light brownishgray, very strongly acidic, silty clay A horizonand gray to light brownish gray, strongly acidic,silty clay B horizon.
Descriptive statistics of soil physicochemical variableunder Native forests, Tea and Paddy at 0-25 cm and25-50 cm depth:
Surface (0-25 cm) and subsurface (25-50 cm) soilsamples have been collected from three predominantland use (native forest, tea and paddy) systems of thestudy area. The data generated from this study will helpin assessing the soil quality variation in the watershedand determining the land suitability for different cropswhich will ultimately help in land use planning of thestudy area.
Regional Centre, Jorhat
Fig. 2.8.1 Landform map of Chungi village
N
�
Low land
Medium land
High land
Road
River
Plot No.
LEGEND REFERENCE
83
Annual Report80 2009-10
Research Achievements
The univariate statistical results for native forest, teaand paddy soils at 0-25 cm and 25-50 cm depths aregiven in tables 2.8.1 and 2.8.2. It is observed that thesoils under paddy cultivation had higher pH thanadjacent soils under forests and tea for the two differentdepths. The highest pH values occurred at 25-50 cmsoil depth for the paddy soil. The result shows that
conversion of the natural forest into tea gardens andpaddy fields resulted in reduction of stocks of soilorganic matter (SOM) for the two sampling depths.SOM at 0-25cm depth of the paddy soils was lowerthan the corresponding values for tea and forest soils.The highest SOM was observed at 0-25 cm depth offorest soils.
Table 2.8.1 Descriptive statistics of soil physiochemical variables at 0-25 cm depthsunder three land uses
Variables Mean Minimum Maximum Standard Coefficient ofdeviation variation (%)
Paddy
pH 5.14 4.80 5.40 0.18 3.50
SOM (%) 1.98 0.90 3.38 0.65 36.11
CEC (cmol/kg) 10.63 7.39 17.02 2.68 25.21
Base saturation (%) 29.33 21.16 39.50 5.54 18.89
Exchangeable K (cmol/kg) 0.10 0.06 0.16 0.03 30.00
Exchangeable Ca (cmol/kg) 2.43 1.72 3.72 0.51 20.98
Exchangeable Na (cmol/kg) 0.16 0.08 0.28 0.05 31.25
Exchangeable Al (cmol/kg) 2.47 0.60 3.57 0.65 26.31
Exchangeable H (cmol/kg) 0.46 0.15 1.18 0.29 63.04
Bray P (mg/kg) 2.35 0.82 5.09 1.27 54.04
Regional Centre, Jorhat
Annual Report2009-10 81
Cation exchange capacity (CEC) is used for overallassessment of the potential fertility of a soil and its possibleresponse to fertilizer applications. The highest CEC wasfound in the paddy soil. The CEC at 25-50 cm depth is higherthan that at 0-25 cm in all the land use classes. The differencein silt and clay content in soils under forest, tea and paddyshows that there is large variation in CEC. Soils under foresthave low CEC due to loamy texture whereas paddy soilshave more CEC due to silty clay loam texture. This suggested
that some of the minerals containing the cations are in thesilt fraction. The paddy soil had highest exchangeable cations,whereas the forest soils exhibited the lowest. As in agriculturalsoils, Ca was the dominant cation in the exchangeablecomplex. Generally, the base saturation values are lowindicating that the soils are potentially less fertile with apossible Al toxicity. In acid environment, the dominant cationis exchangeable Al. The tea garden soils had highexchangeable Al followed by forest and paddy soils.
Table 2.8.2 Descriptive statistics of soil physiochemical variables at 25-50 cm depthsunder three land uses
Variables Mean Minimum Maximum Standard Coefficient ofdeviation variation (%)
Paddy
pH 5.43 5.20 5.70 0.16 2.94
SOM (%) 0.65 0.18 1.26 0.33 50.7
CEC (cmol/kg) 12.29 7.17 19.26 2.89 23.51
Base saturation (%) 32.75 15.77 49.54 9.36 28.58
Exchangeable K (cmol/kg) 0.07 0.05 0.10 0.01 14.28
Exchangeable Ca (cmol/kg) 2.91 1.72 4.00 0.67 23.02
Exchangeable Na (cmol/kg) 0.14 0.04 0.21 0.05 35.71
Exchangeable Al (cmol/kg) 2.11 1.19 2.97 0.58 27.48
Exchangeable H (cmol/kg) 0.58 0.15 1.48 0.31 53.44
Bray P (mg/kg) 1.87 0.92 5.19 1.00 53.47
Annual Report82 2009-10
Research Achievements
Coefficient of variation (CV) for all variables at twodepths under three land uses was very different (Tables2.8.1 and 2.8.2). The greatest variation (127.9%) mayobserved for Bray P under tea soil and smallest variation(2.6%) for pH was observed in forest soil at 0-25 cmdepth. Similarly at 25-50 cm depth, greatest (100%)for exchangeable H under tea soil and smallest variation(2.2%) for pH were observed under forest.
2.8b. Soil resource mapping of Kamrupdistrict (1:50,000 sacle) of Assam forland use planning
T.H. Das, Utpal Baruah and S.K. Reza
Kamrup district in the state of Assam lies between25028' 48" to 26048' 32" N and 90039' 25" to 92009' 32"E covering an area of 4,35,400 ha. The climate of thedistrict is sub-humid tropical with mean annual airtemperature of 240C with average annual rainfall of1800 mm. Semi detailed soil survey was carried outusing Geo-coded satellite imagery in conjunction withSurvey of India Toposheets on 1:50,000 scale. Fortysoil series were identified and mapped in 33 soil seriesassociation. The soils of the district belong to 4 soilorders, 7 sub-orders and 13 great groups and 20 sub-groups. Inceptisols were the dominant soil order(34.09% of TGA) followed by Entisols (29.89% ofTGA), Ultisols (16.03% of TGA) and Alfisols (14.11%of TGA). About 41% area of Kamrup district was levelto nearly level (0-1% slope). Steep to very steep sloping
areas (>50%) cover an area of 19.38%. Nearly 19%of total geographical area of the district is under slighterosion, 30% area under moderate erosion and 13%under severe to very severe erosion class. The soil seriesassociation map is shown in fig. 2.8.2 and descriptionof soil mapping units is given in table 2.8.3.
Land Capability Class: The soil mapping units in thedistrict have been grouped into 5 land capabilitysubclasses based on the dominant soils in a unit. Thedifferent capability subclasses with their extent are givenin table 2.8.4. The most extensive class is IVsw (25.81%)occurring mostly in alluvial plain and flood plain. VIesclass dominantly belongs to hilly region of the state.
Table 2.8.3. Description of soil mapping units of Kamrup district
Physiographic Soil map Soil series Brief description of soil series Area (ha)unit association % of TGA
A. Hill 1 Maliyata- Maliyata: Moderately shallow, somewhat excessively 10585Bhalumara drained, brown to red, sandy clay loam to sandy loam (2.43)
in control section (0-70) on moderately steep hill slopewith moderately acidic sandy loam surface and severeerosion.
H1 Bhalumara: Moderately shallow, somewhat excessivelydrained, yellowish red, sandy loam texture in controlsection (0-65) with moderately acidic sandy loamsurface and moderate erosion.
H2+H5 2 Amchang RF- Amchang RF: Deep, somewhat excessively drained brown to 39477Garbhanga RF reddish brown, silty clay loam to silty clay in control (9.08)
section on steep side slope of hills with moderatelyacidic silty loam surface and moderate erosion.
Garbhanga: Deep, somewhat excessively drained, reddishbrown, silty clay in control section (0-100 cm) on steepside slope of hill with moderately acidic silty loamsurface and severe erosion.
cont...
Fig. 2.8.2 Soil series association map of Kamrup district
SOILKamrup District
N
�
Regional Centre, Jorhat
Annual Report2009-10 83
H3+H7 3 Mammon RF- Mammon RF: Very deep, somewhat excessively drained, 44731Kamalajara- reddish brown to yellowish red, silty clay loam to clay (10.29)Longdadong loam in control section (0-100 cm) on very steep side
slope of hill with slightly acidic sandy clay loam surfaceand severe erosion.
Kamalajara: Very deep, somewhat excessively drained, red todark red, clay loam to sandy clay loam in control section(0-100 cm) on very steep side slope of hills with moderatelyacidic sandy loam surface and moderate erosion.
Longdadong: Deep, somewhat excessively drained, darkreddish brown to dark red, sandy clay loam to sandy loamin control section (0-100cm) with moderately acidicsilty clay loam surface and moderate erosion.
H4+H6 4 Barbitli- Barbitli: Deep, somewhat excessively drained, dark reddish 9150Garbhanga brown to reddish brown, silty loam to silty clay loam (2.10)
texture in control section (0-100cm) on moderatelysteep side slope of hill with moderately acidic sandyloam surface and severe erosion.
Garbhanga: As as above.
B. Upper 5 Jamlaigaon- Jamlaigaon: Deep, moderately well drained, dark gray toAlluvial plain Dekapara dark reddish brown, clay to clay loam in control section
(0-100 cm) on very gently sloping alluvial plain with grey,moderately acidic silty clay surface and moderate erosion.
OA1 Dekapara: Very deep, moderately well drained yellowish 11968brown to light yellowish brow gray, silty clay loam to (2.75)silty clay in control section (0-100cm) with moderatelyacidic silty loam surface and moderate erosion.
OA2 6 Rangingpara- Rangingpara: Deep, moderately well drained, dark 11303Ambari- yellowish brown to yellowish brown, clay loam in (2.60)Dekapara control section (0-100cm) on very gently sloping alluvial
plain with dark brown, moderately acidic loamysurface and moderate erosion.
Ambari: Deep, moderately well drained, light brownishgray to yellowish brown, sandy clay loam to clay loamin control section with moderately acidic sandy loamsurface and moderate erosion.
Dekapara: Same as above.
OA3 7 Lampara- Lampara: Very deep, moderately well drained, light 10462Ambari yellowish brown to pale brown, clay loam to sandy (2.40)
clay loam in control section (0-100 cm) on very gentlysloping pasture land with light brownish grey, moderatelyacidic silty clay loam surface and slight erosion.
Ambari: Same as above.
OA4 8 Barduar- Barduar: Very deep, moderately well drained, brownish 13249Hekura- yellow to dark yellowish brown, sandy clay loam to (3.04)Tuksibari sandy loam in control section (0-100 cm) on very gently
sloping alluvial plain with light brownish grey, moderatelyacidic, sandy loam surface and slight erosion.
Physiographic Soil map Soil series Brief description of soil series Area (ha)unit association % of TGA
cont...
Annual Report84 2009-10
Research Achievements
Physiographic Soil map Soil series Brief description of soil series Area (ha)unit association % of TGA
Hekura: Deep, moderately well drained, dark grey to grey,clay to loam in control section (0-100 cm) on verygently sloping alluvial plain with dark grey, slightlyacidic clayey surface and slight erosion.
Tuksibari: Very deep, moderately well drained, gray to darkbrown, clayey in control section (0-100 cm) with lightbrown gray moderately acidic; silty clay loam surfaceand moderate erosion.
OA5 9 Nichalamari- Nichalamari: Moderately shallow, moderately well drained 1445Moindra- yellowish brown to yellowish red, clayey in control (0.33)Nogabil section (0-70cm) on very gently sloping alluvial plain
with dark yellowish brown, moderately acidic clay loamsurface and moderate erosion.
Moindra: Moderately shallow, moderately well drained,dark grayish brown to dark grey, silty clay loam to clayin control section (0-70 cm) with dark grayish brown,moderately acidic, sandy clay loam surface andmoderate erosion.
Nogabil: Deep, moderately well drained, very dark gray tograyish brown, clay to sandy clay in control section(0-100 cm) on gently sloping interhill valley with verydark grayish brown, moderately acidic clayey surfaceand moderatge erosion.
OA6 10 Hekura- Hekura: Same as above. 3572Deeperbil Deeparbil: Deep, imperfectly drained, brown to grey, (0.82)
silty clay loam to silty clay in control section(0-100 cm) on nearly level alluvial plain with geryishbrown, slightly acidic, loamy surface.
AO7+AO8 11 Bhehua- Bhehua: Deep, imperfectly drained, brown to yellowish 2980Jamlaigaon brown, clay loam to sandy clay loam in control section (0.68)
with dark grayish brown, moderately acidic clay loamsurface.
Jamlaigaon: Same as above.
AO9 12 Nampathar- Nampathar: Deep, well drained, dark grayish brown to 25225Singara- reddish brown, sandy loam to sandy clay loam in (5.80)Rangingpara control section (0-100 cm) on very gently sloping
alluvial plain with modeterately acidic loamy surfaceand moderate erosion.
Singara: Deep, moderately well drained, grayish brown toyellowish red, loam in control section (0-100 cm)on 1-3% alluvial plain with slightly acidic, loamy insurface and moderate erosion.
Rangingpara: Same as above.
C. Alluvial plain 13 Dhalkuchi- Dhalkuchi: Deep, imperfectly drained, grey, silty loam to 11616Bamunbari- silty clay loam in control section(0-100 cm) on nearly (2.67)Naogaon level alluvial plain with dark grey, slightly alkaline silty
loam surface.
A1 + A8 Bamunbari: Deep, imperfectly drained, brown to grayishbrown, silty loam to sand in control section (0-100 cm)on nearly level alluvial plain with grayish brown, slightlyacidic loamy surface and moderte erosion.
cont...
Regional Centre, Jorhat
Annual Report2009-10 85
Physiographic Soil map Soil series Brief description of soil series Area (ha)unit association % of TGA
Naogaon: Very deep, imperfectly drained,very dark grayishbrown to gray, clay to clay loam in control section(0-100 cm) with grey, moderately acidic clay loamsurface and slight erosion.
A2 14 Kulhati- Kulhati: Deep, imperfectly drained, light grey to grey, silty 22290Nijabangarh- loam to sand in control section (0-100cm) on nearly (5.13)Sanyasirkhat level alluvial plain with grey, slightly acidic silty loam
Sanyasirkhat: Deep, imperfectly drained, grayish brown togrey, silty loam in control section (0-100 cm) on nearlylevel alluvial plain with dark grayish brown, slightlyacidic silty loam surface.
A3+A9+A10 15 Lorkhund- Lorkhund: Deep, imperfectly drained, grey, sandy loam to 45233Kandalpara- silty clay loam in control section (0-100 cm) on nearly (10.41)Nijabangarh level alluvial plain with dark grey, slightly acidic clay
loam surface.
Khandalpara: Deep, imperfectly drained, dark grayishbrown to dark reddish brown, sandy in control section(0-100 cm) on nearly level flood plain with dark grey,slightly alkaline, silty clay loam surface.
Nijabangarh: Same as above.
A4 16 Bhogpur- Bhogpur: Deep, moderately well drained, dark grey to 13297Nanara grayish brown, silty clay loam to silty clay in control (3.06)
Nanara: Deep, moderately well drained, gray to lightbrownish gray loam to clay loam in control section(0-100 cm) on very gently sloping alluvial plain withgrayish brown, slightly acidic loam surface andmoderate erosion.
A5 17 Bardhodhi- Bardhodhi: Deep, imperfectly drained, dark grayish brown 5424Bhehua to reddish brown, silty loam to silty clay loam in (1.24)
control section with grayish brown, moderate acidicsilty loam surface.
Bhehua: Same as above.
A6 18 Nanara- Nanara: Same as above. 20419Jamlaigaon Jamlaigaon: Same as above. (4.69)
RA1 19 Belguri- Belguri: Same as above 1986Nampathar- Nampathar: Same as above (0.45)Deeporbil Deeporbil: Same as above
RA2 20 Nijabangarh- Nijabangarh: Same as above. 1432Kandalpara Kandalpara: Same as above. (0.32)
E. Piedmont P1 21 Bhogpur- Bhogpur: Same as above 3067Ambari- Ambari: Same as above (0.70)Barduar Barduar: Same as above
cont...
Annual Report86 2009-10
Research Achievements
Physiographic Soil map Soil series Brief description of soil series Area (ha)unit association % of TGA
P2 21 Sanyasirkhat- Sanyasirkhat: Same as above 2508Bhogpur- Bhogpur: Same as above (0.57)Nijabangarh Nijabangarh: Same as above
P3 23 Singara- Singara: Same as above; 1736Sanyasirkhat Sanyasirkhat: Same as above (0.39)
P4 24 Dhpuguri- Dhupguri: Very deep, moderately well drained, yellowish red 1541Ambari- to gray, clay loam to silty clay loam in control section (0.35)Jarukuchi (0-100cm) on gently sloping piedmont with grayish
Pi1 + Pi2 25 Dhupguri- Dhupguri: Same as above 1874Singara Singra: Same as above (0.43)
F. Interhill valley 26 Tuksibari- Tuksibari: Same as above 9486V1 Belguri Belguri: Same as above (2.18)
V2 27 Luki-Jarukuchi- Luki: Deep, moderately well drained, yellowish brown to 9322Nogabil dark yellowish brown, sandy loam to sandy clay loam (2.14)
in control section (0-100 cm) on gently sloping interhillvalley with dark brown, slightly acidic clayey surfaceand moderate erosion.
Jarukuchi: Very deep, moderately well drained, brown tostrong brown, silty loam to clay in control section(0-100 cm) with gray, slightly acidic clayey surface andmoderate erosion.
Nogabil: Same as above.
G. Active 28 Barapara- Barapara: Deep, moderately well drained, dark grayish 8979flood plain Tarabari brown to brown, sandy loam to clay loam in control (2.06)
section (0-100 cm) on nearly level flood plain with lightbrownish grey, neutral loamy sand surface.
AF2 + AF6 Tarabari: Deep, imperfectly drained, dark yellowish brownto dark brown, sandy loam to loam in control section(0-100 cm) with dark grayish brown, slightly acidicsandy loam surface.
AF3 + AF5 29 Bamunbari- Bamunbari: Same as above; 3260Borapara Barapara: Same as above (0.75)
AF4 + AF1 30 Nogabil + Nogabil: Same as above 10100Khandalpara Khandalpara: Same as above (2.32)
G. Recent flood 31 Barapara- Barapara: Same as above 14437plain RF1 + RF4 Tarabari Tarabari: Same as above (3.32)
RF2 + RF3 32 Khandalpara- Khandalpara: Same as above 19803Barapara Barapara: Same as above (4.55)
RF5 33 Tarabari- Tarabari: Same as above 5202Noagaon Noagaon: Same as above (1.19)
River and misc. 25452+ A7 (5.85)
Regional Centre, Jorhat
Annual Report2009-10 87
Fig. 2.8.3 Organic carbon status (surface soil) map ofKamrup district
Table 2.8.5. Soils under different organiccarbon classes (surface)
Class Description Area (ha) % of TGA
Very high >1.5 g kg-1 36625 8.42High 0.78-1.5 g kg-1 345310 79.47Medium 0.5-0.75 g kg-1 22472 5.17Low <0.5 g kg-1 4641 1.06River & Misc. 25452 5.85
2.8c. Correlation of soil series of North-Eastern States (Arunachal Pradesh,Assam, Manipur, Meghalaya,Mizoram, Nagaland and Tripura)(part of correlation of soil seriesnational project of NBSS&LUP,Nagpur)
T.H. Das, S. K. Reza and Utpal Baruah
Soil series identified during reconnaissance soilsurvey (in 1:50,000) of Sibsagar (12 series), Morigaon(19 series) of Assam, Esat Khasi Hills (17 series),Ri-Bhoi (7 series) of Meghalaya, Lungei (20 series)of Mizoram, Tirap (7 series) and Lohit (12 series)of Arunachal Pradesh, Imphal (7 series) of Manipurand 48 series of Tripura have been correlated forfinalization of soil series description at the nationallevel. Out of 149 series identified and mapped,34 soil series were finalized for listing in NationalSoil Series Register. The soil site characteristic oftwo soil series of broad division of NE Region are givenin table 2.8.6.
The organic carbon status of surface soils in the districthave been grouped into 4 classes (Table 2.8.5) and theirextension and distribution are shown in fig 2.8.3. Total79.47% area of the district belongs to high category.
Table 2.8.6. Soil site characteristics of two series of broad division of NE region
Broad division Soil series Area (ha) Landform Depth Texture Taxonomy
Brahmputra Sonari 68547 Flood plain Very deep Sandy clay loam Aquic Dystrudeptsvalley Morigaon 16662 Alluvial flood plain Very deep Sandy loam Typic Fluvaquents
Eastern Aituilo 2154 Middle slope of Shallow Silt loam Lithic HapludalfsHimalaya medium hills
Longsom 8054 Rolling hill slope Moderately Loam Typic Dystrudeptsshallow
Purvanchal Kathalia 44327 Flat toppedhill Deep to very deep Sandy loam Typic Kandiudalfs
Himalaya Shibbari 30899 Hill slopes and Deep to very Clay loam Typicparallel ridges deep Kandihumults
Meghalaya Mawlyndair 484500 Steep to very steep Very deep Sandy loam HumicPlateau escarpments Dystrochrepts
Lailad 78704 Moderately steep to very deep Clay Typicsteep hills Kanhaplohumults
ORGANIC CARBONKamrup District, Assam
N
�
Annual Report88 2009-10
Research Achievements
2.8d. Assessment of heavy metal pollutionand its mapping in soils of contaminatedareas of Morigoan, Dibrugarh andTinsukia districts of Assam
S.K. Reza, S.K. Ray and Utpal Baruah
The study was carried out in four contaminated areasviz., Ledo, Digboi, Jagiroad and Namrup of the Assamstate. Ledo is famous for underground coal mining andDigboi for petroleum industry in Tinsukia district.Similarly, Jagiroad in Morigaon district and Namrupin Dibrugarh district of Assam are famous for papermill and fertilizer industry, respectively. The effluentsfrom these industries are either released to channels ordisposed off on land and are used for irrigation due tonon-availability of fresh water. So, there is a chance ofaccumulation of heavy metals in soils. With a view tounderstand the heavy metal dynamics, the present studywas carried out to identify the heavy metalcontaminated areas in Morigoan, Dibrugarh andTinsukia district of Assam state on 1:50,000 scale, andthe vertical distribution of heavy metal in contaminatedareas, to study the interrelationship of such heavy metal
accumulation in soil with important physico-chemicalproperties of contaminated soils, map heavy metalpollutions and assess risks.
The extent of heavy metal contaminated areas inMorigoan, Dibrugarh and Tinsukia districts of Assamstate have been identified on the 1:50,000 Survey ofIndia topographical sheets through discussion of localpeople, administration, industrial worker and literature.Maps of contaminated sites with road, river/nala,railways and village boundary are prepared and theirareas were calculated. Finally grid maps were preparedusing a square 500 m × 500 m grid and total numbersof grids for each identified areas were collected. Thearea affected due to coal mining effluents (1968 ha &83 grids) are Monglang, Margherita, Bansbari, Kalparaand Aerodram (Fig. 2.8.4), Oil refinery industryeffluents (2378 ha & 100 grids) are Lakhipathar, BarbilNo.3, Kanduguri, Balijan and Barjan (Fig. 2.8.5), Papermill effluents (4605 ha & 188 grids) are Tarang Bil,Khar Bil, Jan Bil, Donga Bil and Bangalbari village (Fig.2.8.6) and Namrup Fertilizer effluents (6110 ha & 252grids) are Balmira, Gariabam, Golaigaon, Doanigaon,Saru Kheramia, Parbatpur, Paniduria, Nagagaon,Rongagora villages and Rukang T.G (Fig. 2.8.7).
Fig. 2.8.6 Grid map of Jagiroad Paper mill area, Morigaon district Fig. 2.8.7 Grid map of Namrup Fertilizer area, Dibrugarh district
Fig. 2.8.4 Grid map of Ledo Coal mining area, Tinsukia district Fig. 2.8.5 Grid map of Digboi Oil refinery area, Tinsukia district
Regional Centre, Jorhat
Annual Report2009-10 89
2.8e. Development of district level landuse plan for Jorhat District in Assamunder rain-fed ecosystem (Part ofNational Network project on districtlevel land use planning and policyissues under different agro-ecosystem of the country)
S. Bandyopadhyay, S.K. Reza andUtpal Baruah
Developing district level land use plan of Jorhatrequires integration data sets on land resources andsocio-economic aspects in relation to the land useobjectives. Geographical Information Systemrecommends digital integration of datasets onland resources for delineating Land ManagementUnits (LMUs). Preparation of LMU involvedfour basic stages of operations, namely,(i) preparation of generalized land use map,
(ii) preparation of soil map from soil seriesassociation map, (iii) generation of agro-ecologicalmap from climatic data and finally (iv) combinationof all three maps by overlay/union operation in ArcGIS 9.3.1.
Precision Geo-coded IRS P6 LISS-III imageries ofJorhat district (83E/16, 83F/1, 13-14, 83J/1-12)(November, to February, 2008-09) and itscorresponding SOI toposheets at 1: 50,000 scale havebeen delineated to identify different land use/landform units. A preliminary traversing of Jorhat districthas been carried out in six different representativesample areas covering all land use, land cover andlandform units. Land use and land cover in the satelliteimageries were identified as per standard legends(Gautam, 2006; CLUMA, National Land use/Landcover Classification System, 2004). Land use/landcover units of Jorhat district have been classified up tolevel-II as depicted in table 2.8.7 and shown infig. 2.8.8.
Table 2.8.7 Land use/Land cover Classification of Jorhat district
Land use/Land Land use/Land Signature in imagerycover units (Level-I) cover units (Level-II)
Built-up areas Urban built-up (I) Blue & green tone, mixed pattern, irregular shape,unsmooth texture, fain pink patches
Built-up areas Rural built up with orchards Red tone mixed with bottle green grains, mixed pattern,plantation and horticulture (II) irregular shape, unsmooth texture
Agricultural land Mono cropping (Paddy) (III) Greenish blue tone, irregular shape, unsmoothtexture
Agricultural land Multi-cropping lands (IV) Faded pink & green tone, mixed pattern, irregular shape,rough texture and also in bottle green tone
Agricultural land Tea gardens (V) Red to faint pink tone, smooth texture, regular shape,definite pattern
Forested area Open forest (VI) Red tone with dark grey grains densely spread over, mixedpattern, irregular shape, unsmooth texture
Forested area Hilly forested area on steeper Very dark intensified red tone, irregular shape, unsmoothslopes (VII) texture
Waste lands Low lying Shrubs areas (VIII) Faded red to pink tone, smooth texture, irregularshape
Waste lands Bar lands (IX) Shiny white, smooth texture, irregular shapeWet lands/marshes Wet lands (X) Dark grey and sky coloured, unsmooth texture, indefinitelyand swamps/bils rounded pattern, irregular shape
Annual Report90 2009-10
Research Achievements
16 dominant soil series were chosen from theSoil series association map (23 map units) ofJorhat district. Based on similarities in salientsoil characteristics from the dominant soil seriesaffecting the land use viz., soil drainage, slope, pH,SOC and texture, soils were grouped into 10different map units. Henceforth, the soil mapwas generalized from 23 map units to 10 numbers.
The salient features of soil characteristics of thedominant series have been described in table 2.8.8and the generalized soil map units of Jorhat districthas been described in table 2.8.9 and shown in fig.2.8.9. The generalized soil map was overlaid on landuse map of Jorhat district to obtain combined soil-landuse map with 35 mapping units as shown in table2.8.10.
Table 2.8.8 Salient soil characteristics for soil map generalization
0-1% - Level to 6.5-7.5 - Neutral - Silty loam/Silty clay Poorly drained-mottlesnearly level loam-Fine loamy within 25-50cm
Table 2.8.9. Generalized soil map unit description of Jorhat district
Generalized DescriptionSoil Map units
A Fine loamy soils of excessively well drained, strongly acidic in reaction, low in organic carbon contenton moderately steep sloping landform
B Coarse loamy soils of well drained, very strongly acidic in reaction, low in organic carbon content ondissected gently sloping landform
C Fine loamy soils of moderately well drained, neutral in reaction, medium in organic carbon contenton gently sloping landform
D Coarse loamy soils of imperfectly drained, strongly acidic in reaction, medium in organic carboncontent on nearly level plain
E Fine loamy soils of moderately well drained, strongly acidic in reaction, medium in organic carboncontent on very gently sloping landform
F Fine loamy soils of moderately well drained, extremely acidic in reaction, medium in organic carboncontent on very gently sloping landform
G Fine loamy soils of somewhat poorly drained, strongly acidic in reaction, low in organic carboncontent on very gently sloping landform
H Fine loamy soils of poorly drained, strongly acidic in reaction, medium in organic carbon content onnearly level plain
I Loamy soils of poorly drained, strongly acidic in reaction, low in organic carbon content on verygently sloping landform
J Coarse loamy soils of imperfectly drained, neutral in reaction, high in organic carbon content on verygently sloping landform
Regional Centre, Jorhat
Annual Report2009-10 91
Table 2.8.10. Soil-land use overlay
LU/LC units Landforms Soil map units Combined mappingunits (total 35)
I. Urban built-up Lower piedmont, dissected gently sloping Isolated unit Iupland, very gently sloping plain (Urban built-up)
II. Rural built up with Upper piedmont and undulating upland, B, C, D, E, F, G, IIB, IIC, IID, IIE,orchards plantation lower piedmont, very gently sloping plain, H, I, J IIF, IIG, IIH, II-I, IIJand horticulture lower flood plains, Lower and upper terraces,
active flood plains
III. Mono cropping Upper piedmont and undulating upland, B, C, D, E, F, G, IIIB, IIIC, IIID, IIIE,(Paddy) lower piedmont, inter-hill valley, very gently H, I IIIF, IIIG, IIIH, III-I
IV. Multi-cropping lands Very gently sloping plain, Lower flood plains, G, J IVG, IVGactive flood plains, Lower and upper terraces
V. Tea gardens Upper piedmont and undulating upland, C, D, E, F, G VC, VD, VE, VF,lower piedmont, dissected gently sloping VGupland, very gently sloping plain
VI. Open forest Upper piedmont and undulating upland, A, B, E VIA, VIB, VIEdissected gently sloping upland
VII. Hilly forested area on Moderately steep to steep hills, upper A VIIAsteeper slopes piedmont and undulating upland
VIII. Low lying-shrubs Lower flood plains, active flood plains, G, J VIIIG, VIIIJareas lower terrace, bar lands
IX. Bar lands Bar lands, marshes and swamps G, J IXG, IJ
X. Wet lands Active flood plain, upper and lower terraces, G, J XG, XJMarshes and swamps
Fig. 2.8.8. Generalized land use map of Jorhat district Fig 2.8.9. Generalized soil map of Jorhat district
LAND USE MAPJorhat District
N
�
GENERALIZED SOIL MAPJorhat District
N
�
Annual Report92 2009-10
Research Achievements
2.8f. Land resource inventory of KatonigaonPanchayat of Titabar Block, Jorhatdistrict (Part of land resource inventoryfor farm planning in different agro-ecological regions of India)
S.K. Reza, S. Bandyopadhyay, A. Natarajanand Utpal Baruah
Information on soil and related properties obtained fromthe soil survey and soil classification can help inidentification and delineation of homogeneous managementzones. The objectives of this study are to delineate similarareas, which respond or are expected to respond similarlyto a given level of management and group similar areas(fields or survey numbers) based on soil-site characteristicsinto management units and showing their extent anddistribution on a suitable base map.
The cadastral map (1:4,000 scale) of six villages underKatonigaon pachayat, namely, Nagajanka, Bochbiharigaon part-1, Bochbihari gaon part-2, Kharimia gaon,Jungle Block No. 38 part-1, Jungle Block No. 38part-2 have been collected from State AgriculturalDepartment. A detailed soil survey was carried out atcadastral map level (1:4,000 scale). Broadphysiographic divisions and cultural features(Fig. 2.8.10) have been delineated by very intensivetraversing for Nagajanka, Bochbihari gaon part-1and
Bochbihari gaon part-2 .Within each physiographicdivision, the various landforms like the moderatelysloping upland, gently sloping upland, nearly level tolevel upland, very low land, valley land are identifiedand their boundaries checked by traversing andcorrected. After careful delineation of the variouslandforms on the cadastral map, updated the cadastralsheets with new permanent features and familiarisationof the area with survey numbers and field boundaries,intensive traversing of each landform was undertakento select representative areas for profile study. 160 hahave been surveyed and soils are found to be very deepwith the solum 18 to 180 cm thick. The A horizon is15 to 18 cm thick. The colour is in hue of 2.5YR to10YR, value 4 to 6 and chroma 1 to 8. The texture issandy loam to silty clay loam and structure sub-angularblock. The B horizon is 74-127 cm thick. Its colour isin hue 10YR, value 4 to 6 and chroma 2 to 6.
2.8g. Land resource inventory of East Lahinggaon panchayat of East-Jorhatdevelopment block, Jorhat district,Assam (Part of land resource inventoryfor farm planning in different agro-ecological regions of India)
S. Bandyopadhyay, S.K. Reza, A. Natarajanand Utpal Baruah
The East Jorhat Development Block is situatedin the geographic setting between 94o202 E to94o372 E longitude and 26o352 N to 26o512N latitude. East Lahing G.P. is situated in theNorth frontier part of the Block. The generalphysiography of East Lahing G.P. is a plainland and no distinct variability in landformshas been reflected in the toposheets (83 J/5, 9).Three horizontally connected villages of EastLahing G.P. have been selected as the studyarea, namely, Changmai (231 ha), Sengsoa(287 ha) and Chetiagaon (240 ha) with a totalarea covering 760 ha. The area has beentraversed with the help of cadastral map(16 inch= 1 mile) of each village to identifythe variability in micro-relief features. The areahas been delineated with four landform units,namely, (i) very gently sloping plain ofBrahmaputra, (ii) flood plain with occasionalflooding hazards, (iii) lower flood plain offrequent flooding hazards and (iv) upperterrace in the river bank of Janzi. The studyarea has been mapped by delineating thevillage boundaries, different landforms unitsand land use features as shown in fig. 2.8.11.Fig. 2.8.10 Landform and Land use map of the study area
Regional Centre, Jorhat
Annual Report2009-10 93
Fig. 2.8.11 Land use and landform map of the study area
Description of landform units
1. Very gently sloping plain of Brahmaputra
A major part of the village Sengsoa and almost theentire part of Changmai villages comprise thislandform with major land use of tea associatedwith paddy and orchard plantation. The teagardens have been noticed interspersed with theadjacent paddy fields along with plantation trees,mostly, bamboo, jackfruit, mango, arecanut, acaciaand other deciduous species. Soils in the very gentlysloping plain were fine loamy in texture (silt-loamto silty clay loam), very deep, hyperthermic, mixedmineralogy, moderately well drained, alluviumderived with great groups, namely, Dystrudepts,and Eutrudepts.
2. Flood plain with occasional flooding hazards
Parts of both Sengsoa and Chetiagaon and a smallfraction of Chagmai cover this landform withpaddy being the dominant Sali (kharif) crop withorchard plantation in the rural built-up areas withoccasional vegetable farming. Soils in the floodplains were coarse loamy in texture (sandy loam),
very deep, imperfect to poorly drained, alluviumderived with great groups, namely, Endoaqueptsand Fluvaquents.
3. Lower flood plain of frequent flooding hazards
The eastern part of Chetiagaon covers thislandform with land use kharif paddy only. Soils inthe lower flood plains are often stagnated withwater for more than three consecutive months andhence water table is high (< 1.5m). Dominant greatgroups are Fluvaquents and Endoaquepts.
4. Upper terrace in the river bank of Janzi
In course of continuous sedimentation loaded byJanzi from the source of Brahmaputra in themonsoon period (May to October) the upperterrace has been developed in the eastern part ofthe village Chetiagaon on the river bank of Janzi.The area has some rural built-up with dense bambooplantation and shrubs. Occasional cultivation hasbeen noticed in the small farming plots. Soils arecoarse loamy textured, with loose and friablestructure with fluctuating water table. Dominantgreat groups are Endoaquents and Fluvaquents.
Annual Report94 2009-10
Research Achievements
Regional Centre, Kolkata2.9a. Land use planning at block level in
two agro-ecological sub-regions ofWest Bengal
D.C. Nayak and Dipak Dutta
Fig. 2.9.1. Land evaluation for rational land use plan of Chakdah block, Nadia, West Bengal(Agro-ecological sub-region 15.3)
The land capability, land irrigability, Storie Indexand Riquier’s Productivity Index (actual andpotential) were used to develop rational land use planof Chakdah block, Nadia district, West Bengal(Fig. 2.9.1).
LAND CAPABILITY MAPChakdah Block Nadia DistrictWest Bengal
N
�
LAND IRRIGABILITY MAPChakdah Block Nadia DistrictWest Bengal
N
�
STORIE INDEX MAPChakdah Block Nadia DistrictWest Bengal
N
�
PRODUCTIVITY INDEX MAP (POTENTIAL)Chakdah Block Nadia DistrictWest Bengal
N
�
Regional Centre, Kolkata
Annual Report2009-10 95
The land capability and irrigability classificationindicated that the soil units 1,2,3,6 were good cultivableland with some limitations of drainage and loamy sandto sandy texture in the sub-surface horizons. These wereranked good and fair based on the evaluation of Storieindex. Riquier’s Productivity Index (actual andpotential) was good based on nine soil properties, viz.effective soil depth, texture, base saturation, solublesalts, organic carbon, CEC, mineral reserves, drainageand soil moisture content. However, potentialproductivity Index of soil units (2, 3 and 5) may changefrom II (good) to I (excellent) with the adoption ofmanagement intervention like, drainage improvement,irrigation, addition of organic matter and fertilizermanagement.
2.9b. Effect of land use changes on totalsoil organic carbon (SOC) and itsactive pool in humid to per humideco-region of West Bengal
Dipak Dutta and D.C. Nayak
The study was undertaken to evaluate the effect ofvarious land uses on total soil organic carbon as wellas on its active pool over a period of little over twodecades (1987-2009) in different soils of Tarai region(humid to perhumid eco-region) of West Bengal. Soilsamples from four soil series, namely, Paharpur series,Berubari series and Kumargram series in Jalpaiguridistrict and Simulbari series in Darjiling district werecollected at the depth of 0-20 and 20-40 cm. The soilswere analyzed for some important properties viz. pH,organic carbon, particle size classes and bulk density(Table 2.9.1).
The observations made in change in Soil OrganicCarbon (SOC) status over the aforementioned periodare as follows.
• Paharpur series (cultivated) showed decline in SOCby 15%.
• Berubari series (cultivated) and Kumargram series(Tea garden) showed a rise of SOC by 15.8% and29%, respectively.
• Simulbari series (forest) showed decline in SOCby 1.5%.
The status of soil organic carbon (SOC) observed underdifferent land uses was in the order, forest> fallow>tea> paddy> sesame in Simulbari series.
2.9c. Soil- based approach towardsrational land use planning usingGIS and remote sensing
S. Mukhopadhyay and T. Banerjee
Soil productivity of Raipur and Ranibandh blocks inBankura district was evaluated by using parametricapproaches viz. Storie land productivity index andRiquier’s soil productivity index (Figs. 2.9.2 & 2.9.3).Both the systems of evaluation indicated thatlower reaches (9 % of the study area) of Bhairabankiand Tarafini rivers were good and could be utilized forthe cultivation of a wide range of crops. Lowerand upper plains and a part of pediment plains(332 sq km, 40 % of the study area) were evaluatedas soils of Grade II. The central part of the studyarea, occupying 32 % of the total geographicalarea was ranked fair for the agricultural purposes.Hills, steep slopes and dissected plateaus wereobserved not suitable for agriculture in the presentset of conditions and this type of land covers about10 % area.
Table 2.9.1. Important properties of soils (Range)
Soil series pH (1:2.5) Bulk density Particle size class Organic carbongcm-3 (%)
Fig. 2.9.2. Land productivity index (Storie index) of Raipur& Ranibandh blocks
Fig. 2.9.3. Soil productivity index (Riquier’s index) of Raipur& Ranibandh blocks
2.9d. Correlation of soil series of easternstates (West Bengal, Bihar, Jharkhand,Orissa, Sikkim, A&N islands)
S.K. Singh, A.K. Sahoo, D.C. Nayak, K. Das,S.K. Gangopadhyay, K.D. Sah, D. Dutta,T. Chattopadhyay, S. Mukhopadhyayand T. Banerjee
Five soil series namely, Dumar Pat, Siskari Pahar,Bagru, Hirhi, Chalho in Lohardaga district,Jharkhand and three soil series namely, Amarda,Andheri and Kochilakunti in Mayurbhanjdistrict, Orissa were correlated and finalizedfor incorporation in the National Soil SeriesRegister.
2.9e. Development of district level land useplan for Nadia District in West Bengalunder irrigated ecosystem
A.K. Sahoo, S.K. Singh, D.C. Nayak and T.Banerjee
For developing Land management Units (LMUs),representing a part of landscape similar in soilattributes, drainage and land use, the management unitswere defined. For the exercise, the reclassified attributemap of soil texture and drainage, the most crucialproperties for the region was prepared. The attributemaps were combined in GIS for developing soilmanagement units having distinct properties ofmanagement (Fig.2.9.4). The figure also presents thelocation of the dominant soil series in the district. Thesequence of horizons and soil classification for each ofthem are elucidated in table 2.9.2.
Fig. 2.9.4. Soil management units of Nadia district,West Bengal
SOIL MANAGEMENT UNITSNadia District, West Bengal
N
�
LAND PRODUCTIVITY INDEX(STORIE)
Raipur & Ranibandh BlocksBankura District
West Bengal
N
�
LAND PRODUCTIVITY INDEX(RIQUIER)
Raipur & Ranibandh BlocksBankura District
West Bengal
N
�
Regional Centre, Kolkata
Annual Report2009-10 97
2.9f. Land resource inventory for farmplanning in Chinchura- Mogra andPolba-Dadpur block, Hugli district,West Bengal
S. Dharumarajan, S.K.Gangopadhyay,A. Natarajan and S.K.Singh
For standardizing methodology of detailed soil survey,about 18983 hectare area was selected in the lowerpart of Indo-Gangetic alluvial plain. It is locatedbetween 220 52’ 06’’ to 230 04’07" north latitude and880 09’ 01" to 880 24’54" east longitude in Chinchura-Mogra and Polba-Dadpur block, Hugli district. Thearea showed the assemblage of new and old levee;younger and older alluvial plain.
New levees are under rice-rice cropping sequence,whereas old levee are covered with banana and mangoplantations. Younger alluvial plains with paleo-
channels are used for paddy-potato/mustard croppingsequence, whereas the older alluvial plains are usedfor rice-rice cropping sequence.
Eight profiles were studied, two on each landform, forestablishing soil-physiographic relationship anddeveloping tentative legend for detailed soil survey(Fig.2.9.5). The results indicated that soils of older leveewere deep, imperfectly drained, silty clay loam to siltyclay in texture. The soils of new levee were deep,imperfectly drained, silty loam to silty clay in texturewith additional distinct features of slickensides andpressure faces. The recent alluvial soils were deep, welldrained sandy loam to sandy clay loam textured, restingon coarse sandy material whereas soils of older alluvialplains were deep, imperfectly drained, silty clay intexture. There has been fair degree of pedogenesis asevident from well developed medium, moderate subangular blocky structure in soils of older alluvial plains.
Table 2.9.2. The sequence of horizons and classification of soils of Nadia district
Fig. 2.9.5. Soil physiographic relationship in lower part of Indo-Gangetic plain
2.9g. Identification and characterization ofbenchmark soils of Orissa and Biharfor agro-technology transfer
S.K.Singh, T. Chattopadhyay, D.C. Nayak,A.K. Sahoo and K.D. Sah
Benchmark soils of Orissa have been identified byutilizing existing soil resource database of the state.The distribution of benchmark soils is shown in fig.2.9.6 and the salient characteristics of each of themare elucidated in table 2.9.3.
Fig. 2.9.6. Benchmark soil sites of Orissa
BENCHMARK SOIL SITESOrrisa, India
N
�
Regional Centre, Kolkata
Annual Report2009-10 99
Table 2.9.3 Salient characteristics of Benchmark soils of Orissa
Benchmark soils Landforms Area Depth Particle Size Surface Constraints(000’ha) class class texture
Soils of hill ranges in eastern ghats (granite gneiss landscape, Area 2348.43, SRM units 1-12)Typic Rhodustalfs1 Hills 625.8 Very deep M loam erosionUltic Paleustalfs1 Hills 342.0 Very deep F loam erosionVertic Halaquepts2 Inter-hilly valley 201.8 Very deep F clayey flooding
Soils of hill ranges in eastern ghats (Dharwar landscape, Area 601.43, SRM units 13-24)Typic Haplustepts1 Hill 202.4 Deep M loam erosionTypic Haplustalfs2 Hill 113.7 Mod.deep M loam erosion
Soils of Garhjat hills in eastern plateau ( granite and granite gneiss landscape, Area 1783, SRM units 25-42)Typic Ustorthents 1 Hills 316.7 Deep M loam erosionTypic Haplustepts2 Uplands 204.8 Deep M loam erosion
Soils of Garhjat hills in eastern plateau ( Dharwar landscape, Area 1834.11, SRM units 43-53 )Typic Haplustepts1 Hills 764.7 Deep F loam erosionLithic Ustorthents2 Hills 386.4 Mod. shallow L loam erosion
Soils of Garhjat hills in eastern plateau (Gondwana landscape, Area 276.15, SRM units 54-60)Typic Haplustepts2 Upland 61.0 Deep F loam erosionVertic Haplustepts2 Upland 32.6 Very deep F loam
Soils of Garhjat hills in eastern plateau (Laterite landscape, Area 215.62, SRM units 61- 68)Typic Haplustepts1 Upland 61.6 Deep K loam erosionAeric Halaquepts2 Upland 28.8 Mod. shallow M loam erosion
Soils of Garhjat hills in eastern plateau (Dandkaran landscape, Area 973.42, SRM 69-80)Typic Rhodustalfs2 Plain 182.2 Deep M loam erosionTypic Haplustalfs2 Plain 193.7 Deep F loam erosion
Soils of Mahanadi basin, Area 3139.26 ( SRM units 81-97)Typic Haplustepts2 Upland 377.3 Mod. shallow M laom erosionTypic Haplusterts2 Valley 325.1 Deep F clayey salinityTypic Haplustalfs2 Valley 206.8 Deep F clayey erosion
Soils of Bengal basin ( Gently sloping alluvial plains, Area 9.36 SRM unit 98)Vertic Halaquepts2 Plain 5.6 Very deep F clayey flooding
Soils of Bengal basin (Dissected undulating upland, Area 198.29, SRM unit 99-104)Typic Haplustalfs2 Upland 64.5 Mod. shallow M loam erosionAeric Ochraqualfs2 Upland 36.1 Very deep L loam erosion
Soils of eastern ranges in eastern ghats (Granite and granite landscape, Area 481.40, SRM unit 105-111)Ultic Haplustalfs1 Hills 94.9 Mod.shallow M sandy erosionRhodic Paleustalfs Pediment 100.2 Very deep M loam erosion
Soils of eastern ranges in eastern ghats (Dharwar landscape, Area 1100.49, SRM units 112-126)Typic Ustorthents1 Hills 124.4 Mod. shallow K sandy erosionTypic Ustropepts2 Upland 162.9 Very deep M loam erosionKandic Paleustalfs1 Hills 90.7 Very deep M loam erosion
Soils of eastern coast (Utkal plain, Area 1128.7, SRM units 127-143)Aeric Endoaquets2 Inland basin/ 228.4 Very deep M to F Loam to clayey drainage
coastal plain/mangroveVertic Endoaquepts2 Inland basin/ 303.0 Very deep F clayey drainage
coastal plain
Soils of eastern coast (Mahanadi Delta, Area 1170.43, SRM units 144-159)Typic Fluvaquents2 Upper delta 118.8 Very deep M loam floodingVertic Fluvaquents2 Lower delta 108.5 Very deep F clayey floodingVertic Endoaquepts2 Lower delta 108.8 Very deep F clayey flooding
2.9h. Geomorphic and hydrologicalevaluation of a micro watershed inChhotanagpur Plateau, West Bengalfor sustainable utilization of soil andwater resourcesT. Banerjee, S.K. Singh, K. Das andDharumarajan, S.
Droghtiness and scarcity of water are the majorconstraints for the small and marginal farmers inChotonagpur plateau region of West Bengal, Jharkhandand Orissa (with prevailing rice-rice cropping system)in securing livelihood. Undulated topography, diverseslope and severe erosion further accentuate the water
Fig. 2.9.7. Dwarkeshwar micro-watershed
ALTITUDE
Altitude (m)<190
190-200
200-210
210-220
220-230
230-250
>250
SLOPE
Slope
level to nearly level
Very gently sloping
Gently sloping
Moderately sloping
Moderate to steeplysloping
TOPO INDEX
Legend
Very low (20-25)Low (14-20)Moderate to low(9-14)Moderate (6-9)
High (0-6)
SLOPE ASPECT
Slope Direction
North East
South East
North West
South West
CURVATURE
Curvature
Convex Slope
Concave Slope
1
2
DWARKESHWAR MICROWATERSHED (Rn7h)
Regional Centre, Kolkata
Annual Report2009-10 101
crisis. The Department of Agriculture, Govt. of WestBengal and the farmers of the region attempted toresolve the issues of water stress and erosion byconstructing contour bunds, based on some qualitativeinformation and personnel experience of geomorphological,soils and hydrological properties of the terrain. However,more such constructions and scientific interventions areneeded based on quantification of these properties tocome out with an alternative land use plan for theholistic development of the area. Therefore, to addressthe problem the present investigation has beenundertaken with the following objectives
• To evaluate geomorphometric parameters andhydrological properties of micro watershed
• To develop sustainable land use plan by effectiveutilization of soil and water resources under
the prevailing socio-economic conditions of thefarmers.
A micro-watershed covering an area of 948.61 habetween 23O 24´ to 23O 26´ north latitude and 86O 33´to 86O 35´ east longitude was selected in the easternfringes of Chhotanagpur plateau in Puruliya district ofWest Bengal.
Digital elevation model (DEM) was generated at9 metre resolution using point data collected fromGoogle-Earth and line data from ASTER GDEM forcollecting quantified information on altitude, slope,aspect and curvature of the watershed (Fig. 2.5.7). Alandform map was prepared by combining slope,curvature, altitude and aspect in GIS (Fig. 2.9.8) thatwill be utilized for developing quantitative soil landformrelationship in the project.
Fig. 2.9.8. Geomorphological map of Dwarkeshwar micro-watershed
Geomorphic division and their morphometric character
Geomorphic Divisions Altitude Curvature Topo Index Slope
Level / lowlying plain <200m Convex & concave Very low (14-25) level to very gently sloping plain (0-3%)
Undulating plain 170-230m Convex & concave Moderate to very low (6-25) level to very gently sloping plain (0-3%)
Undulating upland 200-250m Convex & concave High to low (0-20) Gentle to moderately sloping land (3-15%)
Hill / plateau top 220-375m Convex & concave High to moderate (0-9) Gentle to moderately sloping land (3-15%)
Hill slope <250m Convex & concave High (0-6) Moderate to steeply sloping (<15%)
Annual Report102 2009-10
Research Achievements
2.9i. Natural resource assessment usingRS and GIS - A case study in BadejoreNala micro watershed in Utkal Plainof Orissa
K. Das, T. Banerjee, and S.K.Singh
Another micro-watershed located between 20°10' to20°15' north latitude and 85°35' to 85°45' eastlongitude on 596.12 hectare area in Khurda block ofOrissa State under hot & dry sub humid climate(1438.34 mm mean annual rainfall with mean
summer temperature of 29.30C and mean wintertemperature of 23.10C) was selected for developingoptimum land use plan based on quantifiedgeomorphological, soils and hydrological properties ofthe terrain.
Digital elevation model was generated based on theelevation extracted from Google image and ASTORGDEM of 30 m resolution data. From digital elevationmodel slope and flow path of water in the watershedwere derived (Fig. 2.9.9). The present land use map ofthe watershed was also attempted (Fig. 2.9.10)
Fig. 2.9.9 Digital elevation model and slope parameters of Badejora Nala micro watershed
Fig. 2.9.10 Land use map of Badejora Nala micro-watershed
BADEJORE NALA MICROWATERSHEDALTITUDE
Altitude (m)
SLOPE
Slope (%)
FLOW PATH WITHIN BASINS SLOPE ASPECT
Slope DirectionNorth EastSouth EastNorth WestSouth West
LAND USEBadejore Nala Microwatershed
LEGENDSingle cropDouble cropFallow landThick forestWater body
Regional Centre, Kolkata
Annual Report2009-10 103
2.9j. Soil resource inventory and landevaluation of Aurangabad district,Bihar (1: 50,000 scale)
Aurangabad district in south Bihar consists of twosubdivisions and eleven blocks. It covers an area of3305 km2 between 24°17' 03" to 26°07' 46" northlatitude and 84°0' 26" to 84°53' 05" east longitude.Climate of the district is dry sub-humid subtropicalwith a high mean summer and winter temperature of410C and 100C, respectively. The annual rainfall rangedfrom 1000 to 1200 mm. The district represents thetransition geology between Chhotanagpur plateau andVindhyan range. There is a fringe of Chhotanagpurplateau in the southern part and alluvial plain of Sonriver in the western side after Kimur plateau. Thus Sonriver is trapped between these two geologicalformations. The elevation varies from 50 to 450 mabove MSL.
Based on the Survey of India Toposheet (1:50,000 scale),interpretation of the geocoded FCC (Fig.2.9.11) of IRSID LISS III (1: 50,000 scale) and thorough traversing,eight broad physiographic units were identified anddelineated (Table 2.9.4). Soil physiographic relationshipwas established and shown in fig. 2.9.12.
Fig. 2.9.11. IRS ID LISS III image of part of Aurangabad district, Bihar
Fig. 2.9.12. Soil-landscape relationship in Aurangabad District, Bihar
Annual Report104 2009-10
Research Achievements
Shallow, yellowish brown to grayish brown gravellysandy loam soils characterized the back and sideslopes of hills whereas moderately deep, yellowishbrown gravelly sandy loam soils predominantlyconstituted the pediment surfaces. Both geomorphicunits in the district support different kinds of woodyforest vegetation. The upper part of the undulatinguplands support paddy in the summer, wheat and pulsesin the winter. The soils were deep to very deep,very dark grey brown (10 YR 3/3) to dark greybrown (10 YR 4/2) with sandy loam surface andsandy clay loam to silty clay loam subsurface. The
lower part of the undulating plain is partly dissectedand has gray brown to very dark gray brown soilswith sandy loam surface and sandy clay to silty clayloam sub-surface. These were calcareous, extensivelycracked at places and support mustard and pulses inthe winter season on stored residual moisture afterpaddy. Surface and sub-surface texture of soils ofalluvial plain and in the narrow valleys were similar tothe lower part of undulating plain. However, darkbrown to olive brown colour and redoximorphicfeatures separated these soils from their previouscounterparts.
Table 2.9.4 Description of the interpreted units of Aurangabad district
Map units Landforms Image characteristics
1. Alluvial terraces
ai Upper Dominantly white grey and red mixed tone
aii Middle & lower Dominantly greenish white, grey and red mixed tone
2. Eastern plateau
a Steep hills Dark brownish red tone
b Escarpment Dark brownish red and dull red mixed tone
c Moderately sloping hill slope Dark brownish red mixed with red and grey tone
4. Pediments
a Moderately sloping Dull red mixed with grey, white tone
b Gently sloping Dominantly grey mixed with dull red tone
5. Undulating upland with isolated hillocks
a Gently sloping Mixed red, white blue and grey mixed tone
b Very gently sloping Whitish blue mixed with pink and grey
c Nearly level Light blue with red and white spots
d Nearly level with slight dissection Glossy white, red and grey mixed
f Narrow valley Blue, grey and red mixed
h Residual hillocks Dark grey, brown mixed
6. Dissected alluvial plain
a Gentle sloping – upper part Dominantly blue with white and red mixed
b Very gently sloping-middle part Dominantly bluish white and red mixed tone
d Nearly level, lower and middle part Glossy white with red mixed tone
f Nearly level slight to moderately dissected Whittish blue mixed with red tonenarrow valley
g Nearly level moderately eroded Dominantly whitish grey mixed tone
Regional Centre, Udaipur
Annual Report2009-10 105
2.10a. Soil resource inventory and landevaluation of Chittaurgarh district forland use planning
T.P.Verma, A.K.Singh and R.L.Shyampura
About 70,000 ha area in toposheet 45L/6 and 45L/5comprising Bhadesar, parts of Dungla and Kapasantehsils were surveyed and mapped at soil seriesassociation level. The soils of area are developed onGneiss, Schist, phyllites and alluvium of Banas, Berach,Wagon, Gambhiri, Jakham rivers and its tributaries.
The major soils of eastern Rajasthan upland intoposheets 45L/6 and 45L/5 are briefly described asbelow:
Soils of dissected hill and ridges: Soils of the landformare very shallow to shallow, excessively drained, brownto strong brown (7.5YR5/4 to 4/6), calcareous gravellysandy loam to loamy sand on 8 to 15% slope withgravelly sandy loam surface, severe to very severeerosion and strong stoniness/gravellyness and classifiedas loamy skeletal, Lithic Ustorthents associated withrock out crops. They are mostly barren with scrubsand used as pasture.
Soils of pediments: These are shallow, somewhatexcessively drained, dark brown to dark yellowishbrown (7.5YR4/4 to 10YR4/6), calcareous sandy loamon 3-8% slopes with sandy loam surface, severelyerosion and strong stoniness and classified as loamyskeletal, Lithic Ustorthents associated with moderatelyshallow, calcareous coarse loamy with sandy loamsurface and slight stoniness and classified as TypicUstorthents. They are under barren used as pasturingand maize crop at places.
Soils of dissected river valley: Soils in dissected rivervalley are deep, well drained, dark yellowish brown(10YR4/4), calcareous, sandy loam, on 3-8% slope
with severe erosion, moderate stoniness and classifiedas coarse loamy, Typic Haplustepts and associated withdark brown (10YR3/3), calcareous loam to sandy clayloam with loam surface, moderate erosion and slightstoniness and classified as fine loamy, TypicHaplustepts. They are cultivated to maize and wheat.
Soils of gently to moderately sloping land withmonodnocks (plain)
(a) Gently to moderately sloping plain: Soils of thislandform are predominantly moderately shallow,well drained, dark brown to brown (10YR3/3 to4/3), calcareous sandy clay loam with sandy clayloam surface with slight erosion and classified asfine loamy, calcareous, Typic Haplustepts andassociated with moderately shallow/moderatelydeep, dark yellowish brown (10YR4/4), loam tosandy loam with sandy loam surface with slighterosion and slight stoniness and classified as fineloamy, Typic Haplustepts. They are under maize,groundnut and wheat cultivation.
(b) Gently to undulating sloping plain: Soils aredominantly shallow, somewhat excessively drained,dark yellowish brown (10YR3/4), calcareous sandyloam with severe erosion and strong stoniness/gravellyness and classified as loamy skeletal, (cal.),Lithic Ustorthents associated with moderatelyshallow, well drained, brown to dark brown(10YR3/3), calcareous sandy clay loam withmoderate erosion and slight stoniness and classifiedas fine loamy, Typic Ustorthents. They are underbarren (scrub) and pasture. Moderately shallow,brown to dark brown, calcareous loamy skeletal,Typic Ustorthents occupy sizable area of thislandform.
(c) Nearly level to gently sloping plain: Soils of thelandform are moderately shallow, well drained,
Regional Centre, Udaipur
Annual Report106 2009-10
Research Achievements
brown to dark yellowish brown (10YR5/3 to 3/4),sandy loam to clay loam with sandy loam surface,slightly eroded and classified as fine loamy, TypicHaplustepts associated with moderately shallow,dark yellowish brown (10YR3/4), calcareous sandyloam with sandy loam surface, moderately erodedand moderate stoniness and classified as coarseloamy, calcareous, Typic Haplustepts. They arecultivated to maize, wheat and mustard.Moderately deep, very dark gray to gray (10YR3/1to 5/1), calcareous clay loam with clay loamsurface and classified as fine, Vertic Haplusteptsare also occur in association. They cultivated tocluster bean (guar), maize, wheat and pea.
(d) Very gentle to gently sloping plain: Soils aregenerally moderately deep, dark yellowish brown(10YR3/4), calcareous coarse loamy, TypicHaplustepts and moderately deep, very darkgrayish brown to grayish brown (10YR3/2 to 3/3), calcareous fine, Vertic Haplustepts associatedwith moderately shallow, dark brown to darkyellowish brown, sandy loam to clay loam TypicHaplustepts. They are under pasture, maize, wheat,soybean and barley.
(e) Nearly level sloping plain: Soils are moderatelydeep to deep, moderately well drained, very darkgray to very dark brown (10YR3/2 to 2/2),calcareous, clayey and classified as fine, TypicHaplusterts. They are cultivated to maize, wheat,mustard and ajwain.
Surajpura and Sohankhera comprising about 1200 hahave been completed. Three major landform units viz.gently to undulating land with hillocks, upland andplain have been delineated which has been furthersubdivided into different physiographic units based onslope, tone, texture. The area was traversed, transectswere marked in different landform units, soil pedonswere studied, major soils identified and randomchecking was done to draw boundary of different soilsmapping units. In Daulatpura village, nine soil serieswere identified and mapped into 17 mapping units(phases of different soil series). The soils on gently tomoderately sloping subdued hills are shallow tomoderately shallow, somewhat excessively drained towell drained, lighter in colour (7.5YR3/3 to 10YR4/4),calcareous, loamy sand to sandy loam in texture andhave sandy loam surface texture, severely eroded andmoderately to strongly in stoniness. They are underpasture or barren. On gently sloping upland, soils aremoderately shallow, well drained, medium in colour(10YR3/3 to 3/4), calcareous, sandy clay loam to loamwith loamy in surface with moderate erosion and slightstoniness/gravelliness. A single maize crop is grown inkharif. The soils on plain are moderately shallow todeep, darker in colour (10YR3/2 to 2/2), calcareoussandy clay loam to clay with sandy clay loam in surfaceand very slightly to moderately eroded. These soils aremostly under double crop (maize, wheat, mustard,cotton and opium) with irrigation (Table 2.10.1 andFig. 2.10.1).
Fig. 2.10.1 Soil map of Daulatpura village, Bhedasar Tehsil, Rajasthan
2.10b. Land resource inventoryfor farm planningin different agro-ecological regions ofIndia - Bhadesar tehsil(cluster of 10 villages) inChittaurgarh district(Rajasthan)
T.P. Verma, R.S. Singh,A.K. Singh and R.L.Shyampura
The detailed survey has been carriedout in clusters of 10 villages ofBhadesar Tehsil for preparation of landresource inventory for farm planningof Chittaurgarh district. Mapping ofthree villages, namely Daulatpura,
SOILDaulatpura, Tehsil Bhedasar
N
�
Regional Centre, Udaipur
Annual Report2009-10 107
2.10c. Development of district level land useplan for Bundi district (Rajasthan)under semi arid ecosystem
R.S. Singh, A.K. Singh and R.L. Shyampura
Soil resource map generated during district mappingproject on 1:50,000 scale were used to preparegeneralized soil map and soil map index. Existingland use map was prepared with the help of remotesensing data in conjunction with survey of Indiatoposheet to study the land use - soil attributerelationships and the land use/land cover map preparedby the NRSC, Hyderabad using multi temporal AWIFSdata. Maps of generalized soil, present land use andcensus (literacy) have been integrated in GIS for thedelineation of the land management units (LMU).
Natural resources assessmentCensus and socio-economic pattern
Some of important census demographic and othervariables of the district have been presented intable-2.10.2. As per the district census 2001, total
population of the district is 783058 persons distributedin 856 settlements (villages) with the population densityof 173 person per sq km. The density of population inNainwa and Kehsoraipatan tehsils are lower than thedistrict average whereas Hindoli tehsil has highestdensity of population (186 persons). Population densityin Bundi and Indergarh is comparable to those fordistricts. The density of population is marginally higheras compared to the state. Nearly half of the population(51.56 percent) of the district is literate which is lowas compared to the state average (60.40%). In thedistrict, forest covers 24.24 per cent area and 45.96per cent area is cultivated of which 61.38% area isirrigated. About 13.3% area is culturable wastewhereas 16.54% area is not available for cultivation.Forest cover is highest in Bundi and Hindoli tehsilwhereas it is lowest in Kehsoraipatan tehsil. About 67to 73 per cent of the net sown area in Bundi, Hindoliand Kehsoraipatan is irrigated mainly canals and wells.The per capita availability of land for agriculture is0.52-0.62 ha in Indergarh, Bundi and Keshoraipatantehsil whereas Hindoli tehsil has 0.34 ha land availablefor agriculture.
Table 2.10.1 Description of soils in Daulatpura village of Bhadesar Tehsil
Map Depth Colour Surface PSC Land use Taxonomy Area haunit (cm) texture (%)
Gently to undulating land with hillocks : (a) Moderately sloping subdued hillDp-A 25-50 7.5YR3/4 to 4/4 Sl lsk Barren/pasture L. Ustorthents 29.40
(12.06)
(b) Gently to undulating land (pediments)Dp-B 50-75 7.5YR3/4 to Sl lsk Mostly pasture and maize/ T. Ustorthents 45.52
10YR4/4 sesame at places (18.68)
Gently sloping uplandDp-C 50-75 10YR3/3 to 3/4 Sl, l Fl Mainly maize and pasture T. Haplustepts 23.54
at places (9.66)
Nearly level to gently sloping Plain : (a) Very gently sloping plainDp-D 50-75 10YR3/2 to 3/3 L, scl Fl Maize/ground nut and T. Haplustepts 82.98
wheat (34.05)
(b) nearly level sloping plainDp-E 75-100 10YR3/2 to 3/3 Cl, sc F Maize, wheat and mustard V. Haplustepts 25.56
(10.49)Dp-F >100 10YR3/2 to 2/2 Cl, c F Maize, wheat and pasture T. Haplusterts 22.28
(9.14)
(c) Nearly level to gently sloping plainDp-G 75-100 10YR4/3 to 3/3 sl Cl/s Maize and sesamum T. Ustifluvents 5.20
(2.13)Dp-H 75-100 10YR3/3 to 3/2 cl Fl/cl Mostly pasture and maize F. Haplustepts 2.66
at places (1.09)Habitation 6.58
(2.70)
Annual Report108 2009-10
Research Achievements
Table 2.10.2 Important census and socio-economic features of the Bundi district
Total Geographical area (ha) 192227 118995 66065 70618 134038 581943Population 258916 189290 79564 99061 156227 783058Population Density 175 186 172 169 160 173No. of Village 269 174 121 112 180 856Average no. of Household per Village 168 192 118 149 152 160Literacy (%) 51.48 49.49 53.20 53.10 51.66 51.46Forest (%) 27.82 31.02 18.22 16.04 19.45 24.24Culturable Waste (%) 12.36 14.29 15.00 13.70 12.29 13.26Cultivated land (%) 42.37 39.17 49.26 51.52 53.63 45.96Irrigated land (%) 29.23 29.23 28.08 37.36 24.00 28.21Irrigated Cultivatable land (%) 69.00 67.46 57.01 72.51 44.74 61.38Per capita availability for agriculture (ha) 0.54 0.34 0.52 0.62 0.49 0.49
HydrogeologyBasic data (hydro-geological map with benchmarkwells) including chemical data of water and averagedischarge of wells were collected from the StateGroundwater Department, Rajasthan for the year 1996and 2006. Attributes of each well were integrated inGIS. The chemical data provide information on waterquality for agriculture and human consumption.Annual pumpage of existing wells in Keshoraipatan,Indergarh and Bundi tehsil occurring predominantlyin alluvium and shales/limestones/sandstones geologicalformations are greater as compared those (Hindoli andNainwa tehsil) on phyllites and limestones/shales(Table.2.10.3 & Fig. 2.10.2). The average discharge(m-3 per day) of wells with pump and tubewells are 45to 180 and 55 to 200 in Keshoraipatan/Indergarh whileit is 60 to 170 and 70 to 180 in Bundi tehsil indicatinghigher groundwater potential of these tehsils. However,
values of average discharge remains identical withoutpump irrespective of geology.
Fig. 2.10.2 Hydrology of Bundi district of Rajasthan
Table 2.10.3 Quantitative assessment of annual pumpage from the existing wells in Bundi district
Tehsil Dominant Geology Type of wells Av. Discharge(m3per day)
Hindoli Phyllite & limestone With pump 65-70Without pump 30Tubewell 70-75
Nainwa Phyllite & shales/limestone With pump 55-60Without pump 30Tubewell 65-70
Keshoraipatan and Indargarh Alluvium & shale/limestone With pump 45-180Without pump 30Tubewell 55-200
Soils: Soil map of the Bundi district has been preparedas association of dominant and subdominant soil serieswith or without inclusion and mapped in 61 map unitsof soil series associations. These mapping units havebeen described for major soil attributes such as depth,particle size class, texture, slope, erosion and otherphases.
Generalized soil map: The soil map often has largenumber of map units. These have to be generalized tomanageable (and meaningful) number of entities beforecombining with other spatial data sets. The dominantsoil series have been considered for the preparation ofgeneralized soil map. Most significant soil and siteparameters of the series, such as soil depth, particlesize class (soil family) and slope class, have been selectedfor this purpose. Five depth class (<25, 25-50, 50-75,75-100 and >100 cm) and four slope class (<1, 1-3, 3-8 and 8-15%) have further been reduced to three depthclass (<50, 50-100 and >100 cm) and slope class (<3,3-8 and 8-15%) by broadening the limits of soil andsite attributes whereas no generalization is made inrespect to particle size class (loamy skeletal, loamy, fineloamy and fine).
The generalized soil map consist 13 map unitsincluding one under rock outcrops (Table 2.10.4 andFig. 2.10.3). Deep, fine soils on nearly level to verygentle slope cover an area of 27.6 per cent followedby shallow loamy soils (18.25%) and deep fine loamysoils (15.3%).
Table 2.10.4 Generalized soil map units of Bundi district
Generalized Soil and site parameters Area Per cent ofSoil Unit Soil depth (cm) Particle size class Slope (%) LGP (days) (ha) total area
5 Medium (50-100) Fine loamy <3 105-135 20608 3.54
6 Medium (50-100) Fine loamy 3-8 105-135 7378 1.27
7 Medium (50-100) Fine loamy 8-15 105-120 7764 1.33
8 Deep (>100) Fine loamy <3 120-135 89061 15.30
9 Deep (>100) Fine loamy 3-8 105-135 58752 10.10
10 Deep (>100) Fine loamy 8-15 120-135 7429 1.28
11 Deep (>100) Fine <3 120-135 160659 27.61
12 Deep (>100) Fine 3-8 120-135 3448 0.59
13 Rock outcrops 3-8 90-105 13679 2.35
Soil map index
The generalized soil map prepared taking intoconsideration only dominant series masking featuresof sub dominant and inclusion resulting in high degreeof extrapolation for spatial distribution. The soil mapindex is derived by calculating an area weighted soilmap index of each map unit by multiplying the ratingof each parameters of the series by area of the soil serieswithin the unit followed by summing the weighted valueand dividing by the total area of the map unit. Eachsoil parameters of dominant, sub-dominant andinclusions is rated on the scale of 1 to 5 based on theirquality and responsiveness to management. Values ofdominant, subdominant and inclusion were averagedto derive single index for a map unit and presented atphysiography and tehsil level.
Generalised Soil map ofBundi district
N
�
Fig. 2.10.3 Generalised Soil map of Bundi district
Annual Report110 2009-10
Research Achievements
Soil map index of the district (Table 2.10.5) indicatesthat around 60 per cent are of the district have high(3.0-4.0) and very high (>4.0) index rating. Soil indexis low in 10.56 per cent area of the district concentratedin northern part of Hindoli and Nainma and southernregion of Bundi tehsil (Fig.2.10.4). The soil map indexis higher in Vindhyan region as compared to easternplain. In Nainwa, Indergarh and Keshoraipatan tehsil,index rating is high to very high (Table 2.10.5).
Land use pattern
The existing land use in the district has been delineatedusing remote sensing data (IRS-ID) and Survey of India(SOI) topo-sheets with sufficient ground truths (over700 observations) collected during the soil resourcemapping of the district on 1:50,000 scale. Forestboundaries have been extracted from the toposheetsas demarcated on sheets such as the reserved, protectedand mixed open jungle (forest). Other land use typesseparated with the help of imageries in conjunctionwith toposheets.
In the district 30 per cent area is under forest. Theseare mainly confined in Bundi, Hindoli and Nainwatehsils whereas Kehoraipatan and Indergarh tehsils arealmost devoid of any forest cover. Open scrub withravines are concentrated in Indergarh andKeshoraipatan and open scrubs with agriculture inBundi, Hindoli and Nainwa tehsils. Area underagriculture is 46.6 percent. It is predominant in Nainwaand Keshoraipatan tehsils covering over 60 per centarea of tehsil. Vindhyan land from has greater area
Table 2.10.5 Soil map Index in Bundi district
Tehsil Soil Map Index
Low Medium High Very High<1.5 1.5-3.0 3.0-4.0 >4.0
Bundi ha 10816 78803 35946 61144
% 5.6 41.0 18.7 31.8
Hindoli ha 18713 48695 22630 25153
% 15.7 40.9 19.0 21.1
Indergarh ha 9075 8599 27457 18443
% 13.7 13.0 41.5 27.9
Keshoraipatan ha 1253 2863 25249 38960
% 1.8 4.0 35.7 55.2
Nainwa ha 21568 14943 88120 6584
% 16.1 11.1 65.7 4.9
District ha 61424 153903 199402 150284
% 10.5 26.4 34.3 25.8
under forest and agriculture as compared to the easternplain. Forest occupy mainly in southern part of Bunditehsil, western and south western part of Hindoli tehsilsand runs from south west to north east across thedistrict (Fig. 2.10.5).
Land Use Land Cover (2006-07) of the district (Fig.2.10.6) is carved out from the map prepared by theNRSC, Hyderabad during the rapid assessment of thenational level land use land cover-India using multi-temporal AWIFS data. LULC map will be used todelineate and refine existing land use especially double/triple cropped and irrigated area. There is somevariation in area under land use classes because ofmethodology and approach (Table 2.10.6).
Fig. 2.10.4 Soil map index of Bundi district
BUNDI
Regional Centre, Udaipur
Annual Report2009-10 111
Table 2.10.6 Land Use Land Cover (LULC) and Land Use of Bundi district
Land Use (NBSS) Per cent LULC – NRSC-06-07 Per cent
Fig. 2.10.5 Present land use of Bundi district Fig. 2.10.6 Land use/land cover map of Bundi district
Land management unit
Generalized soil map and land use
Soil and land use maps were spatially integrated togenerate a land management unit (LMU) map depictingthe relationship of soils and land use. The generalizedsoil and land use map are integrated through the overlayprocess. The vector overlay resulted in large numberof slivers (spurious polygons). These were eliminatedthrough careful editing and merger to adjoining unitsby specifying tolerance limits. Units having similar soilsand land use have been grouped. These delineationsform the Land Management Units (LMU’s) for thedistrict. As a result of the spatial integration, 49 LMUshave been identified (Fig. 2.10.7). Out of which only19 LMUs have significant coverage (>1.00 per cent).
Deep, fine loamy to fine soils on nearly level to verygentle slope delineated as LMU 30 and 42, occupying36.8 per cent area, are mostly under irrigatedagriculture and distributed in Bundi, Keshoraipatan,Indergarh and Nainwa tehsil tehsil. Agriculture is alsoassociated with the LMU of shallow, loamy and loamyskeletal soils and cover about 4 per cent area thoughthese soils are predominantly (21.82%) associatedwith forest in LMU 2-4 with variable slopes. LMUNo. 3, 7 and 15 are characterized by shallow, loamy/loamy skeletal soils under open scrub with agriculture(rainfed) occupy 7.0 per cent area of the district. LMUunder ravinous land are found to occur in about 11per cent area and mainly associated with deep, fineloamy soils in Keshoraipatan, Indergarh, Bundi andNainwa tehsil.
LAND USE / LAND COVER-2006-07BUNDI
N
�
PRESENT LAND USEBUNDI
N
�
Annual Report112 2009-10
Research Achievements
Soil map index and land use
The land management units developed through theintersection of soil map index and land use resulted in19 LMU. Predominant LMUs are the combination ofhigh to very high soil index with agriculture as landuse (29.37%) followed by the association of forest andsoil index of low (8.04%) and medium (16.08%).Agriculture is almost negligible (0.90%) in units of lowsoil index. LMUs consisting of open scrub withagriculture occupy sizable area (11.83%) of the districtand are found to occur irrespective of soil map index.Ravinous land use are associated with high to very highsoil index and represented by LMU12 (13.89%) andLMU17 (7.22%).
2.10d. Development of district level land useplan for Nagaur district (Rajasthan)under arid ecosystem.Aditya Kumar Singh, R.S. Singh, T.P. Vermaand R.L. Shyampura
Natural resources assessmentCensus and socio-economic pattern
Nagaur district comes under arid ecosystem having
total area of 17718 sq.km. An analysis of census dataof ten year interval has been done for better land useplanning interpretation (Table 2.10.7). Total numbersof villages were 1396 during 1991, villages haveincreased to 1500 in 2001. In the district householdwith access to electricity has increased from30.70% (1991) to 53.94% (2001). Similarly safedrinking water availability has also increased from49.0% to 77.35%.
Table 2.10.7 Nagaur district at a glance
District information Year
1991 2001
Total area (sq. km) 17718 17718
Total villages 1396 1500House hold status (%)House hold with access to electricity 30.70 53.94
Safe drinking water 49.00 77.35
Total population 2144810 2775058
Rural population (%) 84.00 82.80
Urban population (%) 16.00 17.20
Male population (%) 51.50 51.35
Female population (%) 48.50 48.65
% Population of Scheduled caste 19.70 19.65
% Population of Scheduled tribe 0.20 0.23
Density (per sq. km) 121 157EducationLiteracy rate all (%) 31.80 57.28
Literacy rate (M) 49.40 74.10
Literacy rate (F) 13.30 39.67
Literacy rate (Rural) (M) 55.80 72.46
Literacy rate (Urban) (M) 67.60 81.67
Literacy rate (Rural) (F) 9.80 36.85
Literacy rate (Urban) (F) 32.50 53.41
Fig. 2.10.7 Land management unit map of Bundi district
Land Management Unit ofBundi district
N
�
Regional Centre, Udaipur
Annual Report2009-10 113
Rural population has remained around 82.8%, and itdid not changed much in span of ten years from 1991to 2001. In comparison of male population of 51.35%,the female population was 48.35%. In districtscheduled caste population was 19.65 %, whilescheduled tribe population was only 0.23%. Thepopulation density in the district was 151 (per sq. km).The overall literacy rate has increased from 31.69 %to 57.28 %. The literacy rate increase was very highfor men from 49.40% in 1991 to 74.10% during 2001.While the literacy rate for women have increased fromlow of 13.30% in 1991 to 39.67% during 2001. Thegap of literacy rate of men and women of urban andrural both has reduced. In case of male rural populationto urban population the gap has lowered from 11.8%(1991) to 9.21% (2001), while in women it reducedfrom 22.70% (1991) to 16.56% (2001).
Soils
Soils of the district have large variability with respectto their morphological characteristics, depth tounderlying strata, hummockiness and height and
density of the dunes. The northwestern part is coveredwith high dunes and large interdunal flats which havefine, sandy, moderately deep to deep soils, underlainby lime concretionary horizon at 60 to 80 cm depth.The northeastern part, extending upto middle of thedistrict, is moderate to highly hummocky with finesand, brown, very deep soils devoid of CaCO3. Alluvialsediment, deposited by number of streams rising fromthe Aravalli hills and flowing through the southern part,have given rise to a variety of medium and fine texturedsoils (Fig. 2.10.8).
Land use
Average land holdings have come down from 5.96 ha(1995-96) to 5.35 ha during 2000-01 (Table 2.10.8).Similarly cropping intensity has also come down from131.39 (1997-98) to 118.26 (2005-06). On the otherhand the forest area has increased from 0.80 % (1995-96) to 1.04 % (2005-06). Net sown area has increasedfrom 72.50 % (1998-99) to 84.56 % (2005-06). Similarlythe gross irrigated area of the district has also increasedfrom 17.40 % (1998-99) to 25.88 % (2005-06).
Fig. 2.10.8 Soils of Nagaur district, Rajasthan
Map Unit Series association Map Unit Series association Map Unit Series association1 Chirai moderately deep 11 Kumparwas 21 Panchroli variant2 Chirai hummocky 12 Kumparwas moderately deep 22 Asop3 Chirai normal 13 Parbatsar 23 Silgaon4 Khajwan 14 Parbatsar sandy 24 Bher very deep5 Palari pichki 15 Parbatsar variant 25 Bher deep6 Palari pichki variant 16 Molasar normal 26 Alluvium7 Jayal 17 Molasar hummocky 27 Hills and rocky waste8 Jayal variant 18 Molasar highly hummocky 28 Shallow miscellaneous9 Gajsinghpura 19 Panchroli shallow 29 Lake10 Soila 20 Panchroli deep 30 Gypsum
31 Dune
SOILSNagpur district, Rajasthan N
�
Annual Report114 2009-10
Research Achievements
grown are moong, cowpea, moth, gram, pea and guarwhereas major oilseed crops are groundnut, sesamum,taramira and rapeseed and mustard. Besides the fieldcrops the district also has some area in condiments andspices like red chillies, fennel, cumin, methi, onion,isabgol etc. (Table 2.10.10). Cotton is cultivatedwherever irrigation facilities exist.
Table 2.10.9 Agricultural indicators and positionof principal crops
Nagaur Rajasthan
Percentage of
Forest area to reporting area 1.05 7.87
Net area to reporting area 60.88 28.45
Double crop area to net area 15.29 28.45
Net irrigated area to net area sown 22.26 38.75
Gross irrigated area to gross 25.51 36.96area sown
Percentage of cropped area sown by crops
Pearl millet 32.49 22.80
Sorghum 3.78 3.07
Maize 0.01 4.79
Wheat 5.37 11.91
Barley 0.84 1.08
Gram 1.23 4.69
Rape seed and mustard 6.93 14.39
Table 2.10.10 Crop area of Nagaur district
Crop Area, ha Av. Yield (kg/ha) Crop Area, ha Av. Yield (kg/ha)
Sorghum 53787 413 Moong 211791 396
Pearl millet 461777 775 Cowpea 17735 342
Maize 129 (-) Moth 196461 211
Wheat 76384 2162 Gram 17454 1270
Barley 11916 2512 Pea 2232 (-)
Total cereals 603995 Guar 155820 (-)
Oilseeds Condiments and spices
Groundnut 18269 1096 Red chillies 731 (-)
Sesamum 10837 167 Fennel 1173 (-)
Taramira 5708 572 Cumin 12424 138
Castor 152 (-) Methi 4249 847
Rape & mustard 98538 1178 Isabgol 31628 382
Fibre crop
Cotton 9223 1261
Vegetables
Sweet potato 680 (-)
Onion 8151 (-)
Table 2.10.8 Land use of Nagaur district
LAND USE 1995-96 2000-01
Average land holding (ha) 5.96 5.35
Forest area according to land 0.80 1.04utilization %
1997-98 2005-06
Cropping intensity 131.39 118.26
1998-99 2005-06
Net area sown % 72.50 84.56
Gross irrigated area % 17.40 25.88
Agricultural indicators and position of principal crops(2006-07): In Nagaur district the forest area is only1.05% as against 7.87% forest area of the state.Similarly the net irrigated area to net area sown andgross irrigated area to gross area sown is also less thanstate average (Table 2.10.9).
Except pearlmillet and sorghum which are grown duringkharif season the percentage area of cropped area sownby other crops was less than state average. For rabi cropswhich are mostly taken with the help of irrigation, thearea in the district was less as compared to state average.
Crop wise total area (2006-07) of Nagaur district ofRajasthan
In the district the cereal crops grown are pearlmillet,sorghum, wheat and barley. The major pulse crops
Regional Centre, Udaipur
Annual Report2009-10 115
2.10e. Crop yield modelling under varyingsoil moisture in different types ofsoils
A.K. Singh, R.S. Singh and R.L. Shyampura
Constraint analysis: Moisture was consideredto be the most crucial factor that influencedproduction of different crops in varying types of soils.The dynamics of available water capacity (AWC) wasevaluated with number of irrigations for determiningthe yield potential. For this exercise, separate soilsamples from 0-15, 15-30, 30-50 and 50-80 cm depthswere drawn at weekly interval and analyzed formoisture content and the variation in the yield forshallow, medium, deep and very deep soils wereinterpreted.
Soil suitability evaluation
Multi-linear regression model
A multiple regression model was developed to relatecrop production to a set of independent variables whichis the direct extension of polynomial regressionequation of one independent variable. Factors whichhad significant correlation with different crop yield suchas soil depth, soil texture, soil slope, AWC, number ofirrigations and agronomic management were chosenfor regression model. These were individuallysignificant at 5% level of significance. These factorstogether accounted for 99% variation in yield ofdifferent crops. The multilinear regression developedwas as follows:
Maize: Factors which have significant correlation withmaize yield such as soil depth, texture, AWC, irrigation,field leveling and management were chosen forregression model.
The predicted yield values developed by model have adifference of 0.7-13.3% from actual, as the crop wastaken during kharif season.
Soybean: Factors which have significant correlationwith soybean yield such as soil depth, texture, AWC,irrigation, field leveling and management were chosenfor regression model.
In clay loam/clay soils, due to their higher water holdingcapacity higher yield of 21.9 qha-1 was observed. Thepredicted yield values as per model have difference of1.9-7.0% from observed crop yield as the crop wastaken without irrigations.
Groundnut: Factors which have significant correlationwith groundnut yield such as soil depth (r=0.54),texture (r=0.50), slope (r=0.40), AWC (r=0.54), rainfall(r=0.57), drainage (r=0.71) and management (r=0.89)were chosen for regression model. These wereindividually significant at 5% level of significance.These factors account for 98% variations in groundnutyield.
The closeness of the relationship between the observedand predicted yield indicated that the model is highlysuitable for sandy loam to loam soils under rainfedsituations (rainfall 400-600 mm).The regression modeldidn’t work well under clay loam and clay soils ofsimilar situations.
Mustard: Factors which have significant correlationwith mustard yield such as soil depth, texture, slope,AWC, irrigation, root penetration and managementwere chosen for regression model.
A deviation of 1.6 to 2.9% in predicted and observedyield values was observed and the relationship wasfound with climate-specific regression between a soilindicator and average yields. The selected soil indicatorwas available water capacity (AWC).
Wheat: Factors which have significant correlation withwheat yield such as soil depth, texture, AWC, irrigation,sowing time and field leveling were chosen forregression model.
(irrigation) +14.68 (Sowing time and management) +1.06 (field leveling). R2= 0.99.
In shallow sandy loam/sandy clay loam soils, sixirrigations were required for getting potential yield of56.3 qha-1. In moderately deep to deep sandy loam/sandy clay loam soils, five irrigations, whereas, in clayloam/clay soils four irrigations were required. Whenthe observed yield was compared with predicted yielddeveloped by model, it was found that values haddifference of 0.3 to 1.0%.. In wheat also, selected soilindicator was AWC. In this study, a strong relationshipexisted between AWC, soil texture, number ofirrigations, sowing dates and field leveling with cropyield.
2.10f. Correlation of soil series in westernregion (Gujarat & Rajasthan)
R. L. Shyampura, R. S. Singh, A. K. Singhand T. P. Verma
Soil series, identified during the soil resource mappingof Bhilwara, Ajmer and Bundi district on 1:50,000scale, have been correlated for the finalization of soilseries description at the national level. Out of 10finalized soil series, two soil series namely Baland andKajlodiya series have got entered into the nationalregister (No. 241 and 242 with the state code of RJ023and RJ024). Brief description of soil series are asfollows.
Baland Series: (National Series Register Page No 781-784) The Baland series is the member of the fine-loamy,mixed (calcareous), hyperthermic family of TypicHaplustepts. Typically, Baland soils have dark yellowishbrown, strongly alkaline sandy loam A horizons and
brown to dark yellowish brown sandy clay loam toclay loam mildly to strongly alkaline B horizonunderlain by Ck horizons.
The soils of Baland series are moderately deep,calcareous, sandy loam to clay loam in texture andhave moderate water holding capacity and nutrientretention capacity. These soils are moderate tomarginally suitable for sorghum, maize, groundnut,sunflower, cotton, wheat, barley and mustard.
Kajlodiya series: (National Series Register Page No 785-788) The Kajlodiya series is the member of the fine-loamy, mixed, hyperthermic family of TypicHaplustepts. Typically, Kajlodiya soils have darkyellowish brown, strongly alkaline sandy loam Ahorizons and dark yellowish brown, moderatelyalkaline, sandy loam to sandy clay loam B horizonsunderlain by Cr horizons of weathered rock fragments.
The soils of Kajlodiya series are deep, sandy loam toclay loam texture and marginal in water holdingcapacity and nutrient retention capacity. These soilsare suitable for all climatically adopted withamendments and with proper soil and waterconservation.
The description of series Atoli and Nayagaon have beenrevised as per the protocol for listing in the NationalRegister. The Atoli series is the member of fine, smectitic(calcareous), hyperthermic family of Sodic Haplustertsand occur on the alluvium of the Aravalli in theRajasthan Upland. The Nayagaon series is the memberof fine, smectitic (calcareous), hyperthermic family ofTypic Haplusterts developed on the alluvium of theVindhyan landscape. These are extensively distributedin Bhilwara and bundi district of Rajasthan.
Externally Funded Projects
Annual Report2009-10 117
2.11a. Interfluve stratigraphy, sedimentologyand geochemistry of the central andsouthern Ganga plains (DST-ESS Project)
D.K. Pal, T. Bhattacharyya, P. Chandran,S.K. Ray, P.L.A. Satyavathi, P. Raja,S.L. Durge, A.M. Nimje, C.K. Likhar andS.W. Thakre
The Ganga Plains (GP) of the northern India constituteone of the world’s most extensive alluvial tractstraversed by big rivers (Ganga-Yamuna) that aresourced in the Himalayan Oregon, as well as riverssuch as Betwa, Chambal, Ken and Son that are sourcedin the central Indian Craton and many smaller riverssourced within the plains. The underlying Ganga Basincontains upto several kilometers of alluvial strata. TheGP are of great significance from academic standpointas they hold important clues regarding the tectonic andclimatic factors. Understanding the landforms of theGP, their origin, development and dynamic imprintsare therefore of critical significance to plan effectiveand sustainable development of the region. It isnecessary to study the GP to track changes in thealluvial landscape on different time scales. For acomprehensive understanding of the plains, multipleapproaches need to be adopted that can combinemodern process studies, Holocene environmentaldevelopment in the shallow sub-surface (~100 mdepth).
Physical and chemical properties
Bhognipur core (BHOG K): The cross section detailsof the core are detailed in the Fig. 2.11a.1 that describessedimentological details and paleopedological details.Paleopedological details of the paleosol-bearinghorizons are based on varying depth functions ofmacro- and micromorphological features, and degreeof development of pedofeatures that led to recognition
of 10 paleosols in the ~ 50 m sequence of the Bhognipurcore. The depth distribution of pH, EC, CaCO3, organiccarbon and particle- size distribution (psd) throughoutthe entire core comprising of the 10 paleosols and theintervening sediments are presented. The core samplesup to the depth of about 1.5 m are neutral to slightlyalkaline representing Bh1 (Bhognipur 1) paleosol withInceptisol characters. However, below this depthremaining part of the core with 9 paleosols (Bh2-Bh9;Bhognipur 2 to 9) having Inceptisol, Vertisol and Alfisolcharacters are moderately to highly alkaline with a verylow concentration of soluble salts. The entire core with10 paleosols is calcareous and maximum amount ofCaCO3 about 20% was found in sediments between
Externally FundedProjects
Fig. 2.11a.1. Textural and other details of Bhognipur core.
BHOGNIPUR0
5
10
15
20
25
30
35
40
45
50
Dep
th (
mm
)
Annual Report 2009-10
Research Achievements
118
Bh1 and Bh2 paleosols at about 3.5 m, but content oforganic carbon is considerably low (<0.5%). Thetexture of the core varies from sandy loam to clay withmoderate to high content of clay fraction in some ofthe paleosols. There is appreciable increase of claybetween the depths of 1.55 to 1.86 m, 3.54 to 8.27 m8.37 to 10.90 and 12.13 to 13.84 m that correspondto Bh1, Bh2 and Bh3 paleosols. The Bh3 paleosoloccurring between 10-14 m depth is marked by stronglydeveloped argillic and vertic horizons whereas others(Bh1 and Bh2) are marked by weakly developedpedofeatures. The paleosols below 15 m depth aremarked by the large amount (>30%) of clay that doesnot appear to have any relationship with pedogenicdevelopment and the paleosols (B4-Bh10; Bhognipur4 to 10) are marked by weakly developedsyndepositional pedofeatures.
IIT, Kanpur core (IIT K)
The cross section of core with sedimentological andpaleopedological details are given in the figure 2.11a.2.This core is marked by the development of 13 paleosolswith characters ranging from weakly developedpaleosols corresponding to Inceptisol (It1-It11 and It13)and strongly developed paleosol corresponding to
Alfisol (It12). The entire core with 13 paleosols andthe intervening sediments is slightly to moderatelyalkaline, calcareous (2-24%) and non-saline and alsoimpoverished in OC (<0.5%). The texture of the coreis relatively uniform throughout which is primarily siltloam. In some secion an increase in clay with depthwas observed at 0.4-3.4 m, 12.0-15.0, 17.5-20.8,40.0-46.2 m that correspond to It1, It2, It6, It7 andIt12 paleosols with weakly to strongly developedpedofeatures.
Mineralogical properties
Bhognipur core : The mineral assemblage of the silt(50-2 mm) fraction determined by XRD analysis ismarked by mica, mixed-layer minerals (1.0 – 1.4 nm),vermiculite, pedogenic chlorite (PCh), hydroxy-interlayered vermiculite (HIV) and smectite, kaolin,quartz and feldspars. A semi-quantitative estimate ofthese minerals indicates that none of the layer-silicatemineral was dominant (>50%) in this fraction. Thedepth distribution of mica indicates that the upper 2.66m of the core with weakly developed It1 and It2paleosols have more amount of mica than the lowerpart of the core with It3-It13 paleosols showing weaklyto strongly developed pedofeatures. The mica isconsisted of both muscovite and biotite as evident fromthe ratio of 001/002 reflection of 1.0 nm peak of whichis more than unity. The content of smectite increaseswith depth. The nature of the smectite up to a depth of28 m in the core is trioctahedral and high chargesmectite type (HCS). In the XRD diffractogram it ischaracterized by the collapse to 1.0 nm peak at K-saturation and heating to 110oC that also gets destroyedin the HCl treatment. The smectite beyond the depthof 28 m shows the character of low charge smectite(LCS). Pedogenic chlorites (PCh) are also present.
The mineral assemblage in the coarse clay (2-0.2 mm)fraction is similar to those in silt fraction. In upper 20m depth of the core none of the clay minerals isdominant (>50%) but the content of mica shows arelative increase upwards to the surface. In this upperpart of the core the smectite is predominantly highcharge type (HCS) as evidenced from its collapse to1.0 nm peak region with K-saturation at 25oC and withheating at 110oC and its destruction in the HCltreatment. Below 20 m depth the content of smectiteincreases and it becomes a dominant mineral (>50%).The smectite in the lower part (below 20 m depth)consists of both high (HCS) and low charge (LCS)density and the proportion of LCS increases with depthand becomes dominant beyond 35 m depth.
Fig. 2.11a.2. Textural and other details of the IIT,Kanpur core
• Frequency of finesand/siltintercalationvariable.
• Flood plainAccretion Unitsseparated by Soillayers.
• Distinct packagersof magneticproperties.
Externally Funded Projects
Annual Report2009-10 119
The fine clay fractions (<0.2 mm) contain mica,vermiculite, HIV, PCh, smectite and kaolin. In the upper3.78 m depth of the core none of these minerals isdominant (>50%). But beyond this depth micadecreases and smectite increases to become a dominantmineral (>50%). The smectite in the upper 3.78 m depthconsists of both HCS and LCS but it is dominated byhigh charge density smectite. The LCS becomesdominant below 4 m depth with occasional presenceof PCh and hydroxy-interlayered vermiculite (HIV).The presence of both HCS and LCS in the upper 4 mdepth of the core and almost exclusive presence of LCSbeyond this depth in the remaining core indicateschange of provenance.
IIT, Kanpur core: The XRD analysis showsdominance of mica in the silt (50-2 mm) fraction thatalso contains mixed-layer minerals, smectite,vermiculite, HIV, PCh, kaolin, feldspar and quartz. Thedepth distribution of these minerals indicates arelatively higher amount of mica in this core than inthe Bhognipur core. The smectite is dominantly HCSin nature and is marked by an increase with depth.Coarse clay (2-0.2 mm) fractions have the similarmineralogy as those of the silt fractions. However, thecontent of smectite is higher in this fraction than thatin the silt. The depth distribution of mica does not showany trend with depth whereas HCS increases withdepth.
The fine clay fractions (<0.2 mm) are dominated bythe mica and smectite that also contain vermiculite,HIV, PCh and kaolin. The depth distribution of micain upper 24 m is marked by an increase and below thisdepth it shows a relative decrease. The smectite ispredominantly LCS and dioctahedral in nature and itis marked by an increase below 24 m depth in the core.However, the content of LCS is much less than that ofBhognipur LCS.
Clay minerals as evidence of provenance changes
In comparison to Bhognipur core, the IIT K core ismore micaceous as evident from the content of mica inthe silt, coarse and fine clay fractions. The upper 10 mpart of Bhognipur core has more amount of silt, coarseand fine clay mica than beyond this depth. Thedominant presence of LCS in the silt fractions (beyond28 m depth), coarse clay (beyond 35 m depth) and fineclay (beyond 4 m depth) fractions of Bhognipur core,and dominant presence of fine clay LCS in IIT K core,indicate that the alluvium at IIT K and that ofBhognipur core is mineralogically different in a subtle
way. As the biotite mica can not yield both trioctahedralHCS and dioctahedral LCS simultaneously, the genesisof LCS and its accumulation in these two cores needsto be viewed in terms of the influence of weatheringproduct of the plagioclase present in both Deccan basaltof Central Indian Craton and micaceous Ganga-Yamuna river sediment. The plagioclase of the Deccanbasalt yields dioctahedral LCS as the first weatheringproduct. This smectite must have carried through rivers(Betwa, Chambal, Ken and Son) sourced in the CentralIndian Craton and also in the Ganga-Yamuna riversystem and spread the smectitic alluvium in Bhognipurand Kanpur areas in the past.
The depth distribution of silt, coarse and fine clay HCSand LCS in two cores indicates that the Bhognipur corewas primarily influenced by the weathering product ofthe Deccan basalt whereas IIT K core by the sedimentof Himalayan rivers, as evident from the presence ofsilt and coarse clay LCS at depth beyond 28 m ofBhognipur core. In IIT K core more amount of silt andclay micas as compared to those of Bhognipur coreand the exclusive presence of silt and coarse clay HCSsuggests the influence of mica carried through riverssourced in the Himalayan Oregon in the developmentof IIT K core. The presence of more amount of silt,coarse and fine clay micas in the upper 10 m depth andalso the presence of small amount of fine clay HCS inthe upper 4 m depth of Bhognipur core suggest theinfluence of mica sourced in the Himalayan Oregonduring the development of Bhognipur core in recenttimes.
Clay minerals as evidence of climate changes
The mineralogical composition of the silt, coarse clayand fine clay fractions of both the cores is similar. Thedecreasing amount of mica, vermiculite and theincreasing amount of HCS from the silt to the clayfractions suggest in the early stages of weatheringbiotite was weathered to mixed-layered mineralscontaining vermiculite layers. As more interlayerregions were affected by weathering there was aprogressive formation of vermiculite and HCS. Previousstudies indicated that HCS of trioctahedral type isgenerally an alteration product of biotite mica even inpresence of muscovite and can be regarded as analteration product in semi-arid and arid climate. Suchalteration in core samples might not have occurredtotally during the post-depositional period. However,wherever the sediments had an adequate time such
Annual Report 2009-10
Research Achievements
120
alteration can be considered as a part of pedogeneticprocess in semi-arid climate. The formation of HCSand LCS simultaneously from mica is very unlikely asmuscovite do not weather in presence of biotite.Moreover, in dry environments of sub-humid and semi-arid climate that induces primarily the formation ofCaCO3, micas may not yield so much amount of LCSas observed in both the cores. This suggests that themain source of the sediment containing LCS is otherthan the mica. The occurrence of huge amount of LCSappears to form in an earlier humid climate at the sourcearea because LCS could be the alteration product ofplagioclase. Plagioclase feldspars are present in boththe Deccan basalt of the Central Indian Craton andalso in the Ganga-Yamuna river sediments, whichcontains sufficient silica to form smectite in tropicalhumid climates. However, there is impoverishment ofplagioclase in Ganga-Yamuna river sediments ascompared to Deccan basalt. The formation of smectitefrom biotite is quite unlikely in humid climates becausethis climate removes silica and cations and induceseparation of layers precluding the formation of clayminerals more siliceous than biotite itself. Thus the HCSexisting in arid climate is the alteration product ofbiotite which survived earlier weathering. The presenceof HIS, HIV and PCh in the fine clay fractions, andHIV and PCh in the silt and coarse clay fractionsindicate that the hydroxy-interlayering in thevermiculite and smectite interlayers did occur whenpositively charged hydroxy-interlayer materials suchas [Fe3(OH)6]
3+, [Al6(OH)15]3+, [Mg2Al(OH)6]
+,[Al3(OH)4]
5+, entered into the inter-layer spaces at pHmuch below 8.3. The pH of the sediments of both thecores are mildly to moderately alkaline and in thischemical environment 2:1 layer silicates suffercongruent dissolution, discounting hydroxy-interlayering of smectites. The hydroxy-interlayers invermiculite and smectite and the subsequenttransformation of vermiculite to PCh are not the partof contemporary pedogenic process in the prevailingdry climatic conditions. However, the crystallinity ofLCS is being preserved in the non-leaching environmentof the arid climatic conditions. This suggests that thepresence of HIS and also HIV, and PCh in arid andsemi-arid climatic environments could be used as anindicator of climate change from humid to arid. Thealkaline chemical reaction, formation of CaCO3,formation of trioctahedral HCS, preservation of HIS,
HIV and PCh, indicate the role of climate change fromhumid to arid during the development of soils withinthe cores. Wherever the sediment rested for a longertime and did not experience any tectonic stress, thepedogenetic process mainly the illuviation of clay hasbeen possible.
This study shows that although the core at Bhognipurin the southern and the core at IIT Kanpur (IIT K) inthe northern parts of the Ganga-Yamuna Interfluves(GYI) occur in the Himalayan Foreland, the qualitativemineral composition of the core samples is similar. Thismay apparently suggest the influence of micaceoussediments of the Himalayan Oregon in the developmentof both the cores. The fine clay fraction of both thecores contain hydroxy-interlayered low chargedioctahedral smectite (HIS) as the dominant mineral(>50%) in this fraction. Formation of huge amountsof LCS at the expense of biotite of neither Himalayannor Vindhyan sediments and also the hydroxy-interlayering in smectite interlayers are probable in thealkaline soil environments of the present day semi-aridclimate. The HIS is the weathering product ofplagioclase feldspars of the Deccan Basalt of the CentralIndian Craton and also of the sediment of theHimalayan rivers during the earlier humid climate thatcreated acidic soil environment. As parent material HISwas deposited in the GYI areas and was extended uptoKanpur.
During the acidic soil environments of humid climatevermiculite also became hydroxy-interlayered (HIV)and it then transformed to pedogenic chlorite(PCh).Weakly developed to matured paleosols wereformed in the later sub-humid to semi-arid climate. Thedrier phase during this climate caused more formationof pedogenic CaCO3 that created conducive conditionsfor illuviation of clays towards the formation of ofargillic (Bt) horizon.
While the formation of vermiculite, high chargetrioctahedral smectite (HCS), CaCO3 and soil alkalinityis possible due to climatic aridity, the transformationof smectite to HIS, vermiculite to HIV and HIV to PChcan only take place in acidic soil environment of humidclimate. Thus preservation of HIS, HIV and PCh insoils of semi-arid climate can be considered as anindicator of climate change from humid to sub-humidto semi-arid.
Externally Funded Projects
Annual Report2009-10 121
2.11b. Predicting soil carbon changes underdifferent cropping systems in soils ofselected benchmark spots indifferent bioclimatic systems in India(DST sponsored Project)
T. Bhattacharyya, D.K. Pal, S.K. Ray,P. Chandran, C. Mandal, A.S. Deshmukhand R.R. Deshmukh
RothC-26.3 is a model for the turnover of organiccarbon in top soils that allows for capturing the effects
of soil type, temperature, moisture content and plantcover on the turnover process. Century model allowsthe simulation of complex agricultural managementsystems which include crop rotation, tillage practices,fertilization, irrigation, grazing and harvesting. Centuryuses a monthly time step utilizing average monthlymaximum and minimum temperature and precipitation.
RothC and Century models were used to capturechanges in SOC content of selected benchmark (BM)spots representing Long Term Fertilizer Experiments(LTFE). RothC model was used to simulate the changesin SOC content in soils of five benchmark spots (Sarol,Teligi, Nabibagh and Panjri from black soil region(BSR), Gaupur from Indo-Gangetic Plains (IGP). Theresults showed an increase in TOC content whenexternal organic inputs were applied as compared tocontrol and only inorganic fertilizers’ treatments. Thestudy showed that RothC model can capture the trendof the experimental data in tropical soils (Fig. 2.11b.1).A separate study was undertaken to parameterizecentury model for application to different kinds ofcropping systems in contrasting bioclimatic conditionsfor four sites (Mohanpur from IGP and Akola, Saroland Teligi from BSR). Both these models can simulatethe treatment effects of different bio-climatic systemsin terms of predicting SOC change, as shown in figure2.11b.2 with Sarol LTFE as an example.
2.11c. Developing Georeferenced SoilInformation System for MonitoringSoil and Land Quality for Agriculture(NAIP Component-4 subproject)
D.K. Pal, Dipak Sarkar, T. Bhattacharya,D.K. Mandal, Jagdish Prasad, G.S. Sidhu2,A.K. Sahoo3, K.M. Nair4, R.S. Singh5,T.H. Das6, M.V. Venugopalan7, A.K.Shrivastava8, D.K. Kundu9, C. Mandal,R. Shrivastava, T.K. Sen, S. Chatterji,P. Chandran, S.K. Ray, G.P. Obireddy,N.G. Patil, S.K. Mahapatra2, K. Das3,A.K. Singh5, S. Shrinivas4, S.K. Reza6,P. Tiwary, K. Velmourougane7, K.K. Meena8,K.G. Mandal9, Mrunmayee Lokhande,Khushal Wadhai, Vishakha Dongare,B. Mohanty9, Supriya Majumdar3,K.V. Ganjanna4, R.S. Garhwar5, D. Hazarika6,Apeksha Sahu7, Suchitra Mahapatra9,A. Kumar8
National Bureau of Soil Survey and Land Use Planning(NBSS &LUP), Nagpur (MS)2 NBSS&LUP, New Delhi,
Fig. 2.11b.1. Modelled and estimated soil carbon over timein RothC for treatment 1 i.e. control (no fertilizer, no manure)and treatment 3 (N30+FYM) in Long Term Fertilizer Experimentat Sarol, Madhya Pradesh (tr = treatment, mod = modelled,est = estimated).
Fig. 2.11b.2. Modelled and estimated soil carbon over timein Century for treatment 1 i.e. Control (no fertilizer, nomanure) and treatment 3 (N30+FYM) in Long Term FertilizerExperiment at Sarol, Madhya Pradesh (tr = treatment, mod =modelled, est = estimated).
Annual Report 2009-10
Research Achievements
122
3 NBSS & LUP, Kolkata, 4 NBSS & LUP, Bangalore,5 NBSS & LUP, Udaipur, 6 NBSS & LUP, Jorhat,7 Central Institute for Cotton Research, Nagpur (MS),8 National Bureau of Agricurally Important Micro-organisms, Mau (UP), 9Directorate of WaterManagement, Bhubaneshwar (Orissa)
Sustainability of agriculture is a major concern of the21st century in view of soil degradation and climatechange. Proper agricultural land use planning andmonitoring of soil and land quality parameters areessential for sustainable agriculture. In India, there isan excellent repository of soil information and mapsat both large and small scales, but they are unable toprovide georeferenced information in spatial domainfor researchers engaged in natural resourcemanagement, crop and environmental modeling.Considering the multitude roles performed by soils inagriculture, environmental, economic, social andcultural activities, it is necessary to develop an agro-ecological subregion (AESR) base Georeferenced SoilInformation System (GeoSIS) for monitoring the soiland land quality induced by dynamic land use changes.Georeferenced soil information system (Geosis) withspatial domain provided a robust platform for theresearchers and managers engaged in natural resourcemanagement, crop and environment modeling tomonitor the changes in soil properties induced bydynamic land use changes. Different components viz.soil, water, climate, animal, forestry and environmentplay a significant role in land use planning forsustainable agriculture. Assessment of land quality andthe direction of change with time is the primary indictorof sustainable land management. The most importantlink between farming practices and sustainableagriculture is the health of soils that require regularmonitoring. Identification of relevant indicators andfixing baseline (reference level) will help in forewarningthe consequences of non–compatible land uses on landquality.
The study is being carried out in 15 AESRs of Indo-Gangetic plains representing mainly the rice-wheatcropping systems and 17 AESRs of Black Soil Regionrepresenting cotton based cropping system.
Study Area
The Indo-Gangetic Plains and Black Soil Region ofIndia were selected to monitor soil and land qualityfor the agriculture covering an area about 43 and63 m ha respectively. The study area includes 7 AERs
and 14 AESRs from the IGP and 6 AERs and 17 AESRsfrom the BSR and covered 13 and 19 % respectively oftotal geographical area (TGA) of the country. Thealready established benchmark soil series were revisitedfor the assessment of land quality and the temporalchanges in the primary soil quality indicators forsustainable land management.
Field survey is being conducted for collectinginformation on soil, water, climate, land use and typesof yield of crop for identified benchmark spots (onespot for each AESR) for determining threshold valuesof soil parameters for developing land qualityindicators.
Work done
From each hotspot, two sites were selected viz., lowmanagement (LM) and high management (HM). Soilsamples were collected from each horizon forlaboratory analysis and other soil-site data and landmanagement data were also collected. The soil sampleswere analyzed for physical, chemical andmicrobiological properties using standard methods.
The unknown values of soil parameters viz. saturatedhydraulic conductivity have been estimated bydeveloping pedo-transfer function (PTF). The estimatedvalues of saturated hydraulic conductivity were usedfor the refinement in the calculation of length ofgrowing period (LGP) and in the modification of AESRboundaries. Soil and Terrain (SOTER) digital databasesoftware is being used for creating datasets on soil,water, climate, land use, and terrain information.
Due to changes in research output with time which aresoils and site data, characteristic of the boundaries ofthe AESRs may change. Most of the soil properties arenot feasible to analyze in the laboratory such ashydraulic conductivity.
Using stepwise regression, a pedotrasnfer function(PTF) for estimating saturated hydraulic conductivity(sHC) was developed from 200 soil layer observationsof 49 soil pedons with available and feasible data havingR2 value of 0.67. The estimated values of sHC wereused for generating quantitative drainage map of thestudy area. The derived formula to calculate thesaturated hydraulic conductivity is
This would help to correct the length of growing period(LGP) based on antecedent moisture in the soil after
Externally Funded Projects
Annual Report2009-10 123
the cessation of rains and subsequently, in themodification of existing AESR boundaries. For thegeneration of database for the study, SOTER softwarehave been used. SOTER is composed of sets of files foruse in a Relational Database Management System andGeographic Information System. The majordifferentiating criteria are applied in step-by- stepmanner, each step leading to a closer identification ofthe concern area. A SOTER unit can be definedprogressively into terrain, terrain components and soilcomponents. For the development of thematic mapsand attribute data linking with the map entities, variousGIS softwares were used.
Soil information of 353 soil profiles of BSR weregeoreferenced and their properties viz. physical,chemical and microbiological, and terrain informationwere linked as attribute table created by SOTER. Thesoil samples and land use information were collectedfrom 13 spots of BSR and all the 14 spots of IGP byvarious co-centres and sent to otherCentres as well as Lead Centre foranalysis. These samples are beinganalyzed for physical, chemical andmicrobiological properties of thesoils.
• Based on Soil Resource Map(SRM) information, a soil mapof the black soil region (BSR)was prepared on 1:1,00,000scale (subgroup association).
• The total area under the blacksoil region is about 63.66 mha.The major soils orders belongto Vertisols and Inceptisols andAlfisols in patches. The totalnumber of soil polygons in theBSR is 14,623 of which 6114are unique polygons. Eachpolygon exhibits theoccurrence of dominant (60%)and sub-dominant soils(40%).
• The total state covered underBSR are 13 which includes,Maharashtra, MadhyaPradesh, Gujarat, AndhraPradesh, Karnataka,Chhattisgarh, Tamil Nadu,Orissa, Rajasthan, Punjab,Bihar, West Bengal and Assam.
The total are under black soils is about 17.21 mhain Maharashtra followed by 13.06 mha in MadhyaPradesh and 7.39 mha in Gujarat.
• The soil information of BSR was collected fromdifferent sources which includes Bench-markestablished soil series and other soil informationfrom published reports and Ph.D and M.Sc thesesof LRM student of NBSS&LUP.
• Total 343 point data were collected, georeferencedand placed on the BSR map (Fig. 2.11c.1).
• Each point data placed on the map were attachedwith their morphological, physical and chemicaldata as per horizons and also as layered data(0-30, 0-50, 0 -100 each).
• The AESR map was superimposed on the BSR mapand it was found that it covered about 27 AESR(Fig. 2.11c.2)
Fig. 2.11c.1 Distribution of Point data in AESR
N
�
INDIADISTRIBUTION OF POINT
DATA IN AESR
Annual Report 2009-10
Research Achievements
124
Fig. 2.11c.2 AESR and BSR, India
• The weighted mean ofmajor soil properties werecalculated for 0-30 cm,0-50 cm and 0-100 cmand plotted on the map aslayered data.
Preparation of terrain map
Using 90m resolution SRTM(Shuttle Radar TopographicMission) data, the terrain mapof BSR was prepared, thecontour informationgenerated was used forpreparing the DigitalElevation Model (DEM).The soil information (point)was transferred on the DEMin order show their relativephysiographic position on themap (map showingdistribution of point data)shown in Fig. 2.11c.3.
Soil samples from 12 soilprofiles representing sixBenchmark soils of northwestern and northern IGPhave been collected forlaboratory characterization.Out of these soils, two soils aresalt-affected (Zarifa Viran andSakit Series), three normal(Fatehpur, Naura and HaldiSeries) and one waterstagnated soil (Itwa Series).Zarifa Viran soil is in the stateof almost being reclaimed. Thesoils of Fatehpur series arecoarse textured soils and thatof Naura heavy textured.Haldi soils are high in organiccarbon. The bulk density (BD)of different horizons of thesesoils (undisturbed) has beendone by core sampling. Watercontents (%) on oven dry basishave been estimated from thecore samples.Fig. 2.11c.3 Terrain digital map
N
�
INDIAAESR AND BSR
DIGITAL TERRAIN MAP (BSR)
Soral (Indore)Classification: Typic HaplustertsLocation: Longitude 75o 43'07"E,Latitude 22o 54'54"NPhyslograhic Position: CentralHighland/Malwa PlateauTopography: Almost level land, 0-1%slope, Below 400m MSL
Externally Funded Projects
Annual Report2009-10 125
In Zarifa Viran soils (high management level),bulk density (BD) in sub-surface soils was as high as1.53 Mg m-3 as compared to surface layer where it is1.25 Mg m-3. At low management level, this changewas not so perceptible. Heavy machinery and puddlingmay have resulted in high BD in sub-surface layers. Innormal soils (Naura series), this impact was moreperceptible. In Itwa soils (under low management level),the BD at the sub-surface layer was 1.41 Mg m-3
compared to 1.39 Mg m-3 at the surface. There wasbuild up of organic carbon (>1%) at the surface ofZarifa Viran soils under rice-wheat system. Thesewaterlogged soils crack when water recedes. InSakit series the effect of management system isconspicuous from the depth of occurrence of calcareouslayer which was near to the surface in case of lowmanagement and at greater depths in case of highmanagement.
In the eastern part of IGP six soil series havebeen identified namely Ekchari (Bihar), Madhpur,Gopalpur, Seoraguri, Singhbhita (West Bengal)and Nayanpur (Tripura). Two soil profiles (P1 and P2)were studied in Nayanpur soil series underintensive agriculture and agriculture withminimum inputs respectively have been studied.Similarly soils representing Saoraguri soil series(P3 and P4) Cooch Behar and Singivita (P5 and P6) inDarjeeling district of West Bengal under level of highmanagement and low management respectively havebeen studied.
Nayanpur soils under high management practicesare very deep, gray to light brownish gray in colourand mottle colour varies from dark brown to veryyellowish brown. Soil pH varied from 5.51 to 6.07with organic carbon contents 0.36 to 1.12%.Exchangeable acidity varied from 0.4 to 1.2cmol(+) kg-1. Bulk density of soils varied from1.27 to 1.52 Mg m-3. Nayanpur soils under lowmanagement are very deep, gray to grayish brown incolour and mottle colour varies from brown to strongbrown. Soil pH varied from 5.1 to 6.1 with organiccarbon contents from 0.5 to 0.6%. Exchangeableacidity varied from 0.2 to 0.9 cmol(+) kg-1. Bulkdensity of soils that varied from 1.30 to 1.52 Mg m-3
(Table 2.11c.1).
Table 2.11c.1 Physical and chemical propertiesof IGP soils from Tripura and northern
West Bengal
Soils Depth(cm) pH O.C (%) B.D (g/cm3)
Nayanpur Series (High management) - Tripura
P1/1 0-17 5.6 1.1 1.27
P1/2 17-48 6.1 0.3 1.37
P1/3 48-68 5.5 0.3 1.27
P1/4 68-87 5.9 0.4 1.34
P1/5 87-115 5.9 0.4 1.42
P1/6 115-150 6.0 0.4 1.52
Nayanpur Series (Low management) - Tripura
P2/1 0-15 5.1 0.6 1.47
P2/2 15-38 5.5 0.5 1.52
P2/3 38-62 6.1 0.6 1.36
P2/4 62-90 6.1 0.8 1.34
P2/5 90-130 6.1 0.5 1.30
Seoraguri Series (High management) – West Bengal
P3/1 0-14 5.3 0.7 1.55
P3/2 14-34 6.1 0.4 1.39
P3/3 34-58 6.1 0.3 1.34
P3/4 58-84 6.1 0.1 1.05
P3/5 84-107 6.2 0.4 1.25
P3/6 107-150 6.1 0.4 1.45
Seoraguri Series (Low management) – West Bengal
P4/1 0-12 5.3 0.7 1.15
P4/2 12-40 6.1 0.4 1.22
P4/3 40-73 5.9 0.2 1.17
P4/4 73-98 5.8 0.5 1.39
P4/5 98-120 6.1 0.1 1.22
P4/6 120-168 5.9 0.1 1.20
Singivita Series (High management) – West Bengal
P5/1 0-16 5.4 1.2 1.34
P5/2 16-42 5.7 0.8 1.22
P5/3 42-73 5.3 0.5 1.29
P5/4 73-99 5.5 0.4 1.24
P5/5 99-133 5.5 0.04 1.27
Singivita Series (Low management) – West Bengal
P6/1 0-23 5.2 1.5 1.17
P6/2 23-46 5.5 0.9 1.27
P6/3 46-80 5.6 0.5 1.20
Annual Report 2009-10
Research Achievements
126
Seoraguri soils under high management are very deep,dark grayish brown to light yellowish brown in colourand mottle colour varied from brown to strong brown.Soil pH varied from 5.3 to 6.1 with organic carboncontent from 0.1 to 0.7%. Exchangeable acidity variedfrom 0.1 to 0.5 cmol(+) kg-1. Bulk density of soils variesfrom 1.05 to 1.55 Mg m-3. Seoraguri soils under lowmanagement are very deep, very dark grayish brownto light brownish gray in colour and mottle colourvaries from brown to strong brown. Soil pH variedfrom 5.3 to 6.1 with organic carbon content from 0.1to 0.7%. Exchangeable acidity varied from 0.1 to 0.4cmol(+) kg-1. Bulk density of these soils varied from1.20 to 1.39 Mg m-3.
Singivita soils under high management are deep, grayishbrown to brown in colour and mottle colour variedfrom brown to strong brown. Soil pH varied from 5.3to 5.6 with organic carbon content from 0.04 to 1.2%.Exchangeable acidity varied from 0.7 to 1.2 cmol(+)kg-1. Bulk density of soils varied from 1.2 to 1.4 Mg m-
3. Singivita soils under low management are moderatelydeep, gray to pale brown in colour, mottle colour variesfrom yellowish red to brown. Soil pH varied from 5.2to 5.6 with organic carbon content from 0.5 to 1.5%.Exchangeable acidity varied from 0.2 to 0.6 cmol(+)kg-1. Bulk density of these soils varied from 1.17 to1.27 Mg m-3.
The representative soils from Madhpur, Ekchari andGopalpur series for morphological, physical andchemical properties. These soils are developed onalmost level to very gentle sloping lands of lower Indo-Gangetic plains and are deep to very deep andmoderately to poorly drained. These soils are grayishbrown to dark grayish brown, silt clay loam to clay innature. The pH of the soils ranged from 7.4 to 8.1.The organic carbon content varies from 0.09 to 1.55and The bulk density from 1.27 to 1.67 Mg m-3.
In the black soil region hotspots such as Nabibagh,Nimone, Vasmat and Sarol were analysed for theparticle-size distribution which showed the dominanceof clay in these soils. The soils of Nabibagh, Nimone,Vasmat, Paral, Kassireddipalli, Panjari, Gulguli andSingpura were analysed for bulk density by core methodwhich ranges from 0.97 to 2.09 Mg m-3. Coefficient ofLinear Extensibility (COLE), water dispersible clay(WDC) and clay carbonate have been done for the soilsof Nabibagh, Nimone, Vasmat and Sarol. These soilsare moderately alkaline to strongly alkaline in natureand the electrical conductivity low to be of anyconsequence.
The microbiological analysis was done at NABIM,Mau, U.P. for the Kolu and Thar soil series. The dataindicated that the bacterial and fungi counts are morein low management than high management soils andincreased with the depth. The actinomycetes populationwere more in high management than low managementsoils. The dehydrogenase activity was higher in lowmanagement soil than high management whereas nosignificant difference in the Urease activity in soilscollected from two sites.
2.11d. Efficient Land Use Based IntegratedFarming System for Rural LivelihoodSecurity in Aurangabad, Dhule andGondia Districts of Maharashtra (NAIPComponent-3 Sub-project)
The project has been undertaken with the followingobjectives.
During the reporting year the satellite data of IRS LISS-IV for the selected six clusters (two each in Aurangabad,Dhule and Gondia districts) was geo-referenced andthe mosaic files for the clusters were generated. Thesatellite data has been interpreted using informationon contours, land use and topobase to generatelandform maps for the six clusters identified. Theinformation generated for these clusters are as follows.
Khultabad clusters
Detailed soil survey of Kanakshil village (661.32 ha)and Kanadgaon village (381.95 ha), Khultabad cluster,Aurangabad district was undertaken on 1:10,000 scale.Ten soil series (tentative) and two miscellaneous landtypes were identified in Kanakshil village, seven soilseries and one miscellaneous land type in Kanadgaonvillage.
Dhule clusters
The total area surveyed in Laghadwal village of Dhulecluster, Dhule district is about 900 ha on 1:10,000 scale.Seven soil series were tentatively identified in thisvillage.
Gondia clusters
Detailed soil survey of different villages of Deori andGoregaon clusters, Gondia district, was undertaken oncadastral scale. The total area surveyed in these twoclusters is 900ha and 20 soil series were identified(tentatively) in 6 villages of Gondia cluster.
Externally Funded Projects
Annual Report2009-10 127
Crop based InterventionsAurangabad clusters
In Aurangabad clusters, three different farming systemswere implemented viz., cotton-dairy-horticulture/vegetable, cotton-dairy-agro-processing and goat-poultry-forest produce value addition. Urea was appliedin cotton (40 acres), maize (160 acres) and pearl millets(40 acres) by the farmers under the guidance of NAIPteam. During rabi season, the beneficiaries wereprovided wheat, gram, onion, and okra seeds. Wheat,gram and okra were raised on 50, 64, 10, 8 and 11hectares of land respectively.
Dhule clusters
In the kharif season, the beneficiary farmers wereguided in cultivation of rice, soybean, maize and pearlmillet. Recommended practices (by MPKV) wereimplemented and inputs were provided. Intensivemonitoring of agro-managements resulted in anincreased yield of 31 to 100% (Table 2.11d.1).
Due to adoption of System of rice intensification (SRI)method, the seed rate of paddy was reduced by morethan 50 % resulting in substantial savings. Theadvantage of adopting improved technology has beenemphatically reflected in the yield data (Table 2.11d.2).
During the rabi season, gram and wheat crops weregrown by 87 beneficiaries under the guidance ofNAIP team, whereas fodder crop, Stylo was alsocultivated in the Common Property Resources (CPR)covering an area of 0.40 ha. Isabgol was introduced in
Dhule cluster during rabi season covering an areaof 0.70 ha.
Gondia clusters
The farmers in the Gondia clusters were mobilized toutilize scarce water resources by adopting communitypaddy nursery preparation and thereby optimally userainwater during the rabi season. This ensured timelytransplanting of the crop and better growth. SRImethod of paddy cultivation was introduced in thetarget areas along with improved varieties of seeds ofpaddy viz., Sindewahi1; HMT and PKV Khamang.Traditional method of ponding rainwater in paddy fieldwas discouraged and moisture level in the fields wasmaintained at field capacity or saturation level.Conoweeder was introduced to overcome weedproblem as a consequence of no-ponding practiceadopted. Upto 30% increase in yield has been observed(Table 2.11d.2). Due to better water management, earlyharvest of kharif paddy left more residual soil moistureand hence rabi crop could be raised. There is a 30 %increase in area under rabi crop. Life saving irrigationswere provided to the rabi crops (approx. 100 ha area)with the help of oil engines purchased under the projectand being used by the cultivators as a common propertyresource (CPR) with responsibility of maintenance. Toreduce water losses along 300 m length in conveyance,irrigation pipes were provided in Bagadband village. Dripirrigation method was introduced in the clusters andfarmers are growing watermelon in the tank beds duringsummer season. The crops raised during rabi includegram, linseed, safflower, lathyrus, mungbean, lablab, etc.
Table 2.11d.1 Results of improved technology demonstrations in Dhule cluster during Kharif season
Crops Improved technology demonstrated No. of Total area %benefi- covered Post Farmers’ increaseciaries (ha) intervention practice over local
Maize Hybrid- 900 M Gold with improved package of practices 10 4.40 55 35 57
Pearlmillet Variety-Tulaja-1579 08 4.00 22 14 57
Table 2.11d.2 Yield of paddy under SRI method of cultivation
Variety Av. yield (Last 20 years) (q ha-1) Variety No of beneficiaries Av. yield (2009-10) q ha-1
Local 16.20 Khamang 36 34.40
Sindewahi-1 22 29.10
HMT 36 25.30
Average grain yield (q ha-1)
Annual Report 2009-10
Research Achievements
128
In rabi season, due to inadequate irrigation facilitiesand uncontrolled grazing, the farmers in Gondia clusterused to keep their land fallow. The farmers wereconvinced to take up crops in rabi. Some socialregulations were decided regarding the grazing ofanimals. In both the clusters, around 200 farmers wereincluded covering an area of 80 hectare land for gramcrop (cv Vijay and Chafa). The seeds of gram weresown immediately after the harvesting of paddy in orderto utilize the residual soil moisture. This interventionhas led to around 30 % increase in the area sown undersecond crop which was meager in the past years.
Livestock Interventions
Aurangabad clusters
Under the livestock interventions, 28 farm families wereprovided with chicks of Kalinga brown breed of poultryalongwith the poultry feed and equipments(Fig. 2.11d.1). This has resulted in income generationamong landless farm families. Apart from this, 31 unitsof Osmanabadi goats were also provided to thebeneficiaries (Fig. 2.11d.2).
Gondia clusters
Sixty farmers (beneficiaries) in Gondia cluster wereprovided with five to seven week old chicks ofGiriraj and Vanraj breed. The beneficiaries werealso supplied with chick feed and grower feedfor the initial period. The birds have gained aweight of approximately 1-1.5 kgs in a span of twomonths.
In addition to the poultry interventions animalhealth check-up, deworming and vaccination campswere held in both the clusters of Gondia district insynergy with officials of the State Animal HusbandryDepartment.
Drudgery ReductionAurangabad clusters
With regards to the drudgery reduction interventions,Cotton picking aprons were provided to ladies(beneficiaries). Besides, 60 fertilizer broadcasters, 400serrated sickles and 113 smokeless chullah weresupplied to the beneficiaries.
Fig. 2.11d.1. Distribution of chicks of Kalinga brown breed of poultry among famers in Aurangabad clusters
Fig. 2.11d.2. Distribution of Osmanabadi goats among farmers in Aurangabad clusters
Poultry Chicks-Kalinga
Osmanabadi Goats
Externally Funded Projects
Annual Report2009-10 129
Dhule clusters
Improved implements like Cycle hoe, Vaibhav Sickles,Cotton stalk puller and maize seller were introducedin the target villages of Dhule cluster under the drudgeryreduction programme to reduce human labour andincrease the efficiency of work.
Gondia clusters
Use of low cost (less than Rs.1500/-) smokeless balloongas is now being actively promoted to replace localChullah. The balloon gas will give relief to the ladiesfrom their otherwise tedious schedule of cooking usingthe firewood and help in reducing the injurious smoke.The methodology of setting up the gobar (balloon) gasunit is very cheap, simple and requires no skills. Thematerials required are good quality plastic sheet, cowdung slurry, 2 plastic pipes for inlet and outlet pipes3-4 feet long and having a diameter of 2.5 cm and aknob to regulate the flow of gas, a gas burner/stoveand pipe to carry gas from the balloon to the gas stove.This gobar (balloon) gas will help in saving the forestfuel wood as well as in drudgery reduction. About 100units (50 units in each cluster) of smokeless balloongas have been introduced in both the clusters of Gondiadistrict.
Soil and Water Resource Development
Aurangabad clusters
Keeping in view the need for availability of water duringrabi season, construction of 50 farm ponds inKhultabad cluster have been sanctioned by State Dept.of Agriculture.
Capacity Building (Training and Workshops)
Aurangabad clusters
A training on value addition, market linkages and microenterprises was conducted in both the clusters ofAurangabad district. The farmers were also giventraining regarding INM practices in cotton at clusterlevel.
Dhule clusters
Short term vocational training on honey bee rearingwas organized at Central Bee Research and TrainingInstitute, Pune to facilitate enhanced off farm incomeand employment generation for beneficiaries throughsupplementary enterprises through capacity building.A training on Value Addition and Post Harvest
technology in Tomato, cotton, rice, maize, gram, wheatand medicinal plants was organized at cluster level.
Gondia clusters
As a part of integrated approach for sustainablelivelihood, the community tanks in the target villageswere leased. A group of farmers were provided withimproved and disease-free fish seeds of Catla, Rohuand Mrigal. The farmers were trained at CIFE,Hoshangabad (M.P.) for seven days. Nearly 56-60 kgfish was harvested from community tank in Salegaon.There are two perennial tanks one in each cluster whichare expected to yield minimum Rs. 300000/- additionally.
As a part of imparting soft skills for sustenance, selectedfarmers in all the six villagers were trained inpisciculture, value addition, micro enterprises, marketlinkages, sericulture etc. Number of crop specifictrainings were also conducted. State departments, SAUsand other agencies were also involved in this work.
Backyard Kitchen Gardening
A package of kitchen gardening was introduced inclusters to make the cluster women acquainted withthe latest and high yielding varieties of vegetables tomeet their day to day needs from their own backyard.The package contained seeds of vegetables like bittergourd, bottle gourd, lady’s finger, pumpkin, maize,cluster beans and ridge gourd, etc. These women weregiven guidance related to growing of these vegetablesin the backyard using household inputs and manure.These interventions led to a drastic change in theavailability of vegetables in the villages. It also resultedin an increased intake of vegetables among the villagerswhich, in turn, has helped them in meeting theirnutritional requirements from their own backyard atno additional cost.
Fig. 2.11d.3. Hands on training of lady farmers inTomato processing
Annual Report 2009-10
Research Achievements
130
2.11e. Development of soil reflectancemethods and variable rate inputs inprecision farming (NAIP-PAU)
Rajeev Srivastava and Dipak Sarkar
Spectral reflectance characteristics of 60 soil samplescollected from Dehlon block of Ludhiana and 10samples from salt affected soils of Karnal areawere studied under laboratory condition between 350-2500 nm using ASD spectroradiometer. The spectralreflectance characteristics of soil samples collected fromDehlon block, Ludhiana and salt affected soils of Karnalare shown in figures 2.11e.1 and 2.11e.2.
in soils of Karnal appears to be due to high saltcontent. Further, salt affected soils of Karnalshowed stronger absorption feature around 1900 nmas compared to the soils of Ludhiana which arenon-saline.
The statistical correlation between soil reflectance andorganic carbon content were studied with limited data.Prior to statistical analysis, the raw spectral reflectancedata were resampled at every tenth-nanometer valuefrom 350-2500 nm using integration technique. Thiswas done to reduce the volume of data for analysisand to match it more closely to the spectral resolutionof the instrument (3 to 10 nm). The reflectance valueswere then transformed with first derivative processing(Fig. 2.11e.3). Derivative transformation is known tominimize variation among samples caused in grindingand optical set-up. Wavebands in regions of low signalto noise ratio or displaying noise because of splicingbetween the individual spectrometers (AnalyticalSpectral Devices Inc.) were omitted leaving 198wavebands for analysis. The omitted bands were 350through 380 nm, 970 through 1010 nm and 2460through 2500 nm.
The correlation between organic carbon and derivativesoil reflectance at different wavelength in soils ofLudhiana is shown in figure 2.11e.3.
Fig. 2.11e.3. Correlation between organic carbon and1st derivative soil reflectance at different wavelength
in soils of Ludhiana
Attempts have also been made with limited datasets tocalibrate individual soil variables against the 198-derivative reflectance wavebands through stepwisemultiple linear regression (SMLR). The dataset wasrandomly divided into two sets wherein 30 sampleseach were used for calibration and the remaining 30samples were used for validation of the model. Goodcalibration (Fig. 2.11e.4) were obtained for Org. C (R2
= 0.90**), soil pH (R2 = 0.91**), available P (R2 = 0.95**).The application of calibration model for given soilattribute also resulted in good validation r2 (0.62** to0.78**). This indicates that soil reflectance propertiescould be used as a potential tool to provide informationon wide range of soil properties.
Fig. 2.11e.1. Spectral reflectance characteristics of soils ofDehlon Block, Ludhiana
Fig. 2.11e.2. Spectral reflectance characteristics of soils ofsalt affected soils of Karnal
The spectral curves of all soils showed prominentabsorption features at 1400, 1900 and 2200 nm. Thesefeatures are mainly associated with free and lattice OHfeature of the clay minerals. Relatively higher reflectance
Externally Funded Projects
Annual Report2009-10 131
Fig. 2.11e.4. Scatter-plot comparison of measured and predicted values of different soil properties for calibration(A) and validation (B) datasets
Annual Report 2009-10
Research Achievements
132
2.11f. Assessment of Quality and Resilienceof Soils in Diverse Agro-ecosystems(NAIP)
T. Bhattacharyya, D. Sarkar, P. Chandran,S.K. Ray, C. Mandal, D.K. Pal, and B. Telpande
To assess the quality and resilience of soil in diverseagro-ecosystems, four AESRs were selected. These are15.1, 7.2, 10.1 and 4.1 respectively. These AESRsrepresent Bankura and Hooghly from West Bengal,Warangal and Nalgonda from Andhra Pradesh, Vidishaand Sehore from Madhya Pradesh and Roopnagar andLudhiana from Punjab respectively.
Two benchmark soil series namely Kantaban andBhulanpur represent Bankura districts and Baligori andHarit soils represent Hooghly district. All these foursoil series were selected from AESR 15.1. Two districtsin Andhra Pradesh (Warangal and Nalgonda) representAESR7.2. Similarly two districts each were selectedfrom AESR 10.1(Vidisha and Sehore) and 4.1(Ludhiana and Roopnagar).
The characterization of these AESRs in terms of climate,soils and crops are shown in table 2.11f.1. Thedigitization of soil maps of Bankura, Warangal,
Nalgonda and Sehore districts have been completed.An example of Bankura district is shown in figure2.11f.1.
Fig. 2.11f.1. Soil map of Bankura district of West Bengal
Table 2.11f.1 Study area for Assessment of Quality and Resilience of Soils in Diverse Agro-ecosystems(National Agriculture Innovation Project)
State (districts) Climate Soils CropsMAT (0C) MAR (mm)
AESR 15.1: Bengal basin and North Bihar Plain, hot moist subhumid ESR1 with deep loamy to clayey, alluvium derivedsoils, medium to high AWC2 and LGP3 210-240 days
AESR 7.2: North Telangana Plateau, hot moist semi-arid ESR with deep loamy and clayey mixed Red and Black Soils,medium to very high AWC and LGP 120-150 days
Andhra Pradesh (Warangal and Nalgonda) 25-29 700-1000 Vertisols Rice-Sorghum
AESR 10.1: Malwa Plateau, Vindhyan Scarpland and Narmada Valley, hot dry, sub humid ESR with medium and deepclayey Black Soils (shallow loamy Black soils as inclusions), high AWC and LGP 150-180 days
Madhya Pradesh (Sehore and Vidisha) 24-25 1000-1500 Vertisols and associated shallow Wheat-Wheatshrink-swell soils
AESR 4.1: North Punjab Plain, Ganga-Yamuna Doab and Rajasthan Upland, hot semi-arid ESR with deep loamy alluvium-derived soils (occasional Saline and Sodic phases), medium AWC and LGP 90-120 days
Punjab (Ludhiana and Roopnagar) 25 600-800 Inceptisols and Entisols Maize-Wheat
1ESR: Eco sub region; 2AWC: Available water capacity; 3LGP: Length of growing period; MAT – mean annual temperature;MAR – mean annual rainfall; AESR – agro-ecological subregions.
N
�
BANKURAWEST BENGAL
SOIL MAP
Externally Funded Projects
Annual Report2009-10 133
2.11g. Changes in Soil Carbon Reserve asInfluenced by Different Ecosystemand Land Use in India (ICAR NetworkProject)
T. Bhattacharyya, D.K. Pal, P. Chandran,S.K. Ray, C. Mandal, D. Sarkar, M.V.Venugopalan, A. M. Nimje and D. Das Gupta
Models are mathematical equations and representreactions which occur between the soils, plants and itsenvironment. Owing to the complexity of the system itbecomes impossible to completely represent the systemin terms of a single model. The complicacy is furtherenhanced by the prevailing trends in global warmingwhich is expected to have certain impact on crop yieldand rate of change in soil organic carbon. To evaluatethe performance of models in Indian scenario, RothCand InfoCrop models were used.
RothC model used on Long Term Fertilizer Experiment(LTFE) site at Kheri (M.P.) turnover of SOC in top soilsthat allows capturing the effects of soil type,temperature, moisture content and plant cover on theturnover process and is The results showed that therewas an increase in total organic carbon (TOC) contentwith the addition of FYM along with recommendeddose of fertilizer as compared to control (Fig. 2.11g.1).
Soils are layered structure (horizons), where processsuch as respiration produces CO2 at various depthswhile diffusion and convention transport CO2 betweenthe soil layers and out of soil. Soil management practicescan either emit CO2 or sequester carbon. RothC modelhas been adopted to study the effect of global warming(increase in mean annual temperature of 0.25ºC perdecade over 100 years from 1990 to 2090) on the TOCcontent of soils. The results of RothC model showedTOC, held within top 100 cm, decreased by 7.85 % insingle layer when compared to a fall of 7.39 % as thesame soil was modelled assuming it as an entity of fivedifferent layers (Fig. 2.11g.2). Treating soil as ahomogenous unit thus greatly overestimate effects ofglobal warming in accelerating decomposition of soilC and hence release of CO2 from soil organic matter.Thus combination of different layers will project actualeffects of global warming in accelerating decompositionof soil carbon and the resultant release of CO2 fromsoil organic matter.
Info Crop is a generic crop model designed to replicatethe effects of weather, soil and agronomic managementon crop yields. InfoCrop model first considers theinfluence of weather, followed by effects soil factors.Hence for execution of the model weather files forKovilpatti, Raipur, Bangalore, Bhopal, Coimbatore,
Fig. 2.11g.1. Representing the effect of carbon turnover incontrol (No fertilizer and manures) and 100%
NPK+FYM treatment
Fig. 2.11g.2. Modelled total organic carbon stocks at Kherisite subjected to an increase of 2.5ºC during 1990 to 2090
Hyderabad and Jabalpur and soil files for Nabibagh,Kheri, CICR Nagpur, Vijayapura and Palathurai wereprepared. The model was executed to simulate theyields for soybean-wheat (Nabibagh), rice-wheat(Kheri), cotton (CICR Nagpur) for commonly cultivatedvariety for scenarios of no climate change and climatechange. The result obtained by using the model forsimulating rice production in Kheri is given in table 2.11g.1.
Annual Report 2009-10
Research Achievements
134
Table 2.11g.1 Yield under potential and water stress condition under situations of no climate changeand climate change in Kheri, Madhya Pradesh.
No Climate Change Climate Change 1 Climate Change 2
(Temperature change) (CO2 change)
Year Potential Water Yield Potential Water Yield Potential Water YieldYield Limited Gap Yield Limited Gap Yield Limited Gap
1 minimum temperature decadal change by 0.25oC2 increased CO2 concentration from 370 ppm to 410 ppm
The result can be used to estimate yield gap bysubtracting the values of water limited yield frompotential yield. The deduced yield gap shows that theaverage decadal yield gap (1991-2000) under scenarioof no climate change is 33%. Under scenario of increasein minimum temperature by 0.25oC the yield gap is32%. But when the scenario shifts to increase inconcentration of atmospheric CO2 from 370 to 410ppm, the yield gap rises to 39%. Since most of theglobal climate change over the past 50 years is verylikely to have been caused by increased emissions ofcarbon dioxide, continuation of such climate change islikely to intensify the demand for irrigation to diminishthe yield gap.
2.11h. Assessment and mapping of someimportant parameters includingmacro and micronutrients for thestate of West Bengal (1:50,000 scale)towards optimum land use plan (StateSponsored Project)
Dipak Sarkar, S.K. Singh, D.C. Nayak, A.K.Sahoo, S.K. Gangopadhyah, K.Das,K.D.Sah. Dipak Dutta, T. Chattopadhyay, S.Mukhopadhyay and T. Banerjee
Eleven thousand four hundred fifty soil samples werecollected at one kilometer grid interval. Sampling
scheme was designed in such a fashion that it coversthe variability in nutrient status induced on account oflandforms (swamp, marshes, shifting dunes and alluvialplains), prevailing crops and cropping sequences (Rice-rice, Rice-mustard) in the coastal West Bengal (EastMedinipur and South 24-Parganas). Macro and micro-nutrient analysis of soils of Haora, North 24-Parganas,Nadia, Puruliya, Bankura, Maldah, Uttar Dinajpur,Koch Bihar, Jalpaiguri, Dakshin Dinajpur and South24-Parganas districts were completed.
Databases comprising various physical, chemicaland fertility properties were prepared for Haora,Nadia, Barddhaman, Birbhum, North 24-Parganasand Hugli districts. Land use and management historyfor the sampling sites have also been included inthe database.
Soil nutrient status maps for the districts Haora,Nadia, Barddhaman, Birbhum, North 24-Parganas andHugli were released by the Honorable Chief ministerof West Bengal, Shri Buddhadev Bhattacharya on 9th December, 2009. Some of the salient findings aredescribed below.
(i) Multiple nutrient deficiencies in Birbhumdistrict
Deficiency of phosphorus, potassium and zincoccurs either individually or in combination (of
Externally Funded Projects
Annual Report2009-10 135
two or three). Common critical areas of lowavailability of these nutrients were delineated bythe intersection of the respective theme maps inGIS. The results (Fig.2.11h.1) indicated that lowavailability of phosphorus, potassium and zinctogether occurred in 37.4% area of the district,whereas low availability of the two nutrients,phosphorus and potassium; phosphorus and zinc;and zinc and potassium in a group was observedin 15.9, 14.4 and 11.7% area of the district. Area,exclusively deficient in phosphorus, potassium andzinc occupied 5.5, 3.7 and 6.3% area, respectively.It is concluded that about 97.4% area of the districtsuffer either from single or multiple nutrientdeficiencies.
Fig.2.11h.1. Single and multiple deficiencies of nutrientsin Birbhum district
(ii) Extensive problems of soil acidity
Low soil pH is one of the dominant problems inthe eastern region. About 52.3 to 81.8% area inthe reported six districts was affected with slightto strong acidity. The problem of acidity is mostsevere and critical in Barddhaman district wherethe soils affected with strong acidity were the
highest (8.4%). Such soils were the lowest (0.07%)in Nadia district. The extent of moderate aciditywas the highest (48.4 %) in Birbhum district andthe lowest (2.2%) in Nadia district. The areaaffected with slight acidity was maximum (40.5%)in Hugli and minimum (8.7%) in Nadia district(Table 2.11h.1).
(iii) Widespread outcropping of sulfidic material
The isolated spots of high concentration(Fig. 2.11h.1) of sulphur indicated the localizeddeposition of sulfidic material. Perhaps these arelinked with past climate before rise of Ganga deltasometimes during twelfth to sixteenth century.Subsequently as a result of intensive agriculture,these seems to have been exposed to air. Theproblems of sulphur outcropping were extensivein Haora and North 24-Parganas.
Table 2.11h.1 Extent and severity of acidity(area ‘000 hectares)
Districts Extent and severity of acidityStrong Moderate Slight
(pH <4.5) (pH 4.5-5.5) (pH 5.5-6.5)
Barddhaman 58.8 (8.4) 266.1 (37.9) 149.3 (35.5)
Hugli 7.8 (2.5) 90.3 (28.7) 127.4(40.5)
Nadia 2.8 (0.7) 8.6 (2.2) 34.2 (8.7)
North 24-Parganas 24.8 (6.1) 24.7 (6.01) 76.8 (18.8)
Birbhum 9.8 (2.2) 220.2 (48.4) 164.9 (36.3)
Haora 2.7 (1.8) 15.6 (10.8) 58.2 (39.7)
() Per cent area of the district
(iv) Extensive potassium mining
About 55 to 92.9% area in the reported districts(Table 2.11h.2) is under potassium stress. Probably,nitrogen based agriculture in prevailing rice-riceor rice-vegetable or rice-potato cropping sequencemay be one of the reasons for such extensivewithdrawal of potassium. The area affected withlow to medium available potassium was the highest92.9 in Birbhum, and the lowest 55% in North24-Pargana. The extent of potassium depletionranged from 80 to 85% area in Barddhamanand Hugli districts, whereas its stress wasmarked in 66 to 75% area in Nadia and Haoradistricts.
N
�
CRUCIAL NUTRIENTS STATUSfor
SOIL FERTILITY MANAGEMENTBirbhum district,
West Bengal
Annual Report 2009-10
Research Achievements
136
Fig.2.11h.2. Extensive outcropping of sulphidic materialin Haora district
Table 2.11h.2 Area distribution under low andmedium availability of potassium (‘000 ha)
Districts Level of potassium K2O (kg ha-1)Low Medium Total
Phosphorus depletion is again one of the miseriesof present nitrogenous fertilizer based agriculture.Birbhum district (88.3% area) was the worstaffected, whereas Nadia (54.3% area) and Hugli(48.4% area) were the least affected districts.Extent of phosphorus depletion was 75.7, 74.5 and77.5% in Barddhaman, North 24-Parganas andHaora districts, respectively (Table 2.11h.3).
Table 2.11h.3 Area distribution under low andmedium availability of phosphorus (‘000 ha)
Districts Level of phosphorus P2 O5 (kg ha-1)Low Medium Total
Like phosphorus and potassium, low availabilityof zinc could also be explained on account offertilizer consumption scenario of the districtsas well as the state as a whole. Among thereported districts, Birbhum (83.3% area) wasthe most affected with low availability of zinc.Barddhaman district has the least zinc deficientarea (59.7%). Zinc depleted area in theremaining districts ranged from 61 to 81% (Table2.11h.4).
Table 2.11h.4 Area distribution underlow and medium availability
of zinc (‘000 ha)
Districts Level of zinc (mg kg-1)
Low Medium Total(<0.6)(1) (0.6-1.0)(2) (1+2)
Barddhaman 229.9 (32.7) 189.6 (27) 419.5 (59.7)
Hugli 114.8 (36.5) 87.6 (27.8) 202.4 (64.3)
Nadia 101.0 (25.7) 153.5 (39.1) 254.4 (64.8)
North 24- Parganas 273.9 (66.9) 55.2 (13.5) 329.1 (80.4)
Birbhum 316.8 (69.7) 62.6 (13.6) 379.4 (83.3)
Haora 23.6 (16.1) 66.1 (45.1) 89.7 (61.2)
() Per cent area of the district
(vii)Excessive availability of iron
Presumably, submergence for fairly long time inthe year may be the cause of exceptionally higheravailability of iron in the reported districts. Ironrich area was the highest (92.8%) in Bardhdhamanand the lowest (62.3%) in North 24-Parganasdistricts. The area having relatively high range ofiron availability in other districts ranged from 87to 91% (Table 2.11h.5).
Table 2.11h.5 Area distribution under high andvery high availability of iron (‘000 ha)
Districts Level of iron (mg kg-1)High Very high Total
(viii)Low potentiality of organic carbon (SOC)sequestration
Organic carbon in soils maintains equilibrium andoscillates between minima and maxima in a set ofconditions governed by soils, climate and modifiedto some extent by land use and management. SOCsequestration takes place with good managementpractices on shifting of equilibrium from minimato maxima and vice versa. Based on the abovenotion, it is concluded that soils (79.9%) of North24-Parganas have the maximum potentiality forcarbon sequestration with support of goodmanagement practices, whereas the scope ofcarbon trading is very limited with soils of Haoradistrict (Table 2.11h.6). It is further concluded thatabout 20.1 to 45.6% areas in the remainingdistricts have potentiality for carbon sequestrationprovided good management practices are adopted.
Table 2.11h.6 Area distribution under low tomedium organic carbon content (‘000 ha)
2.11i. Assessment and mapping of someimportant soil parameters includingmacro and micro nutrients for 13priority districts of Assam statetowards optimum land use planning(State Sponsored Project)
Utpal Baruah, Dipak Sarkar, T.H. Das,S.K. Reza, S. Bandyopadhyay, T.Chattopadhyaya, and Dipak Dutta
The main objective of the project is to prepare district-wise maps of pH, organic carbon, available N, P, Kand micro-nutrients (Cu, Zn, Mn and Fe) on 1:50,000scale for agricultural development towards land useplanning. The base maps (1 km interval grid point) onPolice Station map showing village boundary Publishedby Assam Survey, Govt. of Assam, incorporated bySurvey of India toposheets of 1:50,000 scale were
prepared for the districts of Tinsukia, Nalbari, Darrang,Sonitpur, Udalguri, Lakhimpur, Dhemaji, Morigaonand Nagaon for the field work and sample collection.A total of 10,708 soil samples (0-25 cm) have beencollected covering an area of 25,890 Km2 during theyear. Boundary of 3 newly created districts viz. Chirang,Baksha and Udalguri have been verified at LandRecords, Govt. of Assam Office. Soil sample analysisfor Goalpara district for pH, organic carbon, availableN,P and K have completed and mapped for its spatialvariability using Arc GIS 9.3.1 version.
The Goalpara district of Assam lies between 25º53"-26º30"N, 90º-91º05"E. The base map of the districthas been prepared using 1:50,000 scale toposheets (78J/8, 78/T12, 78J/16, 78K/13, 78K/9, 78K/5 and 78O/1)and Police Station (P.S) maps showing village/blockboundary, river, road and place names. The climate ishumid subtropical. The maximum temperature is 33ºCduring July and August; a minimum temperature fallsup to 7ºC in the month of January. Annual rainfall is2169 mm and about 80% of rainfall is from SouthWest monsoon.
According to soil survey report, there are eight broadsoil subgroups in the district namely Aeric Fluvaquents,Aeric Haplaquepts, Aeric Haplaquents, TypicUdifluvents, Typic Kandihumults, Typic Haplumbrepts,Dystric Eutrochrepts and Typic Paleudults. Nearlyfourteen hundred surface soil samples were collectedfrom a depth of 0-25 cm using a square (1km×1km)grid covering a total area of 1953 km2. Samples werethen kept in labeled plastic bags and brought back tothe laboratory for further analyses. The soil sampleswere air-dried and sieved to pass 2 mm sieve. Soilsamples were analyzed for pH, organic carbon,available P, available K and available N.
The spatial variability map for soil reaction in the studyarea is shown in fig. 2.11i.1. Soil pH values of Goalparadistrict have been grouped into eight classes viz.,extremely acidic (< 4.5), very strongly acidic (4.5-5.0),strongly acidic (5.0-5.5), moderately acidic (5.5-6.0),slightly acidic (6.0-6.5), neutral (6.5-7.0), slightlyalkaline (7.0-7.5) and moderately alkaline (7.5-8.0).Soil pH of the Goalpara district ranged from 4.0 to7.8. About 86.4% area of the district was classified asacidic, 9.4% area was neutral and 4.2% area was inthe alkaline range. The organic carbon distribution map(Fig. 2.11i.2) of the district shows that maximum area(51.1%) was medium in organic carbon contentfollowed by high (32.7%) and low (16.2%) of thedistrict.
Annual Report 2009-10
Research Achievements
138
Fig. 2.11i.1 Spatial distribution map of pH
Fig. 2.11i.2 Spatial distribution map of organic carbon
Fig. 2.11i.3 Spatial distribution map of available N
Fig. 2.11i.4 Spatial distribution map of available P
Fig. 2.11i.5 Spatial distribution map of available K
The spatial variability maps of available N(Fig. 2.11i.3), available P (Fig. 2.11i.4) and availableK (Fig. 2.11i.5) show that the available N of thesoils of Goalpara district are classified as low(7.7%), medium (67.9%) and high (24.4%) area.Similarly the available P content classified as verylow (90.6%), low (8.9%) and medium to high(0.5%) area of the district. The spatial content of theavailable K showed that about 57.5% area of thedistrict is low in available K and 42.5% area is mediumin available K.
The correlation matrix (Table 2.11i.1) betweendifferent soil parameters revealed a highly significantpositive correlation between pH and availableP (0.201**), pH and available K (0.194**) andorganic carbon and available K (0.120**). Organiccarbon was found to be significantly and negati-vely correlated with pH (-0.434**) and availableP (0.204**).
Table 2.11i.1. Correlation matrix between
different soil parameters
Soil parameters pH Organic Avail- Avail- Avail-carbon able able able
N P K
pH 1.000
Organic carbon -0.434** 1.000
Available N 0.037 -0.010 1.000
Available P 0.201** -0.204** -0.032 1.000
Available K 0.194** 0.120** 0.009 0.037 1.000
**Correlation is significant at the P=0.01 level
N
�
SOIL REACTION (pH)Goalpara district, Assam
N
�
AVAILABLE POTASSIUMGoalpara district, Assam
N
�
AVAILABLE PHOSPHOROUSGoalpara district, Assam
N
�
AVAILABLE NITROGENGoalpara district, Assam
N
�
ORGANIC CARBONGoalpara district, Assam
Externally Funded Projects
Annual Report2009-10 139
COLLABORATIVE PROJECT/EXTERNALLY FUNDED
2.11j. A Value chain for coconut fiber andits byproducts: Manufacture ofdiversified products of higher valueand better marketability to enhancethe economic returns to farmers(Sponsored by T.N. Natural Research& Development Centre)
K. M. Nair, S. Thayalan, K.S. Anil Kumar,L.G.K. Naidu and Dipak Sarkar
T.M. Natural Resource Research and DevelopmentCentre (NGO), a consortium partner of the projecthas sponsored detailed study of soils of threepanchayats of Thiruvananthapuram district toNBSS&LUP, Regional centre, Bangalore. Thirupuram,Kanjiramkulam and Kadinamkulam panchayatscovering nearly 4000 ha form the study area. Todocument the soil variability in the three panchayats,a detailed soil survey was undertaken and sampleswere drawn for assessment of soil qualities includingmacro and micro nutrient availability. Detailed soilsurvey has resulted in identification of 5 soil series andmapping of soils with phases of soil series as map units.The landscape is undulating with broad uplands andnarrow valleys. Major crop of upland is coconut intercropped with a variety of annual crops like plantain,tapioca etc. The upland soils are very deep, welldrained, dark red, clay loam in texture. The stronglyacidic, poor base, non-gravelly laterite soils arespecific to southern parts of Thiruvanathapuramdistrict and extends to Kanniyakumari district ofTamil Nadu. These soils are distinct from lateritic soilsof other parts of Kerala state by absence of lateritegravel in the solum. The climate of the area ismoist sub humid with mean annual precipitation of1884 mm. However soil moisture deficit isexperienced only for around three months byvirtue of well distributed rainfall. The soil seriesidentified and mapped as Neyyattinkara seriesis best accorded the status of Benchmark series becauseof the uniqueness of the soil, extensive coverage in aspecific geographical area and experiencing uniqueclimate.
2.11k. Soils variability mapping and fertilityzonation using Hyperspectral data(A collaborative project betweenNBSS&LUP and SAC, Ahmedabad)
A.K. Maji, Rajeev Srivastava, M.S.S.Nagaraju, D.S. Singh, A.K. Barthwal andR.L. Mehta (SAC, Ahmedabad)
The project was undertaken in collaboration with SACAhmedabad to study the applicability of hyperspectraldata (hyperion sensor data) in mapping soils variabilityand delineating soil fertility zones. For the presentinvestigation, a study area was selected in Buldhanadistrict, Maharashtra from latitude 190 45’ to 200 15’N and longitude from 760 26’ to 760 37’ E.
Image processing of Hyperion data
The Hyperion VNIR sensor has 70 bands, and theSWIR has 172 bands providing 242 potential bands.A number of the bands were intentionally notilluminated and others (mainly in the overlap regionbetween the two spectrometers) correspond to areasof low sensitivity of the spectrometer materials. Thenon-illuminated bands (1 to 7, 58 to 76, and 225 to242) were removed leaving 198 bands. Among the 198,there are four remaining bands in the overlap betweenthe two spectrometers. These are VNIR bands 56(915.7 nm) and 57 (925.9 nm) and SWIR bands 77(912.5 nm) and 78 (922.6 nm). On eliminating two ofthese, 196 unique bands are obtained. In the presentstudy, the unique 196 bands selected were bands 8 to57 and 79 to 224.
From these 196 bands, atmospheric water vapor bands(between 1356 and 1417 nm, 1820 and 1932 nm) thatabsorb almost all of the incident and reflected solarradiation (Band 121-127 and 167-178 ) and the bandsshowing significant striping (bands 8, 9, 10, 57, 79,80, 81, 98-100, 119, 133, 134, 164, 183, 184,218-221) were removed. Thus, remaining 139 bands(Table 2.11k.1) were used for further processing.
Table 2.11k.1 Hyperion bands used foratmospheric correction
Region Band number Wavelength (nm)
VNIR 11 to 56 457.3 to 915.2
SWIR 82 to 97 962.9 to 1114.2
101 to 118 1154.6 to 1326.1
135 to 163 1497.6 to 1780.1
188 to 217 2032.3 to 2324.9
Annual Report 2009-10
Research Achievements
140
Abnormal pixels correction: Hyperion L1R imagecontains dark vertical stripes in the image. One possiblereason for the abnormal pixels could be that thecalibration of the detectors in the detector arraybecomes unbalanced. The Hyperion system acquiresdata in pushbroom mode, in which there is a separatedetector to gather data for each column. If the detectorsare not calibrated properly striping artifacts could easilybe generated. These vertical stripes in the data wereremoved through vertical stripe removal programmein the ENVI. The visual effect of the same is depictedin figure 2.11k.1.
Fig. 2.11k.1. Original Hyperion image (left) showsprominent vertical stripes in Band 56 destriped image
(right) has no vertical stripes
The effects of destriping on Hyperion were tested usingthe Minimum Noise Fraction (MNF) transformation.The MNF technique responds to interactions betweenthe spatial structure of the data and that of the noisewhen the noise has strong spatial structure. It isobserved that first MNF of 139 band Hyperion data(without destriping) showed strong brightness gradientthat corresponds to the spectral “smile” in the VNIRarray. However, in the destriped image no such gradientwas observed (Fig. 2.11k.2).
Atmospheric correction: Atmospheric correction ofhyperspectral data is required for conversion ofradiance data into reflectance unit. Reflectanceinformation is more favorably compared than radianceinformation. This is because reflectance informationfrom a feature would relatively similar anywhere inthe world, while radiance information is affected byvarious factors in the atmosphere. Reflectanceinformation also enables the identification of featuresin the image by comparing its reflectance signature toreference reflectance signature stored in spectral library.Additionally, the atmospheric correction reduces theeffects of the atmosphere, solar illumination, sensorviewing geometry, and terrain that might alter theinformation being sensed by the sensors. Therefore,accurate surface reflectance could be extracted fromthe imagery.
In the present investigation, FLAASH (Fast Line-of-sight Atmospheric Analysis of Spectral Hypercubes)was used for the conversion of radiance image intospectral reflectance image. The radiance and spectralreflectance profile of vegetation in the study area isshown in figure 2.11k.3.
Fig. 2.11k.3. The radiance (A) and spectral reflectance(B) profile of vegetation
Fig. 2.11k.2. MNF Band 1 of the Hyperion 139 bandswithout destriping (left) and after destriping (right)
A
B
Externally Funded Projects
Annual Report2009-10 141
Geo-rectification: Since Hyperion imagescomes as radiometric corrected only,georectification procedure were required toassign coordinate into it. Georectification ofhyperion data was using SOI (Survey of India)toposheet available on 1: 50,000 scale.
Physiographic interpretation
Physiography map of the study area wasprepared through visual interpretation ofprocessed and geo-rectified Hyperion dataFCC in conjunction with SOI (Survey ofIndia) toposheets (1:50,000). Since theHyperion data of June 2007 was cloudy atmany places, IRS-1C FCC of May 2008 wasalso used to delineate the physiographic unitsin the cloudy and shadowed area.
The area has been grouped into six dominantlandform/physiography viz. plateau, mound,escarpments, pediment narrow valley andbroad valley. These physiographic units havebeen further sub-divided based on slope,landuse and image characteristics.The physiogaphy interpretation legend isgiven in table 2.11k.2 and the map of the areais shown in figure 2.11k.4. Fig. 2.11k.4. Physiography map of Lonar and adjoining area
Table 2.11k.2 Physiography, Lonar and Adjoining areas, Buldhana dist., Maharashtra
Pediments (D) V. Steeply Sloping (4) Scrubland (s) Greenish-yellow + diffused checkerboard pattern (4)
Narrow Valley (N) Greenish-yellow + irregular shape (5)
Broad Valley (B) Medium gray+ bold checker boardpattern ( 6)
Medium gray + pink patches + boldchecker board pattern (7)
Pinkish-gray + diffused checkerboard pattern (8)
Pinkish-gray + irregular shape (9)
Pinkish-white + irregular shape (10)
Pinkish-yellow + irregular shape (11)
Red + gray+ bold checker boardpattern 12)
N
�
PHYSIOGRAPHYLonar and Adjoining areas,
Buldhana district, Maharastra
Annual Report 2009-10
Research Achievements
142
Physiography - soil relationship
The relationship between physiography and soilhas been widely recognized and has greatsignificance on soil variability mapping. Field workwas carried out to collect soil data using physio-graphic unit map as base map in conjunction withSOI toposheets. After systematic study of soils indifferent physiographic units, physiography-soilrelationship was developed (Table 2.11k.3).
The data obtained indicates changes in importantsoil properties viz. depth, physical and chemicalproperties, profile development, etc. with thevariation in physiographic unit. Fourteen soil serieswere tentatively identified in the area and mappedas association of soil series. The soil map of thearea has been presented in figure 2.11k.5. The salientphysical and chemical characteristics of the soils aregiven in Tables 2.11k.4 and 2.11k.5 respectively.
The soils vary from very shallow to very deep,moderately well drained to excessively drained,and have clay-loam to clay soil texture. The soilcolour varies between hue of 7.5YR and 10YR.The Smectite is the dominant clay mineral in thesesoils. According to Soil Taxonomy, the soils belongto subgroups of Lithic Ustorthents/Haplustepts(shallow soils), Typic/Vertic Haplustepts (Mediumdeep soils) and Typic Haplusterts (deep to verydeep black cotton soils).
Table 2.11k.3 Physiography-soil relationship
Physiography Symbol Soil Series Association Map Soil Soil TaxonomySymbol
Fig. 2.11k.5. Soil map of Lonar and adjoining area ofBuldhana district, Maharashtra
N
�
SOILSLonar and Adjoining areas,
Buldhana district, Maharastra
Externally Funded Projects
Annual Report2009-10 143
Table 2.11k.4 Physical characteristics of soil series of Lonar and adjoining area
Name of series Depth (cm) Sand (%) Silt (%) Clay (%) Water retention (%) AWC (%)
33 kPa 15 kPa
Bhalegaon 0-16 3.0 31.6 65.4 36.4 23.8 12.6
16-35 2.4 31.2 66.4 35.8 23.4 12.4
35-55 2.2 31.1 66.8 36.3 23.5 12.8
Sultanpur 0-6 20.9 34.5 44.6 34.7 20.4 14.3
Pardi 0-10 18.9 34.9 46.2 41.9 29.5 12.4
10-22 18.8 35.4 45.8 41.0 28.9 12.1
Weni 0-21 44.8 40.3 15.0 19.8 9.1 10.7
Shara 0-15 7.8 29.3 62.9 36.5 24.2 12.3
Lonar-4 0-21 24.6 39.5 35.9 34.7 22.6 12.1
Pangradole 0-18 16.4 33.0 50.5 33.4 22.1 11.3
Lonar-3 0-14 42.7 35.3 22.0 25.0 11.3 13.7
14-25 38.4 38.5 23.1 24.1 11.9 12.2
Lonar-2 0-16 33.3 41.5 25.2 24.6 11.7 12.8
16-28 30.6 40.0 29.4 26.0 16.3 9.7
Lonar-1 0-16 8.0 32.7 59.3 39.2 26.6 12.6
16-42 8.1 31.2 60.7 39.8 29.7 10.1
Deolgaon 0-10 26.2 43.6 30.2 26.7 14.8 11.9
10-30 27.7 41.4 30.9 24.2 14.0 10.2
Deothana 0-20 16.7 29.5 53.8 30.8 20.9 9.8
20-51 10.9 27.2 61.9 36.7 25.3 11.4
51-70 19.5 26.3 54.2 37.0 24.5 12.5
Kinhi 0-9 48.5 35.0 16.5 19.9 10.0 9.9
Mehkar 0-20 4.1 38.8 57.1 33.9 24.3 9.7
20-50 2.9 35.1 62.0 33.9 23.2 10.7
50-78 2.3 38.0 59.7 35.3 23.6 11.7
78-117 2.5 33.9 63.6 39.4 27.2 12.1
117-150 2.2 38.2 59.6 39.8 25.5 14.3
Table 2.11k.5 Chemical characteristics of soil series of Lonar and adjoining area
Name of Series Depth pH EC OC CaCO3 Avail. N Avail. P Avail. K(cm) (1:2.5) (dSm-1) (%) (%) ....................Kg ha-1....................
Bhalegaon 0-16 8.3 0.1 1.0 8.4 284.5 10.7 571.9
16-35 8.3 0.1 0.9 5.9 288.9 8.9 391.1
35-55 8.3 0.1 0.7 9.3 246.2 8.7 324.9
Sultanpur 0-6 7.1 0.1 1.6 2.2 216.7 8.9 328.8
Pardi 0-10 8.2 0.1 0.3 4.9 192.2 9.9 288.8
10-22 8.3 0.1 0.2 5.4 126.3 6.6 198.6
Weni 0-21 8.4 0.1 0.4 9.7 234.3 8.8 88.6
Shara 0-15 6.5 0.1 1.2 1.9 377.8 16.4 177.0
Lonar-4 0-21 7.7 0.1 0.6 2.9 238.4 23.2 398.2
Pangradole 0-18 7.5 0.1 0.8 2.3 265.4 21.9 200.4
Lonar-3 0-14 8.4 0.1 0.5 17.2 290.5 9.8 155.0
14-25 8.4 0.1 0.5 18.4 222.7 6.7 125.6cont...
Annual Report 2009-10
Research Achievements
144
Lonar-2 0-16 8.4 0.1 0.3 19.0 206.3 3.3 98.8
16-28 8.4 0.1 0.6 6.6 266.9 3.4 202.7
Lonar-1 0-16 8.5 0.1 0.6 9.4 199.8 3.3 75.3
16-42 7.4 0.1 0.8 3.4 426.8 62.2 375.1
Deolgaon 0-10 7.8 0.1 0.7 3.6 267.2 23.6 254.8
10-30 7.2 0.1 0.9 2.9 256.1 6.1 146.1
Deothana 0-20 7.6 0.0 0.6 2.9 193.6 2.1 72.3
20-51 8.5 0.1 0.5 19.7 182.7 4.4 348.4
51-70 8.8 0.1 0.3 20.0 170.3 13.1 233.9
Kinhi 0-9 8.9 0.2 0.1 21.7 41.5 6.6 140.0
Mehkar 0-20 8.6 0.2 1.0 11.5 251.5 8.9 631.8
20-50 8.6 0.2 0.6 10.7 205.5 6.7 279.6
50-78 8.7 0.2 0.6 9.5 196.4 4.5 247.1
78-117 8.8 0.2 0.6 10.8 132.7 3.3 265.9
117-150 9.0 0.3 0.5 12.1 182.3 4.4 265.5
2.11l. Assessment ofDegraded landsand WastelandsDatasets of India -A GIS BasedApproach
(A CollaborativeProject betweenNBSS&LUP, NRMDivision (ICAR), NAAS,CSWCR&TI, CSSR,CAZRI and NRSA)
A.K. Maji, G.P. Obi
Reddy and Sunil
Meshram
During the reporting year,the degradation and wastelandmap of India in differentagro-ecological regions hasbeen generated (Fig. 2.11l.1).The class wise distributionof degraded and wastelandsin India is shown in table2.11l.1. Fig. 2.11l.1. Degraded lands and wastelands of India at AER
Name of Series Depth pH EC OC CaCO3 Avail. N Avail. P Avail. K(cm) (1:2.5) (dSm-1) (%) (%) ....................Kg ha-1....................
N
�
INDIADegraded lands and Wastelands
Externally Funded Projects
Annual Report
2009-10
145
Table 2.11l.1. Area under degraded and wastelands under different AERs of India
National Bureau of Soil Survey and Land Use Planning (NBSS&LUP), Nagpur
Area under Degraded Lands and Wastelands of India under different AERs
S. No. AERs Degraded Lands and Wastelands Classes (000' ha) Total Class 1 2 3 4 5 6 7 8 9 10 11 12 13 14 15 16 17 18 19 Area (000'ha)
Others*=>Chandigarh, D. & N. Haveli, Daman & Diu, Lakshadweep and PondicherryNote : Snow coverd / Ice Caps & Barren rocky / Stone waste classes are not included in emtimation of degraded lands and wastelands of India.
S. No. Classes1 Exclusively water erosion (>10t/ha/yr)2 Water erosion under open forest3 Exclusiverly acid soil (pH <5.5)4 Acid soils under water erosion5 Acid soils under water erosion6 Exclusively wind erosion7 Exclusively saline soils
S. No. Classes8 Eroded saline soils9 Acid saline soils10 Saline soils under wind erosion11 Saline soils under open forest12 Water logged saline soils13 Exclusively sodic soils14 Eroded sodic soils
S. No. Classes15 Spdoc soils under wind erosion
16 Sodic soils under open forest
17 Eroded sodic soils under open forest18 Mining / Industrical waste
During the reporting year, under the collaborative
Fig. 2.11m.1. Micro-nutrient maps of Haryana state
project on ‘Micro Nutrient Mapping’ with IISS,Bhopal, maps showing areas of deficiency ofzinc, copper and manganese have been generatedin GIS environment. The district wise micro-nutrient maps of Haryana state are shown infigure 2.11m.1.
N
�
HARYANACopper Fertility Status in Soils
N
�
HARYANAManganese Fertility Status in Soils
N
�
HARYANAIron Fertility Status in Soils
N
�
HARYANAZinc Fertility Status in Soils
Externally Funded Projects
Annual Report2009-10 147
2.11n. Development of GISBased Seamless Mosaicof SRTM Elevation Data ofIndia to Analyze andCharacterize the SelectedGeomorphic Parameters
G.P. Obi Reddy, A.K. Maji, S.N.Das and Rajeev Srivastava
This inter-institutional project was takenup to develop a seamless mosaic ofSRTM digital elevation data (90m) forIndia. Further, it was aimed to analyseand characterize the selectedgeomorphological parameters. Duringthe reporting year, 35 digital elevationscenes were downloaded and a seamlessmosaic in Arc GIS was developed, afternecessary correction in the database.The generated database can be used forother important national projects likeenrichment of land degradationdatabase and development ofGeoreferenced soil information system(NAIP Project). The generated seamlessdigital elevation data of India is shownin figure 2.11n.1. Fig. 2.11n.1. Digital Elevation Map of India
2.11o. Enrichment of land degradationdatasets with soils datasets ofdifferent states of India (NBSS-NRSCInter Institutional project)
NRSC: P. S. Roy (Coordinator) T. Ravisankar,K. Srinivas, G. Sujatha and M.A. Fiazy
This inter institutional project is aimed to enrich theland degradation maps on 1:50,000 scale generatedby NRSC with soil/soil loss parameters of NBSS.Further, it is also aimed to finalise the state wise landdegradation maps of India. The main activities involvedin the project are (i) projection transformation of soil/soil loss datasets to make it compatible with land
degradation datasets, (ii) appending the identified soil/soil loss parameters contributing towards the landdegradation to enrich land degradation datasets usingthe suitable option in GIS, (iii) reconciliation of theenriched land degradation datasets, and (iv) finalizationof the state wise enriched land degradation maps.During the reporting year, the enrichment of landdegradation datasets of Orissa state is collated.
2.11p. Human Resource development inRemote sensing and GIS in NaturalResource Management - NNRMS(ISRO) - NBSS&LUP CollaborativeProject
A.K. Maji, Arun Chaturvedi, G.P. Obi Reddyand Head RC’s
Remote sensing and Geographic Information System(GIS) are essential tools for natural resources mapping,
N
�
INDIADigital Elevation Map (SRTM - 90m)
Annual Report 2009-10
Research Achievements
148
monitoring, planning and management. Keepingthis in view NNRMS (ISRO) and NBSS&LUP jointlyformulated a project to organize a series of trainingprogrammes at different Regional centers and HeadQuarters of NBSS&LUP. The main objectives of thejoint effort are (i) capacity building in the field of RSand GIS application in natural resources management,(ii) enhance expert manpower to cater to the needs ofagricultural universities, state departments and districtdevelopmental agencies, and (iii) to pave the way forinter institutional collaboration towards spatialdatabase creation and management. So far six trainingprogrammes have been conducted and 103 traineeofficers from ICAR, SAU’s, State Govt. departmentsand Academic institutions were trained. Two trainingprogrammes are planned to be organized in the year2010-11.
2.11q. Land Resource Inventory and GISDatabase for Farm Planning in 10Blocks of Tamil Nadu (II phase)
A. Natarajan, K.S. Anilkumar, S. Thayalan,V. Ramamurthy, K.V. Niranjana, B.A.Dhanorkar, Arti Koyal, D.H. Venkatesh, andS. Srinivas
Collaborating Organisations: Soil Survey and Land UseOrganisation, Coimbatore, Agricultural EngineeringDepartment, Govt. of Tamil Nadu, Tamil NaduAgricultural University, Coimbatore.
This project is planned to provide the requiredsite-specific database suitable for Farm level planningin 10 blocks of the priority districts identified by theGovt. of Tamil Nadu which covers 3.6 lakh ha. Theblocks surveyed are: Thirumanur, Annur,Pappireddipatti, Ottanchadram, Uthangarai,Rasipuram, Perambalur, R.S.Mangalam, Veerapandiand Gingee.
Field work has been completed in all the ten blocks ofthe state. Scanning, digitization and preparation ofvillage-wise soil maps and analysis of the soil samplesare in progress. All the field survey, laboratory and GISwork are being done by the Department of Agricultureand TNAU.
2.11r. Assessment of Land Resources forgrowing Horticultural Crops inselected districts of Tamil Nadu underthe National Horticultural MissionProject
A. Natarajan, V. Ramamurthy, S. Thayalan,S. Srinivas, K.V.Niranjana, M.Ramesh,D.H.Venkatesh and S. Vadivelu
Collaborating Organisations: Soil Survey and Land UseOrganisation, Coimbatore, Department Agriculture,Govt. of Tamil Nadu
Project is aiming to assess the suitability of existingland resources for the cultivation of horticultural cropsin 14 districts identified under the NationalHorticultural Mission project in Tamil Nadu by usingthe information available from the earlier soil surveywork.
The soil database were compiled for the 14 district andsuitability assessment was carried out and mapsgenerated. Identified the potential areas by limited fieldchecks. Also identified site and area specific constraintsfor the cultivation of horticultural crops grown in thedistrict.
2.11s. Nutrient Indexing and soil fertilityAssessment of Kole lands
K. M. Nair, K. S. Anil Kumar, S. Srinivas,L.G.K. Naidu and Dipak Sarkar
“Kole” is a wet land ecosystem below mean sea levelin coastal Kerala spread over Thrissur and Malappuramdistricts. One crop of rice is taken on these lands afterflushing off the sea water by monsoon rains. Thecurrent project envisages assessment of soil reaction,soil salinity and macro-and micro-nutrients of theKole lands and development of plant nutrientmanagement plan for land parcels. NBSS & LUP hadbeen entrusted with the task of evolving scheme ofsoil sampling and post processing of data generated inspatial frame work using a GIS for preparation of soilfertility maps. KAU is undertaking soil sampling andanalysis. Fig. 2.11s.1 depicts the spatial distribution ofKole lands.
Externally Funded Projects
Annual Report2009-10 149
Fig. 2.11s.1. Kole lands of Thrissur district
Fig. 2.11s.2. Kole lands, below sea level, remain flooded for most parts of the year and are cultivated to single crop of riceduring rabi season by pumping out water
2.11t. Agro-ecological Units of Kerala
K.M. Nair, Champa Mandal, ArunChaturved, S. Thayalan, S.C. RameshKumar, V. Ramamurthy, K.S. Anil Kumar,S. Srinivas. L.G.K. Naidu and Dipak Sarkar
The Kerala State Planning Board sponsored this projectfor the National Bureau of Soil Survey and Land Use
Planning to develop an agro-ecological unit map forKerala State and district-wise maps for all 14 districts.During the reporting period state and district-wise agro-ecological units maps were finalized.
The concept of agro-ecological units was developedby FAO (1975) with strong emphasis on comparableagro-climatic parameters to delineate agriculturally
KOLE LANDS OF THRISSUR
Annual Report 2009-10
Research Achievements
150
potential areas for particular crop or combinations ofcrops so that optimum production potential is achieved.The method suggested by FAO with modifications tosuit local conditions was adopted for delineating agro-ecological units for the state. Primary data setsemployed were climatic data from 206 stations, soildata, geomorphology, hydrology and land use. Spatialdata sets were generated for said parameters andintegrated in a GIS environment to prepare the agro-
Fig. 2.11t.1 Agro-ecolgical units of Kerala
ecological units. Five agro-ecological zones and 23agro-ecological units were delineated for the state.
The State Planning Board has already initiated use ofthe map for agricultural developmental planning.
The state agro-ecological units map with abbreviatedlegend is presented in Fig. 2.11t.1 and full legend forthe map is provided in table 2.11t.1. An example ofdistrict map with AEZ units is presented in Fig. 2.11t.2.
N
�
AGRO-ECOLOGY OF KERALA
Externally Funded Projects
Annual Report2009-10 151
Coastal plain comprises the narrow strip of nearly levelland along the coast line. Included in the zone arc thelands subject to sea water inundation, back waters andsandy plains. The coastal plain has been divided intosix agro-ecological units based primarily on land, soiland climate features.
Agro-ecological Unit 1.1:Southern coastal plain
This unit comprises coastal plains adjacent to coastline from Thiruvananthapuram to Alappuzha district.The climate ranges from moist sub-humid to humid,in south-north direction. Mean annual rainfall is 2264mm. Soil moisture availability is adequate for plantgrowth from mid April to mid December. Dry periodis four months.
Soil are deep, acidic, sands except for southern partswhere laterite soils extend very near to beach. Thedominant land use is coconut plantations inter-croppedto a variety of perinncal and annual crops.
Agro-ecological Unit 1.2:Northern coastal plain
This unit comprises the coastal plain adjacent to coastline from Thrissur to Kasaragod. The climate is humidwith mean annual rainfall of 3190.6 mm. Soil moistureis adequate for plant growth from mid May to midDecember. Dry period is five months.
Sandy soils dominate the coastal plain in Thrissurdistrict whereas in the other districts coastal lateritesarc the dominant soils with sands confined to beach.Land use is coconut plantations inter-cropped with avariety of other perennial and annual crops.
Agro-ecological Unit 1.3:Onattukara sandy plain
Forty two panchayats spread over coastal Kollam andAlappuzha districts constitute this unit. The climate ishumid with mean annual rainfall of 2582 mm. Soilmoisture is adequate for plant growth from mid Aprilto mid December. Dry period is four months. Sandysoils cover most area of the unit. Land use is coconutplantation in uplands and rice in low lands.
Agro-ecological Unit 1.4:Kuttanadu
Kuttanadu comprises those lands which arc for mostpart of the year inundated with water. These lands are
below sea level. Rice cultivation is made possible inthese lands by preventing the entry of sea waterand pumping out water from the fields during drymonths.
Hydromorphic and potential acid sulphatesoils developed from alluvial deposits andmarine sediments dominate the land. Rice is theonly crop grown. Draining these soils completelycan result in the development of acid sulphatesoils and consequent extremely acid soils andwater.
Agro-ecological Unit 1.5:Pokkali lands
Pokkali lands start from northern coastal part ofAlappuzha, cover the entire coast of Emakulam andsouthern most part of Thrissur. The land ispermanently submerged under saline water. UnlikeKuttanadu there are no structures to prevent entry ofsea water.
Rice cultivation is practiced in these lands, afterthe flushing out of salt water during monsoonfloods, by adopting special cultivation methodsand using salt tolerant rice verities. Fishery is anotherland use.
Agro-ecological Unit 1.6:Kole lands
Kole lands occur in the coastal region of Thrissur andsouthern coast of Malappuram district. Like inKuttanadu sea water inundation into these lands(below sea level) is prevented through mechanicalmeans. During low rainfall months the water fromfields arc pumped out (to sea and/or maintained inchannels) and one or two crops of rice is taken. Alluvialacid, clay soils and potential acid sulphate soilsdominate these lands.
Agro-ecological Unit 1.7:Kaipad lands
This unit comprises these lands which arc for mostpart of the year inundated with water, in Kozhikkodc,Kannur and Kasargod districts. These lands areHushed with sea water and fresh water periodically.The soils developed from alluviar and marine depositsare very deep, acidic, saline. These lands are cultivatedto rice for one season.
Table 2.11t.1 Descriptive legend for the map agro-ecology of Kerala
AGRO-ECOLOGICAL ZONE 1: COASTAL PLAINS
Annual Report 2009-10
Research Achievements
152
Midland latcrites extend as a strip of land bound onwest by coaslal plain and foot hills or hills on theeastern side. These lands have rolling uplands withnarrow valleys and occasional low hills and gentlysloping plateaus. Three agro-ecological units weredelineated in the zone primarily based on the lengthof dry period and the nature of soils.
Agro-ccological Unit 2.1:Southern latcrites
This unit covers the south western part ofThiruvananthapuram district.Climate is moistsubhumid tropical monsoon type with mean annualprecipitation of 1884 mm. Soil moisture is adequatefrom May to January of subsequent year. Dry periodis three months. Soils are deep, red, strongly acid, loamto clay loam. Land use is dominantly coconutplantations. Narrow valleys are cultivated to ricevegetables, tapioca and banana.
Agro-ecological Unit 2.2:South central latcrites
This unit covers the midland latcrites fromThiruvananthapuram to Ernakulam districts. Theclimate is humid, except for southern half ofThiruvananthapuram wherein it is only moist sub-humid. The mean annual precipitation is 3145 mm.Rainfall increases in south to north direction (1974 inVamanapuram to 3 178 mm in Perumbavoor). Soilmoisture availability is adequate from mid April toend of December. Dry period is three and half months.
Soils arc deep, strongly acid, red loamy whereas inthe other parts it is deep, strongly acid. red.very gravelly clay. Land use of midland latcrites inThiruvananthapuram is dominantly coconut. In other
parts rubber has replaced most of the coconut andannual cropped areas. The narrow valleys arccultivated to rice. However, most of the rice fields arccurrently being converted to fields of other crops liketapioca, banana and vegetables.
Agro-ecological Unit 2.3:North central latcrites
This unit covers the midland latcrites of Thrissur andPalakkad districts. Climate is moderately humid to veryhumid. Mean annual precipitation is 2823 mm. Soilmoisture availability is adequate from mid May to endof December.
Soils are deep, strongly acid, red, very gravelly clay.Occasional laterite outcrops are also seen. Land use ismainly coconut inter-cropped with perennial andannual crops and rubber plantations. The valleys arecultivated to rice. Dry period is four and half months.
Agro-ecological Unit 2.4:Northern latcrites
This unit covers the midland latcrites of Malappuram,Kozhikodc, Kannur and Kasargode districts. Climatevaries from moderately humid to extremely humid.Mean annual rainfall is 3162 mm. Soil moisture isadequate for crop growth from mid May to midDecember. Dry period is five months.
Soils arc moderately deep to deep. strongly acid, red,very gravelly clay. Laterite outcrops and areas with shallowsoil cover are extensive in the unit. Their extent increasesfrom south to north. Such areas are often barren withscanty vegetation cover. The slopes of the rolling lands arecultivated to coconut and cashew with many intercrops.The valleys have rice and arcca nut as major crops.
AGRO-ECOLOGICAL ZONE 2: MIDLAND LATERITES
AGRO-ECOLOGICAL ZONE 3: FOOT HILLS
Agro-ecological Unit 3.1: Southern andCentral foot hills
This unit covers the foot hills of Thiruvananthpuramto Ernakulam districts of the state. Climate varies fromhumid to per-humid. Mean annual rainfall is 3664.5mm. Soil moisture is adequate from April to midJanuary. Dry period is two and half months.
Soils are very deep, strongly acid, gravelly clay. Theland use is dominanlly rubber plantation. The valleysused for rice production in earlier days are currentlyunder tapioca, banana, vegetable and pine appleproduction systems.
Agro-ecological Unit 3.2:Northern foot hills
This unit covers the foot hills of Palakkad. Malappuram.Kannur and Kasargode. Climate in humid, except forMalampuzha region (Palakkad) wherein it is moist sub-humid. The mean annual rainfall is 2486 mm. Soilmoisture is adequate from mid May to end ofDecember. Dry period is four and half months.
Soils arc deep, strongly acid, gravelly clay. Dominantcrop production systems in the sloping uplands arccoconut, rubber and pepper. The low lands have rice,arcca nut, banana and vegetables.
Externally Funded Projects
Annual Report2009-10 153
The hills of Western Ghats and Wynad plateauconstitute the high hill agro-ecological zone. Theyoccur in all districts of the state except for Alappuzhaand Kottayam. Elevation in most parts are more than400 meters above mean sea level. Eight agro-ecologicalunits were delineated in the zone based primarily onthe length of dry period.
Agro-ecological Unit 4.1:Southern high hills
The unit covers high hills of Thiruvananthpuram,Kollam. Palhanamlhitta. Idukki. Ernakulam and hillsin the south-eastern parts of Thrissur and southernpart of Palakkad. Climate is for most part per-humidwith mean annual rainfall of 3548.5 mm. Soil moistureis adequate from mid April to mid February (of nextyear). Dry period is two months. Soils are deep,strongly acid, clay. Dominant land use is forests.Plantations of tea, cardamom, coffee and pepper arethe other major land use.
Agro-ecological Unit 4.2:Northern high hills
This unit covers the high hills of Thrissur, northernPalakkad, Malappuram. Kozhikode, Kannur andKasargode. Climate is humid and per-humid. Meanannual rainfall is 3256.6 mm. Soil moisture is adequatefrom May to December. Dry period is four months.Soils are deep, strongly acid, clay. Land use in dominantlyforest with occasional plantations of coffee and tea.
Agro-ecological Unit 4.3:Kumaly dry hills
This unit comprises the eastern and south-eastern partsof Idukki district which experience drier climate(slightly to moderately humid) compared to the centraland western parts of the district. Mean annual rainfallof the unit is 1809 mm. Soil moisture is adequate fromMay to January (of next year). Dry period is threemonths. Soils are deep, acidic, clay. Land use is forestsand plantations of tea and cardamom.
Agro-ecological Unit 4.4:Marayoor dry hills
The unit cover the north eastern part of Idukkiexperiencing dry sub-humid climate. Mean annualrainfall is only 1276 mm. Soil moisture is adequatefrom June to mid February (of next year).
Dry period is three and half months. Soils are deep,neutral, clay loam. Land use besides forest and
plantations include many temperate vegetable cropsand sugarcane.
Agro-ecological Unit 4.5:Attappady dry hills
This unit covers a narrow strip of land in the east-central half of the Attappadi hill region of Palakkaddistrict. Climate is dry sub-humid to moist sub-humid.Mean annual rainfall is 1482 mm. soil moisture isadequate from June to January (of next year). Dryperiod is four months. Soils are deep, neutral, clay.Land use is mainly annual crops on uplands and ricein valley.
Agro-ecological Unit 4.6:Attappadi extremely dry hills
This unit covers the north eastern part of Attappadihills of Palakkad district. The climate is semi-aridwith mean annual rainfall of 855.6 mm. Northeast monsoon contributes most of the rain. Soilmoisture is adequate for crop growth only for threeand half months from mid September to end ofDecember.
Dry period is eight and half months. The hills aremostly covered with dry decidous forests and thornybushes. Soils arc shallow and gravelly.
Agro-ecological Unit 4.7:Wayanad central plateau
This unit comprises the central region of the Wayanadplateau. Climate is very humid to per-humid. Meananimal rainfall is 2659 mm. Soil moisture is adequatefrom mid April to mid January. Dry period is threemonths. Soils are deep, acidic, clay loam. Uplands aremostly under plantations of coconut, coffee and tea.Extensive valley lands arc cultivated to rice andbanana.
Agro-ecological Unit 4.8:Wayanad eastern plateau
This unit comprises the eastern part of Wayanadplateau. Climate is moist to dry sub-humid with meanannual rainfall of 1394 mm. Soil moisture is adequatefrom start of May to end of December . Dry period isfour months.
Soils of the unit are deep, neutral to alkaline,clay. Swell-shrink black soils occur to some extentin the unit. The land use besides forest is mainlyannual crops. Valleys are cultivated to rice andbanana.
AGRO-ECOLOGICAL ZONE 4: HIGH HILLS
Annual Report 2009-10
Research Achievements
154
This zone comprises the plains of Palakkad in the gapregion of Western Ghats. Two distinct agro-ecologicalunits were delineated based on the length of dry period.
Agro-ecological Unit 5.1:Palakkad central plain
The unit covers the central part of Palakkad plainscomprising Kuzhalmannam, Alathur, and Palakkadtaluks, and parts of Malampuzha and Kollengodetaluks.The climate is moist sub-humid to sightly humid.The mean annual rainfall is 1971 mm. Soil moisture isadequate from June to end of December. However, abreak in soil moisture availability occurs from midAugust to end of September. Dry period is six and halfmonths. Soils arc deep, moderately acid, clay and clayloam. Uplands arc cultivated to coconut and valleys
rice. Extensive irrigation facilities ensure double cropof rice in most parts.
Agro-ecological Unit 5.2:Palakkad eastern plains
This unit covers the eastern dry region of the district.The climate is dry sub-humid. Mean annual rainfall is1339.5 mm. Soil moisture is adequate from mid Juneto end of December. However, there is a break in soilmoisture availability, from mid August to mid October.Dry period is seven and half months.
The soils are deep, neutral to alkaline, clay. Swell-shrink black soils are extensive in the unit. Land use isannual crops like sugarcane, jowar, maize, rice,groundnut and vegetables. Mango and coconutplantations are also extensive.
Fig. 2.11t.2. Agro-ecological units of Thiruvananthapuram district
AGRO-ECOLOGICAL ZONE 5: PALAKKAD PLAINS
N
�
THIRUVANANTHAPURAM DISTRICTAGRO-ECOLOGICAL UNITS
Externally Funded Projects
Annual Report2009-10 155
2.11u. Rain and flood damage to soilresources and crops in northKarnataka districts [During theperiod from 29.09.09 to 3.10.09]
Collaborator: NBSS & LUP, Regional Centre,Bangalore – A. Natarajan CSWR&TI,Bellary Centre – A. Raizada, R.N.Adhikari,S.L. Patil Director of Water Management,Bhubaneshwar – A. Rajan
ICAR has constituted a committee to assess the flooddamage in Karnataka during the period from 29.09.09to 3.10.09. Team comprising of above scientiststraversed the flood affected areas of the state and areport was prepared and submitted to the council. Thereport was presented to the Department of Agricultureand Co-operation on 14.1.10. The salient observationsalong with the amelioration measures suggested for theaffected areas are given below.
Out of the total geographical area of 19.1 m.ha inKarnataka, about 10.8 m.ha in northern districts ofthe state has been affected by the heavy downpour andunprecedented floods that occurred between the lastweek of September and first week of October 2009.This has caused severe damage to the naturalendowments in 13 districts of Northern Karnataka,particularly in Raichur, Bijapur, Bellary, Gulbarga,Bagalkot, Koppal, Gadag and Belgaum districts.
Rainfall distribution in September and October, 2009
The total amount of rainfall received in short periodfrom 29.09.09 to 03.10.09 (less than a week’s time)has no parallel in the recent past. In just about fivedays time, this region has received about 70 per centof the total annual rainfall of this area.
Fig. 2.11u.1. Rainfall in flood affected districts of Karnataka(from 29.09.09 to 03.10.09)
Sudden heavy downpour has caused severe damage tosoils, crops and infrastructure facilities in the catchmentand command areas of Krishna and Thunga bhadrarivers, the two major river systems of the state, andtheir tributries. Out of the 13 districts affected, theseverity of damage was more in Raichur, Bijapur,Bellary, Gulbarga, Bagalkot, Koppal, Gadag andBelgaum districts. The crop loss, occured in around 22lakh ha (DES, Govt. of Karnataka), which is more inBijapur, Gulbarga, Belgaum, Raichur, Haveri andDavanagere districts.
In addition to the excess rainfall received in thecatchment areas of Krishna and Tungabhadra riversand their tributaries, the other factors responsible forthe large scale devastation are:
• Nature of the soil, predominantly of fine textured,erosion prone black soils
• Poor infiltration (in black soils) and consequenthigh surface runoff
• Longer slope lengths, which accelerates the rate oferosion
• Improper soil and water conservation measuresfollowed/adopted in the catchment and command areas
• Encroachment and cultivation in river beds andstream and water courses
• Thick growth of prosophis sp. (Bellary jali) in thestream courses/riverbeds/banks and consequentblockage of the stream flow
• Lack of drainage facilities in the command areas,particularly in the Thunga Bhadra command areas,and consequent waterlogging
All the above factors resulted in very high flow inhundreds of small streams and seasonal rivers, causingheavy floods with severe damage to the standing cropsand siltation in water ways.
Fig. 2.11u.2. Rill and gully erosion in black soils nearKalmali village, Raichur district
Annual Report 2009-10
Research Achievements
156
Fig. 2.11u.3. Severe gully erosion (60 cm depth) atKalmali village, Raichur District
Fig. 2.11u.4. Sand deposition along the Hagari river
Fig. 2.11u.5. Sand deposition along Dhoni river nearTallakote, Bijapur district
Fig 2.11u.7. Abandoned paddy fields (salt affected) nearAlbanur village, Sindhanoor taluk, Bellary District
Fig. 2.11u.6. Removal of salts by floods in salinity patches
Externally Funded Projects
Annual Report2009-10 157
Amelioration measures suggested for catchment area
1. Proper soil and water conservation measures needto be adopted in this region.
2. Deep and wide gullies need to be plugged.
3. In red soil, deep rills and gully is commonlyobserved, need proper soil conservation measures.
4. Treatment of the whole catchment area withcomprehensive soil and water conservationmeasures to reduce the severity of erosion.
5. Identification of priority areas for treatment atvillage/watershed level, preparation of acomprehensive treatment plan based on soil-sitecharacteristics and monitoring their implementationwill go a long way in reducing the impact of soilerosion.
The measures to minimize further crop loss and yieldreduction in flood affected areas
• Drain out excess water from the stagnated fields,to save the standing crops and to facilitate rabisowing wherever possible.
• Harrowing to level or fill up minor depressions inthe rainfed upland areas, particularly in the blacksoils, to facilitate timely sowing of sorghum, bengalgram and sunflower in the rabi season.
• Deep ploughing and incorporation of lodged/withered crops that have wilted in the field due tofloods and excess rainfall and to mix the sand andsilt with the clayey soil.
• Removal of excess sand deposits along the rivercourses and spreading them in the adjoining fieldshaving heavy clay texture.
• Repairing and strengthening of the field bunds,wherever they are breached
Measures for areas affected by river bank erosion
To prevent further stream bank erosion the followingshort and long term measures are suggested.
• Identification of critical areas along majortributaries
• Construction of wired guided banks and gabionstructures along critical points
• Construction of embankments and loose boulderstructures at weak points and turns of streams andrivulets
• Establishment of erosion resistant species likebamboos along the banks of small rivers
• Removal of Prosopis juliflora thickets and otherthistles, which are obstructing the natural flow ofwater in streams, rivulets and seasonal rivers
Restoration of the original river beds specially in thelow lying areas
FARMS SURVEYEDDetailed Soil Survey of Coffee Research Sub-station-Chattalli, North Kodagu, Karnataka
Detailed field investigation of Coffee Research Station(CRSS), Chattalli in Coorg district was surveyed bystudying 14 profiles covering an area of 120 ha areaand identified 4 series (3 series in uplands and 1 seriesin lowland) and mapped into 10 mapping units. Twomonoliths one from CRSS, Chattalli and another fromTEC Gonikoppa were collected and displayed. The soilsamples from master profiles and 38 fertility sampleswere collected for laboratory investigation. A sum ofRs. 66,000 has been generated as reenue to the Institute.
2.11v. Assessment and mapping of someimportant soil parameters includingmacro & micro nutrients at block levelof Dumka, Jamtara and Hazaribaghdistricts for optimum land use plan
A.K. Sahoo, Dipak Sarkar, S.K. Singh,T. Banerjee and D.C. Nayak
Block level nutrient mapping has been initiated atDumka, Jamtara and Hazaribagh districts of Jharkhandin collaboration with Birsa Agriculture University,Ranchi, and Jharkhand. Conceptual model for theproject is given in flow chart (Fig. 2.11v.1). The projectaims at addressing the problems of low productivity ofprevailing rice-wheat, maize-wheat, maize-mustard andpulses-wheat cropping sequences.
Fig. 2.11v.1. Flow chart for block level nutrient mapping
Annual Report 2009-10
Education and Training
158
3.1 Post Graduate Education in LandResource Management (LRM)
A post graduate teaching and research programme isbeing conducted by the National Bureau of Soil Surveyand Land Use Planning Nagpur in collaboration withDr. Panjabrao Deshmukh Krishi Vidyapeeth (Dr.PDKV), Akola since 1987. Subsequently, this activitywas introduced at Regional Centre, Kolkata incollaboration with BCKV, Mohanpur in 1999; atRegional Centre, Bangalore with UAS, Bangalore in2002 and at Udaipur with RAU, Udaipur in 2004. Thescientists of Regional Centre, Jorhat are participating
Education and Trainingas visiting faculty of Department of Soil Science, AAU,Jorhat.
At the HQrs, Nagpur, this programme is coordinatedby the Division of Land Use Planning, NBSS&LUP,Nagpur. The programme witnessed two majordevelopments, namely, signing of revised memorandumof understanding (MOU) between the two institutionsand revision of course curricula of both M.Sc. and Ph.D.progammes.
The programme has two major components.
• Teaching• Research
Achievements Nagpur Bangalore Kolkata Udaipur Total
Degree awarded up to 2008-09 103 17 - - - - - - - -
On Roll 6 03 - - - - - - - -
3.1a HQrs. Nagpur
3.1a (i) Post Graduate Teaching
Courses offered for M.Sc. programme : The following courses are offered at NBSS&LUP, Nagpur
Course No. Title Credit Course Leader & Associates
SSAC-517 Introduction to Land Resource Management (2+0) Course Leader : Dr. T.K. SenAssociates : Dr. Jagdish Prasad
Dr. B.P. BhaskarDr. N.G. PatilDr. T.N. HajareDr. P. Chandran
SSAC-518 Land Evaluation (2+1) Course Leader : Dr. A.K. MajiAssociates : Dr. Jagdish Prasad
Dr. D.K. MandaDr. S. ChatterjiDr. S.N. Goswami
cont...
Education and Training
Annual Report2009-10 159
Course No. Title Credit Course Leader & Associates
SSAC-519 Techniques in Land Resource Management (1+1) Course Leader : Dr. Jagdish PrasadAssociates : Dr. R. Srivastava
Dr. D.K. MandalDr. S.K. RayDr. N.G. Patil
SSAC-505 Seminar (0+1) Course Leader : Dr. S. ChatterjiAssociates : Dr. S.K. Ray
Dr. M.S.S. Nagaraju
Courses offered for Ph.D.
SSAC-802 Advanced Soil Genesis (2+0) Course Leader : Dr. D.K. PalAssociates : Dr. Sohan Lal
Dr. T. BhattacharyyaDr. S.K. RayDr. P. Chandran
SSAC -805 Visual and digital interpretation Techniques (2+1) Course Leader : Dr. A.K. Majiin Soil Mapping Associates : Dr. R. Srivastava
Dr. M.S.S. Nagaraju
SSAC -806 Geo-information and Land Information (2+1) Course Leader : Dr. A.K. MajiTechnique Associates : Dr. A. Chaturvedi
Dr. (Mrs.) C. Mandal
SSAC -810 Advance Soil Mineralogy (2+1) Course Leader : Dr. D.K. PalAssociates : Dr. T. Bhattacharyya
Dr. P. ChandranDr. S.K. Ray
SSAC -890 Seminar (0+1) Course Leader : Dr. S. ChatterjiAssociates : Dr. S.K. Ray
Dr. M.S.S. Nagaraju
3.1a (ii) Research
M.Sc. Programme
The following M.Sc. (LRM) students were admitted in 2007 at Dr. PDKV, Akola and later joined NBSS&LUP inSept. 2008 for their specialized course in LRM and have completed their courses and have submitted their theses.
S. No. Name of student Name of Chairman Thesis Title
1. Ms. Chetna K. Likhar Dr. Jagdish Prasad Characterization and productivity assessment of someorange growing soils developed on different parentmaterials in Nagpur district, Maharashtra.
2. Ms. Deepali V. Balbudhe Dr. T. Bhattacharyya Some paddy growing soils of eastern Vidarbha :their genesis, mineralogy and classification.
3. Ms. Vrushali V. Deshmukh Dr. S.K. Ray Determination of layer charge after removal ofhydroxy-interlayers in some shrink-swell soil clays ofMaharashtra.
4. Mr. Amol Gaikwad Dr. T.K. Sen Soil-landscape relationship in Bhandara district,Maharashtra.
Annual Report 2009-10
Education and Training
160
The following M.Sc. (LRM) students were admitted in 2008 at Dr. PDKV, Akola who later joined NBSS&LUP inJuly, 2009 for their specialized courses in LRM. They have completed their course work and are, at present,engaged in research work for their theses. Names of the students and their guides are mentioned below alongwith the thesis title.
S. No. Name of student Name of Guide Thesis Title
1. Mr. Ninad S. Wagh Dr. D.K. Mandal Characterization of soils and agro-climate of sunflowergrowing areas in eastern Vidarbha.
2. Mr. Ganesh H. Bamble Dr. M.S.S. Nagaraju Characterization and evaluation of land resources inSaraswati Watershed of Buldhana district ofMaharashtra.
3. Ms. Nilima S. Sadashiv Dr. S. Chatterji Application of crop model for quantification of yieldgap of cotton in Wardha district of Maharashtra.
4. Ms. Ashwini H. Kolhe Dr. P. Chandran Characteristics and genesis of red, swell-shrink soilsof Hingoli district of Maharashtra.
Ph.D. Programme
The following students have submitted their theses.
S. No. Name of student Name of Guide Thesis Title
1. Ms. Preeti C. Solanke Dr. Rajeev Srivastava Spectral reflectance characteristics of Vertisols andassociated soils in Nagpur district of Maharashtra.
2. `Mr. R.A. Nasre Dr. A.K. Maji Land evaluation of Karanji watershed of Yavatmaldistrict, Maharashtra using remote sensing and GIStechniques.
New admission
Six students registered for M.Sc. (LRM) course duringthe 2008-09 academic session. They are currentlypursuing coursework at Dr. P.D.K.V., Akola.
The salient findings of the research work carried outby the M.Sc. (LRM) students of 2007 batch are givenbelow.
� Soil-landscape Relationship in Bhandara District,Maharashtra
Student : Mr. Amol Gaikwad
Chairman : Dr. T.K. Sen
• An attempt was made to establish soil-landscaperelationship in a transect of Bhandara district,Maharashtra. Five physiographic units namelyplateau, ridges, upper piedmont, lower piedmontand old flood plain were identified
• Morphological, physical and chemical propertiesof soils showed variation in pedogenic developmentof the soils with respect to their physiographic
position. Land use was also observed to begoverned by the soil-landscape relationship. Thesoils occurring on different physiographic unitswere Lithic Ustorthents (Plateau), Typic Haplustepts(Upper Piedmont), Vertic Haplutsepts (UpperPiedmont), Typic Haplusterts (Lower piedmont),and Fluventic Haplustepts (Flood Plain).
� Determination of layer charge after removal ofhydroryl-inter layers in some shrink-swell soil claysof Maharashtra
Student : Ms. Vrushali V. Deshmukh
Chairman : Dr. S.K. Ray
• Removal of hydroxy-interlayering by 0.25(N)EDTA solution (pH 7.0) has been very effectivefor the fine clays of Seloo and Saikhindi soils.
• The layer charge of the fine clays decreasedcompared to that of the original after removal ofhydroxy-interlayers.
• The method enabled one to estimate the actuallayer charge of fine clay smectites of Seloo and
Education and Training
Annual Report2009-10 161
Saikhindi soils of alkylammonium method, thevalue of which may otherwise be incorrect due tohinderances from hydroxy-interlayers materials.
� Paddy growing soils of eastern Vidarbha : theirgenesis, mineralogy and classification
Student : Ms. Deepali V. Balbudhe
Chairman : Dr. T.Bhattacharyya
• Similarity exists in mineral make-up in soils of thehumid part of the western Ghats and the presentstudy shows similar mode of mineral transformation(Sm�Sm/K) and soil formation in the easternVidarbha.
• The dissimilarity lies in the formation of CaCO3
in the soils of eastern Vidarbha when compared tosoils of the western Ghats (Plateau), which indicatedchange in climate and initiation of soil degradation.
� Characterization and productivity assessment ofsome orange- growing soils developed on differentparent materials in Nagpur district, Maharashtra
Student : Ms. Chetna K. Likhar
Chairman : Dr. Jagdish Prasad
• The physical and chemical properties of soils weregreatly influenced by different parent materials.
• The soils developed over basaltic/mixed alluviumalthough have deeper solum associated with higherclay but pose problem of drainage and sub-soilsodicity and these resulted in alternate bearing.Contrary to this, shallow soils provide betterdrainage owing to underlying saprolite that induceflowering (regular flowering) but low weatheringfront limit the water/nutrient availability (unlessexternally supplied) thus significantly affecting thelongevity of plants.
• The Riquier productivity index appears to bemore reliable as compared to Storie index,notwithstanding that these ratings are not inreliance with the Sys method and proposedsuitability evaluation and yield of oranges realized.
3.1b Regional Centre, Bangalore
• Four M.Sc and one Ph.D students from Dept. ofSoil Science, UAS Bangalore, are working underthe guidance of NBSS Scientists.
• Mr. Mohammed Feizian, the PhD. Scholar isworking under Dr. K.M. Nair’s supervision iscarrying out his research work on Soil Salinity and
Alkalinity in parts of Tumkur and Chitradurgadistricts, Karnataka
• Mrs. Kumari Roopa, the PhD. Scholar is workingunder Dr.A. Natarajan’s guidance was awardeddoctorate degree in 2009.
• Ms Sheela Rani and Ms. Nalina Postgraduatestudent from Department of Soil Science, GKVKis carrying out research in NBSS lab under theguidance of Dr. K. S. Anil Kumar.
3.1c Regional Centre, Kolkata
The Regional Centre, Kolkata signed a TMOU withBidhan Chandra Krishi Viswavidyalaya, Mohanpur,Dist. Nadia, West Bengal to undertake a jointcollaborative project on Post Graduate teaching underthe discipline of Soil Science and Agricultural Chemistrywith specialization in land resource management(LRM). The course is continuing with BCKV since 1999and following courses offered to M.Sc. (Ag.) students.
The Regional Centre, Kolkata undertakes a collaborativeprogramme with Bidhan Chandra Krishi Viswavidyalaya,Mohanpur, Nadia, West Bengal on Post Graduateteaching in Soil Science and Agricultural Chemistrywith specialization in land resource management (LRM).The programme is continuing with BCKV since 1999and following courses offered to M.Sc. (Ag.) students.
(a) Title of the course : Soil Genesis andClassification
Course No. : ACSS-508
Course Leader : Prof. P.K. Mukhopadhyay,BCKV
Instructor : Dr. D.C. Nayak, NBSS&LUP
Associates : Dr. Dipak Dutta, NBSS&LUP
Total Number of : 14students
Name of the : 1. Ms. Ruma Dasstudents 2. Sh. Amit Phoglosa
(b) Title of the course : Remote Sensing and itsApplication
Course No. : ACSS-754
Course Leader : Prof. S. Mallick, BCKV
Instructor : Dr. S.K. Gangopadhyay,NBSS&LUP
Associates : Prof. S.S. Sahu, BCKV
: Dr. D. S. Singh,NBSS & LUP
: Dr. D. C. Nayak,NBSS &LUP
Total Number of : 2students
Name of the : 1. Ms. Samprikta Biswasstudents 2. Sh. Subhashis Soren
3.1d Regional Centre, Udaipur
Scientists of the centre are associated with MaharanaPratap University of Agriculture and Technology,Udaipur with post graduate teaching and researchguidance to M.Sc., B.E., M.E. and Ph.D. students.
3.2 Training Organized
Summer School at Regional Centre, Bangalore
• ICAR sponsored Summer School on “LandResource Variability and its Appraisal for precisionfarming in Indian Agriculture” was organized from30th June to 20th July 2009 for the period of21 days at Regional Centre, Bangalore. In all15 participants from Maharashtra, AndhraPradesh, Kerala, Tamil Nadu and Karnataka statesattended in the winter school.
Winter School at Regional Centre, Bangalore
• ICAR sponsored Winter school on “TechnologicalAdvances in Land Resource Appraisal, Planningand Management” was organized from 21st
October to 10th November, 09. 21 participants fromGujarat, Maharashtra, Andhra Pradesh, Kerala,Tamil Nadu and Karnataka states attended in thewinter school.
Dr. Dipak Sarkar, Director on inauguration day of winterschool (21st October, 09)
Winter School at H.Qrs., Nagpur
• ICAR sponsored Winter school on “Advances inRemote Sensing, GIS and GPS Applications inWatershed Management” was organized between12th November and 2nd December, 2009. In thetraining, 17 officers from different ICAR institutesand SAU’s participated.
A view of the inaugural function
View of the valedictory function of the programme
Education and Training
Annual Report2009-10 163
Other need based trainings organized
• Organized two days training program from24-25th February 2010 to the newly recruitedAssistant Directors of Agriculture of Karnatakagovernment on Land resources of the state.
• ICAR sponsored Summer school training programon “Land resources variability and its appraisalfor precision farming in Indian Agriculture” wasorganized from 30th June to 20th July 2009. About15 participants from Assam, Uttar Pradesh, TamilNadu, Kerala, Puducherry, Karnataka and AndhraPradesh attended the training programme.
• Organized soil monolith preparation training toTechnical Assistants of Bureau from 9-18th
September 2009. Ten participants from Delhi,Jorhat, Kolkata, Udaipur and Nagpur Centres ofthe Bureau attended the training.
• Eleven newly recruited scientists and technicalofficers of NBSS&LUP had undertakenOrientation Training in Soil Survey and Mapping.They visited Regional Centres, Delhi, Udaipur andH.Qrs. at Nagpur. In all the three centres soils werestudied in typical land form area and the existingsoil-landform relationships were explained to them.
Interaction Meeting
• Scientists Interaction Meet was organized from8-12th Oct. 2009 to give orientation to have commonsurvey methodology among the scientists of Bureau.
Inauguration of Interaction Meet
Field visit at Doddaballapur, Bangalore district
3.3 Training received
The training attended by scientist/technical officers are as follows:
S. No. Name Training programme Dates Duration
1. Dr. G.P. Obi Reddy, Sr. Scientist Microwave Remote Sensing 24 Feb. to 2 weeks05 Mar. 2010
2. Dr. S. Srinivas, Sr. Scientist Recent Advances in Web Technologies for 16 Feb. to 3 weeksinformation management in Agriculture 08 Mar. 2010
3. Dr. S. Bandyopadhyay, Scientist TNT Mips 14-16 Sept. 2009 3 daysSh. P.K Dutta, T-4Sh. P.R. Gogoi, T-4Mrs. S. Chetiyar, T-3Sh. V. Mohan, T-4Sh. A. Baruah, T-1
4. Sh. Nirmal Kumar, Scientist Remote sensing and GIS technology 14 Dec. 2009 to 3 monthsSh. S.S. Sharma, T-5 and application 05 Mar. 2010Sh. V. Mohan, T-4
5. Dr. G.P. Obi Reddy, Sr. Scientist Professional training of ER-Mapper/ERDAS 5 daysSh. Sunil Meshram, T-4 imagine software
7. Sh. Sunil Meshram, T-4 Web design methodologies and Protocols 8-18 Sept. 2009 10 days
8. Dr.Manoj Kumar Mahla, T-7 Field orientation 20 Feb. 2009 to 2 weeks07 May 2009
9. Dr. S.S. Sharma, T-5 Remote sensing & GIS Technology & 14 Dec. 2009 to 12 weeksApplications organized by National Remote 05 Mar. 2010Sensing Centre, ISRO, Hyderabad
10. Mr. D.L. Oad, T-4 Preparation of Monolith 09 Sep. 2009 to 10 days18 Sep. 2009
11. Mr.N.R. Ola, T-3 Preparation of Monolith 09 Sep. 2009 to 10 days18 Sep. 2009
Interview and radio talks
• Rajendra Hedge gave a radio talk on “Significanceof world meteorological day” (23rd March 09), AIRBangalore.
S. No. Name Training programme Dates Duration
• Rajendra Hedge gave radio interview on“Composting of organic wastes for the organicfarming” (23-9-2009), AIR, Bangalore Farm andHome section.
Section and Unit
Annual Report2009-10 165
• The district and theme based atlases and districtsoil resource reports provide database on naturalresources to formulate soil and water conservationprogramme, watershed management and cropplanning.
• Pedological studies on soil genesis and mineraltransformation helps comprehending basics of soilinformation to develop model understanding forsoils of the Indo-Gangetic Plains (IGP) and BlackSoil Regions (BSR).
• Evaluation of soil-site suitability criteria for specificcrop will benefit in choosing on scientific footingand economically viable crops and croppingsystems in a given area to ensure sustainability
• To reduce the emission of CO2, carbon capture andstorage (CCS) techniques is an important option.NBSS&LUP has developed the technique to showthat soil can act as a potential medium for CCS.
• Soil, carbon and crop modelling techniques help inpreparing set of management interventions forbetter crop planning.
• Agro-ecological zoning helps in crop planningbased on growing period concept to overcome theadverse effects of drought, manifested throughintermittent dry spell and early withdrawal of rainsor delayed monsoon. This has been validated bydaily/weakly rainfall and other climatic data of fewsites.
Technology Assessedand Transferred
Annual Report 2009-10
Section and Unit
166
• Preparation of material for Directors’ Conferenceheld at Council
• Providing audio visual support during Seminars/Workshops
• Preparation of tables, charts and other displaymaterials on the activities of the Institute
• Compilation and finalization of Annual Report ofthe Institute
• Technical inputs for finalization of publicationsof the research bulletins, technical reportsetc.
Monitoring of Bureau’s research projects mentionedbelow
• On going projects (Institutional) : 62
• DST sponsored : 02
• Externally aided consultancy projects : 07
• NAIP Projects (4)
– As Consortium Lead Institute : 02
– As Consortium Partner : 02
Section and Unit
5.1a The following jobs were undertaken andaccomplished
• Monitoring day-to-day Technical/Scientific workand achievements of the Bureau
• Collection, storing and dissemination of scientificand technical information on soils to the variousinstitutes as per demand
• Maintenance of scientific/technical files,consultancy projects and QRT files
• Necessary action on various technical papers/letters received from Director
• Preparation of Bureau’s reports for DARE andICAR Annual Report
• Preparation of Quarterly target and progress report
• Monitoring of progress of research project of eachscientists (six monthly) i.e. from Jan-June 2009and July-Dec. 2009
• Preparation of scientific papers and computerizedslides for presentation by the Director at National/International Seminars and Workshops organizedby the different Scientific Societies/Institutions
5.1 TECHNICAL CELL
5.2 LIBRARY & DOCUMENTATION UNIT
Library Resources Development
• The Library & Documentation Unit procured202 documents including 54 books; and148 annual reports. The total collection of thelibrary as on 31.3.2010 was 14995 including boundjournals.
• The unit subscribes 27 foreign and 32 Indian
journals for Hqrs., besides 16 journals forRegional Centre libraries. The total collectionof bound journals as on 31.3.2010 was2927.
• During reporting period, 758 readers visited thelibrary. A total of 3440documents were issued,3735 documents were returned and 5392 documentswere consulted.
Section and Unit
Annual Report2009-10 167
Documentation Services
Current Titles Announcement Service (CTAS)
It is a fortnightly in-house publication based on receiptof current journals in the library. The content page ofall subscribed journals are photocopied and distributedto all Centres/Divisions/Sections of the Bureau; thiskeeps the scientific and technical staff abreast of thelatest information received in the library. Twenty fourissues were brought out during 2009.
Library Automation Software
Library Automation Software, SOUL (Software forUniversity Libraries) developed by UGC is being usedfor library automation work. Data input of each bookin the software is completed. Generation of Barcodelabels for each book is also completed. Computerisedissue – return service is in operation.
Marketing of Information Services
We are marketing our in-house information productviz Current Title Announcement Service (CTAS) as aneffort to consolidate, compile and distribute informationamong perspective customers.
CD-ROM Service
International bibliographic database viz, CABI, AGRIS,and AGRICOLA in CD-ROM is updated this yearalso. Tulsient CD Mirror Server has been installed andunder LAN, the CD-ROM databases are accessedthrough 10 nodes spread over two buildings of theBureau.
Following CD-ROM databases are available
• CABI Database (1972 to present)-CABI,U.K.
• AGRIS Database (1975 to present)-FAO,Rome
• AGRICOLA Database (1970 to present)- USDA,USA
• SOIL CD (1973 to present) CABI,U.K.
These databases have been extensively used by researchstaff, M.Sc., Ph.D. students and others from differentinstitutes in and around Nagpur City. The user agenciesin the country have been informed about availabilityof these databases. Search and retrieval services havebeen provided at nominal charges both hard and softcopy format.
ISBN to NBSSLUP Publications
NBSSLUP publishes wide variety of publications in theform of annual report, research/technical bulletins andthematic maps of India as well as different states.
Till date, ISBN/ISSN numbers were allocated to 146NBSS publications and copies of each of these are sentto concerned agencies for inclusion in their database.The publications were sent to prominent journals,abstracting/indexing services for review purpose inorder to facilitate wider information dissemination.
News Paper Clipping Service
The library is receiving 7 newspapers and twoperiodicals. The relevant paper clipping are broughtto the notice of the staff of the Bureau.
Centralised Services
The Unit provides centralised services like photocopyingcomb/thermal binding and lamination of documents/map sheets, etc.
Photocopying services provided to library visitors (otherthan bureau’s staff) fetched amount of Rs. 1470.00.
Library Services through LAN
• Five Computer nodes have been provided for accessto library information system from wherebibliographic searching with various query modeis available. E-Mail and Internet facilities have alsobeen provided to two computers.
• Browsing of international libraries through Internetis in full operation. Subscribed online electronicjournals and down loading was done using Internetfacility. It is planned to go into subscription of morenumber of electronic journals in the coming years.
• CD-ROM reading/writing facility has beeninstalled in the library for downloading electronicjournals, articles and access to publisher’s catalogues.
• Online agricultural statistics database “Indiastat.com”was subscribed during the period. The readersmade extensive use of this database.
On-line Portals/Journals through CeRA (NAIP)
CeRA (Consortium of e-Resources in Agriculture) isconsortium of e-journals (full text),a project underNAIP, ICAR which provides access to 123 libraries ofNational Agriculture Research System (NARS) for theyears 2008-10. The Bureau is also one of the beneficiaries
Annual Report 2009-10
Section and Unit
168
of this initiative. Presently, a total of 1342 on-line fulltext journals of following publishers are available onCeRA.
i. Springer link: It is a platform of Springer andprovides on-line access to 1314 journals ondifferent subjects published by Springer.
ii. Annual Reviews: Annual Reviews areauthoritative, analytic reviews on 34 focuseddisciplines within the Biomedical, Life Sciences,
Physical Sciences, and Social Sciences. Userscan access the full text of articles from 1990onwards.
iii. CSIRO (Australia): Australia’s CommonwealthScientific and Industrial Organization (CSIRO)provides access to full text of articles.
The above e-resources can be accessed by visiting URL:http://www.cera.jccc.in through Local AreaNetworking facility (LAN) of NBSS&LUP.
5.3 PRINTING SECTION
Technical and Scientific Publications
1. NBSS&LUP Publications 1976-2008 (updated)
Publ. No. 18
Print Order – 200 copies
Volume of work – XVII + XIV + 142 pages of textin Black & White
2. Soil Taxonomic Database of India and the States(1:250,000 scale)
Publ. No. 143
Print Order – 500 copies
Volume of work XII + 266 pages of text all in 4colours
3. Soil based Agro Technologies for LivelihoodImprovement
Publ. No. 144
Print Order – 500 copies
Volume of work XII + 44 pages of text all in 4colours
4. Soil Survey Manual
Publ. No. 146
Print Order – 500 copies
Volume of work XII + 400 pages of text all in 4colours
5. Field Guide for Soil Survey
Print Order – 500 copies
Volume of work VIII + 74pages of text all in 4colours
Annual Report
NBSS&LUP 2008-2009Print Order – 350 copiesVolume of work XVI + 184 pages of text all in 4colours
Brochure/Catalogue
1. Services Offered by NBSS & LUPPrint Order – 1000 copiesVolume of work – 12 + IV All in 4 colours
2. NBSS & LUP Publication CataloguePrint Order – 1500 copiesVolume of work –IV + 8 All in 4 colours
Map
1. Uttarakhand Soil Loss Map
2. Jharkhand Soil Loss Map
3. Orissa Soil Loss Map
Newsletter
NBSS&LUP Jan-June 2009, Print Order – 300
NBSS&LUP July-Dec. 2009, Print Order – 300
Stationery
Director’s Letterhead – A-4 – 1000 copies
Director’s Letterhead – B-5 – 1000 copies
Letterhead of Regional Centre, Kolkata for Head–500 copies
Letterhead of Regional Centre, Kolkata for AAO–500 copies
Letterhead of Regional Centre, Kolkata for Office–500 copies
Pedon Description form – Site Characteristics (newformat) – 1500 copies
Section and Unit
Annual Report2009-10 169
5.4 PUBLICATION SALE UNIT
Sale of NBSS Publications for the period from 1.4.2009 to 31.3.2010
SRM Map and Bulletin
Sr. No. Name of SRM Map+Bull. Sold Map Sold Bulletin Amount Received
1. West Bengal 4set 4bull 18000/-
2. Puducherry.& Karaikal 2set 2bull 4000/-
3. Gujarat 6set 6bull 27000/-
4. Haryana 4set 4bull 10000/-
5. Punjab 5set 5bull 12500/-
6. Tamil Nadu 4set 4bull 18000/-
7. Karnataka 4set 4bull 18000/-
8. Kerala 2set 2bull 5000/-
9. Orissa 3set 3bull 13500/-
10. Bihar 8set 8bull 36000/-
11. Rajasthan 3set 3bull 19500/-
12. Meghalaya 4set 4bull 6000/-
13. Maharashtra 13set 78000/-
Marathi version 7bull 700/-
14. Arunachal Pradesh 3set 3bull 7500/-
15. Manipur 3set 3bull 4500/-
16. Himachal Pradesh 5set 5bull 12500/-
17. Madhya Pradesh 7set 7bull 66500/-
Hindi version 6bull 600/-
18. Sikkim 2set 2bull 9000/-
19. Andaman - Nicobar 1bull 500/-
20. Jammu & Kashmir 4set 4bull 18000/-
21. Tripura 4set 4bull 14000/-
22. Assam 3set 3bull 7500/-
Nagaland 3set 3bull 4500/-
24. Uttar Pradesh 3set 3bull 19500/-
25. Andhra Pradesh 3set 3bull 19500/-
26. Lakshadweep 1bull 500/-
27. Delhi 5set 5bull 7500/-
28. Goa 2set 2bull 5000/-
29. Mizoram 3set 3bull 4500/-
30. Soil Map of India 2set 2bull 24000/-
A. Map+Bull 114 set + 115bull 4,91,800/-
Annual Report 2009-10
Section and Unit
170
Technical Bulletin: 1.4.2009 to 31.3.2010
Sr. No. Name of Research Tech. Bulletin No. of Bulletin Amount Received
1. AESR-Bull.No.35 5 set 10000/-
2. Soil Series Criteria & Norms-36 2 bull 50/-
3. Soil Climatic Database -.53 5 bull 3000/-
4. Soil Climatic Envi. in India-58 2bull 200/-
5. Soil Based Land Use Planning Series-63 1bull 100/-
6. Soil Monoliths-64 1bull 100/-
7. Madhubani-76 - -
8. Bhopal Atlas-77 - -
9. Soil Series of M.P-78 4bull 800/-
10. Soil Series of M.S-79 17bull 2550/-
11. Guna Atlas-80 - -
12. Agro-ecological assessment of soil reso.of Rajasthan-81 - -
13 Soil Erosion of M.S.-82(E.V.) 9set 3600/-
Soil Erosion of M.S.-82(M.V.) 6 bull 600/-
14. Climatic change and polygenesis in Vertisols-no.83 3 bull 150/-
49. Soil Series of Medak distt (A.P.) no.127 1bull 100/-
50. Benchmark soils of A.P.-128 6bull 600/-
51. Manual soil-site suitability-criteria for Major crops-129 16bull 3200/-
52. Land use planning of Cherrapunji-131 - -
53. Soil Series of Manipur-134 3bull 300/-
54. Land Resources of Medak dist.-791 1bull 350/-
55. Soil Reso.for land use planning Balaghat dist.M.P.-827 - -
56. Gujarat Erosion Map- - -
57. Karnataka Erosion Map - -
58. Soil Erosion of W.B. (bull)-.117 6set 1200/-
59. Soil Resource-Jalna dist-122 - -
60. Soil Series of Kerala, no.136 2bull 300/-
61. Management of Acid soils in NEH Region 1bull 75/-
62. Soil of Bhilwara no-135 - -
63. Soil Erosion Manipur (bull)-138 - -
64. Optimising Land Use of Birbhum Distt. ( W.B. ) -130 4bull 800/-
65. Land Resource Management N.B.S.S -133 6bull 1500/-
66. Soil Loss of Kerla Map - -
67. Soil Loss of Tamilnadu Map - -
68. Perspective Land Use Plan of Puducherry publl.no142 4bull 2000/-
69. Mineralogy of Benchmark Soil W.B Bull.no.139 6bull 1500/-
70. Soil Based Agro Technologies for Livelihood Improvement no.144 5bull 1000/-
71. Soil Loss of Uttarakhand - -
72. Soil Loss of Jharkhand - -
73. Soil Survey Manual publ.no. 146 - -
74. Field Guide for Soil Survey - -
B. Total 179 bull 44,655/-
C. Payment received from HRC 1,43,290/-
D. Soil Analysis Charges 94,979/-
E. Grand Total (A+B+C+D) 7,74,724/-
Sr. No. Name of Research Tech. Bulletin No. of Bulletin Amount Received
Annual Report 2009-10
Section and Unit
172
List of New Publication received during the year 2009-10
Sr. No Name of the publication Publ. No. Printed copies
1. Mineralogy of Benchmark Soil West Bengal 139 244
2. Soil Based Agro Technologies for Livelihood Improvement 144 499
3. Soil Loss of Uttarakhand - 250
4. Soil Loss of Jharkhand - 250
5. Soil Survey Manual 146 489
6. Field Guide for Soil Survey - 490
During the period from 01.04.2009 to 31.03.2010 organized two Sales and Publication Committee meeting andfixed the prices of New Publication, review the cost of old publications.
The main activities of ARIS cell are maintenance andproviding e-mail, internet facility, developing andmaintenance of Institute website and videoconferencing systems and other computer relatedwork including system management in theInstitute.
Management of Network
• Management of Internet and E-mail services.Monitoring the Server, client machine and signalof network and protect the system against viruses,trojan and spyware etc.
• Management of Institute network, server end andclient end.
• Maintenance of Internet Server, E-mail Server,Firewall Server and Cyberoam system [UnifiedThreat Management].
LAN Network
Replacement of Internet switches of server roomand old building i.e. Server Room CISCO GigabitSX-LC mini-GBIC with SC-LC fiber patch cord andHP ProCurve-1700-24 port Gigabit Switches – 3 no.and installation of one Hp ProCurve-1700 switch inRSA division. Laying of UTP Cat-6 cable 305 mtrs,Fixing of communication 6U Rack, Laying of 100 mtrs.casing & PVC pipe, network project (communicationrack), Cable Identification/Proper SMB, Fixingcable labeling at the front SMB & Jack Panel/Cabledressing.
5.5 ARIS CELL
New Connection of Internet
Five new connections to the users i.e. two each in theDivisions of Soil Resource Studies and Remote SensingApplication and one in Cartographic Unit wereprovided.
Internet Service
Provided support to different users on three aspect i.e.Antivirus & Antispam, Web & Application filter andIntrusion detection & Prevention (IDP). Configurationof Server and 50 users in the Cyberoam. Create usersof Cyberoam in the server for accessing the internetservices, creating user accounts, modification of usersaccount in the server, creating the internet accesspolicies in the server.
Management of Institute website
The staff of GIs section are also involved in designingand updating of the institute website.
Maintenance of Video conferencing system
Video Conference Unit was maintained with frequentchecks on the incoming/outgoing link. The IP basedvideo conferencing system was installed in the instituteunder the system signal receiver at ARIS cell, Videocodec and plasma panel were installed in the committeeroom. Under this system two locations can be connectedto see and hear the other end of the communicationsite.
• Dr. Dipak Sarkar, Director, NBSS & LUP, Nagpurhas been honoured with SCSI Special Award 2009for outstanding leadership on Soils andAgricultural Sciences towards Land ResourcesResearch, Mapping and Planning at national levelby Soil Conservation Society of India (SCSI), NewDelhi
• Dr. D.K. Pal, Principal Scientist & Head, has beenelected as Fellow of the National Academyof Agricultural Sciences, New Delhi in the year2010.
• Dr. Dipak Sarkar, Director, NBSS&LUP has beenelected as a Fellow of the “Indian Society ofAgricultural Chemists, Allahabad” for hismeritorious contribution towards IndianAgriculture in general and Soil Science in particular.
• Dr. S.K. Ray, Principal Scientist has been electedFellow of the Maharashtra Academy of Sciencesin the field of Agricultural Sciences in the year2009.
• Dr. A.K.Sahoo has been elected as a fellow of theInstitution of Chemists (India) during December2009.
• Dr(s). T. Bhattacahryya, D.K. Pal, A.M. Ninmje,S.K. Ray, P. Chandran, Mrs. C. Mandal, M. V.Venugopalan, A.S. Deshmukh, B. Telpande andR.R. Deshmukh received Best Poster presentationAward at the National Symposium on “ClimateChange and Rainfed Agriculture” for the posterentitled “Effect of global warming on carbonreserves in Kheri soils, Madhya Pradesh” in thethematic area “Climate Change and NaturalResources: Soil, Water and Biodiversity” atCRIDA, Hyderabad during 18-20th February,2010.
• Dr. (Mrs) Jaya N. Surya et al received Best PosterPresentation Award for the research paper entitled“Land Resources Assessment in Irrigated Agro-ecosystem for Micro Level Land Use Planning” atPlatinum Jubilee Symposium on “Soil Science forMeeting Challenges of Food, Nutritional andEnvironmental Quality” organized by IndianSociety of Soil Science, held during 22-25December, 2009 at IARI, New Delhi.
• Dr. A.K. Sahoo, Principal Scientist elected asCouncilor for 2010-2011 of Indian Society of SoilScience, New Delhi.
Awards and Recognitions
Annual Report 2009-10
Publications
176
Research papers
Balbudhe, D.V. and Bhattacharyya, T. (2009).Mineralogy and genesis of some paddy growingsoils of Eastern Vidarbha, Maharashtra. ClayResearch 28:83-109.
Bhaskar, B.P., Saxena, R.K., Vadivelu, S., Baruah, U.,Sarkar, Dipak, Raja, P. and Butte. P.S. (2009).Intricacy in classification of pine growing soilsin Shillong plateau, Meghalaya, India. SoilSurvey Horizons 50: 11-16.
Bhaskar, B.P., Baruah, U., Vadivelu, S., Raja, P. andSarkar, Dipak (2009). Pedogenesis in somesubaqueous soils of Brahmaputra valley ofAssam. Journal of Indian Society of Soil Science57:237-244.
Bhaskar, B.P., Baruah, Utpal, Vadivelu, S., Raja, P. andSarkar, Dipak (2010). Remote Sensing and GISin the Management of Wetland Resources ofMajuli Island, Assam, India, Tropical Ecology5:31-40.
Bhattacharyya, T., Ray, S.K., Pal, D.K. and Chandran,P. (2009). Mineralogy class of zeolitised Vertisols.Clay Research 28:73-82.
Bhattacharyya, T., Ray, S.K., Pal, D.K., Chandran, P.,Mandal, C. and Wani, S.P. (2009). Soil carbonstocks in India – Issues and priorities. Journal ofthe Indian Society of Soil Science 57: 461-468.
Challa, O. and Jagdish Prasad (2009). Occurrence ofrelatively acid Vertisols in Dadra Nagar &Haveli, India. Soil Survey Horizons 50: 96-97.
Chandran P., Ray, S.K., Durge, S.L. Raja, P., Nimkar,A.M., Bhattacharyya, T. and Pal, D.K. (2009).Scope of horticultural land use system in
enhancing carbon sequestration in ferruginoussoils of the semi-arid tropics, Current Science97:1039-1046.
Das, D.K., Bandyopadhyay, S., Chakraborthy, D. andSrivastava, Rajeev (2009). Application ofmodern techniques in characterization andmanagement of soil and water resources, Journalof the Indian Society of Soil Science 57: 445-460.
Ghosh, Kunal, Nayak, D.C and Ahmed, Nayan (2009).Soil organic matter. Journal of the Indian Societyof Soil Science 57:499-501.
Jagdish Prasad and Rajeev Srivastava (2010).Occurrence of red Vertisols in Central India. SoilSurvey Horizons 51:24-25.
Kashiwar, D.Y, Nagaraju, M.S.S., Srivastava, R.,Jagdish Prasad, Ramamurthy, V. and Barthwal,A.K. (2009). Characterization, evaluation andmanagement of Salai watershed in Nagpurdistrict of Maharashtra using remote sensing andGIS techniques.Agropedology 19:15-23.
Kumar, M. and Singh, S.K. (2009). Characterization,classification and evaluation of soils of Churudistrict Rajasthan. Journal of the Indian Societyof Science 57: 253-261.
Mandal, C. and Mandal, D.K. (2009). Rice soilssuitability assessment of Jagdalpur district.Indian Journal of Agricultural Sciences 79:479-81.
Mandal, D.K., Mandal C., Goswami, S.N. and Sarkar,Dipak (2009). Potential areas for diversifiedoilseed production and productivityimprovement – An Agro-eco based study. IndianJournal of Fertilisers 5: 37-40.
Publications
Publications
Annual Report2009-10 177
Martin, M.P., Lo Seen, D., Boulonne, L., Jolivet, C.,Nair, K.M., Bourgeon, G. and Arrouays, D.(2009). Optimizing pedo-transfer functions forestimating soil bulk density using boostedregressing trees. Soil Science Society AmericanJournal 73: 485-493.
Nagaraju, M.S.S., Srivastava, R., Barthwal, A.K andMaji, A.K. (2009). Characterization andEvaluation of Land Resources for Managementof Chandanpardi Watershed in Basaltic Terrainof Nagpur District of Maharashtra using RemoteSensing and GIS. Journal of Water Management17: 1-11.
Naidu, L.G.K., Srinivas, S., Nair, K.M. and Krishnan,P. (2009). Delineation of Agro-ecological andEfficient Cropping Zones in Kerala. Journal ofIndian Society of Soil Science 57 : 85-89.
Naidu, L.G.K., Srinivas, S., Subbi Reddy,G., RameshKumar, S.C. and Reddy, R.S. (2009).Identification and delineation of suitable areasfor mange, banana, citrus and cashew crops inAndhra Pradesh. Agropedology 19: 30-40.
Naidu, L.G.K., Srinivas,S. and Ramesh Kumar, S.C.(2009). Characterizing soil and climaticconstraints for sustainable forest developmentin Karnataka using remote sensing andgeographic information system. Journal ofIndian Society of Soil Science 57 : 101-108.
Niranjana K.V., Chandrakantha G., Srinivas S.,Ankegowda K.G. and Basavaraju N.G. (2009).Natural Resource Inventory of Itagi Sub-watershed Using Remote Sensing and GIStechniques. Mysore Journal of AgriculturalSciences 43: 1-7.
Pal, D. K., Bhattacharyya, T., Chandran, P., Ray, S.K.,Satyavathi, P.L.A., Durge, S.L., Raja, P. andMaurya, U.K. (2009) Vertisols (cracking claysoils) in a climosequence of Peninsular India:Evidence for Holocene climate changes,Quaternary International 209: 6-21.
Pal, D.K., Bhattacharyya, T., Srivastava, P., Chandran,P. and Ray, S.K. (2009). Soils of the Indo-Gangetic Plains: their historical perspective andmanagement. Current Science 96:1193-1202.
Pal, D.K., Dasog, G. S. and Bhattacharyya, T. (2009).Pedogenetic processes in cracking clay soils(Vertisols) in Tropical environments of India: acritique. Journal of Indian Society of Soil Science57:422-432.
Pandey, C.B., Singh, G.B., Singh, S.K. and Singh, R.K.(2010). Soil nitrogen and microbial biomassdynamics in natural forest and derivedagricultural land use in humid tropical climateof India. Plant and Soils (http://dr.doi.10.1007/S11104-010-0362-x).
Patil, N.G., Prasad, Jagdish, Srivastava, Rajeev andDhale, S.A. (2009). Estimation of water retentioncharacteristics of shrink-swell soils usingpedotransfer functions. Journal of the IndianSociety of Soil Science 57:273-279.
Patil, N.G., Rajput, G.S., Nema, R.K. and Singh, R.B.(2009). Calibration and evaluation ofpedotransfer functions to estimate availablewater capacity of seasonally impounded shrink-swell soils of central India. Achieves ofAgronomy and Soil Science (http://dr.doi10.1080/03650340903161187.
Patil, N.G., Rajput, G.S.; Singh, R.B. and Singh, (2009).Development and evaluation of pedotransferfunctions for saturated hydraulic conductivityof seasonally impounded clay soils Agropedology19:47-56.
Prasand, S. T., Biradar, C. M., Noojipady, P.,Venkateswarlu D., Li, Y., Velpuri, M. Gumma,M., Obi Reddy, G. P., Hugh, T., Xurliang, L. C.,Vithanage, J., Schull, M. A. and Dutta, R. (2009)Global Irrigated Area Map (GIAM) derived fromremote sensing for the end of the last millennium,International Journal of Remote Sensing 30:3679-3733.
Prasand, S. T., Venkateswarlu, D., Biradar, C. M., ObiReddy G. P., Noojipady, P. Gurappa, C., Velpuri,M., Gumma, M. and Li, Y. (2009). Irrigated areamaps and statistics of India using remote sensingand national statistics, Sensors 1 :50-67.
Ramamurthy, V, Naidu, L.G.K., Ramesh Kumar, S.C.,Srinivas, S. and Hegde, Rajendra (2009). Soilbased fertilizer recommendations for precisionfarming. Current Science 97:641-647.
Ramamurthy, V., and Venugopalan, M.V. (2009).Performance of Bt. cotton in Shrink-swell soilsof Central India. Indian Journal of AgriculturalSciences 79:1026-1029.
Annual Report 2009-10
Publications
178
Sah, K.D. Sarkar, Dipak, Seal, A. and Sahoo, A.K.(2009) Soil characterization and available micro-nutrients status in some acid saline soils of coastalagro-ecosystem in West Bengal. IndianAgriculturist 53: 69-74.
Sarkar, Dipak, Chaturvedi, A. and Mahapatra, S.K.(2009). New Vistas in Perspective land useplanning. Journal of Indian Society of SoilScience 57: 587-600.
Sarkar, Dipak and Haldar, Abhijit (2009). CationExchange capacity determination of soils withmethylene blue exchange, Agropedology 19:63-67.
Shalima Devi, G.M. and Anil Kumar, K.S. (2009).Characteristics of coffee-growing soils and theirorganic carbon stocks in Karnataka state.Agropedology 19: 6-14.
Sidhu, G. S. and Sharma, B. D. (2010). Diethylenetriamine-pentaacetic acid-extractable micronutrientsstatus in soil under rice-wheat system and theirrelationship with soil properties in different agro-climatic zones of Indo-Gangetic Plains of India.Soil Science and Plant Analysis 41: 29-51.
Singh, A.K. and Singh, R.S. (2009). Mustard yieldprediction based on soil site characters inUdaipur, Rajasthan. Journal of the Indian Societyof Soil Science 57: 196-201.
Singh, A.K., Singh, R.S. and Tanwar, S.P.S. (2009).Modelling soybean yield in different type of Soilsof Udaipur district, Rajasthan – A case study.Agropedology 19:57-62.
Singh, S.K., Kumar, M. and Sharma, B.K. (2009).Changes in soil properties in hot arid region ofIndia. Journal of the Indian Society of SoilScience, 57 : 24-30.
Walia, C.S., Singh, S.P., Dhankar, R.P., Ram J., Kamble,K. H. and Katiyar, D.K. (2009). Watershedcharacterization and soil resource mapping forland use planning using remote sensing and GIS.Current Science 98:176-81.
Reports/Bulletins
Anil Kumar, K.S., Ramesh Kumar, S.C., Dhanorkar,B.A., Vadivelu, S., Naidu, L.G.K. and DipakSarkar. (2009). Detailed assessment of land andsoil resources of Kuppam mandal, ChittoorDistrict, Andhra Pradesh NBSS Publ. No.1030.
Bhattacharya, T., Maurya, U.K. Ray, S.K., Chandran,P., Pal, D.K., Durge, S.L. (2008). Finalisation ofmethods and defining internal soil standards forC/N analyser. Final Project Report, January,2008 NBSS & LUP, India.
Bhattacharyya, T., Sarkar, Dipak and Pal, D.K. (Eds)(2009). Soil Survey Manual, NBSS & LUP Publ.No. 146, India, 400p.
Bhattacharyya, T., Sarkar, Dipak, Sehgal, J L.,Velaytham, M., Gajbhiye, K.S. and Nagar, A. P.,Nimkhedkar, S.S. (2009). Soil taxonomicdatabase of India and the states (1:250, 000scale), NBSS&LUP Publ. 143, 266p.
Das, T.H., Sarkar, Dipak, Chattopadhyay, T., Dutta,D., Singh, D.S., Mukhopadhyay, S., Nayak, D.C.and Banerjee, T. (2010). Soils of Puruliya district,West Bengal for optimizing Land Use. NBSSPubl.599, NBSS&LUP (ICAR), 184p.
Natarajan, A. and Sarkar, Dipak (2009). Field Guidefor soil survey. NBSSLUP Publication 71 p.
Pal, D.K., Lal, S., Bhattacharya, T., Chandran, P., Ray,S.K., Sayavathi, P.L.A., Raja, P., Maurya, U.K.,Durge, S.L. and Kamble, G.K.(2010). Pedogenicthresholds in Benchmark soils under rice-wheatcropping system in a climosequence of the Indo-Gangetic alluvial plains, Final Project Report,March, 2010, NBSS & LUP, Nagpur, India, 193p.
Ramamurthy, V. and Sarkar, Dipak (2009). Soil basedagro-technologies for livelihood improvement.NBSS publ. No. 144, NBSS&LUP, Nagpur, 44 pp.
Sarkar, Dipak, Baruah, U. and Das, T.H. (2009).Assessment and mapping of some important soilparameters including macro and micronutrientsfor optimum land use planning for West district,Tripura. NBSSLUP Publ.
Singh, A.K., Singh, R.S. and Tanwar, S.P. (2009). Rabifasalon ki unnat utpadan takanic, Khad Patrika,9: 7-16.
Interview and radio talks
• Rajendra Hedge gave a radio talk on “Significanceof world meteorological day” (23rd March 09), AIRBangalore.
• Rajendra Hedge gave radio interview on“Composting of organic wastes for the organicfarming” (23-9-2009), AIR, Bangalore Farm andHome section.
Book Chapters/Books
Bhattacharyya, T. and Chandran, P. (2009). SoilsTaxonomy Rationale. In: Soil Survey Manual(Eds. T. Bhattacharyya, Dipak Sarkar, D.K. Pal)NBSS&LUP, Publ. No. 146, India pp. 217-233.
Biradar, C. M., Prasand S. T., Noojipady, P., Y.J.Li.,Venkateswarlu D., Velpuri, M., Hugh T.,Xueliang L. C., Gumma, M. Obi Reddy P. G.,Mitchell A. S., Alankara, R. D., Gunasinghe, S.and Xiao, X. (2009). Global Map of RainfedCropland Areas (GMRCA) and Statistics usingRemote Sensing. In: Remote Sensing of GlobalCroplands for Food Security (Eds: S. T. Prasand,J. G. Lyon, T. Hugh and C.M. Biradar), Tylorand Francis Series in Remote sensingApplications (Book Series Editor: Qihao Weng),CRC Press, London, pp. 357-392.
Chakrabarti, T., Juwarkar, A.A., Nayak, D.C. and Ray,S.K. (2009). Soil pollutions and environmentalconcern. In: Soil Survey Manual (Eds. T.
Bhattacharyya, Dipak Sarkar and D.K. Pal)NBSS&LUP Publ. No. 146, India, pp. 362-382.
Challa, O., Naidu, L.G.K., Sen, T.K. and Ramamuthy,V. (2009). Application of soil survey data in landuse planning. In: Soil Survey Manual (Eds. T.Bhattacharyya, Dipak Sarkar and D.K. Pal)NBSS&LUP Publ. No. 146, India, pp. 319-327.
Das, T.H., Singh, R.S. and Gangopadhyay, S.K. (2009).Watershed characterisation for land useplanning. In: Soil Survey Manual (Eds. T.Bhattacharyya, Dipak Sarkar and D.K. Pal)NBSS&LUP Publ. No. 146, India, pp. 328-347.
Joshi, D. C., Shyampura, R.L. and Giri, J.D. (2009).Soil physiography relationship of arid region. In:Soil Survey Manual (Eds. T. Bhattacharyya,Dipak Sarkar and D.K. Pal) NBSS&LUP Publ.No. 146, India, pp. 293-299.
Mandal, C., Singh, S.R., Singh, D.S. and Lal, Tarsem(2009). Cartography and its recent trends. In:Soil Survey Manual (Eds. T. Bhattacharyya,Dipak Sarkar and D.K. Pal) NBSS&LUP Publ.No. 146, India, pp. 46-56.
Mandal, D.K. and Patil, N.G. (2009). Characterisationand classification of soils for EngineeringPurpose. In: Soil Survey Manual (Eds. T.Bhattacharyya, Dipak Sarkar and D.K. Pal)NBSS&LUP Publ. No. 146, India, pp. 159-187.
Natarajan, A., Reddy, R.S. and Sharma, J.P. (2009).Soil survey and mapping. In: Soil Survey Manual(Eds. T. Bhattacharyya, Dipak Sarkar and D.K.Pal) NBSS&LUP Publ. No. 146, India, pp. 72-82.
Obi Reddy G.P., Venkateswarlu D., Prasand S. T.,Chandrakantha, G., Biradar, C.M., Noojipady,P., Velpuri, M. and Maji A.K. (2009). Globalirrigated area Mapping (GIAM) and Statisticsusing Remote Sensing. In: Remote Sensing ofGlobal Croplands for Food Security (Eds: S.T.Prasand J. G. Lyon., T. Hugh and C.M. Biradar),Tylor and Francis Series in Remote sensingApplications (Book Series Editor: Qihao Weng),CRC Press, London, pp 139-176.
Pal, D.K., Tarafdar, J.C. and Sahoo, A.K. (2009).Analysis of soils for soil survey and mapping.In: Soil Survey Manual (Eds. T. Bhattacharyya,Dipak Sarkar and D.K. Pal) NBSS&LUP Publ.No. 146, India, pp. 83-148.
Annual Report 2009-10
Publications
180
Prasand S. T., Biradar, C. M., Noojipady, P.,Venkateswarlu D., Gumma, M., Y.J.Li., Velpuri,M. and Obi Reddy P. G. (2009). Global irrigatedarea Mapping (GIAM) and Statistics usingRemote Sensing. In: Remote Sensing of GlobalCroplands for Food Security (Eds: S.T. Prasand,J.G. Lyon, T. Hugh and C.M. Biradar), Tylorand Francis Series in Remote sensingApplications (Book Series Editor: Qihao Weng),CRC Press, London, pp 41-120.
Prasand S. Thenkabail, Chandrashekhar M. Biradar,Praveen Noojipady, Venkateswarlu Dheeravath,Manohar Velpuri, Obi Reddy P. Gangalakuntaand Xueliang L. Cai (2009). A History ofirrigated areas of the world. In: Remote Sensingof Global Croplands for Food Security (Eds:S.T. Prasand, J. G. Lyon, T. Hugh and C.M.Biradar), Tylor and Francis Series in Remotesensing Applications (Book Series Editor:Qihao Weng), CRC Press, London,pp 14-40.
Pratap Narain and S.K.Singh (2009). TechnologicalAdvancement in Arid Production System forProductivity Enhancement. In: NaturalResources Management for SustainableDevelopment in Western India (Eds. Prasad etal. 2009). Allied Publishers Pvt. Limited.
Ramamurthy,V., Patil, N.G. and Dipak Sarkar. (2010).Impact of water harvesting structure on wateravailability-A case study of Kokarda watershedof Nagpur district, Maharashtra. In : Rainwaterharvesting and reuse through fram ponds:Experiences, issues and strategies. (Eds. K.V.Rao, B. Venkateswarlu, K.L. Sahrawath, S.P.Wani, P.K.Mishra, S.Dixit, K.Srinivas Reddy,Manoranjan Kumar and U. S. Saikia). Publishedby CRIDA, Hyderabad. Pp. 77-81.
Ramesh Kumar, S.C., Reddy, R.S. and Naidu, L.G.K.(2009). Comparison of Conventional andImproved methods of Soil Survey – an EconomicAnalysis. In: Soil Survey Manual (Eds. T.Bhattacharyya, Dipak Sarkar and D.K. Pal)NBSS&LUP Publ. No. 146, India, pp. 392-400.
Ravisankar, T. and Srivastava, Rajeev (2009) SatelliteImagery- their Interpretation and Applications.In: Soil Survey Manual (Eds. T. Bhattacharyya,Dipak Sarkar and D.K. Pal) NBSS&LUP Publ.No. 146, India, pp. 59-71.
Sarkar, Dipak (2009). Soil Survey Manual – its needs.In: Soil Survey Manual (Eds. T. Bhattacharyya,Dipak Sarkar and D.K. Pal) NBSS&LUP Publ.No. 146, India, pp.3-4.
Sarkar, Dipak and Deshpande, S.B. (2009). Reviewof soil survey in India. In: Soil Survey Manual(Eds. T. Bhattacharyya, Dipak Sarkar andD.K. Pal) NBSS& LUP Publ. No. 146, India, pp.5-16.
Sarkar, Dipak, Chatterjee, S. and Das, K. (2009).Preparation of soil survey report. In: Soil SurveyManual (Eds. T. Bhattacharyya, Dipak Sarkarand D.K. Pal) NBSS&LUP Publ. No. 146, India,pp. 383-390.
Sarkar, Dipak and Haldar, Abhijit (2010). Physicaland Chemical Methods in Soil Analysis, 2ndEdition, Newage International (P) Ltd.,Publishers, New Delhi.
Sarkar, Dipak and Haldar, Abhijit (2009). Recyclingand utilization of wastes towards optimisticagricultural production and environmentalproduction. In : Environmental challenges of the21st Century (Eds. S.D. Banik and S.K. Basu)A.P.H. Publishing Corporation, New Delhi,pp.140-164.
Saxena, R.K, Baruah, U. and Mandal, D.K. (2009).Soil physiography relationship – case study fromHimalayan Region. In: Soil Survey Manual (Eds.T. Bhattacharyya, Dipak Sarkar, and D.K. Pal).NBSS&LUP Publ. No.146, p.243-256.
Sidhu, G.S., Yadav, R.P. and Sharma, J.P. (2009) Soilerosion status in Himachal Pradesh for land useplanning. Published in Conservation Farming,Post Publication of 2nd International Conference(Eds. Suraj Bhan, R. L. Karale, ShamsherSingh,V. K. Bharti and J.S. Bali). Publishedby Soil Conservation Society of India, pp 259-268.
Singh, A.K. and Singh, R.S. (2009). Soil suitability forcrop productivity. Agrotech Publishing Academy.190 pp.
Singh, S.K. and Tarafdar, J.C. (2009). Soil qualitymanagement in arid region of India. In :Fundamentals and management of Soil Quality(Eds. Ramesh Chandra and Satish Kumar)Westville Publishing House New Delhi, pp-183-206.
Publications
Annual Report2009-10 181
Sinha, A.K. and Nair, K.M. (2009). Digital processingof soil survey information. In :Soil SurveyManual. (Eds. T. Bhattacharyya, Dipak Sarkar,and D.K. Pal). NBSS&LUP Publication No 146,PP 188-201.
Sohan Lal and Jagdish Prasad (2009). Soil Correlation.In: Soil Survey Manual (Eds. T. Bhattacharyya,Dipak Sarkar and D.K. Pal) NBSS&LUP Publ.No. 146, India, pp. 234-242.
Thayalan, S. and Dasog, G.S. (2009). Land form-soilrelationship in black and ferruginous soil region.In: Soil Survey Manual (Eds. T. Bhattacharyya,Dipak Sarkar and D.K. Pal) NBSS&LUP Publ.No. 146, India, pp. 277-292.
Velayutham, M. and Bhattacharyya, T. (2009). Soils,In: Handbook of Agriculture, Indian Council ofAgricultural Research, New Delhi pp. 181-233.
Walia, C.S. and Singh, S.P. (2009). Soil-physiographyrelationship in Indo-Gangetic plain. In: SoilSurvey Manual (Eds. T. Bhattacharyya, DipakSarkar and D.K. Pal) NBSS&LUP Publ. No. 146,India, pp. 258-276.
Lecture delivered
• Dr. Dipak Sarkar, Director attended and deliveredinvited lecture on Soil and Land Use InteractionScenario for Livelihood Security in Tripura inconnection with one day seminar on Soil NutrientStatus for Efficient Soil Health Management inTripura on 21st August, 2009.
• Dr. Dipak Sarkar, Director attended and deliveredinvited lecture on Soil Resource Inventory forFuture Land Use Planning in connection with BrainStorming Session on Natural ResourceManagement: Lesson Learnt and Task Aheadorganized by Kolkata Chapter of the Indian Societyof Soil Science held at NBSS & LUP (ICAR),Regional Centre, Kolkata on September 7, 2009.
• Dr. Dipak Sarkar, Director attended and deliveredinvited lecture on Management of NaturalResources towards Optimising AgriculturalProduction (M.N. De Memorial Lecture) inconnection with 42nd Annual Convention of theIndian Society of Agricultural Chemist organizedby Department of Agricultural Chemistry and SoilScience, Bidhan Chandra Krishi Viswavidyalaya,Mohanpur, Nadia during November 27-28th,2009.
• Dr. Dipak Sarkar, Director attended and deliveredinvited lecture on Alternate Land Use Planning inthe Changing Scenario of Climate andDemography in connection with Platinum JubileeCelebration of Indian Society of Soil Science during22-25th December, 2009 at New Delhi.
• Dr. Dipak Sarkar, Director attended and deliveredinvited lecture on Soil Resource Inventory for LandUse Planning in connection with State LevelSeminar on Soil Resource Management forSustainable Soil Health and Food Securityorganized by Akola Chapter of Indian Society ofSoil Science, Dr. Panjabrao Deshmukh KrishiVidyapeeth, Akola, Maharashtra. during January2-3, 2010.
• Dr. Dipak Sarkar, Director attended and deliveredinvited lecture on Land Degradation and its Impacton Agriculture in connection with Shri VasantraoNaik Memorial National Agriculture Seminar onSoil Security for Sustainable Agriculture at Collegeof Agriculture, Nagpur, Maharashtra duringFebruary 27-28, 2010.
• Dr. C.S. Walia, Principal Scientist delivered lectureon “Spectural Reflectance Characteristics andSpectral Library of Indian Soils” and “RemoteSensing Application in soil survey” to the M.Sc.students Geographic Information Science &Technology, Centre of Excellence for NaturalResources Data Management System ofUttarakhand, Kumaon University, SSJ Campus,Almora during 9-10 Nov. 2009.
• Dr. G.S. Sidhu, Principal Scientist delivered alecture on “Natural resource data for land useplanning at different levels by using latesttechniques” at PAU, Ludhiana on 13th October2010.
• Dr. Ashok Kumar, Scientist delivered a lecture onWeed Control in Seed Crops (in Hindi) duringfarmers’ training conducted by Seed ProductionUnit, IARI, New Delhi on 30th March, 2010.
• Dr. S.K. Singh Principal Scientist and Head,Regional Centre, Kolkata delivered a lecture on“Soil nutrient mapping as a tool for fertilizermanagement” in Winter School in the Institute ofAgricultural Sciences BHU Varanasi on 13th Jan.2010.
• Dr. A.K. Sahoo, Principal Scientist delivered alecture on “Watershed: Its concepts, characteristics
Annual Report 2009-10
Publications
182
and management on 13th Jan. 2010 during theWinter School in the Institute of AgriculturalScience, BHU, Varanasi.
• Dr. L.G.K. Naidu delivered a lecture on soil siterequirements for fish farming in CauveryCommand area in Mandya district during a oneday Workshop on ‘Fish farming in Saline/SodicSoils’ held at Mandya on 26th August 2009.
• Dr. A.K. Maji delivered a lecture on “LandEvaluation and Decision Support Systems” inWorkshop on Remote Sensing and GIS techniquesfor Decision Support in Agriculture held on 18th
June, 2009 at IASRI, New Delhi.
• Dr. G.P. Obi Reddy delivered lecture onMorphometric analysis in watersheds in ICARsponsored Winter School on Advances in RemoteSensing, GIS and GPS Application in watershedmanagement on 12th Nov. to 2nd Dec. 2009.
• Dr. G.P. Obi Reddy delivered an invited lecture on“Morphometric analysis at watershed scales” inTutorials of ISRS Annual Convention and NationalSymposium on “Advances in geospatialtechnologies with special emphasis on sustainablerainfed Agriculture” held on 15th –16th October,2009 at RRSSC, Nagpur.
• Obi Reddy, G.P. delivered invited lecture on “GISbased agro-informatics in precisely characterizedland use systems and their dynamics in farm scaleand heterogeneous landscape” in 2nd NationalConference on Agro informatics and PrecisionFarming” at UAS, Raichur from 2nd to 3rd
December, 2009.
• Dr. A. K. Maji delivered an invited lecture on “LandInformation System” in Tutorials of ISRS AnnualConvention and National Symposium on“Advances in geospatial technologies with specialemphasis on sustainable rainfed Agriculture” heldon 15th –16th, October, 2009 at RRSSC, Nagpur.
• Dr. D.S. Singh, Dr. Rajeev Srivastava, Dr. J.D. Giriand Dr. M.S.S. Nagaraju delivered lectures andconducted practicals in Remote Sensing and GISin the ICAR sponsored Winter School (12th
November to 2nd December, 2009) held atNBSS&LUP, Nagpur.
• Dr. T.H. Das, Principal Scientist, Dr. S.K. Reza andDr. S. Bondyopadhyay, Scientist attended training/interaction meet on “Detailed soil survey andmapping” held at Bangalore Centre from 8th to 12th
October, 2009.
Seminar/Symposia abstracts/Conferencepapers
Platinum Jubilee Symposium on Soil Science forMeeting Challenges of Food Security, Nutritional andEnvironmental Quality organized by Indian Societyof Soil Science, at IARI, New Delhi during 22-25December 2009
Ahmed, Nayan, Walia, C.S., Datta, S.C. and Sharma,R.K. (2009). Pedogenic Progression of soilsdeveloped on different parent materials inKhumaun Himalayas. Abstracts p 8.
Bhattacharyya, T. and Mandal, B. (2009). SoilsInformation System of the Indo-Gangetic Plainsfor resource management.
Deshmukh, V.V., Ray, S.K., Chandran, P.,Bhattacharyya, T. and Pal, D.K. (2009).Hydroxy-interlayering in soil clay smectites: Anindicator of climate change.
Gangopadhyay, S.K. and Sahoo, A.K. (2009). Soils ofKitajhuri micro-watershed under Subarnarekhacatchments West Bengal for land use planning.
Kadupitiya, H.K., Sahoo, R.N., Gupta, V.K., Ahmed,N., Ray, S.S., Surya, J.N. and Sidhu, G.S. (2009)Estimation of Soil Parameters: A Hyper spectralRemote Sensing Approach. Abstracts p44.
Karthikeyan, K., Chandrasekar, K., Pushpanjali andSarkar, D. (2009). Studies on LULC analysis ofdifferent agro-ecological regions of Tamil Nadu :A GIS approach.
Mandal, D.K. and Mandal, C. (2009). Agro-ecologicalsub regions for increased oilseed production.
Nayak, D.C., Das, K. and Singh, S.K. (2009). Potassiumavailability of red and lateritic soils of WestBengal in relation to mineralogy.
Raja, P., Maurya, U.K., Ray, S.K., Chandran, P.,Bhattacharyya, T. and Pal, D.K. (2009). Claypedofeatures as indicator of neotectonic stressin the soils of Indo-Gangetic Plains. (Abstract).
Sahoo, A.K., Sarkar Dipak, Gangopadhyay, S.K. andButte, P.S. (2009). Soils of Lohardaga district ofJharkhand-their characteristics, potentials andlimitations.
Srivastava, Pushpanjali, Kartikeyan, K. and Sarkar, Dipak.Harmonization of LULC Map: A geospatialapproach.
Publications
Annual Report2009-10 183
Surya N. Jaya, Singh, S.P. and Jat R.S. (2009). LandResource Assessment in Irrigated Agro-ecosystemfor Micro Level Land Use Planning. Abstracts p130.
Walia, C.S, Surya, J.N. Dhankar, R.P. Sharma, J.P.,Singh, Harjit and Soni, K.M. (2009). Watershedcharacterization using remote sensing and GIS inKumaun Himalayas for land use. Abstracts p31.
National Symposium on ‘Advanced GeospatialTechnologies with Special emphasis on SustainableRainfed Agriculture’ and Annual Convention ofISRS held at RRSSC, Nagpur from 17-19th September,2009
Ardak Shweta A., Nagaraju, M.S.S., Srivastava, R.,Jagdish Prasad, Maji, A.K. and Barthwal, A.K.(2009) Characterization and Evaluation of LandResources in Khapri Village of Nagpur District,Maharashtra using High Resolution SatelliteData and GIS. .
Bante R. R., Srivastava, R., Nagaraju, M.S.S., JagdishPrasad, Maji, A.K. and Barthwal, A.K. (2009).Utility of remote sensing and GIS in characteri-zation and evaluation of land resources in Tarodawatershed of Nagpur District of Maharashtra.
Maji, A.K. (2009). GIS based Assessment of wastelands/degraded lands of northeastern region of India.Abstracts pp.75-76.
Obi Reddy, G.P. (2009). Satellite remote sensing andGIS applications in terrain characterization forlandform and soil resource mapping in semi-aridecosystem of central India. Abstracts, pp. 71.
National Conference on ‘Frontier in Plant Physiologytowards Sustainable Agriculture’ held at AssamAgricultural University, Jorhat from October 5-7, 2009.
Baruah, U. (2009). Soil Survey for Optimum Land UsePlanning
VIIIth Global Conference on Environmental EducationPanjim, Goa. November 4-8, 2009.
Bhaskar, B.P., Sarkar, Dipak and Baruah, Utpal (2009).Inventory and assessment of wetland resourcefor sustainable agriculture in Majuli Island,Assam, India. Abstracts, pp.22.
International Conference on Nurturing Arid Zones forPeople and the Environment: Issues and Agenda forthe 21st century CAZRI, Jodhpur, Nov. 24-28
(2009). Identifying systems for carbon sequestrationand increased productivity in semi-arid tropicalenvironments.
Singh, A.K., Singh, R.S. and Shyampura, R.L. 2009.Deficit irrigation scheduling in wheat crop undervarying types of soils in Udaipur (Rajasthan).
Singh, R.S., Singh, A.K., Tailor, B.L. Rameshwar Singhand R. L. Shyampura. (2009). Land Use-soil parametersrelationship in Bundi district of Rajasthan.
National Symposium on Climate Change and RainfedAgriculture at CRIDA, Hyderabad during 18-20th
February, 2010
Bhattacharyya, T., Pal, D.K., Deshmukh, A.S.,Deshmukh R.R., Ray, S.K. ,Chandran, P.,Mandal, C., and Telpande B. (2010) RothCModel-its evaluation for soil carbon reserve inselected long term fertilizer experimental sites.(extended summary) pp. 316-318.
Bhattacharyya, T., Pal, D.K., Nimje, A.M., Ray, S.K.,Chandran, P., Mandal, C., Venugopalan, M.V.,Deshmukh, A.S., Telpande B. and DeshmukhR.R. (2010) Effect of global warming on carbonreserves in Kheri soils, Madhya Pradesh,(extended summary)
97th Indian Science Congress, Kerala University,Thiruvananthpuram India on 3-7 Jan. 2010.Agriculture and Forestry Sciences Section
Das, K. and Singh, S.K. (2009) Potassium dynamics ofsome soils of dry sub-humid agro-ecozone ofWest Bengal.
International symposium on “Carbon management andclimate change and role of applied geochemistry inmineral exploration.” November 25 to 27, 2009
Raja, P., Bhaskar, B.P., Malpe, D., Anantwar, S.G. andTapaswi. P.M. (2009). Geochemistry of saltaffected soils in Purna valley, Maharashtra, India:Their paleoclimatic implication. Abstracts pp.50.
National Workshop on Rainwater Harvesting andReuse through farm Ponds, held at CRIDA, Hyderabadduring 21-22 April, 2009
Ramamurthy, V. Patil, N.G. and Sarkar, Dipak (2009)Impact of water harvesting structure on wateravailability – A case study of Kokarda watershed,Nagpur district of Maharashtra.
Annual Report 2009-10
Participation of Scientists in Conferences, Meetings, Workshops, Symposia etc. in India and abroad
184
Workshops/Seminar/Symposia attended
National Seminar on Challenges and opportunities ofBio-Industrial wasteland development for prosperityof the farming community organized by SoilConservation Society of India and Watersheddevelopment department, Govt. of Karnataka, 25-27June 2009.
• Dr. L.G.K. Naidu
• Dr. A. Natarajan
• Dr. V. Ramamurthy
National workshop cum Brainstorming session on“Rainwater harvesting and Reuse through FarmPonds: experience, issues and strategies” at CRIDA,Hyderabad from 21-22nd April, 2009
• Dr. V. Ramamurthy
One day Workshop on ‘Fish farming in Saline/SodicSoils’ held at Mandya on 26th August 2009
• Dr. L.G.K. Naidu
International Conference on nurturing arid zones forpeople and the environment: issues and agenda for the21st century to be held at CAZRI, Jodhpur duringNovember 24-28, 2009.
• Dr. R.S. Shyampura
• Dr. D.K. Pal
• Dr. T. Bhattacharyya
• Dr. R.S. Singh
• Dr. A.K. Singh
National Seminar on Geospatial Technologies forDefence Operations at New Delhi during 23-25 June,2009.
• Dr. J.P. Sharma
• Dr. D. Martin
National Symposium on ‘Advanced GeospatialTechnologies with Special emphasis on SustainableRainfed Agriculture’ and Annual Convention of ISRSheld at Nagpur from 17-19th September, 2009.
• Dr. A.K. Maji
• Dr. R. Srivastav
• Dr. M.S.S. Nagaraju
• Dr. G.P. Obi Reddy
• Sh. A.K. Barthwal
Launching Workshop and 1st Consortium AdvisoryCommittee (CAC) meeting of the NAIP Project‘Development of spectral reflectance methods and lowcost sensors for real-time application of variable rateinputs in precision farming’ held on 4th August 2009at PAU, Ludhiana.
• Dr. Rajeev Srivastava
Paper presented in the Agriculture and ForestrySciences Section of 97th Indian Science Congress atKerala University, Thiruvananthpuram India on 3-7January 2010.
• Dr. S.K. Singh
• Dr. S.K. Mahapatra
• Dr. K. Das
• Dr. T. Bhattacharyya
National Seminar on “Wealth from Waste” organizedby National Environmental Science Academy, KolkataChapter at Bose Institute Auditorium duringSeptember 5-6th, 2009.
• Dr. A. K. Sahoo
• Dr. K. Das
Participation ofScientists in Conferences, Meetings,
Workshops, Symposia etc. in India and abroad
Participation of Scientists in Conferences, Meetings, Workshops, Symposia etc. in India and abroad
Annual Report2009-10 185
Platinum Jubilee Symposium and 74th AnnualConvention, 2009 of the Indian Society of Soil Science,New Delhi at IARI, New Delhi during 22nd -25th
December, 2009.
Dr. Dipak Sarkar Dr. T. Bhattacharyya
Dr. D.K. Pal Dr. T.H. Das
Dr. J.P. Sharma Dr. D.C. Nayak
Dr. S.K. Singh Dr. A.K. Sahoo
Dr. R.L. Shyampura Dr. S.K. Gangopadhyay
Dr. S. Chatterji Dr. S.K. Ray
Dr. Mrs. Jaya Surya N. Dr. Jagdish Prasad
Dr. G.S. Sidhu Dr. S.C. Rameshkumar
Dr. C.S. Walia Dr. K. Karthikeyan
Dr. S.K. Mahapatra Mrs. Pushpanjali
Dr. D.K. Mandal Dr. N.C. Khandare
Dr. K. Das Sh. S.S. Nimkhedkar
Dr. A.P. Nagar Dr. P. Raja
National Symposium on Climate Change and RainfedAgriculture for the poster at CRIDA, Hyderabadduring 18-20th February, 2010
• Dr. D.K. Pal
• Dr. T. Bhattacharyya
VIIIth Global conference on Environmental Education.Panjim, Goa. November 4-8, 2009
• Dr. B.P. Bhaskar
International symposium on “Carbon managementand climate change and role of applied geochemistryin mineral exploration.” November 25 to 27, 2009.
• Dr. P. Raja
National Conference on ‘Frontier in Plant Physiologytowards Sustainable Agriculture’ held at AssamAgricultural University, Jorhat from 5th to 7th October,2009.
• Dr. Utpal Baruah
2nd National Conference on Agro informatics andPrecision Farming” at UAS, Raichur from 2nd to 3rd
December, 2009.
• Dr. G.P. Obi Reddy
ISRS Annual Convention and National Symposiumon “Advances in geospatial technologies with specialemphasis on sustainable rainfed Agriculture” held on15th –16th, October, 2009 at RRSSC, Nagpur
• Dr. A. K. Maji
• Dr. G.P. Obi Reddy
Meetings Attended
Launching Workshop of NAIP Project entitled “Geo-referenced soil information system for land useplanning and monitoring soil and land quality foragriculture” (Component 4) at H.Qrs., Nagpur during08.05.2009 (F/N) and 09.05.2009 (A/N)
• Dr. D.S. Singh
• Dr. D. C. Nayak
• Dr. A.K. Sahoo
Planning Commission Team meeting on 16-12-09 atNational Bureau of Agriculturally Important Insects(NBAII), Bangalore
• Dr. L.G.K. Naidu
NSDI-9 workshop on “G-Governance” at Pune from21st to 25th Dec. 2009
• Dr. A.K. Maji
• Dr. G.P. Obi Reddy
First NDEM Nodal Officers meeting as arepresentative from NBSS&LUP at New Delhi on 15th
October 2009
• Dr. G.P. Obi Reddy
National Workshop for the Sensitization of ARISIncharges about the websites at NBPGR, New Delhion 19th March 2010
• Dr. G.P. Obi Reddy
Remote sensing in soil resource mapping at differentscales – an overview in User Interaction Workshop-2010 at NRSC, Hyderabad from 2nd to 5th Feb. 2010
• Dr. G.P. Obi Reddy
Launching Workshop and 1st Consortium AdvisoryCommittee (CAC) meeting of the NAIP Project‘Development of spectral reflectance methods and lowcost sensors for real-time application of variable rateinputs in precision farming’ held on 4th August 2009at PAU, Ludhiana
• Dr. Rajeev Srivastava
Meeting at Department of Agriculture (Govt. ofKarnataka state) on “National Mission on soil healthand soil fertility” on 25-1-2010
• Dr. L G K Naidu
• Dr. Rajendra Hegde
Annual Report 2009-10
Participation of Scientists in Conferences, Meetings, Workshops, Symposia etc. in India and abroad
186
Meeting with the officials of the State Department ofAgriculture Govt. of West Bengal for the execution offield work in the project “Soil nutrient mapping ofthe state of West Bengal” with reference to PurbaMedinipur district organized by Deptt. of Agriculture,Govt. of West Bengal at Principal Agricultural Office,Purba Medinipur on 20th May, 2009
• Dr. D. C. Nayak
• Dr. A. K. Sahoo
Meeting with the officials of the State Department ofAgriculture Govt. of West Bengal for implementationof project “Soil nutrient mapping of the state of WestBengal” with reference to Purba and PaschimMedinipur districts organized by Deptt. of Agriculture,
Govt. of West Bengal at Principal Agricultural Office,Paschim Medinipur on 10th November, 2009
• Dr. S.K. Singh
• Dr. D. C. Nayak
• Dr. A. K. Sahoo
Meeting with the state officials for execution of theproject entitled “Development of District Level LandUse Plan for Nadia District in West Bengal underIrrigated Ecosystem” organized by Dy. Director ofAgriculture, Nadia district at Principal AgriculturalOffice, Krishnanagar, Nadia on 10th February, 2010.
• Dr. A. K. Sahoo
• Mrs. T. Banerjee
Approved On-going Projects
Annual Report2009-10 187
1. Assessment of land resources for growinghorticultural crops in selected districts for TamilNadu under the National Horticultural Missionproject
A. Natarajan, V. Ramamurthy, S. Thayalan, S.Srinivas, K.V. Niranjana, M. Ramesh, D.H.Venkatesh, S. Vadivelu
2. Land resource inventory for farm planning indifferent agro-ecological regions of India
A. Natarajan, Jaya N. Surya, R.S. Meena, S.Dharumarajan, Pushpanjali, P. Nideesh
3. Agro-ecological zoning of Tamil Nadu
A.Natarajan, S. Srinivas, V. Ramamurthy, S.Thayalan
4. Agro-ecological units of KeralaModified title :Agro-Ecological units of 14 districts of Kerala
L.G.K. Naidu, K.M. Nair, Champa Mandal, A.Chaturvedi, S. Thayalay, S.C. Ramesh Kumar, V.Ramamurthy, K.S. Anil Kumar, S. Srinivas
5. Development of alternate laboratory techniques forspeedier routine soil analysis for soil surveylaboratories
7. Detailed assessment of land and soil resources of aKuppam Mandal in Chittoor district of AndhraPradesh
K.S. Anil Kumar, S.C. Ramesh Kumar, B.A.Dhanorkar
8. Land resource inventory for farm planning inChikarsinkere Hobli, Maddur Taluk. MandyaDistrict, Karnataka – a subproject of the mainproject Land resource inventory for farm planningin different agro-ecological regions of India
R.S. Meena, S. Thayalan, A. Natarajan, S.C.Ramesh Kumar, V. Ramamurty, S. Srinivas
9. Development of software modules for landevaluation and agro-climatic analysis
S. Srinivas, K.M. Nair, L.G.K. Naidu, R. Hegde,V. Ramamurthy, D.S. Venkatesh
10. Assessment of land and soil resources ofMalappuram district (part) of Kerala at 1:50,000scale for land use planning
Anil Kumar, K.S., K.M. Nair, R. Hegde, S.C.Ramesh Kumar, S. Srinivas, S. Thayalan, L.G.K.Naidu
11. Identification and characterisation of Benchmarksoils of Bihar and Orissa for agro-technologytransfer
Dipak Sarkar, T. Chattopadhyay, D.C. Nayak,A.K. Sahoo, K.D. Sah,
12. Assessment and mapping of some important soilparameters including macro and micro nutrientsfor the state of West Bengal (1:50,000 scale)towards optimum land use planing
Dipak Sarkar, K. Das, A.K. Sahoo, D.S. Singh,D.C. Nayak, S. Mukhopadhyay, M. Swamiathan
13. Soil resource inventory and land evaluation ofAurangabad district, Bihar (1:50,000 scale) forland use planning
S.K. Gangopadhyay, D.S. Singh, K. Das,S. Mukhopadhyay, U.K. Maurya, D. Sarkar
ApprovedOn-going Projects
Annual Report 2009-10
Approved On-going Projects
188
14. Natural resource assessment using RS & GIS-a casestudy in Badajorenala Microwatershed in UtkalPlain of Orissa
K. Das, S.K. Singh, T. Banerjee, S. Dharumarajan
15. Land resource inventory for farm planning inChinsurah-Mogra and Polba-Dadpur Block, HugliDistrict, West Bengal
S. Dharumarajan, K.D. Sah, Tapati Banerjee, S.K.Singh
16. Geomorphometric and hydrological evaluation ofmicro watershed in Chhotnagarpur plateau, WestBengal for sustainable utilization of soil and waterresources
Tapati Banjeree, S.K. Singh, K. Das, S. Dharumarajan
17. Soil resource inventory and land evaluation ofRohtas district, Bihar (1:50,000 scale) for land useplanning
T. Chattopadhyay, A.K. Sahoo, S. Mukhopadhyay,M. Swaminathan, Dipak Sarkar
18. Soil based approach towards rational land use planusing remote sensing and GIS
S. Mukhopadhyay, Tapti Banerjee, Dipak Sarkar
19. Land use planning at block level in two agro-ecological subregions of West Bengal
D.C. Nayak, D. Dutta, Dipak Sarkar
20. Effect of different land uses on total soil organiccarbon (SOC) and its active pools in humid to perhumid ecoregion of West Bengal
D. Dutta, D.C. Nayak, Dipak Sarkar
21. Land resource inventory of Mawmaram micro-watershed of East Khasi Hills district, Meghalaya
S. Bandyopadhyay, S.K. Reza, Ashok Kumar,U. Baruah
22. Reconnaissance soil survey of Bhareli river basin,Assam and Arunachal Pradesh for Land UsePlanning
T.H. Das, U. Baruah, D.P. Dutta, A.C. Kalita
23. Assessment and mapping of some important soilparameters including macro and micro nutrientsfor the sixteen (16) priority districts of Assam state(1:50,000 scale) towards optimum land use planning
U. Baruah, T.H. Das, A. Kumar, S.K. Reza, R.S.Meena, two scientists for RC, Kolkata, one scientistfrom SRS Divn. HQrs., Nagpur
24. Correlation of soil series of North-Eastern States(Arunachal Pradesh, Assam, Manipur, Meghalaya,Mizoram, Nagaland and Tripura)
U. Baruah, T.H. Das., S.K. Reza, S. Bandyopadhyay
25. Soil resource mapping of Sultanpur district (U.P.)for perspective land use planning
32. Land resource inventory of Phod Disong MarpnaMicrowatershed of East Khasi Hills District,Meghalaya
S.K. Reza, S. Bandyopadhyay, Ashok Kumar, U.Baruah
33. Assessment of heavy metal pollution and itsmapping in soils of contaminated areas of Morigaon,Dibrugarh and Tinsukia districts of Assam
S.K. Reza, S.K. Ray, U. Baruah
Approved On-going Projects
Annual Report2009-10 189
34. Soil resource mapping of Kamrup district (1:50,000scale) of Assam for land use planning
T.H. Das, U. Baruah
35. Agro-ecological units map of Madhya Pradesh andChhatisgarh state (on 1:1 m scale) SRM data base
D.B. Tamgadge, K.S. Gajbhiye, Dr. (Mrs) C.Mandal, W.V. Bankar
36. Reconnaissance soil survey, mapping andclassification of soils of Jabalpur district, MadhyaPradesh
J. Prasad and S.R. Singh
37. Estimating saturated hydraulic conductivity andbulk density of the Vertisols and Vertic Intergradesfrom Published Research and Soil Survey Data
N.G. Patil, C. Mandal, D.K. Mandal, D.K. Pal
38. Progressive reconnaissance, soil survey, mapping,soil-correlation and classification of a hot-moistand semi-arid subregion of Yavatmal district,Maharashtra
B.P. Bhaskar, S.R. Singh
39. Characterization and evaluation of carbon (SOC)& sulphur status in soybean growing areas of Dhardistrict, Madhya Pradesh to suggest an alternativecropping pattern
K. Karthikeyan, J. Prasad, Pushpanjali, S.R. Singh,D. Sarkar
40. Soil resource inventory and land evaluation ofChittaurgarh district for land use planning
T.P. Verma/J.D. Giri, R.L. Shyampura
41. Land resource inventory for farm planning indifferent agro-ecological regions of India
T.P. Verma, R.L. Shaympura, R.S. Singh, A.K.Singh
42. Development of district land use plan for Nagaurand Bundi districts (Rajasthan) under arid andsemi-arid ecosystem
R.S. Singh, A.K. Singh, R.L. Shyampura
43. Soils, land use and perspective land use planningof Nagpur district
A. Chaturvedi, Mrs. C. Mandal, Rajeev Srivastava,D.K. Mandal, T.N. Hajare, S.N. Goswami, N.C.Khandare, R.S. Gawande
44. Development of a soil water balance model forshrink-swell soils of Central India
Pramod Tiwary, D.K. Mandal, M. Vemnugopalan,T.N. Hajare
45. Integrated approach of remote sensing and GIS inland resources characterization, evaluation andmapping in Saraswati watershed in Buldhanadistrict of Maharashtra
M.S.S. Nagaraju, R. Srivastava, A.K. Maji, A.K.Barthwal
46. Land use/land cover dynamics in differentgeomorphological settings of Chandrapur district,Maharashtra for sustainable land resourcemanagement
S. Thayalan, A. Chaturvedi
47. Interfluve stratigraphy, sedimentology andgeochemistry of the central and southern GangaPlains (DST-ESS Project)
D. K. Pal, T. Bhattacharyya, P. Chandran, S.K.Ray, P.L.A. Satyavathi, P. Raja, S.L. Durge
48. Predicting soil carbon changes under differentcropping systems in soils of selected Benchmarkspots in different bioclimatic systems in India (DSTsponsored project)
T. Bhattacharyya, S.K. Ray, P. Chandran, D.K. Pal,Mrs. C. Mandal
49. Changes in soil carbon reserve as influenced bydifferent ecosystems and land use in India (ICARNetwork Project on Climate Change)
T. Bhattacharyya, P. Chandran, D.K. Pal, S.K. Ray,C. Mandal, D. Sarkar
50. Assessment of Quality and Resilience of soils inDiverse agro-ecosystems (NAIP)
T. Bhattacharyya, D. Sarkar, P. Chandran, S.K.Ray, Mrs. C. Mandal, D.K. Pal, ResearchAssociates
51. Genesis and classification of Benchmarkferruginous soils of India
P. Chandran, S.K. Ray, T. Bhattacharyya, D.K. Pal,Pankaj Srivastava, P.N. Dubey, K.S. Gajbhiye, P.Krishnan, D. Sarkar
Annual Report 2009-10
Approved On-going Projects
190
52. Detailed soil resource survey of Hayatnagar farmof CRIDA, Hyderabad
P. Chandran, S.K. Ray, P. Raja, S.L. Durge, A.M.Nimkar, D.K. Pal, T. Bhattacharyya, C. Mandal,M.S.S. Nagaraju, D. Sarkar
53. Development of protocols for digestion, standardsand methods to determine elements in soil andsediments using Inductively Coupled PlasmaSpectrometry (ICP-AES)
S.K. Ray, P. Raja, P. Chandran, T. Bhattacharyya,P.L.A. Satyavathi, D.K. Pal
54. Human resource development in remote sensingand GIS in natural resource management –NNRMS (ISRO) & NBSSLUP collaborativeproject
A.K. Maji, A. Chaturvedi, G.P. Obi Reddy
55. Multi criteria based decision making for landevaluation and land use planning at district level
A.K. Maji
56. Digital maps of derived soil quality maps of statesand of India
A.K. Maji, G.P.Obireddy, Heads RCs
57. Building of an expert system for land use planningat state/AEZ level
A.K. Maji, N.D.R. Krishna, C.V. Srinivas
58. Development of GIS based seamless mosaic ofSRTM elevation data for India to analyze andcharacterize the selected geomorphometricparameters (NBSS&LUP and RRSSCCollaborative Project)
G.P. Obi Reddy, A.K. Maji, R. Srivastava, S.N. Das
59. Enrichment of land degradation datasets with soilsdatasets of different states of India (Inter-Institutional Collaborative project betweenNBSS&LUP-NRSC)
G.P. Obi Reddy, T. Ravisankar, G.S. Sidhu, A.K.Sahoo, K.S. Anil Kumar, Siladitya Bandyopadhyay,NRSC : T. Ravisankar, K. Srinivas, G. Sujatha,M.A. Fyzee
60. Soil resource atlas of Chhatisgarh state
A.K. Maji, D.B. Tamgadge, C.V. Srinivas, G.P. ObiReddy
61. Spatial assessment of soil erosion of different statesof India using grid point data in GIS
A.K. Maji, C.V. Srinivas, G.P. Obi Reddy
62. Documentation and storing maps and photographs– concept of digital map library
C. Mandal, Pushpanjali, D.K. Mandal, J. Prasad,R. Srivastava, T. Bhattacharyya, D. Sarkar
63. Land resource inventory for farm level planningin Parseoni Mandal of Parseoni Taluk, Nagpurdistrict, Maharashtra
Pushpanjali, K. Karthikeyan, C. Mandal, J. Prasad,J.D. Giri, Malathi Bommidi
NATIONAL NETWORK PROJECT OF LAND USEPLANNING
National Network project on District Level LandUse Planning under Different Agro-ecosystems ofthe Country
D. Sarkar
64. Development of district level land use plan forNadia district in west Bengal under IrrigatedEcosystem
A.K. Sahoo
65. Development of district level land use plan forPuruliya district in West Bengal under rainfedecosystem
PI : D.C. Nayak, D. Sarkar, D.S. Singh and S.K.Singh, D.C. Nayak, D. Dutta, S. Mukhopadhyay
66. Development of district level land use planning forJorhat district, Assam under rainfed eco-system
D. Sarkar, U. Baruah, Siladitya Bandyopadhyay,S.K. Reza, U. Baruah
67. Development of district level land use plan for EastKhasi Hill district in Meghalaya under hill andmountain ecosystem
S.Bandyopadhyay (PI), D. Sarkar, U. Baruah, S.K.Reza (Sub-Project Leader), S. Bandyopadhyay
68. Development of district level land use plan forNagaur district (Rajasthan) under arid ecosystem
A.K. Singh (PI), D. Sarkar, A.K. Singh, R.L.Shyampura
Approved On-going Projects
Annual Report2009-10 191
69. Assessment of stakeholder needs and economicevaluation of land use types for land use planningof Mysore and North Goa Districts
S.C. Ramesh Kumar, V. Ramamurthy, RajendraHegde
70. Development of district level land use plan forMysore district, Karnataka state
V. Ramamurthy, K.M. Nair, S.C. Ramesh Kumar,S. Srinivas, L.G.K. Naidu, S. Thayalan
71. Development of district level land use plan forShahjahanpur district in Uttar Pradesh underIrrigated Ecosystem
Dharam Singh, S.K. Mahapatra, Jaya N. Surya,Ashok Kumar
72. Development of district level land use plan forAlmora district in Uttarakhand under hill andmountain ecosystem
S.K. Mahapatra, Jaya N. Surya, Dharam Singh,Ashok Kumar
CORRELATION OF SOIL SERIES OF INDIA
73. Correlation of soil series of Eastern States (Bihar,Jharkhand, Orissa, Sikkim, A&N Islands and WestBengal)
A.K. Sahoo, D.C. Nayak, K. Das,S.K.Gangopadhyay, K.D. Sah, D. Dutta, T.Chattopachyay, S. Mukhopadhyay, T. Banerjee
74. Correlation of soil series of India and theirplacement in the National Register Western States(Gujarat & Rajasthan)
R.L. Shyampura, R.S. Singh, A.K. Singh,Nideesh, P.
75. Correlation of soil series of India and theirplaceme3nt in the National Register : SouthernStates (Karnataka, Kerala, Tamil Nadu, AndhraPradesh, Goa, Puducherry and Lakshadweep)
L.G.K. Naidu, A. Natarajan, K.M. Nair, K.S. AnilKumar, R.S. Meena
Annual Report 2009-10
Research Achievements
192
• Assessment and mapping of some importantparameters including macro and micro nutrientsfor the state of West Bengal (1:50,000 scale)towards optimum land use plan.
• Assessment and mapping of important soilparameters including macro and micronutrients forthe state of Assam (1:50,000 scale) towards rationalland use planning
Dissemination of soil information/services to useragencies
• Land resource information of Prakasam district,Andhra Pradesh was given to Associate Directorof Research, Lam, NARP zone of ANGRAU.
• Soil information of Ramanagaram and MagadiTaluks of Ramanagaram district of Karnataka wasprovided to Ph.D. Scholar from Tata EnergyResearch Institute, Delhi for planning sustainablewater resources development
• Soil Testing Services provided to
� National Bureau of Agriculturally ImportantInsects (formerly PDBC), Bangalore.
� Jamanalal Bajaj Seva Ashram, Trust, Bangalore.
� Pest Control of India, Bangalore
• Provided three success stories information(Azolla cultivation, Velvet bean cultivation, andcoconut mite menace management) to Dr.Meenakshi Srinivas, Principal Scientist, IIHR forNAIP project on mobilizing and sharing massmedia support.
• Soil information pertaining to high powertransmission lines across Tumkur, Tiptur,Madhugiri, Koratagere, Sira and Pavgada taluksof Tumkur district was provided to Executiveengineer, Karnataka Power Transmission Limited,Tumkur
• 52 Agricultural Divisional atlases belonging toKadapa, Mahabubnagar, Chittoor, Prakasam,Nalgonda and Anantapur districts of A.P. weresupplied to Roshni Bio Tech Pvt. Ltd, Hyderabadfor planning pongamia plantations (Bio-fuel) inmarginal lands.
Soil Macromonoliths preparation and establishmentof soil museum
• Four soil monoliths for Kerala Forest ResearchInstitute (KFRI), Peechi were prepared for their soilmuseum.
Consultancy, Patents,Commercialisation of Technology
Approved On-going Projects
Annual Report2009-10 193
S. No. Name of meeting No. of meeting Date Venue
1. Institute Management Committee 1 26th October 2009 Kolkata
2. Institute Research Council (IRC) 1 10th to 12th August 2009 NagpurMeeting of the Bureau
3. Institute Joint Council 2 29th April 2009 Udaipur28th October 2009 Jorhat
4. Heads of Regional Centres, 1 22nd January 2010 NagpurDivisions and Sections
Meetings
Annual Report194 2009-10
Research Achievements
A. Workshop• Hosted Brain Storming Session on “Natural
Resource Management: Lesson Learnt and TaskAhead” in collaboration with Indian Society of SoilScience Kolkata Chapter on September 7 -2009.
• First Hindi Karyashala on ‘Takniki Karyon MeinHindi avum computer ka Prayog” was organizedat Regional Centre, Delhi on 11th September, 2009for Technical and Field Assistants
• Second Hindi Karyashala on “Rajbhasha Neetiavam Karyanvayan” was organized at HQrs.,Nagpur on 12th September, 2009 for the staff ofAdministration Section
• Third Hindi Karyashala on “Hindi MeinVayagyanik Lekhan” was organized at RegionalCentre, Delhi on for the scientists
• Fourth Hindi Karyashala on “RajbhashaKaryanvayan Ke Anupalan” was organized atRegional Centre, Delhi
• Scientists Interaction Meet was organized atRegional Centre, Bangalore during October 8-12,2009 to give orientation to have common surveymethodology among the scientists of Bureau.Organized 2 field traversing trips for theparticipants for studying profiles at Doddaballapur,Bangalore (Rural district) and Maddur, Mandyadistrict in Karnataka.
• A meeting on Optimal Land Use and WaterResource Management & Pulse Production inCentral India with special reference to VidarbhaRegion was held on 22 and 23 Feb 2010 under theChairmanship of Dr. K. Kasturirangan, Member(Science), Planning Commission and with otherhigh officials viz. Dr. Saumitra Chaudhary,Member, Planning Commission, Dr. V.V. Sadamate,Advisor (Agri) and Dr. Vandana Dwivedi, Jt.Advisors (Agri), Planning Commission, Directorsand representatives from different NRM Institutesof ICAR. This important meeting was conceivedbased on the opinions and views expressed in manymeetings on “Land use and water management”as a key issue to discuss in detail. On waterresources, the institutes like CRIDA, CWS andVice-Chancellors from different universities ofMaharashtra had given brief note on the subject.A review on pulse production system in India withspecial reference to Vidarbha region of Maharashtraand adjoining areas was also presented.
Dr. K. Kasturirangan and Dr. Saumitra Chaudhery,Members, Planning Commission, Dr. Dipak Sarkar, Director,
NBSS&LUP, Dr. V.V. Sadamate, Advisor (Agri.), PlanningCommission, Dr. V.M. Mayande, Vice-Chancellor, Dr. PDKV,Akola and other invitees involved in the discussion related
to Optimal Land Use and Water Conservation atNBSS&LUP, Nagpur
Workshops, Seminars,Farmers’ Day and other events
Workshops, Seminars, Farmers’ Day and other events
Annual Report2009-10 195
• Dr. Dipak Sarkar, Director, Dr. Utpal Baruah,Head, and Dr. T.H. Das, Principal Scientist had ameeting with Mr. Asang Jamir, Director and otherofficials of Directorate of Soil & WaterConservation, Govt. of Nagaland, Kohima on 18th
March, 2010 regarding various issues on SoilResource Mapping towards Land Use Planning ofNagaland state and future action plan.
B. Farmers’ Day
• The Regional Centre, Jorhat participated in theKishan Mela organized at Assam AgriculturalUniversity at Titabar, Jorhat district on 3rd
November, 2009. Soil map at different levels (State/District/Watershed) as well as various Reports/Bulletins were displayed at the stall.
• Regional Centre, Delhi participated in “PUSAKRISHI VIGYAN MELA-2010” held at IARI,New Delhi, during 4-6 March 2010 and displayedvarious maps, publications & activities of theBureau besides involving in interaction withscientists, farmers and other visitors.
Participation of NBSS & LUP in Krishi Vigyan Mela at IARI,New Delhi, during 4- 6 March, 2010.
C. Other Events
• Release of Soil Nutrient Map for Bardhdhaman,Nadia, Birbhum, North 24-Parganas, Haora and
Hugli by Shri Buddhdeb Bhattacharyjee,Honourable Chief Minister of West Bengal inpresence of Shri Narendra Nath De, AgricultureMinister, West Bengal and Shri Asim Das Gupta,Finance Minister, Govt. of West Bengal on 9th
December, 2009. Dr. Dipak Sarkar, Director,NBSS&LUP, Nagpur; Dr. S. K. Singh, Head,NBSS&LUP, Regional Centre, Kolkata andScientists of the Regional Centre were also presenton the occasion.
• Dr. A.K. Singh DDG (NRM) ICAR InauguratedChildren Park and release of NBSS&LUPpublication on 7th September, 2009 in a functionat NBSS& LUP Regional Centre Kolkata.Dr. R.K. Samanta Vice Chancellor BCKVMohanpur Nadia, Dr. Dipak Sarkar DirectorNBSS&LUP Nagpur and Dr. S.K.Singh HeadNBSS&LUP Regional centre Kolkata were alsopresent on the occasion.
Annual Report196 2009-10
Research Achievements
H.Qrs. Nagpur
• Dr. K. Kasturirangan, Member, PlanningCommission, Govt. of India, New Delhi
• Dr. S. Chaudhary, Member, Planning Commission,Govt. of India, New Delhi
• Dr. V.V. Sadamate, Advisor (Agri.), PlanningCommission, Govt. of India, New Delhi
• Dr. V.M. Mayande, Vice-Chancellor, Dr. PDKV,Akola
• Dr. A.K. Singh, DDG (NRM), ICAR, New Delhi
• Dr. S.M. Virmani, Ex-Head (Soil), ICRISAT,Hyderabad
• Dr. G. Narayanaswamy, Ex-Head, Soil Science andAgril. Chemistry, IARI, New Delhi
• Dr. Kaushik Majumdar, Director, IPNI, Gurgaon
• Dr. P.K. Sharma, Director, Punjab State RemoteSensing Centre, Ludhiana
• Dr. Mruthyunjaya, Former National Director,NAIP, New Delhi
• Dr. A.K. Bandyopadhyay, National Director, NAIPComponent 4, New Delhi
• Dr. N. Panda, Chairman, CAC, NAIP Component4, New Delhi
• Dr. P.N. Takkar, Chairman, CAC, NAIPComponent 3, New Delhi
• Dr. R.P. Dhir, Member, CAC, NAIP Component4, Jodhpur
• Dr. D.K. Das, Member, CAC, NAIP Component4, New Delhi
• Dr. R.K. Samanta, Vice-Chancellor, BCKVV,Mohanpur, West Bengal
• Dr. A. Subba Rao, Director, IISS, Bhopal
• Dr. M.V. Singh, Project Coordinator, MicronutrientProject, IISS, Bhopal
• Ms. Diya Dutt, Deputy Director, SIEF, New Delhi
Regional Centre, Bangalore
• Dr. Rabindra, Director, NBAII (ICAR), Bangalore
• Dr. Rajanna, Director, Agriculture, Governmentof Karnataka
• Dr. R.S. Kulkarni, Director of Extension, UASBangalore
• Mr. K.H.Gopalakrishane Gowda, Commissionerfor Watershed Development, Govt. of Karnataka
• Dr. S.B. Dandin, Special Officer, University ofHorticulture, Bagalkote
• Dr. Edward Raja, Head, Soil science, IIHRBangalore
• Dr. Palaniappan, consultant at Zuari Agrochemicals,Bangalore
• Dr. M. Prabhakar, Principal Scientist, IIHR,Bangalore.
• Sri Shreepadre, Journalist and promoter of Rainwater Harvesting, Editor, Adike Patrike, Puttur,Karnataka
• Dr. Prakash Rao, Head, CIMAP (CSIR) Bangalore
• Dr. Shamsundar Joshi, Professor (retd), UASBangalore
• Dr. Sudhir, Professor and Head, Dept. Soil Science,UAS, GKVK, Bangalore
Distinguished Visitors
Distinguished Visitors
Annual Report2009-10 197
Regional Centre, Kolkata
• Dr. A. K. Singh, DDG (NRM), ICAR, New Delhi.
• Dr. H. S. Sen, Ex.Director, CRIJAFT, ICAR,Barrackpore.
• Prof. S. K. Sanyal, Vice Chancellor , BCKV, WestBengal.
• Prof. A. K. Das, Vice Chancellor , UBKV, WestBengal.
• Dr. Pradip Sen, Joint Director of Agriculture(Research), Govt. of West Bengal
• Dr. R. K. Samanta, Ex.Vice-Chancellor, BCKV,Mohanpur, West Bengal
• Dr. S.S.Magar, Ex.Vice Chancellor Konkan KrishiVidyapeeth Dapoli Maharastra and Member, IMC
• Dr. S.V. Sarode Director Research, Dr. PDKV,Akola and Member IMC
• Sri Basudeb Acharya Member of Parliament andParliamentary Standing Committee on Agriculture.
• Sh. Prakash Pohare, Editor, Deshonnatti MarathiNewspaper and Member IMC
Regional Centre, Delhi
• Dr. A.N. Singh, Former Director, UPRSAC andConsultant BMGF Supported STRASAProgramme, IRRI – India Office, Dr. Andy Nelson,Scientist GIS specialist, Cartograpic InformationSystem Social Sciences Division, IRRI, Los Bathos,Laguna, Phillippines visited the Regional Centre,Delhi.
• Dr. P.K. Sharma, Director Punjab Remote SensingApplication Centre, Ludhiana visited the RegionalCentre, Delhi.
• Dr. V.N. Sharda, Director, CSWCR&TI, Dehradunvisited the Regional Centre, Delhi.
• Dr. A.K. Tiwari, Principal Scientist & Head,CSWCR&TI, Regional Station, Chandigarh visitedthe Regional Centre, Delhi.
• Dr. V.K. Suri, Former Vice Chancellor, CSAUA&T,Kanpur visited the Regional Centre, Delhi.
Regional Centre, Jorhat
• Dr. B.C. Bhoumick, Acting Vice-Chancellor ofAssam Agricultural University, Jorhat
• Dr. S.V. Ngachan, Director, ICAR Complex,Barapani, Shillong.
• Dr. R. Medhi, Director, NRC Orchid, Pakyong,Sikkim.
• Mr. B.C. Sarmah, SDO, Department of Agriculture,Nagaon, Assam.
• Dr. K.Z. Ahmed, Scientist, Production Division,Tocklai Experimental Station, Jorhat
Regional Centre, Udaipur
• Dr. B.S. Chundwat, Ex V.C. Sardarkrushinagar-Dantiwada Agriculture University, Gujarat
• Dr. S.L. Mehta, Ex V.C. MPUA&T, Udaipur.
• Dr. S.S. Tomar, Professor and incharge KVK,MPUA&T, Kota.
• Dr. P.M. Jain, Director Extension, MPUA&T,Udaipur.
• Dr. S.C. Bhandari, Dean PGS, MPUA&T, Udaipur.
• Dr.P.C. Kanthalia, Head, Soil Science and Ag.Chemistry, MPUA&T, Udaipur.
• Dr.B.L. Jain, Ex Principal Scientist, RegionalCentre, NBSS&LUP, Udipur
Annual Report198 2009-10
Research Achievements
DR. DIPAK SARKARDirector
Dr. D.K. Pal : Division of Soil Resource StudiesPrincipal Scientist (Pedology) and Head
Dr. Arun Chaturvedi : Division of Land Use PlanningPrincipal Scientist (Geography) and Head
Dr. A.K. Maji : Division of Remote Sensing Applications and GISPrincipal Scientist (Pedology) and Head
Dr. L.G.K. Naidu : Regional Centre, BangalorePrincipal Scientist (Pedology) and Head
Dr. J.P. Sharma : Regional Centre, DelhiPrincipal Scientist (Pedology) and Head
Dr. Utpal Baruah : Regional Centre, JorhatPrincipal Scientist (Geography) and Head
Dr. D.S. Singh : Regional Centre, KolkataPrincipal Scientist (Geography) and Head (Acting)
(upto 13.05.2009)
Dr. S.K. SinghPrincipal Scientist (Pedology) and Head (w.e.f. 14.05.2009)
Dr. R.L. Shyampura : Regional Centre, UdaipurPrincipal Scientist (Pedology) and Head
Dr. (Mrs) C. Mandal : CartographyPrincipal Scientist (Geography) and Incharge
Dr. P. Chandran : Technical CellPrincipal Scientist (Pedology) and Incharge
Sh. G.R. Deshmukh : Library and Documentation UnitTechnical Officer(T-9) and Incharge
Dr. N.C. Khandare : Sale and Publication UnitTechnical Officer(T-9) and Incharge
Sh. S.K. Arora : Printing SectionPrinting Officer (T-9) and Incharge
Published by Dr. Dipak Sarkar, Director, NBSS&LUP, Nagpur & Printed by Sh. S.K. Arora, In-charge Printing, NBSS&LUP, New Delhiat National Printers, New Delhi-110 028