i NCAT Report 17-05 DEMONSTRATION PROJECT FOR ENHANCED DURABILITY OF ASPHALT PAVEMENTS THROUGH INCREASED IN- PLACE PAVEMENT DENSITY By Tim Aschenbrener E. Ray Brown Nam Tran Phillip B. Blankenship July 2017
TheAmericanSocietyofCivilEngineers(ASCE)reportsthatanannualinvestmentofapproximately$35billionisneededforpreservingtheexistingconditionsofUnitedStateshighwaysandbridgesthrough2040(EconomicDevelopmentResearchGroup,2011).Basedonthisestimate,animprovementof5to25percentinpavementperformancecouldpotentiallyyieldanannualsavingsof$1.75to$8.75billion,whichcouldthenbereinvestedinthehighwaysystemtoimproveoverallcondition,safety,andcongestion. Although several factors can influence the performance of an asphalt pavement, one of themostimportantfactorsisin-placedensity(AsphaltInstitute,2007).Asmallincreaseinin-placedensity canpotentially lead to a significant increase in the service lifeof asphalt pavements.Based on studies reviewed in a previous report, a one-percent decrease in air voids wasestimatedtoimprovethefatigueperformanceofasphaltpavementsbetween8and44percentandimproveruttingresistanceby7to66percent(Tranetal.,2016).Inaddition,basedonfielddata, a one-percent decrease in air voids would extend the service life by 10 percent,conservatively.To illustrate the effect of in-place density on the life cycle cost analysis (LCCA) of asphaltpavements, an LCCA was conducted on two alternatives in which the same asphalt overlaywould be constructed to 93 percent and 92 percent (densities) of themaximum theoreticalgravity (Gmm). Using the conservative 10 percent increase in service life, the LCCA resultsrevealedthatthestatehighwayagency(SHA)wouldseeanetpresentvalue(NPV)costsavingsof$88,000ona$1,000,000pavingproject (8.8percent)by increasing theminimumrequireddensityby1percentofGmm(Tranetal.,2016).Thissavingsdoesnotconsiderothercostssuchasoperation,maintenance,androadusercosts.An increase in in-place density can beginwith improved field compaction. As Chuck Hughesstated at the 1977AssociationofAsphalt Paving Technologists (AAPT)AnnualMeeting, “Thesingle most important construction control that will provide for long-term serviceability iscompaction”(Hughes,1989).Other technology advancements and improved construction techniques can also yield thepotential to increase asphalt pavement density while improving cost effectiveness. Some ofthese advancements include warm-mix asphalt, intelligent compaction, infrared thermalimaging, and rolling density meter (for continuous density measurement). Improvedconstructiontechniques includebestpracticesforcompaction,constructionjoints,tackcoats,agency specifications to incentivize achieving higher in-place densities, and others. Many oftheseadvancementsarealreadybeingemployed;however,inmanyinstances,standardsforin-place density have remained unchanged. It is anticipated that by using these technologyadvancements and improved techniques, in-place density can be increased. Thus, increaseddensitytargetsleadtoimprovedasphaltmixturedurabilityandlongerpavementservicelife.
Aschenbrener,Brown,Tran,Blankenship
9
Recognizingtheimportanceof in-placedensity inbuildingcosteffectiveasphaltpavements,aFederal Highway Administration (FHWA) Demonstration Project was created for “EnhancedDurabilityofAsphaltPavementsthroughIncreasedIn-placePavementDensity.”Akeyaspectofthe demonstration project was the partnership with the National Asphalt PavementAssociation,eachSHA,andthecontractorsthatbuiltthecontrolandtestsections.
2 OBJECTIVEANDSCOPE
Overall, theobjectiveof thisdemonstrationprojectwastoachieve increased in-placeasphaltpavementdensity that resulted in improvedasphaltpavementperformance.Therewere twomajorcomponentsof thisstudy:1)a literaturesearchtoserveasaneducationalcomponentregarding the best practices for increasing density, and 2) the construction of ten fielddemonstrationprojects.Several recent advancements in technology and techniques have made increased in-placeasphaltpavementdensityachievable. Tranetal. (2016) identified the importanceof in-placedensity in building cost effective asphalt pavements. This field demonstration project wasintendedtosupportSHAsinevaluatingtheircurrentdensityrequirementsforacceptance.ThedemonstrationprojectwouldallowSHAstopartnerwiththeirpavingcontractorstotrythosetechniques that worked best for their situation and allow the FHWA to share these successstories with others. The FHWA would use the results from this demonstration project toprovideguidanceand/ormotivationtoSHAsinreviewing,updatingandimprovingtheircurrentfielddensityacceptancecriteriaforasphaltpavements.It should be recognized that although increased density can improve performance it cannotovercome all issues. For example, improvements to in-place density cannot overcomeperformanceissueswithasphaltmixturesconstructedwithhighlevelsofsegregation,moisturesusceptibleaggregates,and/orunacceptablevolumetricproperties. Increaseddensitywillnothavethesamebenefitinthesesituations.The FHWA identified ten SHAs for participation in this demonstration project through anapplication process. Successful applicants received a workshop and field assistance forconstruction.Consideration forapplicationswasgiven to thoseSHAs that couldbenefitmostfromincreasedcompactionrequirementsaswellasadistributionofSHAsinvariedgeographicandclimaticregions.Each SHA selected for the demonstration project hosted an “Enhanced Durability throughIncreasedIn-PlacePavementDensityWorkshop”developedanddeliveredjointlybytheAsphaltInstituteandFHWA.ThetargetaudiencewastheSHA,contractors,equipmentsuppliers,andacademia.Theworkshopincludedtheuseofcurrentlyrecognizedbestpracticesaswellasnewmaterialsandtechnologies.Part of the demonstration project was for each SHA and contractor to construct a fielddemonstrationprojectwithacontrolandoneormore test sections.Thecontrol sectionwasbuiltbythecontractortoachievefielddensityintheirnormalmanner.Thefirsttestsectionwas
Aschenbrener,Brown,Tran,Blankenship
10
requiredaspartoftheagreementwithFHWAandthegoalofthissectionwastouseimprovedpaving and compaction techniques to increase density. The goal was to obtain increaseddensity without having to add additional rollers or do anything else that would significantlyresult in increasedcost.For theadditional testsections, itwas left to theSHAs todeterminewhattheywantedtotry.Theygenerallyaddedadditionalrollerstoimprovedensityorappliedotherideasofinterest.ItwasimportantthattheSHAstrywhattheybelievedwouldworkbestintheir localstate.Duringthefieldconstruction,on-sitetechnicaladvicewasprovidedtotheparticipatingSHAsbystafffromtheNationalCenterforAsphaltTechnology(NCAT).
3 DEFINITIONS
Definitions for consistency of the discussion in this paper come fromThe Asphalt Handbook(2007),HotMixAsphaltMaterials,MixtureDesignandConstruction (2009), and theHot-MixAsphaltPavingHandbook(2000).
• Compaction.Compactionistheprocessbywhichtheasphaltmixtureiscompressedandreduced in volume. Compaction reduces air voids and increases the unit weight ordensityofthemixture.
• Density.Thedensityofamaterial issimplytheweightofthematerial thatoccupiesaunit volume of space. Increased density is achieved through the compaction process.Forexample,anasphaltmixturecontaininglimestoneaggregatemayhaveacompacteddensity of 147 lb/ft3 (2.36 g/cc). The density, or unit weight, is an indication of thedegree of compaction of the mixture. Pavement materials made with differentaggregatescanhavesignificantlydifferentdensities.Anasphaltmixturewithlightweightaggregate,forexample,mighthaveacompacteddensityof85lb/ft3(1.36g/cc).
• %Density.Thepercentdensityreferredtointhisreport isaphysicalmeasurementofdensity expressed as a percentage of maximum theoretical specific gravity (Gmm).Although some projects expressed the density in other manners, the density wasexpressedrelativetoGmminthisreport.
• Pass.Apassisdefinedastherollerpassingoveronepointinthematonetime.• Coverage. Coverage is defined as the roller making enough passes to cover the
• Rollingpattern.Oftenreferredtoasarollertrain,therollingpatternisagenerictermusedtoquantifythetypesandnumberofrollersandthespecificsequenceororderinwhichtheyoperate foraparticularmix type, thickness,andwidth. Insomecases, therollingpatternisreferredtoforeachindividualrollertoestablishthenumberofpassestoobtaintheoptimumdensity.Regardless,iftherollingpatternisdefinedasthetrainor an individual roller, the key is to determine and maintain consistent speed,amplitude,andfrequencyoneachpass(bothforwardsandbackwards).
• Breakdownrolling.Thebreakdownroller is the first compactor to roll the freshly laidasphaltmixture.
• Intermediate rolling. Intermediate (or secondary) rolling should closely followbreakdownrollingwhiletheasphaltmixtureisstillhotandcompactable. Intermediate
• Finishrolling.Finishrolling isconductedprimarily toremoverollermarksandprovideaesthetic improvementof thesurface,although insome instances it isstillpossibletoincreasedensity.
• Echelon rolling. In echelon rolling, two rollers are operating with one being slightlybehind the other. The two rollers are staggered and offset from each other. Withechelon rolling, the two rollersmay completeone full lane-widthof coverageas theyeachcompleteonepass.
4 BACKGROUNDANDLITERATURESEARCH
Thelong-termperformanceandlifecyclecostofasphaltpavementscanbeimprovedifhigherin-placedensityisachievedinacost-effectivemanner.Thischaptersummarizeskeyfindingsofa literature searchconducted todocument thebestpracticesandnew technologies that canhelpachievedensity. Someof this informationwaspresented to theSHAsby theFHWAandAsphalt Institute as part of the “Enhanced Durability through Increased In-Place PavementDensityWorkshop”priortofielddemonstrationprojectconstruction.
4.1 MixDesignandFieldVerification
4.1.1 GradationType
Aggregates are required to meet the specifications for hardness, soundness, durability,angularity, andgradation foruse in asphaltmixtures.Among theseproperties, the gradationplaysanimportantroleinthecompactabilityofanasphaltmixture.Whilesomestateagenciesmaystillusecoarse-gradedSuperpave(i.e.,SuperiorPerformingAsphaltPavements)mixturesforimprovingruttingresistance,researchresultsattheWestrackexperiment(Eppsetal.,2002)andattheNCATTestTrack(Timmetal.,2006)showedthatfine-gradedSuperpavemixturesareeasiertocompact, lesspronetosegregation,and lesspermeablewhileperformingaswellascoarse-graded Superpavemixtures under heavy traffic. Based on these findings, many stateagencieshaveallowedtheuseofmorefine-gradedmixdesigns.
4.1.2 NominalMaximumAggregateSize(NMAS)
In addition to the selected gradation type (i.e. fine-graded versus coarse-graded gradations),therelationshipbetweenNMASandliftthicknessisalsoimportantforcompactabilityofasphaltmixtures. Based on studies by Moutier (1982) and further analysis by Zeinali et al. (2014),compactioneffectiveness forasphaltmixtures couldbe improvedby increasing lift thickness.Brownetal.(2004)recommendedthattheminimumliftthicknessbeaminimumofthreeandfourtimestheNMASforfineandcoarsedense-gradedmixes,respectively,toprovidesufficientthickness for the aggregate particles to re-orient and pack together during the compactionprocess.ThisiscommonlyreferredtoastheminimumliftthicknesstoNMAS(t/NMAS).
Aschenbrener,Brown,Tran,Blankenship
12
4.1.3 AsphaltMixtureDesign
Most SHAs currently use the Superpavemixture designmethod as documented in AmericanAssociation of State Highway and Transportation Officials (AASHTO) R 35, “SuperpaveVolumetric Design for Asphalt Mixtures,” and AASHTO M 323, “Superpave Volumetric MixDesign.” When the Superpave mixture design method was implemented, one of the majorchangesfromthepriormixdesignmethodsistheuseoftheSuperpavegyratorycompactorfordensifying mixes in the laboratory. In the volumetric mixture design, the optimum asphaltcontentisselectedfordesiredairvoids.Thequalityofasphaltmixturesinsituiscontrolledbyverifyingthequalityofconstituentmaterials,volumetricproperties,andin-placedensity.SHAshave asphalt mixture design specification requirements to ensure that satisfactory qualitymaterialsareusedandproperlycombinedtomeetspecificvolumetricrequirements.After implementingtheoriginalSuperpavevolumetricmixdesign,someSHAshaveexpressedconcerns that theSuperpavesystemproducesasphaltmixtures thatare toodry (lowasphaltbindercontent),potentiallyresultingindurabilityissues.TheSuperpavemethodspecifiesthattheoptimumasphaltcontentforagivengradationbeselectedat4percentairvoids.Inmanyinstances,requirementsintheSuperpavevolumetricmixturedesigndescribedintheAASHTOstandardshavebeenrefinedbySHAsbasedontheirexperience,includingthedesignairvoids,minimumvoidsinthemineralaggregate(VMA),and/orthedesigngyrations.Toprovideguidance inmakingchangestotheAASHTOstandards,theFHWAAsphaltMixtureExpertTaskGroup (ETG) recommendedagenciesperforman independentevaluationprior tomakinganyadjustments to gyratory compaction levels from theAASHTOR35 standard. Theevaluationwouldincludetheeffectoftheproposedchangesingyrationlevelonperformancefortypicalaggregates,binder,andmixturedesigns(FHWATechBriefFHWA-HIF-11-031,2010).OneexampleofachangeinmixturedesigncriteriawasSuperpave5(Hekmatfaretal.,2013).ASuperpavemixture is typically designed at 4 percent air voids, but it is compacted to 7 to 8percentairvoidsinthefield.InSuperpave5,mixturesaredesignedtohavethesamedensityinthelabandinthefield,andoptimumbindercontentischosenat5percentairvoidsratherthanthecurrentlyspecified4percent.Thiswouldincreasepavementdurabilitybydecreasingthein-place air voids from 7 to 8 percent to 5 percent. To maintain the same effective asphaltcontent,theminimumVMAisincreasedby1percentcomparedtotheSuperpavemixture.TheSuperpave 5 asphaltmixture uses 50 design gyrations. To evaluate the Superpave 5mixturedesign approach, two asphalt mixtures were designed at 5 percent air voids. The resultssuggested that itwas possible to compact the asphaltmixtures to 5 percent air voids in thefield.Laboratoryresultsindicatedthattheasphaltmixturesshouldhaveacceptablepermanentdeformationperformance.Superpave level 1mix designwas an improvedmaterial selection and volumetricmix designprocess.Level2mixdesignproceduresuse thevolumetricmixdesignasastartingpointandincludedabatteryofteststoarriveataseriesofperformancepredictions.Thesetestsweretobe empirical or surrogate performance tests. Level 3 mixture design included a more
Aschenbrener,Brown,Tran,Blankenship
13
comprehensive array of tests and results to achieve a more reliable level of performanceprediction.These testswere tobemoremechanisticor fundamental (Asphalt InstituteSP-2).Performance testing (levels 2 and 3)was not implemented as part of the Strategic HighwayResearch Program (SHRP) due to the cost and complexity of the testing technologies at thattime. As a result, Superpave mixture design was implemented based solely on volumetricproperties.Performanceengineeredmixturedesignaddsperformancetestingtothevolumetricproperties to ensure the proper combination of quality constituent materials to resistpremature deterioration from pavement distresses such as rutting, cracking, and moisturedamage.Amixturedesignedusing thisapproach is required topassestablishedperformancetestscriteriaforpermanentdeformationandcrackingforagiven leveloftraffic,climate,andpavement structure. This approach has the potential to fulfill the intent of the Superpavemixture design system to include performance testing. Examples of SHAs using a level 2approachincludeTexas(Zhouetal.,2014),NewJersey(Bennertetal.,2014),California(Harveyetal.,2014),Louisiana(CooperIIIetal.,2014)andIllinois(Al-Qadietal.,2017).
design.First,theasphaltmixtureoftenhasdifferentpropertiesthanthemixturedesignpreparedinthelaboratory.Forexample,thematerials inthefieldmayhavemoremoistureandmixinginthefieldisaverydifferentprocessthanmixinginthelaboratory.Thus,someadjustmentsmaybeneededduringproduction.Careshouldbetakenwhenmakingtheseadjustmentsastheycanhave a significant impact on the compactability and performance of the mixture. Also,breakdownof theaggregate typicallyoccurs increasing theamountof fines (materialpassingtheNo.200sieve)andloweringtheairvoidsandVMA.Adjustmentsareoftenneededtothemixtobringthevolumetricpropertiesbackwithinspecificationrequirements.Second,duringconstruction,typicalqualitycontrol(QC)andacceptancespecificationsrelyonacceptancetesting,comparisontestingbetweenSHAandcontractor,qualitylevelanalysis,andpay factor determinations. It is essential that the gradation, asphalt binder content, andvolumetricproperties(suchasairvoidsandvoidsinmineralaggregate)becloselycontrolledsothatthevariabilityislow.MostSHAshaveconstructiontolerancerequirementsandpayfactorsrelatedtotheseproperties.Forexample,laboratoryairvoidsaregenerallycontrolledwithin±1percentfromthetargetfordense-gradedmixtures.Ifthelaboratoryairvoidsarealittlehigh,longtermdurabilityofthemixmaybereduced. Iftheairvoidsarea little low,bleeding(andpossibly rutting) in the asphaltmixturemay occur. Thus, the gradation, binder content, and
Aschenbrener,Brown,Tran,Blankenship
14
volumetricpropertiesmustbeconsistentduringconstructionforbestfieldperformance.Thesepropertiescanalsoinfluencethefieldcompactabilityoftheasphaltmixture.Third, the acceptance criteria used for the asphalt mixture design should be used for fieldacceptance.Forexample,theasphaltmixturedesignhastargetairvoidswithaminimumandmaximum,minimumVMA,andothers.Duringproduction,someSHAskeepthesametargetairvoidsandminimumVMAdesignrequirementandotherSHAsallowawidertoleranceforfield-producedmaterialsintermsofairvoidsandVMA.Theacceptancecriteriaandresultingrangeof as-produced material properties can influence the field compactability of the asphaltmixture.
4.2 FieldCompaction
The desired level of density in asphalt layers in the field is achieved by themeans of rollercompaction. The aggregates in an asphalt layer interlock as the result of the compactionprocess.Asanasphaltlayeriscompacted,itbecomesdenserandtheairvoidsarereduced.Anasphalt surface should have a smooth, uniform surface and a homogenous appearance. Theachieved in-place density of an asphalt pavement results from a combination of differentactivitiesthatincludeproperdesign,production,placement,compaction,andqualitycontrolofthemixture(AsphaltInstitute,2007).Anasphaltmixturebehindapavertypicallyhasadensityof80to85percentofitsGmm.Generally,thegoalofcompactioninmanySHAsisoftenanin-placeaveragedensitylevelof92to93percentofGmm(i.e.,theequivalentof7to8percentairvoids).
The structure of the pavement base must be considered as a primary criterion forimplementingincreasedin-placedensityrequirements.Theuseofincreasedin-placedensityismostapplicabletostructuraloverlaysratherthanfunctionaloverlays.Structuraloverlayshavea designed pavement thickness to address the anticipated traffic for a given design life.Functionaloverlaysareoftenmaintenanceprojectstoaddressexistingdistresses:aBand-Aid.Iffunctionaloverlaysareplacedonweakbases,itmaybeverydifficulttoobtainevenminimalin-placedensityrequirements.Appropriateprojectselectionmustbeconsidered. Inaddition, toavoidthepotentialforrollerbridging leadingtounevencompaction,existingasphaltsurfaceswithrutdepthsgreaterthanone-halfinchshouldbemilledbeforeoverlaysareplaced.
4.2.2 CompactionEquipmentandOperation
Asphalt pavement density does not increase linearly with additional compaction; rather, itchanges randomly “due to continuous reorientation of aggregates and the randomness ofaggregate shapes and textures” (Beainy et al., 2014). Two of themost important factors inobtaining density are the temperature of the asphalt mixture and lift thickness. In general,compactionconsistencyandoverallcompactionareincreasedthroughadditionalrollerpasses.Therollingpatterniscriticaltoachievepropercompactionwithoutcausingaggregatedamagetotheasphaltpavementstructure.Rollingpatternsshouldbeoptimizedbasedonthedrum-to-
Aschenbrener,Brown,Tran,Blankenship
15
pavement width relationship. The traditional rolling train typically consists of a breakdown,double-drum vibratory roller followed by an intermediate vibratory or pneumatic rollerfollowedbyafinishroller(typicallyastaticsteel-wheeledroller).Whenitisdifficulttoobtaincompaction,thecontractormayelecttousetwoormorevibratorybreakdownrollersinechelon(staggered,adjacent,andoffset)toapplyonecoveragewithonepass from each roller. The full width of the mat can be best compacted when it is at theoptimum temperature. The optimum temperature is determined based on the equi-viscoustemperatureandpastexperience.Forasphaltmixturesthatarehardtocompact,therecanalsobeintermediatevibratoryorpneumaticrollersinechelon(Scherocman,2006).The speed, frequency, and amplitude of vibratory rollers are also important. There is arelationshipbetweenthespeedandfrequencyofthevibratoryroller. It isdesiredtoapplyatleast 10 to 14 impacts with a vibratory roller per foot; otherwise, corrugations may occur.Hence, thespeedand frequencyneed tobesynchronized.Whenusingvibratory rollers, “thedepthofpenetrationofthecompactionenergyimparteddependsontheweightoftherolleraswell as the amplitude and frequency of the vibrations. For a given setting of amplitude andfrequency, the density achieved depends on the thickness of the mat and the underlyingpavementlayers”(Beainyetal.,2014).Whether asphalt mixtures are stiff or tender, breakdown or initial rollers should be usedimmediately following the paver to ensure that the mixture is compacted while hot(Scherocman, 2006). Breakdown rolling is typically completed before themat cools to 240oFandfinishrollingiscompletedwhenthesurfacetemperatureisabove175oF.Byoptimizingandautomating these variables, the effectiveness of achieving higher in-place densities withvibratory rollers can be greatly improved. Monitoring the surface asphalt pavementtemperature zones through the use of real-time infrared sensors can allow operators tomonitoridealcompactiontimes(Starry,2006).Therehavebeenmanyrecentadvances incompactionequipment,andconstructionpracticesregarding compaction have been analyzed much more closely. The use of vibratory rollers,oscillatory rollers, or vibratory pneumatic tire rollers can achieve optimized in-place densitywhenproperlyemployed(Nose,2006).Intelligentcompactiontechniqueshavealsobeenused,which will be discussed in more detail in a later section. Advances in vibratory rollermanufacturinghaveledtotheadventofhighfrequencyrollerstoenablefasterrollingspeedswhere a vibratory roller can complete breakdown rolling and keep upwith the paver,whilemaintaining the consistent impact spacing needed for compaction. Vibratory drum spacingshouldbebasedondrumdiametertoensurethesmoothnessofpavementsurfaces.
4.2.3 BalancingPavingOperations
Balancingpavingoperationsrelatestotheconsistencyandimpactstheabilitytoobtaindensity.Best practices are documented byNAPA (1996). Balancing includes the tons per hour at theplant,numberoftrucks,paverspeed,numberofrollers,androllerspeedcalculations.AcasehistoryexampleisprovidedbySchmittetal.(1977).Oneofthemorecommonoccurrencesof
Aschenbrener,Brown,Tran,Blankenship
16
pavingoperationimbalancerelatestotherateofplantproduction.Iftheplantproductionrateis too high, the loaded trucks line up at the paver waiting to be unloaded. This allows themixtureinthetruckstocoolandencouragesthepaveroperatortogofaster.Inturn,therollersmaynotbeable to keepupwith thepaver, so the roller speeds increaseand/or reduce thenumberofpasses.Theproductionrate,numberoftrucks,paverspeed,numberofrollers,androllerspeedareallimportantandinterrelatedfactors.
Astheliftthicknessincreases,thetimeavailableforcompactionincreasesduetothethickerliftcoolingmoreslowly.Twoofthemost importantfactorsare lift thicknessandtemperatureofthe asphalt mixture. The base temperature, air temperature, and wind speed are alsoimportant.ThesefactorscanbeinputintoPaveCool(MinnesotaDepartmentofTransportation,2015)orMultiCool(NationalCenterforAsphaltTechnologyatAuburnUniversity),whichweredeveloped to estimate the available time for compaction. They also provide a cooling curve.PaveCoolwasdeveloped initiallyand thenMultiCoolwasdevelopedtosimulatemultiple liftsthat were cooling. Both are available for the desktop personal computer or smart phoneapplications.
4.2.5 Permeability
In-placeairvoidcontentofdense-gradedasphaltmixtureshasasignificanteffecton in-placepermeability of pavements (Mallick, 2003). There is a relationship to the in-place density,NMAS, and permeability. To ensure that permeability is not an issue, the in-place air voidsshould be between 6 and 7 percent or lower. This appears to be true for a wide range ofmixtures regardless of NMAS, gradation, or air void level (Brown et al., 2004).Work by theFlorida DOT indicated that coarse-graded Superpavemixes can be excessively permeable towateratairvoidlevelsaround6percent(Choubaneetal.,1998).TheArkansasStateHighwayTransportation Department (AHTD) found that in-place air void levels below 6 percentwereacceptable, although it could be expected that the life of a permeable pavement would beshorterthanthatofa“lesspermeable”pavement(Westerman,1998). Infiltrationofwaterorair into a pavement can affect the durability of that pavement. Probably the most harmfuleffecttakesplacethroughtheinvasionofwaterintothepavementthatresultsinstripping.
4.3 OtherBestPractices
4.3.1 LongitudinalJoints
Many asphalt pavement failures can be attributed to insufficient compaction of longitudinaljoints. These failures are primarily affected by the density of the free edge of a lane, thecompactionofthematerialinthejoint,andhowwellthehotsideofthejointiscompacted.Theconstruction of longitudinal joints requires precise workmanship to achieve optimalcompaction.Onesequenceofmethodstoachieverequiredcompactionistocompactthefirstlane (cold side) with the roller overhanging the edge by six inches, followed by placing thesecond lane(hotside)withaonetoone-and-a-half-inchoverlapof thefirst layerdictatedbytheedgerplateonthepaverscreed.Finally,thesecondlaneshouldbecompactedfromthehot
Aschenbrener,Brown,Tran,Blankenship
17
sidewiththeoutsidetireofarubbertirerollerdirectlyonthe jointorbyasteeldrumrollerwith the drum extending six inches over the top of the joint (Brown, 2006; Benson andScherocman, 2006). More information about best practices for construction and specifyingasphaltpavementlongitudinaljointsisavailableontheAsphaltInstitute’swebsite(2016).BasedonexperiencefromthePortAuthorityofNewYorkandNewJersey(PANYNJ),evenwithmethodspecificationsforspecifictypesoflongitudinaljointconfigurations,manyprojectshadlowdensityinthesejoints.PANYNJhasimplementedanend-resultdensityspecificationalongwitha specific joint configurationmandate to incentivizeachievementof compaction criteriaregardless of construction method (Bognacki, 2006). Some state DOTs have also adopted alongitudinaljointdensityspecification.
4.3.2 TackCoat
Bonding of pavement layers is vital to the creation of long life asphalt pavements (FHWA,2016). The tack coat also assists with improving compaction. While sometimes listed as“incidental” in SHA specifications, tack coat is vital to pavement layer bonding.With properbonding of the layers, a monolithic structure is formed, greatly improving a pavement’sresistance to stress and fatigue. This is consistent with the assumptions common to allpavementthicknessdesignmethods.Selectionof an appropriate tack coatmaterial, applied in the recommended residual ranges,providesthegluenecessarytobondthepavementlayers.Surfacepreparation,creatingacleanand dry surface, is required for bonding. Milling of existing surface materials will furtherimprove bonding capabilities, thus, typically improving pavement performance. Maintainingandcalibratingthedistributortruckisalsoneededtoprovidethedesireduniformapplication.Itis important to select the appropriate nozzles and sizes tomatch both thematerial and thetarget residual application rate. Truck speedandpump capacity are also important in nozzleselection.Additionally,thespraybarshouldbesettoachieveeitheradoubleortripleoverlapto ensure uniform coverage. Poor uniformity can be due to many factors including blockednozzles,improperangle,impropernozzlesize,improperdistributortruckspeed,orinadequatepumppressure.A key to developing a successful bond between pavement layers for peak long-termperformance is a uniform application of a high-quality tack coat at the appropriate residualasphalt rate toa cleananddry surface. This alsoenhances the compactabilityof theasphaltpavement.
4.4 MeasurementandPayment
As part of the FHWA demonstration project, the Asphalt Institute conducted an SHA“specification mining” effort. With assistance from Asphalt Institute engineers, all SHAspecificationsweregatheredandreviewedfordensityrequirements.AllstatesandtheDistrictof Columbia were included for 51 total specifications. SHAs often had more than onerequirementforin-placedensitysuchasan“OptionA”(coresrequiredwithdensitymeasured)
Aschenbrener,Brown,Tran,Blankenship
18
and“B” (rollerpatternonlynocores required), forexample.The specifications for theSHAs’highestlevelofdensityrequirementweregathered,whicharenaturallyonthehighesttraveledpavements(interstate/primaryroutes)inthatstate.ThedatasummarizedinthissectioncamefromtheAsphaltInstitute’sspecificationminingeffort.ThegoalofspecificationminingwastounderstandhowSHAsspecifymatdensity.Thefollowingdatawascollected:
Thedata and specifications fromeach SHAwere then compiled and reviewed. Thedatawasreviewedwithspecificationsasmuchaspossibletoqualitychecktheinformation.SincesomeSHA’sspecificationsleavesomeareaforinterpretation,theremaybesomemistakes.Difficultyofinterpretationwascommoninseveralstandards.Somespecificationshadcriticalinformationof Gmm, lot size, density, etc. spread over many pages or books (i.e. construction materialsmanuals or inspector manuals) that can be difficult to obtain instead of being in thespecification. Some specifications did not address when the Gmm is measured, while it isassumed to be daily. Lack of clear language and ease of understanding can lead tomisinterpretationofspecificationsandmeasures.This isanexampleofclear languagestatingthemostcriticalinformationaboutdensityinaparagraph.
“Fiverandomlyselectedcores(4”min./6”max.diameter),fromthetravellane,willbetested todeterminedensity complianceandacceptance.Onecore shallbe taken fromeachsublot.TheBulkSpecificGravity(Gmb)ofthecoresshallbedeterminedasstatedabove and the average calculated. The maximum theoretical gravity (Gmm) fromacceptancetesting for thatshift’sproductionwillbeaveragedandthepercentdensitywillbedeterminedforcompliancebydividingtheGmbaveragebytheGmmaverage.”
field adjustments up to 5% air voids, making density even more difficult to achieve.Superpave NMAS lift thickness recommendations (four times the NMAS for coarsegradedmixes)werebasedona4percentairvoiddesign.
• PWLspecificationsmay“frighten”somewiththeirmorecomplexcalculations.Althoughspecificationschangeannually,thespecificationminingeffortrepresentsthebestandmost current information. This is what we believe that SHAs are actually doing per theirstandardsandpractices.Afewexamplesare:
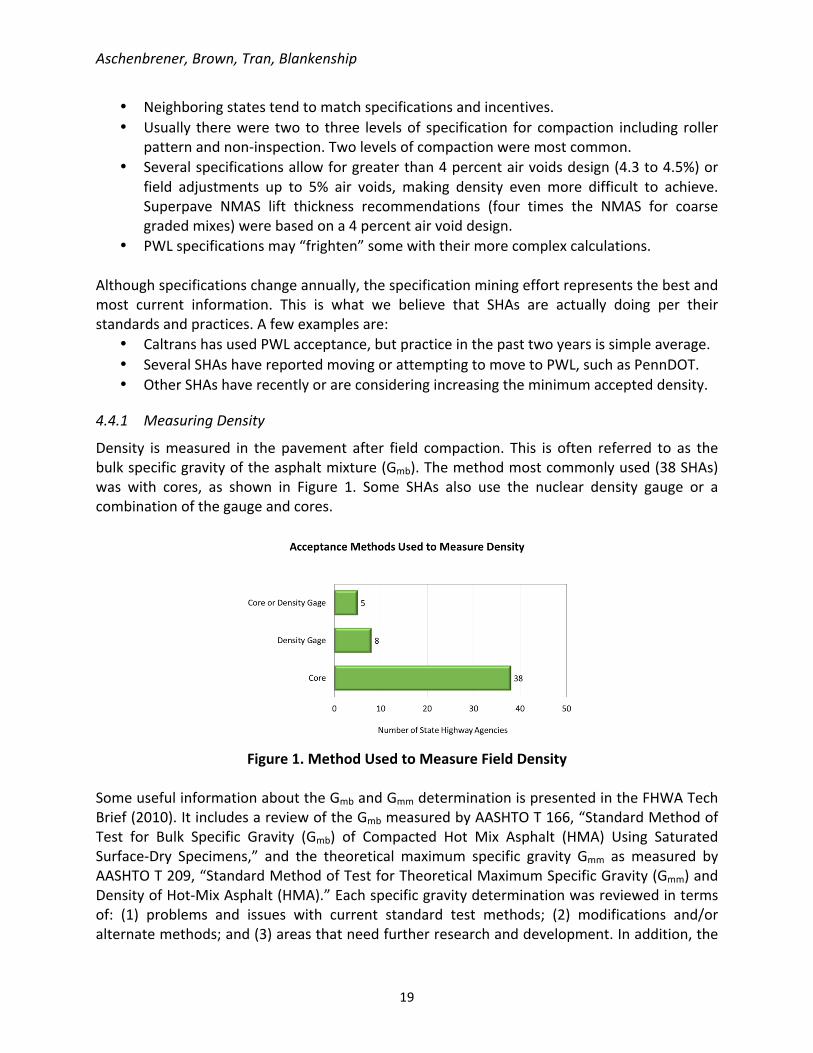
Density ismeasured in thepavement after field compaction. This is often referred to as thebulkspecificgravityoftheasphaltmixture(Gmb).Themethodmostcommonlyused(38SHAs)was with cores, as shown in Figure 1. Some SHAs also use the nuclear density gauge or acombinationofthegaugeandcores.
Figure1.MethodUsedtoMeasureFieldDensity
SomeusefulinformationabouttheGmbandGmmdeterminationispresentedintheFHWATechBrief(2010).ItincludesareviewoftheGmbmeasuredbyAASHTOT166,“StandardMethodofTest for Bulk Specific Gravity (Gmb) of Compacted Hot Mix Asphalt (HMA) Using SaturatedSurface-Dry Specimens,” and the theoretical maximum specific gravity Gmm as measured byAASHTOT209,“StandardMethodofTestforTheoreticalMaximumSpecificGravity(Gmm)andDensityofHot-MixAsphalt(HMA).”Eachspecificgravitydeterminationwasreviewedintermsof: (1) problems and issues with current standard test methods; (2) modifications and/oralternatemethods;and(3)areasthatneedfurtherresearchanddevelopment.Inaddition,the
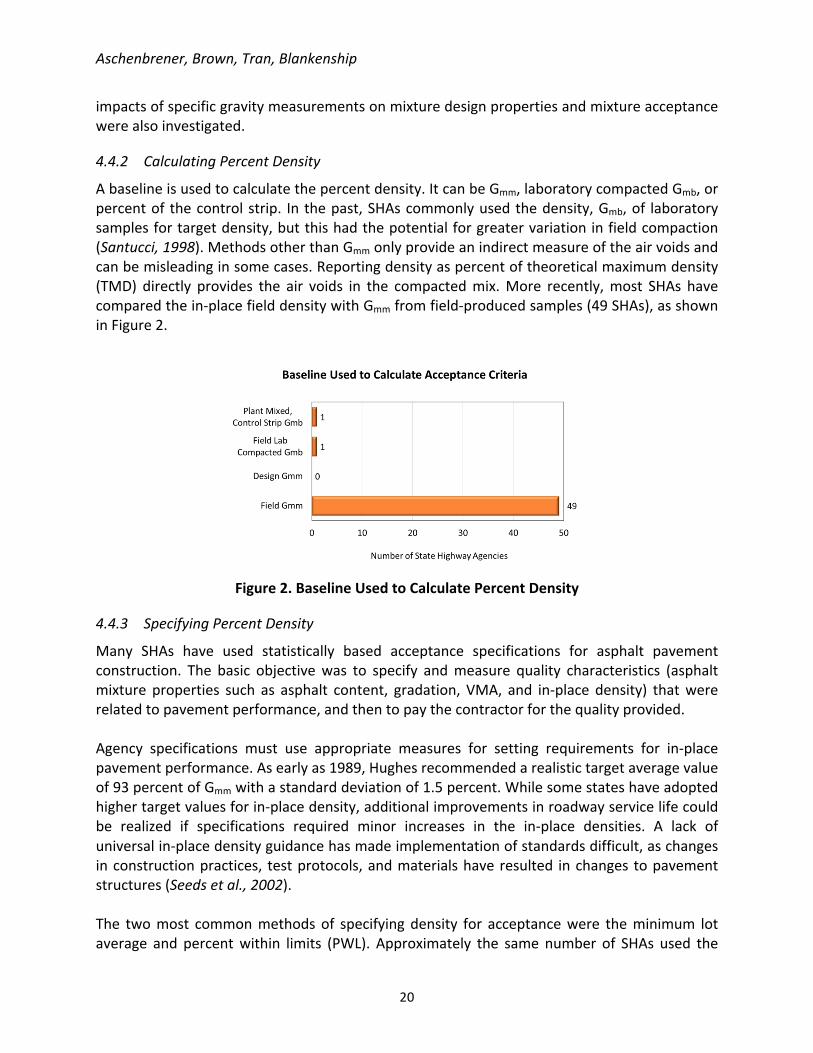
Abaselineisusedtocalculatethepercentdensity.ItcanbeGmm,laboratorycompactedGmb,orpercentof thecontrolstrip. In thepast,SHAscommonlyusedthedensity,Gmb,of laboratorysamplesfortargetdensity,butthishadthepotentialforgreatervariationinfieldcompaction(Santucci,1998).MethodsotherthanGmmonlyprovideanindirectmeasureoftheairvoidsandcanbemisleadinginsomecases.Reportingdensityaspercentoftheoreticalmaximumdensity(TMD) directly provides the air voids in the compactedmix.More recently,most SHAs havecomparedthein-placefielddensitywithGmmfromfield-producedsamples(49SHAs),asshowninFigure2.
Figure2.BaselineUsedtoCalculatePercentDensity
4.4.3 SpecifyingPercentDensity
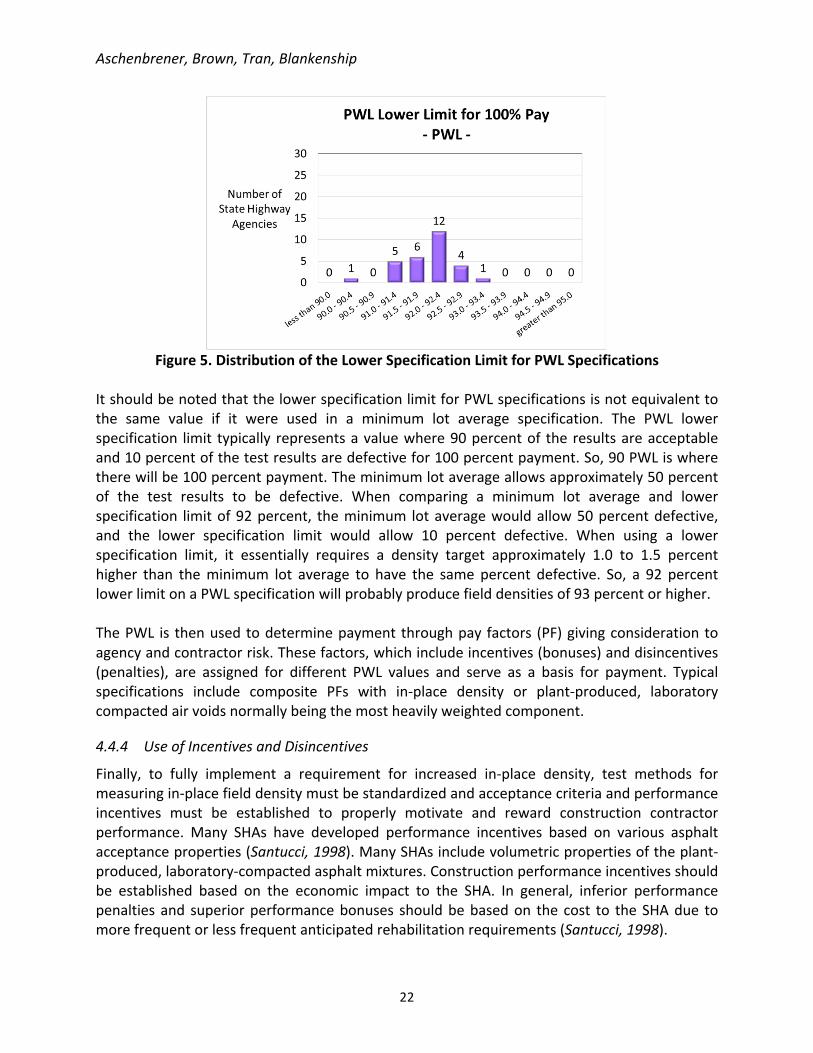
Many SHAs have used statistically based acceptance specifications for asphalt pavementconstruction. The basic objectivewas to specify andmeasure quality characteristics (asphaltmixture properties such as asphalt content, gradation, VMA, and in-place density) thatwererelatedtopavementperformance,andthentopaythecontractorforthequalityprovided.Agency specifications must use appropriate measures for setting requirements for in-placepavementperformance.Asearlyas1989,Hughesrecommendedarealistictargetaveragevalueof93percentofGmmwithastandarddeviationof1.5percent.Whilesomestateshaveadoptedhighertargetvaluesforin-placedensity,additionalimprovementsinroadwayservicelifecouldbe realized if specifications required minor increases in the in-place densities. A lack ofuniversalin-placedensityguidancehasmadeimplementationofstandardsdifficult,aschangesinconstructionpractices, testprotocols,andmaterialshaveresulted inchanges topavementstructures(Seedsetal.,2002).The twomost commonmethodsof specifying density for acceptancewere theminimum lotaverage and percentwithin limits (PWL). Approximately the same number of SHAs used the
ItshouldbenotedthatthelowerspecificationlimitforPWLspecificationsisnotequivalenttothe same value if it were used in a minimum lot average specification. The PWL lowerspecification limit typically representsavaluewhere90percentof theresultsareacceptableand10percentofthetestresultsaredefectivefor100percentpayment.So,90PWLiswheretherewillbe100percentpayment.Theminimumlotaverageallowsapproximately50percentof the test results to be defective. When comparing a minimum lot average and lowerspecification limitof92percent, theminimum lotaveragewouldallow50percentdefective,and the lower specification limit would allow 10 percent defective. When using a lowerspecification limit, it essentially requires a density target approximately 1.0 to 1.5 percenthigher than theminimum lot average to have the same percent defective. So, a 92 percentlowerlimitonaPWLspecificationwillprobablyproducefielddensitiesof93percentorhigher.ThePWL is thenusedtodeterminepayment throughpay factors (PF)givingconsiderationtoagencyandcontractorrisk.Thesefactors,whichincludeincentives(bonuses)anddisincentives(penalties), are assigned for different PWL values and serve as a basis for payment. Typicalspecifications include composite PFs with in-place density or plant-produced, laboratorycompactedairvoidsnormallybeingthemostheavilyweightedcomponent.
4.4.4 UseofIncentivesandDisincentives
Finally, to fully implement a requirement for increased in-place density, test methods formeasuringin-placefielddensitymustbestandardizedandacceptancecriteriaandperformanceincentives must be established to properly motivate and reward construction contractorperformance. Many SHAs have developed performance incentives based on various asphaltacceptanceproperties(Santucci,1998).ManySHAsincludevolumetricpropertiesoftheplant-produced,laboratory-compactedasphaltmixtures.Constructionperformanceincentivesshouldbe established based on the economic impact to the SHA. In general, inferior performancepenalties and superiorperformancebonuses shouldbebasedon the cost to theSHAdue tomorefrequentorlessfrequentanticipatedrehabilitationrequirements(Santucci,1998).
Aschenbrener,Brown,Tran,Blankenship
23
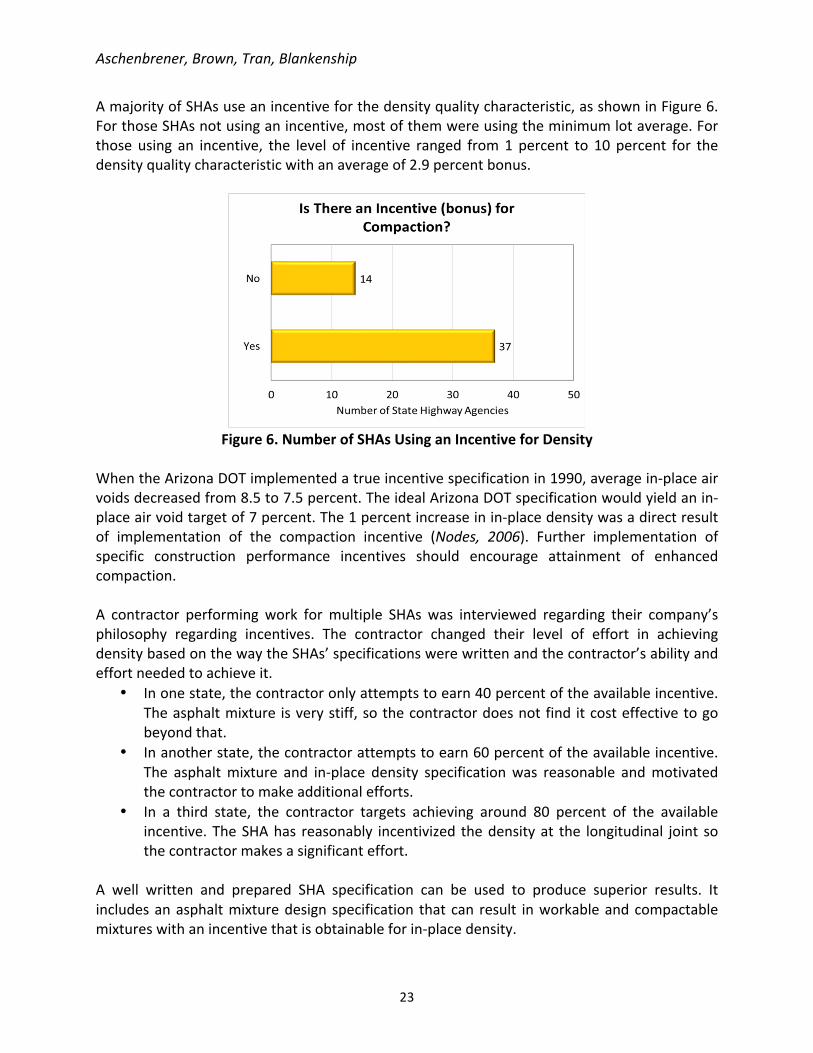
AmajorityofSHAsuseanincentiveforthedensityqualitycharacteristic,asshowninFigure6.ForthoseSHAsnotusinganincentive,mostofthemwereusingtheminimumlotaverage.Forthose using an incentive, the level of incentive ranged from1 percent to 10 percent for thedensityqualitycharacteristicwithanaverageof2.9percentbonus.
Figure6.NumberofSHAsUsinganIncentiveforDensity
WhentheArizonaDOTimplementedatrueincentivespecificationin1990,averagein-placeairvoidsdecreasedfrom8.5to7.5percent.TheidealArizonaDOTspecificationwouldyieldanin-placeairvoidtargetof7percent.The1percentincreaseinin-placedensitywasadirectresultof implementation of the compaction incentive (Nodes, 2006). Further implementation ofspecific construction performance incentives should encourage attainment of enhancedcompaction.A contractor performing work formultiple SHAs was interviewed regarding their company’sphilosophy regarding incentives. The contractor changed their level of effort in achievingdensitybasedonthewaytheSHAs’specificationswerewrittenandthecontractor’sabilityandeffortneededtoachieveit.
• Inanotherstate,thecontractorattemptstoearn60percentoftheavailableincentive.The asphaltmixture and in-place density specificationwas reasonable andmotivatedthecontractortomakeadditionalefforts.
• In a third state, the contractor targets achieving around 80 percent of the availableincentive.TheSHAhas reasonably incentivized thedensityat the longitudinal joint sothecontractormakesasignificanteffort.
A well written and prepared SHA specification can be used to produce superior results. Itincludesanasphaltmixturedesignspecification thatcan result inworkableandcompactablemixtureswithanincentivethatisobtainableforin-placedensity.
Aschenbrener,Brown,Tran,Blankenship
24
4.5 SuccessStories
4.5.1 PennsylvaniaDepartmentofTransportation
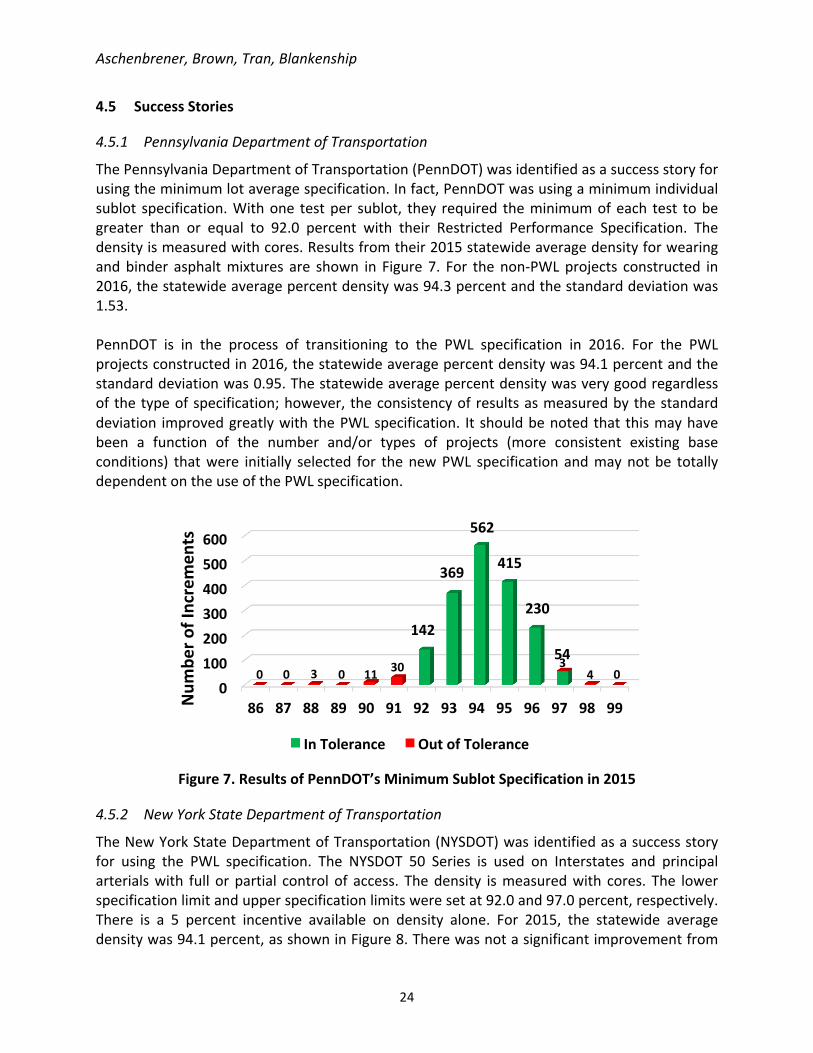
ThePennsylvaniaDepartmentofTransportation(PennDOT)wasidentifiedasasuccessstoryforusingtheminimumlotaveragespecification.Infact,PennDOTwasusingaminimumindividualsublot specification.Withone testper sublot, they required theminimumofeach test tobegreater than or equal to 92.0 percent with their Restricted Performance Specification. Thedensityismeasuredwithcores.Resultsfromtheir2015statewideaveragedensityforwearingandbinder asphaltmixtures are shown in Figure7. For thenon-PWLprojects constructed in2016,thestatewideaveragepercentdensitywas94.3percentandthestandarddeviationwas1.53.PennDOT is in the process of transitioning to the PWL specification in 2016. For the PWLprojectsconstructedin2016,thestatewideaveragepercentdensitywas94.1percentandthestandarddeviationwas0.95.Thestatewideaveragepercentdensitywasverygoodregardlessofthetypeofspecification;however, theconsistencyofresultsasmeasuredbythestandarddeviation improvedgreatlywiththePWLspecification. Itshouldbenotedthat thismayhavebeen a function of the number and/or types of projects (more consistent existing baseconditions) thatwere initially selected for thenewPWL specification andmaynotbe totallydependentontheuseofthePWLspecification.
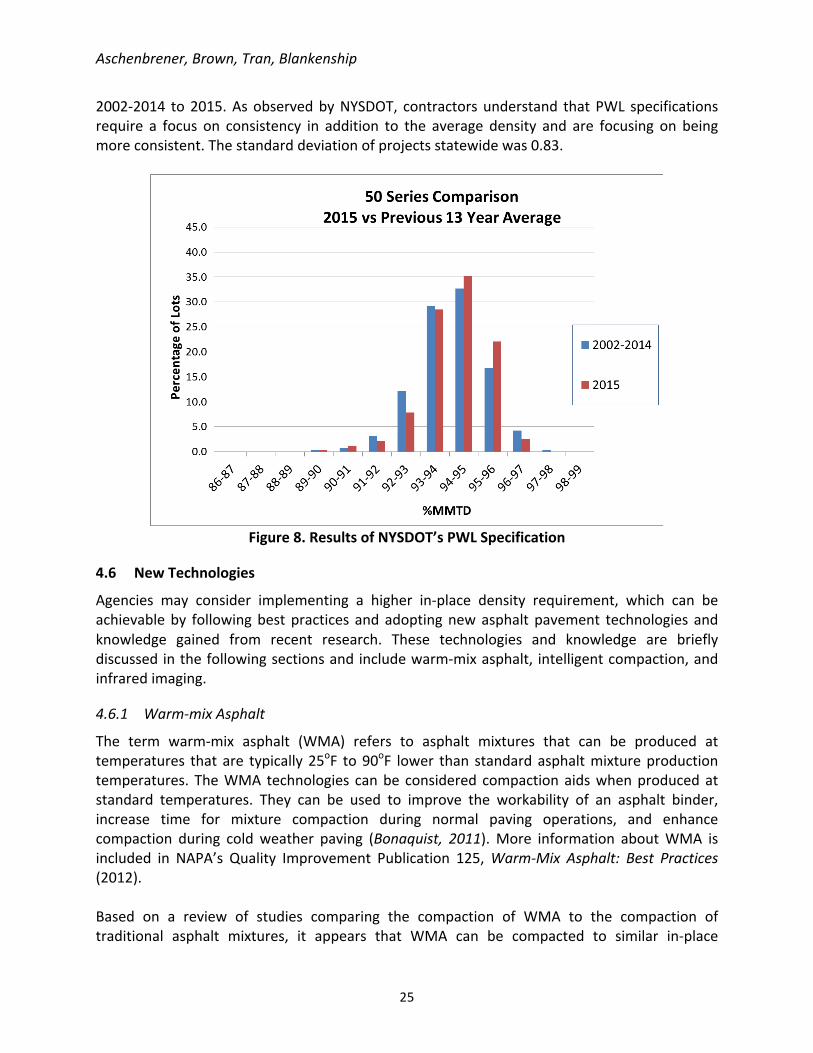
TheNewYorkStateDepartmentofTransportation(NYSDOT)wasidentifiedasasuccessstoryfor using the PWL specification. The NYSDOT 50 Series is used on Interstates and principalarterialswith full orpartial control of access. Thedensity ismeasuredwith cores. The lowerspecificationlimitandupperspecificationlimitsweresetat92.0and97.0percent,respectively.There is a 5 percent incentive available on density alone. For 2015, the statewide averagedensitywas94.1percent,asshowninFigure8.Therewasnotasignificantimprovementfrom
0100200300400500600
86 87 88 89 90 91 92 93 94 95 96 97 98 99
142
369
562
415
230
540 0 3 0 11 30 3
4 0
Num
bero
fIncremen
ts
InTolerance OutofTolerance
Aschenbrener,Brown,Tran,Blankenship
25
2002-2014 to2015.AsobservedbyNYSDOT, contractorsunderstand thatPWL specificationsrequire a focus on consistency in addition to the average density and are focusing on beingmoreconsistent.Thestandarddeviationofprojectsstatewidewas0.83.
Figure8.ResultsofNYSDOT’sPWLSpecification
4.6 NewTechnologies
Agencies may consider implementing a higher in-place density requirement, which can beachievableby followingbest practices andadoptingnewasphalt pavement technologies andknowledge gained from recent research. These technologies and knowledge are brieflydiscussedinthefollowingsectionsandincludewarm-mixasphalt, intelligentcompaction,andinfraredimaging.
4.6.1 Warm-mixAsphalt
The term warm-mix asphalt (WMA) refers to asphalt mixtures that can be produced attemperatures that are typically25oF to90oF lower than standardasphaltmixtureproductiontemperatures. TheWMA technologies canbe considered compactionaidswhenproducedatstandard temperatures. They can be used to improve the workability of an asphalt binder,increase time for mixture compaction during normal paving operations, and enhancecompaction during coldweather paving (Bonaquist, 2011).More information aboutWMA isincluded in NAPA’s Quality Improvement Publication 125,Warm-Mix Asphalt: Best Practices(2012).Based on a review of studies comparing the compaction of WMA to the compaction oftraditional asphalt mixtures, it appears that WMA can be compacted to similar in-place
Aschenbrener,Brown,Tran,Blankenship
26
densitiesatmuch lowercompaction temperatures (Prowelletal.,2012;Estakhrietal.,2009;Hurley, 2010;Aschenbrener, 2011; Zinke, 2014;Anderson, 2014). Thebenefits of this includeimproved in-place densities for projects requiring longer haul times, which have increasedtemperature loss during transit, and improved in-place densities during cold weatherconstruction.
4.6.2 IntelligentCompaction
Theasphaltpaving industryhasalso seen the introductionofnewvibratory rollersequippedwith an integrated intelligent compaction (IC) system. This systemmay include an onboardcomputer,GlobalPositioningSystem(GPS)basedmapping,andoptional feedbackcontrols. Itallows real-timemonitoring of compaction and adjustments as needed to achieve optimumdensity and consistent coverage. In addition, color-coded mapping provides a continuousrecord showing the location of the roller, number of roller passes, and material stiffnessmeasurements.Duringcompaction,thelocationoftheroller,itsspeed,numberofpasses,andcoveragecanbemonitoredusingtheGPS.Compactionmetersoraccelerometersmountedinthe drum monitor the applied compaction effort, frequency, and material response. Somerollers also have instrumentation to monitor the surface temperature of asphalt pavingmaterials.TheresultsofpriorstudiesshowthattherelationshipbetweenICmeasurementsandin-placedensity is inconsistent (Minchin et al., 2001;Maupin, 2007; Chang et al., 2011; Chang et al.,2014).ItappearsthatICmeasurementsarecurrentlynotagoodcandidateforreplacingcoresfor density measurement as an acceptance test. The use of IC does, however, show somepotentialasa real-timemeasureofcompactionandmaybeuseful forQCand for identifyinglocationsontheasphaltmatthatmaynothaveachievedthedesiredcompactionlevel.This new technology makes it easier to optimize and automate compaction parameters toachievehigher in-placedensitiessuchas rollingpattern, frequency,drumspacing,amplitude,and temperature control. In addition, the use of GPS-based mapping provides real-timemonitoringof compactionanda continuous record that shows the locationof the roller, thenumberofrollerpasses,andmaterialstiffnessmeasurementstoachieveconsistentcoverage.WhiletheICsystemhelpsimprovethecompactionprocess,itisnotcurrentlyusedinplaceoftraditionalcoresfordensitymeasurementasanacceptancetestfortheasphaltmixture.
4.6.3 InfraredImaging
Infrared (IR) imaging technology canbeused for real-time temperature testingofpotentially100percentofthepavementsurfaceasitisplaced,providingmuchmoreinspectioncoveragethan existing QC methods. This new technology has improved the state of the practice forobtainingQCdatainasphaltpavementconstruction.TheIRimagingtechnologycanmeasurethermalconsistencyofthefullpavinglanewidth,whichenables inspectors and paving crews to measure the real-time mat temperature. Real-timetemperature QC allows for prompt adjustments by the paving crew, thereby minimizing
Aschenbrener,Brown,Tran,Blankenship
27
segregationproblemsthatcanoccurwhentherangeintemperatureistoohigh.Inadditiontosavings resulting from these innovations, near-term benefits include more consistentlyconstructedasphaltlayersandbetterin-placefielddensity.TheinformationobtainedfromthistechnologycanbepartofQCdatainasphaltpavementconstruction.Thefollowingguidelineswereestablishedtohelpimprovetheconsistencyofin-placedensity(Willoughbyetal.,2001).Theyalsofoundthatend-dumptrucksshowedagreatertemperaturespread.
ThischapterdocumentskeyfindingsofaliteraturesearchandreviewofSHAspecificationstoidentify best practices and new technologies that can help achieve density. Higher in-placedensitycanbeobtainedtoimprovethelong-termperformanceofasphaltpavementsinacost-effectivemannerbyadoptingsomeofthefollowingpracticesandtechnologies.
o Duringpavementdesign,theliftthicknessshouldbedesignedtobeaminimumof threeand four timesthe intendedNMASfor fine-andcoarse-gradedmixes,respectively.Thethickerthelift,themoreroomforcompaction.Liftthicknessisrelatedtopotentialdensity,nottorutting.
o For some SHAs, mix design requirements have been refined to encourageincreasing effective binder volume. Examples of changes to the Superpavevolumetric mix design include Superpave 5 and performance engineered mixdesign.Theseconceptsarenewandshouldbeusedonlyafterlocalexperience.These changes can improve field compactability while ensuring mixtureresistance to premature distresses such as rutting, cracking and moisturedamage.
o After a mix design is completed in the laboratory, it should be verified andproperly adjusted at the start of production as materials in the field may bedifferent and/or more variable than those used in the laboratory, and field-acceptance criteriamay be different from those used for the asphalt mixturedesign.
sufficient,consistentsupportforachievinghigherin-placedensity.o Appropriate compaction equipment should be selected and properly operated
duringpaving.Therollingpatternshouldbeoptimizedtoachievebothin-placedensity and consistency.Pavingoperations shouldbebalanced to improve theabilitytoobtaindensityandconsistency.
Aschenbrener,Brown,Tran,Blankenship
28
o It is important to understand how weather conditions can affect the mixtemperature. If needed, the MultiCool software can be used to estimate theavailabletimeforcompaction.
joints. The Asphalt Institute website has more detailed information aboutspecifyingandconstructinglongitudinaljoints.
o Tackcoatsshouldbeappliedsufficientlyanduniformlytoimprovecompaction.A good tack coat application will assist compaction and provide an improvedbond,resultinginbetterlong-termperformance.
• Measurementandpaymento The in-place field density should be compared with Gmm from field-produced
SHA specification should includeanasphaltmixturedesignprocedure that canresultinworkableandcompactablemixtureswithanincentivethatisobtainableforin-placedensity.
o Utilizinggoodspecifications,thePennDOTandNYSDOTwereabletoobtaingoodin-placedensityresultsusingtheminimumlotaveragespecificationandthePWLspecification,respectively.
• Newtechnologieso WMA can be utilized to improve compaction, especially for projects requiring
longerhaultimesand/orconstructedincoldweatherconditions.o IC can be implemented tomake it easier to optimize, automate, andmonitor
compaction parameters such as rolling pattern, frequency, drum spacing,amplitude, temperature, and coverage in order to achieve higher in-placedensityandconsistency.
o IRimagingcanbedeployedtomeasurethereal-timemattemperatureandmakeadjustmentstoimprovetemperatureconsistencyandin-placedensity.
5 FIELDDEMONSTRATIONPROJECTS
TenSHAswere selected for thedemonstrationprojects throughanapplicationprocess.Eachdemonstration project was required to have a preconstructionmeeting to discuss proposedprocedures to build the test sections. The SHAs and contractors generally partnered forplanning control and test sections to evaluate the ability to obtain increased density withenhancedcompactiontoimprovepavementdurability.Thecontractorwastobuildacontrolsectionusingtheirstandardcompactiontechniquesandthenbuildatestsectionwithimprovedcompactiontechniquesusingthesameequipmentusedforconstructionofthecontrolsection.TheSHA,ifdesired,couldhavethecontractorconstructadditional test sections using additional equipment, changes in materials, mixtureproportioning,orliftthicknesses,improvedprocedures,orothermeanstoachieveimprovedin-placedensity.
Thedemonstrationprojectwaslocatedonahigh-volume,six-lanedividedinterstatehighway.Theprojectincludedacontrolsectionandtwotestsections;eachsectionwas1000feetlong.Atotal of approximately 337 tons of asphalt mixture was used in construction of the controlsectionandthetestsections.AllthreesectionswereconstructedonJune1,2016.Theprojectconsistedofmilling2.75-inchesdeepfollowedbya2-inchoverlaycoveredwitha¾-inchfrictioncourse.Thetestandcontrolsectionswereonthe2-inchoverlay.However,basedon spread rates, it appeared that the average thickness of the lower layerwas closer to 1.5inchesthantothedesired2.0inches.
5.1.2 AsphaltMixtureDesign
Thegradationusedwasa½-inchNMASblendthatwasonthefinesideoftheprimarycontrolsieve.TheprimarycontrolsieveandcontrolpointaredefinedinAASHTOM323.Thegradationshall be classified as coarse-gradedwhen it passes below the primary control sieve’s controlpoint.Allothergradationsshallbeclassifiedasfine-graded.ThereisadifferentprimarycontrolsieveandcontrolpointforeachNMAS.ThegradationsfortheasphaltmixturedesignandforproductionofthecontrolandtestsectionsareprovidedinTable1.Theaggregatesmetalltheagencyspecificationrequirements.Theasphaltmixturecontained20percentRAP.Thetargett/NMAS was 4.0 for the surface layer but was closer to 3.0 based on actual thickness. TheasphaltbinderusedforthisprojectwasapolymermodifiedPG76-22.Theasphaltmixturewasdesignedwith100gyrationsusingaSuperpavegyratorycompactor.Theoptimumasphaltcontentwas5.0percent,whichwasselectedtoachieve4.0percentairvoids for thecontrol sectionand test sections1and2.TheVMAwas required tobeat least14.0percentfortheasphaltmixturedesignandatleast13.0percentduringconstruction.TheVMAforthedesignwas14.1percent.Performancetestingwasconductedonfield-producedsamples.Thetestsonloosemixsampledin the field and compacted in the lab included theHamburgwheel-track test and the Texasoverlay test. The tests on pavement cores included the Illinois Flexibility Index Test and theNflex.NflexisatestunderdevelopmentatNCATtodeterminemixturefractureresistance.Thistestingisbeyondthescopeofthisstudy;thus,resultsarenotincludedinthereport.
Aschenbrener,Brown,Tran,Blankenship
30
5.1.3 FieldVerificationoftheAsphaltMixtureDesign
The asphalt mixture design was verified during field production based on asphalt content,gradation, and volumetric properties per the agency’s standard requirements. The resultsindicated that the gradations for each section were very similar to those from the asphaltmixture design (Table 1). The volumetric properties for the asphalt mixture design andproductionofthemixtureforthecontrolandtestsectionsareprovidedinTable2.TheairvoidsandVMAappearedtobea little lower for thetwotestsectionsthanfor theasphaltmixturedesignandcontrolsection.Table1.DesignandProductionAggregateGradations
The agency uses a PWL specificationwith a lower specification limit of 91.8 percent and anupperspecificationlimitof95.0percentofthetheoreticalmaximumdensityoffield-producedmix. For acceptance, the percent densitywas determined by comparing the in-place densitymeasuredbycorestothetheoreticalmaximumdensity.Therearefivecorespersublotandtheagencyalsohasa specification foraminimumsublotaverageof89.5percent.Thestatewidehistoricalresultshaveaveraged92.6percent.Forthedemonstrationproject,fielddensitytestingwasmeasuredusinganon-nucleardensitygaugeforqualitycontrol,butcoreswereusedforacceptance.Thetargetdensityforthecontrolsectionwassetat93.0percentofthetheoreticalmaximumdensity.Forthetestsectionsand
A Roadtec SB-2500MTV was used on this project to transfer the asphalt mixture from thetruckstotheasphaltpaver.TheasphaltmixturewashauledtotheprojectanddumpeddirectlyintotheMTV,whichthenfedintothepaver(CATAP1000D).Ittookapproximatelyonehourtoplace1000feetofasphaltmixtureinthecontrolsection,resultinginanaveragepaverspeedofapproximately17feetperminute.Thisisaslowspeedcomparedtomostpavingprojects,andthis slower speed typically results in improved density. A TransTech PQI 380 non-nucleardensitygaugewasused toquicklymeasuredensity forquality controlduring constructionofthesection.Acceptancewasbasedondensityresultsmeasuredfromcores. Theweatherduringpavingwasclearwithlittlewind,andairtemperaturesrangedfrom85to90oF.Duringcompactionofthecontrolsection,twovibratoryrollers(bothCATCB54)rolledalmostcontinuouslybutwithoutvibration.Typically,approximatelyninepasses(onetripforwardplusone trip back is two passes) of each roller was applied to the asphalt mixture. The rollersgenerallystayedclosebehindthepaverwithoneoftherollersoperatingononesideofthematandtheotherrolleroperatingontheoppositesideofthemat.Thebreakdownrollersoperatedinechelon.Therewasnobufferbetweenthesectionssothebufferwouldhavetobethefirstpartofeachconstructed section. The control section followed normal placement and compactionprocedures.Theplanfortestsection1wastoimproverollingprocedureswhileusingthesamerollersusedforthecontrolsection.Theplanfortestsection2wastoaddapneumaticrollertotherollingoperation.Testsection1wasconstructedwiththesameequipmentasforthecontrolsection.Ittookonehourtoplacethistestsectionresultinginanaveragepaverspeedofapproximately17feetperminute. There was some stopping and starting of the paver in all three sections since thedeliveryofasphaltmixturewasataslowrate.Generally,approximatelyninepassesofthetwovibratory rollers (operating statically) were used for compaction. One or two passes withvibrationwere used, believing that thiswould improve density in comparison to the controlsection,whichwasallstaticcompaction.Severaladjustmentsintherollingpatternweremadeinanattempttoimprovethedensity.Theplanfortestsection2wastocompactthemixbyaddingapneumaticroller(CATCW34)inaddition to the existing vibratory rollers. However, personnel discovered that the wateringsystemwasnotworkingproperly.Placementofthissectionbeganat13:05butthepneumaticrollerwasdelayeduntil13:50whileattemptingtosolvetheproblem.Thepneumaticrollerwaseventuallyused,butthewateringsystemwasnotabletoapplyanevensprayofwateronthetires.
Aschenbrener,Brown,Tran,Blankenship
32
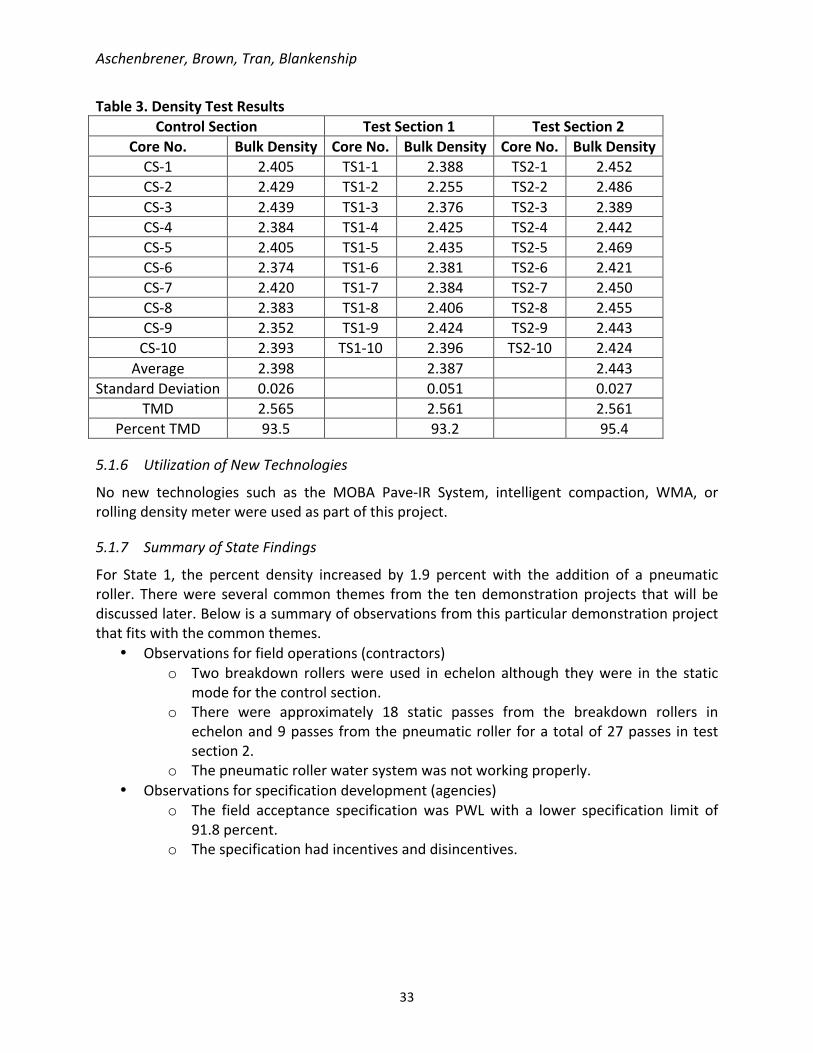
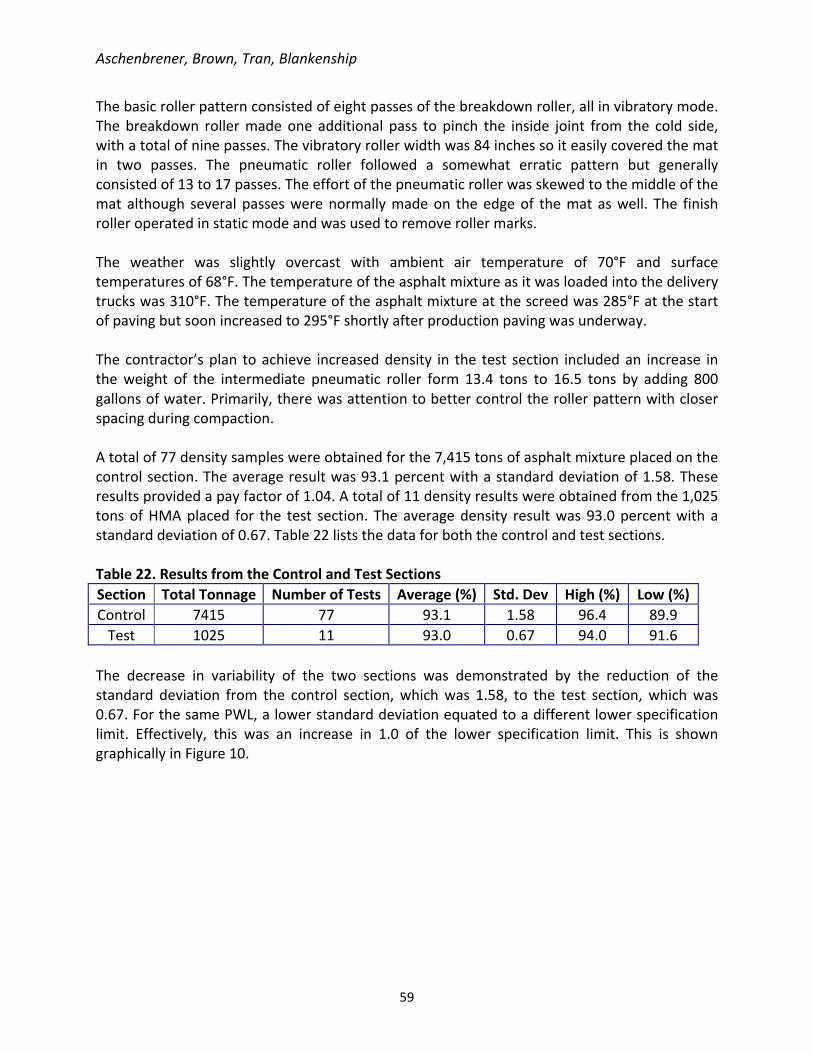
ThedensityresultsmeasuredfromcoresareprovidedinTable3.Thedensityresultsaveraged93.5 percent in the control section, 93.2 percent in test section 1, and 95.4 percent in testsection2.Thecontractorearnedthemaximumincentive.
No new technologies such as the MOBA Pave-IR System, intelligent compaction, WMA, orrollingdensitymeterwereusedaspartofthisproject.
5.1.7 SummaryofStateFindings
For State 1, the percent density increased by 1.9 percent with the addition of a pneumaticroller. Therewere several common themes from the tendemonstrationprojects thatwill bediscussedlater.Belowisasummaryofobservationsfromthisparticulardemonstrationprojectthatfitswiththecommonthemes.
• Observationsforfieldoperations(contractors)o Twobreakdown rollerswere used in echelon although theywere in the static
modeforthecontrolsection.o There were approximately 18 static passes from the breakdown rollers in
o Thepneumaticrollerwatersystemwasnotworkingproperly.• Observationsforspecificationdevelopment(agencies)
o The field acceptance specificationwas PWLwith a lower specification limit of91.8percent.
o Thespecificationhadincentivesanddisincentives.
Aschenbrener,Brown,Tran,Blankenship
34
5.2 State2
5.2.1 ProjectDescription
Thedemonstrationprojectwaslocatedonasix-lanedividedinterstatehighway.Itwaslocatedinahighlypopulatedurbanareaandsubjectedtosignificanttrafficthatprimarilyconsistedofcarsbutalsoincludedasignificantamountoftrucktraffic.Forthecontrolsection,testsections,andbuffersections,thetotal lengthofpavementwas1450feet.Thetotalamountofasphaltmixture placed in the areawith the control and test sectionswas 234 tons. ThemillingwasperformedduringthenightofAugust30,2016andtheoverlaywasplacedduringthedaytimeonAugust31.The surface condition of the pavement at the time of repair was relatively good with fewcracks, little raveling,and little rutting.Thepavementsectionconsistedofasurface layer,anasphalt intermediate course, and other underlying layers. The total pavement section is notknown,butitisestimatedthatthedesignwassufficientfor10to15yearsoftraffic.Theprojectconsistedofremoving2inchesbymillingfollowedbytheapplicationofa2-inchoverlay.
5.2.2 AsphaltMixtureDesign
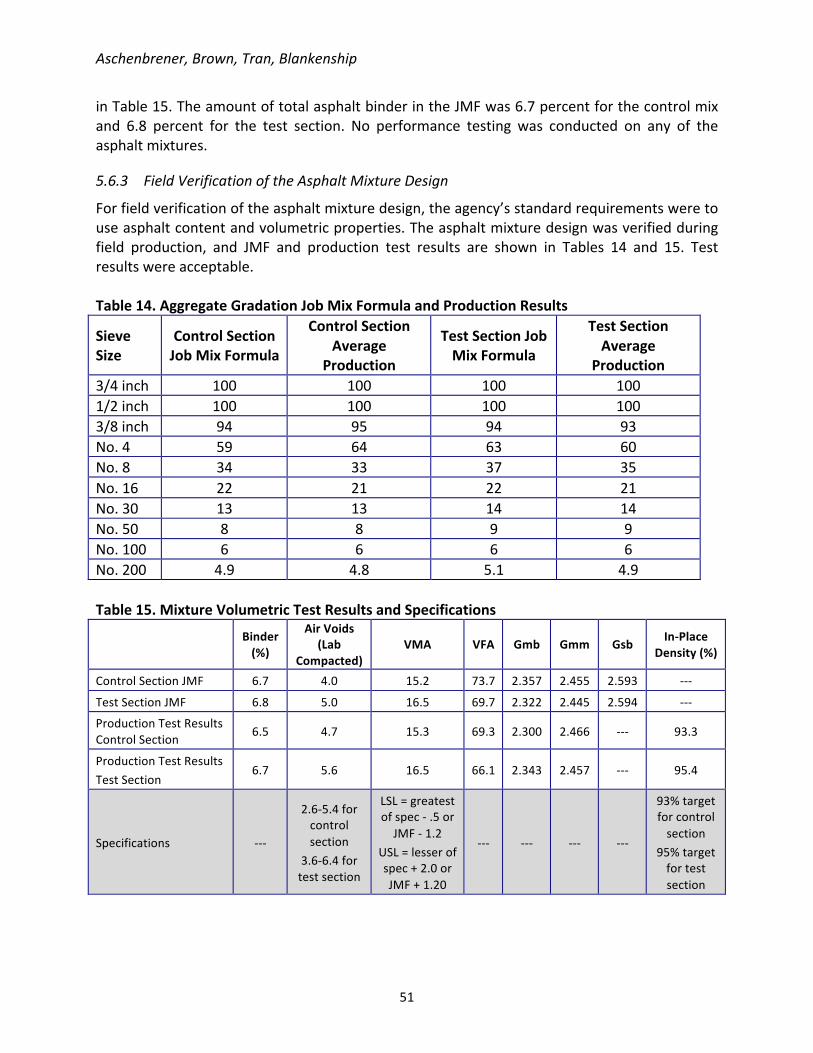
The gradationwas a½-inchNMASblend thatwas slightly on the coarse side of the primarycontrol sieve. The JMFdevelopedduring the asphaltmixture design and the production testresults are provided in Table 4 alongwith specifications forminimumandmaximumpassingeach sieve size. The aggregateswere provided by a local supplier andmet all of the agencyspecificationrequirements.TheaggregateswereallcrushedsincenonaturalsandwasusedinthemixtureexceptfortheamountofnaturalsandthatwaspossiblyavailableintheRAP.Thisasphaltmixtureincluded14percentRAP.Thet/NMASwas4.0.TheasphaltbinderwasaPG70-22andincludedanantistripadditive.The asphalt mixture design was performed with 100 gyrations using a Superpave gyratorycompactor.Theoptimumasphaltbindercontentwas5.0percentcorrespondingto4.1percentairvoids.TheVMAwas15.9percentandmettherequirementsofatleast14.0percentbutnomore than 16.0 percent. The agency requirements for gyrations, design air voids, and VMAmatchedtheAASHTOSuperpaverequirements.Noperformancetestingwasconductedonanyoftheasphaltmixtures.
5.2.3 FieldVerificationoftheAsphaltMixtureDesign
Field verification of the asphalt mixture design was conducted based on asphalt content,gradation, and volumetric properties per the agency’s standard requirements. Results of thefieldverificationareshownonTables4and5.Thesetables includetheaggregategradations,volumetricproperties,andspecificationrequirements.
The agency used a specification based on theminimum of each individual test result to begreater than 96.0 percent of a field-produced, laboratory-compacted sample (Gmb). Percentdensitywas determined by comparing the in-place densitymeasured by cores to theGmb oflaboratorysamples.Thefielddensitywasmeasuredwiththreecoresevery500feetper lane.There were no incentives, only disincentives. The statewide historical results have averaged98.5percentbasedontheGmb.For the demonstration project, field density testing was measured using a Troxler 4640-Bnucleargaugeoperatinginbackscattermode.Nucleardensityresultswerecorrelatedtocores.Thecoresweretakenatthesamelocationasnucleargaugereadingstoallowforcomparison.Percent density was determined by comparing the in-place density of the nuclear gauge orcorestothedensityoflaboratorycompactedsamples(Gmb).Atotalof14coresweretakenandtestedtodeterminethein-placedensity.
5.2.5 ControlandTestSectionConstructionandResults
EnddumptruckshauledtheasphaltmixturetoaCATAP1055Fpaveranddumpedthematerialdirectly into the paver hopper. An attempt wasmade tomonitor paver speed but this wasdifficultduetotheshortlengthofconstructionanddelays.Approximately234tonsofasphaltmixturewere placed in approximately four hours, so the production rate and average paverspeedwereveryslow.ABomag(BW161AD-5)wasusedforcompactionofthemixtureandasmaller roller, aBomag (BW138AD-5),wasusedasa finish roller. The larger rollerweighedapproximately 10 to 11 tons and the smaller roller weighed approximately 4 to 5 tons.
Aschenbrener,Brown,Tran,Blankenship
36
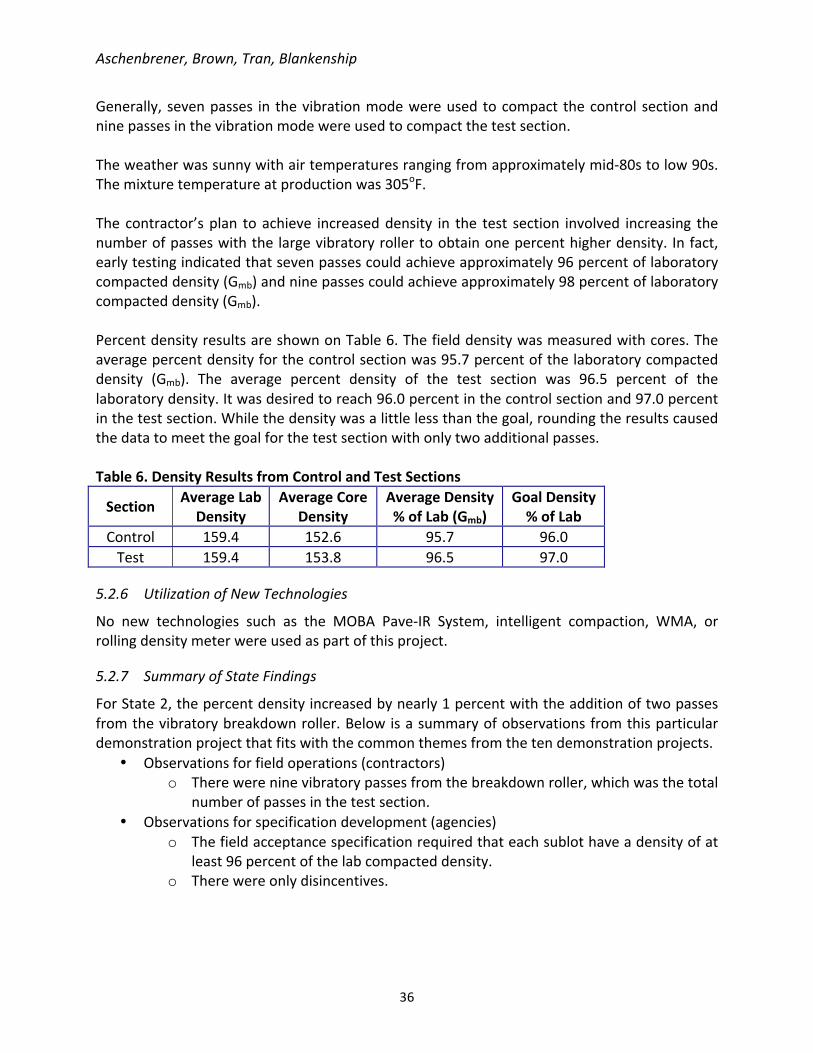
Generally, sevenpasses in thevibrationmodewereusedtocompact thecontrol sectionandninepassesinthevibrationmodewereusedtocompactthetestsection.Theweatherwassunnywithairtemperaturesrangingfromapproximatelymid-80stolow90s.Themixturetemperatureatproductionwas305oF.The contractor’splan toachieve increaseddensity in the test section involved increasing thenumberofpasseswiththelargevibratoryrollertoobtainonepercenthigherdensity. Infact,earlytestingindicatedthatsevenpassescouldachieveapproximately96percentoflaboratorycompacteddensity(Gmb)andninepassescouldachieveapproximately98percentoflaboratorycompacteddensity(Gmb).PercentdensityresultsareshownonTable6.Thefielddensitywasmeasuredwithcores.Theaveragepercentdensityforthecontrolsectionwas95.7percentofthelaboratorycompacteddensity (Gmb). The average percent density of the test section was 96.5 percent of thelaboratorydensity.Itwasdesiredtoreach96.0percentinthecontrolsectionand97.0percentinthetestsection.Whilethedensitywasalittlelessthanthegoal,roundingtheresultscausedthedatatomeetthegoalforthetestsectionwithonlytwoadditionalpasses.Table6.DensityResultsfromControlandTestSections
Section AverageLabDensity
AverageCoreDensity
AverageDensity%ofLab(Gmb)
GoalDensity%ofLab
Control 159.4 152.6 95.7 96.0Test 159.4 153.8 96.5 97.0
5.2.6 UtilizationofNewTechnologies
No new technologies such as the MOBA Pave-IR System, intelligent compaction, WMA, orrollingdensitymeterwereusedaspartofthisproject.
o Thefieldacceptancespecificationrequiredthateachsublothaveadensityofatleast96percentofthelabcompacteddensity.
o Therewereonlydisincentives.
Aschenbrener,Brown,Tran,Blankenship
37
5.3 State3
5.3.1 ProjectDescription
Twodifferentdemonstrationprojectswereconstructedontwodifferenthighways.Thesetwohighwayswerebothlocatedinruralareas.Thefirsthighway(HighwayA)hadtwolanesineachdirectionthatwereseparatedbyamedian.Theprojectlengthwas7.7miles.Atotalof24,317tons of asphalt mixture were placed on the mainline and 4,072 tons were placed on theshoulders.Workconsistedofpavingovera2.5-weekperiodinMay2016.For Highway A, the overlaywas expected to last 17 years at an expected traffic level of 10millionESALs.Theprojectconsistedofremoving2inchesofasphaltmixturebymillingandthenoverlaying with 3 inches of asphalt mixture placed in two, 1.5-inch layers. The existingpavementconsistedof4.5inchesofasphaltmixtureplacedover9inchesofconcretepavementover a 6-inch aggregate base course. Two primary variables were evaluated in these tests.These variables included using two asphalt contents (5.2 percent for two sections and 5.5percentfortwosections)andusingvaryingnumbersofrollers(fourrollersfortwosectionsandfive rollers for twosections).These two levelsofasphalt contentwereestablishedusing twogyrationlevelsasdiscussedinSection5.3.2.Thesecondhighway(HighwayB)hadtwolanesandtheprojectwas13.6mileslong.Atotalof50,182tonsofasphaltmixturewereplacedonthemainlineand5,242tonsofasphaltmixturewere placed on the shoulder.Work consisted of paving over a five-week period primarily inSeptember2016.Thedesignlifeforthispavementwas8to10yearsatanexpectedtrafficlevelof1millionESALs.Theprojectconsistedofremoving2inchesoftheexistingsurfacebymillingfollowed by adding a 3.5-inch overlay (2-inch for the underlying layer and 1.5 inch for thesurface).Theexistingpavementconsistedof6to7inchesofasphaltmixtureover7to9inchesofconcretepavement.Thebiggestdifferenceinthetwodemonstrationprojectswasthetrafficlevels.HighwayAhad10millionESALsandHighwayBhad1millionESALs.
5.3.2 AsphaltMixtureDesign
ForHighwayA, thegradationwasa½-inchNMASblend.Themixturedesignwasproprietaryinformation;hence,muchoftheinformationwasnotavailable.Thet/NMASwas3.0.ThegradeofasphaltbinderusedwasPG58-28.The design was performed using 90 gyrations and 60 gyrations with a Superpave gyratorycompactor.Thepurposeofthetwocompactionlevelswastoprovidedifferingasphaltcontentsbetween the same mixture compacted at the two gyration levels. The agency required anasphaltmixturedesignwith90 gyrations as required for the traffic level.An asphaltmixturedesign meeting the requirements at 90 gyrations was submitted by the contractor andoptimumasphaltcontentwasselectedat4.0percentairvoids.Theagencythencompactedthissame aggregate structure at various asphalt contents with 60 gyrations. Optimum asphalt
Aschenbrener,Brown,Tran,Blankenship
38
content was then selected at 4.0 percent air voids. This was called the gyratory regressionapproach.(Beawarethatsimplyloweringthenumberofgyrationswouldnotnecessarilyresultin increased asphalt content, as a contractorwould likely change the aggregate structure tokeep the asphalt content relatively low). It was determined that the difference in optimumasphalt contentwas0.3percentbetweenmixesusing the twogyration levels. Therewasnoperformancetestingconductedaspartofthemixdesign.ForHighwayB,thegradationwasa½-inchNMASblendforthecontrolsectionandtestsections1and5.Thegradationwas3/8-inchNMASblendfortestsections2,3and4.Themixdesignforthisprojectwasalsoproprietaryinformation.Thet/NMASforthe½-inchNMASwas4.0fortheunderlyinglayerand3.0forthesurfacecourse.Thet/NMASforthe3/8-inchNMASaggregatewas4.0forthesurfacecourse.ThegradeofasphaltbinderwasPG64-28forthemainlineandPG58-28fortheshoulder.The design was performed using 60 gyrations with a Superpave gyratory compactor. Noperformancetestingwasconductedoneitheroftheasphaltmixtures.
5.3.3 FieldVerificationoftheAsphaltMixtureDesign
Forfieldverificationoftheasphaltmixturedesign,theagency’sstandardrequirementsweretouseasphaltcontent,gradation,andvolumetricproperties.Althoughthiswasperformedontheproject, no results were provided by the agency. Based on discussionswith the agency, theasphaltmixturedesignwassuccessfullyverifiedinthefield.
5.3.4 DensityMeasurementandSpecification
Theagencyusedaminimumlotaveragespecification.Forwearingsurfaces,theminimumlotaveragewas92.0percentofthefield-produced,theoreticalmaximumdensity,anditwas93.0percent fornon-wearingsurfaces.Percentdensitywasdeterminedbycomparingthe in-placedensity measured by 4-inch diameter cores to the theoretical maximum density. Onlydisincentiveswereapplied;therewerenoincentives.Forthedemonstrationproject,fielddensitytestingwasmeasuredusingcoresandalsowitharollingdensitymeter(RDM),whichhadbeenrecommendedaspromisingtechnologybySHRP2research.Morethan20densitycoresweretakenonHighwayAandatotalof32coresweretakenonHighwayB.
5.3.5 ControlandTestSectionConstructionandResults
This agency constructed twodemonstrationprojects on twodifferent highways.One controlsectionwasconstructedonHighwayAalongwiththreetestsections.OnecontrolsectionwasconstructedonHighwayBalongwithfivetestsections.Forbothdemonstrationprojects, asphaltmixturewashauled to thepaving sitewithbottomdump trucks andplaced in awindrow tobepickedupand fed into thepaverhopperof theBomagpaver.AnMTVwasnotused.Thepavermovedatarateof30feetperminute.Thetack
Aschenbrener,Brown,Tran,Blankenship
39
coat material was CSS-1H. A MOBA Pave-IR System scanner was attached to the paver toevaluatethermalsegregation.AsummaryoftherollingeffortandmixpropertiesforthecontrolandtestsectionsandtheirdifferencesisshowninTables7and8forHighwaysAandB,respectively.Thepercentdensityvalues (average air voids) shown in these tables are from the RDM. As shown in Table 7,HighwayAusedfourrollersforthecontrolsection,fiverollersfortestsectionA,fourrollersfortestsectionB,andfiverollersfortestsectionC.Oneoftherollerswasanintelligentcompactor,whichcollected thedata related to theasphaltmixturedensity, stiffness,andpasses.RollersusedincludedtwoDynapacCC624steel-wheelrollers,aHammHD130oscillatoryroller,aCATCW35 pneumatic roller, and a HammGRW18 pneumatic roller. The standard rolling patternwasfivepasseseachwithtwobreakdownrollersusedinechelon,sevenpasseseachwithtwopneumatic rollers used in echelon, and seven passes by the trailing steel wheel roller invibratorymode.During compaction, someminorbreakingof theaggregatewasobservedonthepavementsurface. Itwasnotclear if thisbreakingwasduetoexcessiverollingwithsteelwheelrollers,softlimestoneaggregate,thicknessoftheasphaltmixture,orsomecombinationofthesefactors.In addition to the changes in the number of rollers, asphalt content, and NMAS, a WMAadditive,Evotherm,wasalsoevaluatedasacompactionaid.WhenaWMAadditiveisusedasacompactionaid,theasphaltmixtureproductiontemperaturesarenotlowered.OnHighwayA,theweatherandasphaltmixturetemperatureswerenotrecorded.OnHighwayB,theweatherwas50°F,mostlysunny,andbreezy.Theasphaltmixturetemperatureswerenotrecorded.The average density for all of the sections was approximately 94.0 percent of theoreticalmaximumdensityusing theRDM.However,whenusingcores to compare thecontrol to thetestsection,oneofthetestsectionswasnotablydifferent.Thepercentdensity increased1.2percentwhentheasphaltmixturedesignhad0.3percentadditionalasphaltandanadditionalroller.Test section 1 for Highway B was the only density from the RDM that appeared to besignificantly different from theother results, andeven this onewasnotmuchdifferent. Thedensityofthissectionwas94.9percentoftheoreticalmaximumdensitywhilealloftheothersections were closer to 94.0 percent density. Even though a number of test sections wereconstructed,thedensityofeachtestsectionwasverysimilartoallothertestsectionsandtothecontrolsection.Thedensityofallsectionswasverygood(93.5to94.9percentofTMD)soitwas likely that sufficient compaction effort was applied to adequately compact all of thedifferent sections, even though some of them were likely significantly more difficult tocompact. Hence, increasing rolling or any other approach evaluated did not significantlyincreasethedensitybasedontestresultswiththeRDM.TheRDMdatawasprovidedhereforinformation.
Aschenbrener,Brown,Tran,Blankenship
40
Table7.TestPlanforHighwayA
Table8.TestPlanforHighwayB
Section NMAS(in.) NumberofRollers
UseofEvotherm
AverageIn-placeAirVoids
ControlSection ½ 3 No 6.3TestSection1 ½ 4 No 5.1TestSection2 3/8 3 No 6.4TestSection3 3/8 4 No 5.8TestSection4 3/8 3 Yes 6.3TestSection5 ½ 3 Yes 6.2
Whileallofthesetechnologieswereusedonthisproject,therewasnotenoughworktofullyevaluatetheacceptabilityofeachofthesetechnologies.However,anexampleofthebenefitofintegratingthesetechnologieswasdemonstrated.AsshowninFigure9,thereareresultsfromthree of the technologies asmapped in the same location: [A] RDMdielectric constants, [B]paverspeed,and[C]MOBAPave-IRthermaltemperaturescanner.
2. Region2hadalowerdensity[Ainyellowandorange]thanregion1.Althoughtherewasa slower paver speed of 10 to 20 feet perminute [B in orange and yellow], themattemperaturewasmuchcoolerat250oF[Cingreen].
3. Region 3 had the lowest density of all [A in yellow, green and light blue]. The paverspeed approached 50 feet per minute [B in dark green and blue] and the mattemperaturewasinthe250to275oFrange[Cinyellowandgreen].
Real-time density, paver speed, and temperature data were demonstrated to be invaluablequalitycontroltoolsforthecontractorwhentroubleshootingandanalyzingresults.
5.3.7 SummaryofStateFindings
ForHighwayAinState3,thepercentdensityincreasedby1.2percentasmeasuredbycores.The test section included an additional roller and an engineering adjustment to the asphaltmixturedesignresultinginanincreasedasphaltcontentof0.3percent.Belowisasummaryofobservationsfromthisparticulardemonstrationprojectthatfitswiththecommonthemesfromthetendemonstrationprojects.
Thedemonstrationprojectwas locatedona rural, two-lane statehighwaywith12-footwidelanes and5-foot shoulders. The traffic volumeused fordesignwas2 to8millionESALs. Thetotallengthofpavementcontainingthecontrolandtestsectionswasapproximately11.9miles.Justover20,000totaltonswereplacedforthisprojectwithapproximately2500tonsplacedforeachof theeight sections. These sectionswere constructedbetween July25andAugust16,2016.Forover95percentof theproject, thepavementsectionconsistedofmilling2 inchesbelowthe surface and removing thematerial. An additional 6 inches ofmaterialwere removed bymillingandreplacedascoldmix.Aftercompletingplacementofthecoldmix,a4-inchoverlayofasphaltmixturewasplaced.Thebottomliftwas2.25-inchesthickandthetopliftwas1.75inches. For the remainderof theproject (less than5percent), two inchesofasphaltmixturewereremovedbymillingandreplacedwitha2-inchoverlay.Theexistingpavementcontained8to 9 inches of asphalt mixture, some of which was placed over an asphalt stabilized basecourse,whiletheremainderoftheoverlaywasplacedoveracrushedaggregatebasecourse.
5.4.2 AsphaltMixtureDesign
Thegradationswere½-inchand3/8-inchNMASblendsandbothwereslightlyonthefinesideoftheprimarycontrolsieve.Thedesignaggregategradationsforthe½-inchand3/8-inchNMASasphaltmixturesareshownonTables9and10,respectively.Theaggregateswereprovidedbya local supplier and met all of the agency specification requirements. This was all crushedmaterial sincenonatural sandwasused in themixtureexcept fora smallamountofnaturalsand thatmayhavebeen includedasaportionof theRAP.The½-inchmixturecontained19percentRAPwhilethe3/8-inchmixturecontained8percentRAP.Thet/NMASwas4.5forthebaseliftand3.5forthesurfacelift.ThegradeofasphaltbinderusedwasPG58-28.Theasphaltmixturewasdesignedusing75gyrationswiththeSuperpavegyratorycompactor.ThevolumetricpropertiesoftheJMFareprovidedinTable11.TheminimumVMArequirementwas0.5percenthigherthantheAASHTOSuperpaverequirements.Thedesignairvoidcontent
Aschenbrener,Brown,Tran,Blankenship
43
for the control section was 4.0 percent but was adjusted to 3.0 percent using the air voidregressiontechniqueasmentionedpreviouslyfortestsections2,3,and6.Thisresultedin0.3percenthigherasphaltcontentforthosetestsections.
5.4.3 FieldVerificationoftheAsphaltMixtureDesign
Forfieldverificationoftheasphaltmixturedesign,theagency’sstandardrequirementsweretouse asphalt content, gradation, and volumetric properties. The asphalt mixture design wasverified during field production. The asphaltmixture design and field verification volumetricpropertiesalongwiththespecificationsareprovidedinTable11.Table9.DesignAggregateGradationfor12.5-mmNMASwithUpperandLowerLimits
The agency used aminimum lot average specification of 91.5 percent of the field-produced,theoretical maximum density. Percent density was determined by comparing the in-placedensitymeasured by nuclear gauge results to the theoreticalmaximumdensity. The nucleargauge results were not correlated to cores. Only disincentives were applied; there were noincentives.Forthedemonstrationprojecttheagencymeasuredin-placedensityofthesectionsbytakingcoreswhile the contractormeasured the in-place densitywith a nuclear density gauge. Thecontractor’snucleargaugeresultswerecorrelatedtocoredensitytesting.Theagency’stestingwasnotveryextensivesotheagencyelectedtoreportthecontractor’snucleargaugedensityresults. The cores were taken at the same location as nuclear gauge readings to allow forcomparison. All field density results were compared to the theoretical maximum density todeterminepercentdensity,andthisisreportedinTable11.
Aschenbrener,Brown,Tran,Blankenship
45
5.4.5 ControlandTestSectionConstructionandResults
The12-milesectionofroadwayasphaltpavementwasdividedintoapproximatelyeightequalsections including a control section and seven test sections. The control section was placedusingnormalcompactionproceduresandhadaminimumdensityrequirementof91.5percentoftheoreticalmaximumdensity.Theplanforeachtestsectionisdescribedbelow.
• The first test sectionwas to increase the density by 1.0 to 2.0 percent by increasingcompactiveeffort.
• The second test sectionadjusted theoptimumasphalt content in themixturedesign.Optimumasphaltwasselectedat3.0percentairvoidsinsteadof4.0percentairvoidstoincreasetheamountofasphaltbinderinthemixture.Thiswascalledadesignairvoidregressiontechnique.
• Thethirdtestsectionstrivedtoachieve1to2percenthigherdensitybyincreasingtheasphalt binder with the air void regression technique and by adding additionalcompactiveeffort.
• ThefifthtestsectionwasconstructedusingthesamemixtureasinthecontrolsectionandaddingWMAadditivebutusing the samemixproduction temperatureas for thecontrolsection.
Asphaltmixturewas hauled to the project and fed into the paver hopperwith anMTV. ThecontrolsectionusedaTerexCR662MMTVtofeedtheasphaltmixture intoaRoadTecRP190paver thatutilizeda jointheater. For test section1, aWeiler E2850MTVwasused. For testsections 2 and3, a CedarRapids 18118MTVwasused to feed thematerial into the asphaltpaver.Fortestsections4through7,theWeilerE2850MTVwasagainused.Thepaveroperatedat a slowwalking speed. Several rollers were available for compaction and therewas someswitchingofrollersforsomeofthesections.Generally,fourrollerswereusedforcompactionofthesections.Thereweretwobreakdownvibratoryrollersusedinechelon.Generally,fivetosevenpasseswereusedwitheachvibratoryroller,11to13passeswiththepneumaticroller,and seven to nine passes with the finish roller. However, test sections 1 and 3 used anadditionalvibratoryrollerinanattempttoimprovecompaction.TherollersavailableincludedaDynapacCC624HFvibratoryroller,VolvoDV140Bvibratoryroller,HammGRW280pneumaticroller,andCaseDV210steelwheelroller.Theasphaltmixturetemperatureatthepaverwasgenerallyapproximately260oFforthehot-mixasphaltsectionsand220oFfortheWMAsections.Thesectionswereplacedduringwarmweather.Thehightemperatureforeachdayofproductionrangedfrom79to89oFanditwassunnyonmostdays.Someraindidoccurduringthedaywhentestsection6wasplaced.
Aschenbrener,Brown,Tran,Blankenship
46
The control section was compacted to an average density of 93.5 percent of theoreticalmaximum specific gravity, which exceeded the specification requirements of at least 91.5percent of theoretical maximum density. Efforts to increase the density in test sections 1through7weresuccessfulinsomecases.Testsections4,5,and6werecompactedtoadensityapproximatelyequaltothatachieved inthecontrolsection.Testsections1,2,3,and7werecompactedtodensitiesbetween1and2percenthigherthanthecontrolsection.Testsections4,5,and6allusedaformofWMAadditive,andforthisproject,thisdidnotresultinimproveddensity.Increasingtheoptimumasphaltcontentandincreasingcompactiveeffortdidresultinimproveddensity.Testsections1and3usedanadditionalrollerforatotaloffiverollers.
5.4.6 UtilizationofNewTechnologies
AWMAadditivewasusedonseveralofthetestsections.TheuseoftheWMAadditivedidnotresult in improved density. None of the other new technologies such as theMOBA Pave-IRSystem,intelligentcompaction,orrollingdensitymeterwereusedaspartofthisproject.Ajointheaterwasusedonthisproject.Thiswasnotnewtechnologybutthisapproachhadnotbeenusedveryoftenand therewasnota lotofdataon itsuse. Itwasnotclear if this jointheaterimproveddensityinthejoints.
5.4.7 SummaryofStateFindings
For State 4, the percent density increased by 1.9 percent with an additional roller and anengineeringadjustmenttotheasphaltmixturedesignresultinginanincreasedasphaltcontentof0.3percent.Belowisasummaryofobservationsfromthisparticulardemonstrationprojectthatfitswiththecommonthemesfromthetendemonstrationprojects.
The demonstration project was on a rural, two-lane state highway. The total length of theprojectwasfourmiles.Thetotal lengthofthecontrolsectionandallofthetestsectionswasapproximately one mile. Just over 9,000 total tons were placed for this project withapproximately1,200tonsplacedinthecontrolsectionplusallofthetestsections.Theleveling
Aschenbrener,Brown,Tran,Blankenship
47
course forall sectionswasplacedonOctober19and20,2016and thesurfacecourse forallsectionswasplacedonOctober25.Thepavementsectionconsistedofa1.5-inchlevelcoursefollowedbya2-inchsurfacecourse.The existing pavement had some thermal cracking, longitudinal cracking, delamination, andraveling.
5.5.2 AsphaltMixtureDesign
Thegradationusedwasa½-inchNMASblendthatwasslightlyonthefinesideoftheprimarycontrolsieve.TheJMFdevelopedfortheasphaltmixturedesignisprovidedinTable12alongwith the average production gradations. The aggregateswere provided by a local aggregatesupplierandmetalloftheagencyspecificationrequirements.Theaggregateblendcontained30percentnaturalsandandtheremainderoftheaggregatewascrushed.NoRAPwasusedinthemixes.Thet/NMASwas4.0forthesurface layer.TheasphaltbinderusedforthisprojectwasaPG64-22.The asphalt mixture design was performed using 50 gyrations with a Superpave gyratorycompactor.Twoasphaltmixturedesignsweredevelopedusingthesameaggregategradation.The firstdesignwasperformedtoprovide4.0percentairvoidsandwasusedfor thecontrolsectionandtestsection1.Forthesecondasphaltmixturedesign,theoptimumasphaltcontentwasdeterminedat3.0percentairvoidsusingairvoidregression.Thevolumetricsforthetwodesigns along with in-place density results are provided in Table 13. The optimum asphaltbinder content for the first mixture was 5.3 percent designed at 4.0 percent air voids. Theoptimumasphaltbindercontentforthesecondmixturewas5.6percent,whichwasdesignedtoprovide3.0percentairvoids.TheVMAwasrequiredtobeatleast14.5percentduringmixdesign and at least 14.0 percent during construction. The VMA for the first asphaltmixturedesign was 14.8 percent and for the second was 14.7 percent. The TSR was 0.90 for bothdesigns(itappearedthattheTSRtestingwasconductedforoneofthedesignsandtheresultswere used for both designs). TheminimumTSRwas required to be at least 0.80 duringmixdesign and at least 0.75 during construction. The resultsmet these requirements. Hamburgwheel-tracktestingwasconductedonsamplescompactedto94percenttheoreticalmaximumspecific gravity and showed no potential rutting problems for the mixtures. The Hamburgresultsonthetwomixtureswereapproximatelythesameeventhoughonemixturehadmoreasphaltbinder.
5.5.3 FieldVerificationoftheAsphaltMixtureDesign
Forfieldverificationoftheasphaltmixturedesign,theagency’sstandardrequirementsweretouse asphalt content, gradation, and volumetric properties. The asphalt mixture design wasverified during field production and results are shown in Tables 12 and 13. The verificationincludedtheJMF,productiontestresults,andin-placedensity.Resultsduringproductionwereacceptable.
The agency used a PWL specificationwith a lower specification limit of 92.0 percent and anupper specification limitof97.0percentof the field-produced, theoreticalmaximumdensity.Percentdensitywasdeterminedbycomparingthe in-placedensitymeasuredbycores to thetheoretical maximum density. Incentives and disincentives were applied. The statewidehistoricalresultshadaveraged93.3percent.For the demonstration project, field density testing was measured using a nuclear densitygaugeforqualitycontrolbutcoreswereusedforacceptance.
Aschenbrener,Brown,Tran,Blankenship
49
5.5.5 ControlandTestSectionConstructionandResults
ATerexCR662RMMTVwasusedonthisprojecttotransfertheasphaltmixturefromthetruckstotheasphaltpaver.TheasphaltmixturewashauledtotheprojectanddumpeddirectlyintotheMTV,whichthenfedthepaver.Forthecontrolsection,fourrollerswereusedapplyingfivepasseseachwithtwo15-tonvibratoryrollers inechelon,fivepasseswitha12-tonpneumaticroller,andthreepasseswitha12-tonstaticsteelwheelroller.Fortestsectionnumber1,threerollerswereusedapplying fivepasseseachwithtwo15-tonoscillatoryrollers inechelonandfivepasseswitha15-tonstaticsteelwheelroller.Theoscillatoryrollerwasusingbothvibrationandoscillation.Fortestsection2,fourrollerswereusedapplyingfivepasseseachwithtwo15-tonvibratoryrollers,fivepasseswitha12-tonpneumaticroller,andsevenpasseswitha12-tonstaticsteelwheelroller.Thecontractor’splanwastocompactthecontrolsectionusingnormalcompactionprocedures.Theplan for test section1was touseoscillatory rollers inplaceof thevibratory rollers. Theplanfortestsection2wastoincreasetheasphaltcontentapproximately0.3percenttoallowforeasiercompaction. Intestsection3,someworkwasperformedwithaWMAadditivebutverylittleresultswereprovidedtodocumentthissection.Each of the sections (control and test sections) were 1000 feet long with 500 foot buffersbetweenthesections.Therewasnobufferbetweentestsection2andtestsection3andthelength of test section 3 was 805 feet. Approximately 350 tons were placed in the controlsection,300tonsintestsection1,250tonsintestsection2,and161tonsintheabbreviatedtestsection3.The average compaction in the control section was 92.5 percent, which met the minimumspecifieddensity requirements. Thedensity result for test section1was93.2percent,whichwasaslightincreaseoverthedensityobtainedinthecontrolsection.Thedensityresultintestsection2was95.2percent,whichwasapproximatelya2.7percent increaseover thecontrolsection.
5.5.6 UtilizationofNewTechnologies
AWMAadditivewasusedintestsection3butverylittletestingwasconductedtodeterminethechangeindensityresultsinthistestsection.NoothernewtechnologiessuchastheMOBAPave-IR System, intelligent compaction, or rolling density meter were used as part of thisproject.
5.5.7 SummaryofStateFindings
ForState5,thepercentdensityincreasedby2.7percentwithanengineeringadjustmenttotheasphalt mixture design resulting in an increased asphalt content of 0.3 percent. Below is asummaryofobservationsfromthisparticulardemonstrationprojectthatfitswiththecommonthemesfromthetendemonstrationprojects.
ThedemonstrationprojectwaslocatedonaUShighway.Itwasanurbanarterialinacitywithasmallpopulation.Therewereseveralbusinesses,andhence,therewasarelativelyhighamountof car traffic with a small percentage of trucks. The AADT was estimated at 17,790 with 5percent trucks. The total length of pavement used for the control and test section wasapproximatelynine lanemiles (approximately1.8centerlinemiles).Approximately5,400tonsofasphaltmixturewereplaced.Theentireprojectwasfinishedinsevenworkingdaysinearlytomid-November2016.Theexistingpavementhadmoderatedeteriorationwithsomeraveling,weathering, cracking,andrutting.Thispavementhad5inchesofasphaltpavementoveranoldconcretepavement.The structure was considered adequate with no need for improvement, hence, milling andoverlaywas selected for the repair. The project consisted of removing 1.5 inches bymillingfollowedbytheapplicationofa1.5-inchoverlay.
5.6.2 AsphaltMixtureDesign
Thegradationwasa3/8-inchNMASblendonthecoarsesideoftheprimarycontrolsieve.TheJMF and the production test results are provided in Table 14 along with specifications forminimumandmaximumpercentpassingeach sieve size. Theaggregateswereprovidedbyalocalsupplierandmetagencyspecificationrequirements.Thecontrolmixturehad22percentnaturalsandandthetestsectionusedallcrushedmaterialexceptfortheuncrushedmaterialthatmighthavebeenincludedintheRAP.Theasphaltmixtureforthecontrolsectionincluded14.5percentRAPand3.0percentRAS.Themixforthetestsectionincluded14.1percentRAPand2.9percentRAS.Thet/NMASforbothsectionswas4.0.TheasphaltbinderwasaPG70-22anditwasnotpolymermodified.The asphaltmixture designwas performed using 100 gyrationswith the Superpave gyratorycompactor for the control section and 50 gyrations for the test section. Themixture for thecontrolsectionwasdesignedtohave4.0percentvoidsandthemixtureforthetestsectionwasdesigned to have 5.0 percent voids. The specifications required that theVMAbe at least 15percentintheasphaltmixturedesignforthecontrolsectionandatleast16percentforthetestsection.Thevolumetricpropertiesfortheasphaltmixturedesignandconstructionareprovided
Aschenbrener,Brown,Tran,Blankenship
51
inTable15.TheamountoftotalasphaltbinderintheJMFwas6.7percentforthecontrolmixand 6.8 percent for the test section. No performance testing was conducted on any of theasphaltmixtures.
5.6.3 FieldVerificationoftheAsphaltMixtureDesign
Forfieldverificationoftheasphaltmixturedesign,theagency’sstandardrequirementsweretouseasphaltcontentandvolumetricproperties.Theasphaltmixturedesignwasverifiedduringfield production, and JMF and production test results are shown in Tables 14 and 15. Testresultswereacceptable.Table14.AggregateGradationJobMixFormulaandProductionResults
TheagencyusedaPWLspecificationwithalowerspecificationlimitof91.0percentofthefield-produced,theoreticalmaximumdensity.Percentdensitywasdeterminedbycomparingthein-place density measured by cores to the theoretical maximum density. Incentives anddisincentiveswereapplied.Toavoiddisincentives, itwasgenerallyrequiredtoobtainat least93.0percentdensityinthecontrolsectionandatleast95.0percentdensityinthetestsection.Statewidehistoricalresultshaveaveragedat93.0percent.Forthedemonstrationproject,fielddensitytestresultsweredeterminedfromcorestestedbytheagencyandbythecontractor.Densitytestingwasconductedbytwolabs(contractorandagency) and for two sections (control and test sections). Each set of tests used 10 cores todeterminetheaveragedensity.Hence,atotalof40coreswereusedtodeterminethedensity.All20coresfromthecontrolsectionwereaveragedandresultsareprovidedinTable15.Thesamemethodwasusedfordeterminingtheaveragedensityofthetestsection.
5.6.5 ControlandTestSectionConstructionandResults
End dump trucks hauled the asphalt mixture to the paver and dumped the material into aRoadtec SB 2500MTV, which fed thematerial into the paver hopper. A joint adhesive wasappliedtothepavementedgewhereanadjacentlanewastobeplaced.Thisadhesivedidnotimprovecompactionbutthegoalwastosealthejoint.Compactionwasprovidedwithtwo,10-tonvibratoryrollers(CATCB534)inechelon.Eachrollerprovidedfivevibratorypassesandtwostaticpasses. The same typeof steelwheel rollerwasused for finish rollingandapplied fivestaticpasses.Thetemperatureduringthedaysofworkvariedfromalowof37oFtoahighof59oF,asshowninTable16.Table16.TemperaturesduringConstructionDate AmbientTemperature,oFNov9 43to52Nov10 41to59Nov11 43to54Nov12 37to48Nov14 39to57Thecontractor’splanwastousestandardprocedurestoplaceandcompacttheasphaltmixturefor thecontrol section.Theplanwas to thenmodify theasphaltmixturedesignasdiscussedunder“AsphaltMixtureDesign”toprovideanasphaltmixturethatwasmorecompactibleforthetestsection.Thedifference inasphaltcontentbetweenthetwomixtureswasonly0.1to0.2 percent but the resulting difference in density was significant. There was also somedifference in the aggregates used and gradation of the blend. There were no significantdifferencesinrollingproceduresbetweenthecontrolandthetestsections.
Aschenbrener,Brown,Tran,Blankenship
53
A total of 40 coreswere taken for density testing for the two sections. The average density(basedoncores)forthecontrolsectionwas93.3percentoftheoreticalmaximumdensity.Theaveragedensity of the test sectionwas95.4percentof theoreticalmaximumdensity. Itwasdesired to reach a density of 93.0 percent of theoretical maximum density for the controlsection and at least 95.0 percent of theoretical maximum density for the test section. Thespecifieddensityrequirementsweremet.
o Therewasanengineeringadjustmenttotheasphaltmixturedesignresultinginslightly increased asphalt content. Adjustments were made to the designgyrations,airvoids,andVMA.
o The field acceptance specificationwas PWLwith a lower specification limit of91.0percent.
o Thespecificationhadincentivesanddisincentives.
5.7 State7
5.7.1 ProjectDescription
Thedemonstrationprojectwaslocatedonamajorarterialstatehighwayhavingadesignspeedof45milesperhour.Thevolumeoftrafficwasestimatedtobe14,500averagedailytrafficand6 percent trucks. The project was approximately 3.5 miles long and had several turninglocations along the route. Approximately 9,500 tons of asphalt mixture were placed anddefinedbyfourlots.ThefirstthreelotswerecompletedbetweenJune6andJune14,2016.Lot4wascompletedbetweenJuly19andJuly21.The existing pavementwasmilled down approximately 2 inches, patchingwas performed insomelocalizedareas,andascratchcoarseapproximately½-inchthickwasplacedfollowedbya1.5-inchoverlayplacedontop.
Aschenbrener,Brown,Tran,Blankenship
54
5.7.2 AsphaltMixtureDesign
Thesameasphaltmixturedesignwasusedforallfourlots.Thegradationwasa3/8-inchNMASblend that was slightly on the coarse side of the primary control sieve. The JMF developedduringtheasphaltmixturedesignandtherangeofproductiontestresultsareprovidedinTable17.Theaggregatesmettheagencyspecificationrequirements.Themixtureincluded15percentRAP. The t/NMAS for all four lotswas 4.0. The virgin asphalt binderwas a PG 76-22. ItwaspolymermodifiedandincludedaWMAadditive.Theasphaltmixturewasdesigned for0.3 to3millionESALs.Theasphaltmixturedesignwasperformedusing75gyrationswiththeSuperpavegyratorycompactor.Themixtureforallfourlotswasdesignedtohave3.5percentairvoids.TheVMArequirementwasalsoaminimumof15.5percent,whichis0.5percenthigherthantheAASHTOSuperpavestandard.Theamountoftotal asphalt binder in the JMF was 6.2 percent. The volumetric properties for the asphaltmixturedesignandtherangeoftestresultsduringconstructionareprovided inTable18.Noperformancetestingwasconductedonanyoftheasphaltmixtures.
For thecontrol sections, theagencyusedtheir standardspecificationbasedontheminimumandmaximumofeachindividualsublotwherethedensitytestresultmustbebetween92.0and97.0percenttheoreticalmaximumdensity.Onecorewastakenfromeachsublotinallfourlots.Mostcommonly,therewerefivesublotsperlot.Onlydisincentivesareapplied;therewerenoincentives. This specification was also used for the control section. The statewide historicalresultshaveaveraged93.6percent.For the test sections, the agency used their pilot PWL specification with lower and upperspecificationlimitsof92.0and98.0percenttheoreticalmaximumdensity.Atleast90percentof the test results were required to be within these limits to achieve 100 percent pay.Incentivesanddisincentiveswereapplied.ThedensityresultsareprovidedinTable19.Table19.DensityTestResultsforeachSublot
End dump trucks hauled the asphaltmixture to the paver and dumped thematerial into anMTV (Roadtec SB 1500),which fed thematerial into the paver (CAT AP 1055F) hopper. Thepaver operated at a slow walking speed. A notched wedge joint was used to facilitateconstruction of the longitudinal joint. Compaction was provided with three vibratory rollers(two Cat CB 54B rollers and one SakaiWS800) in echelon. Each vibratory roller applied fourvibratorypassesandonestaticpass.Anotherrollerfollowingasimilarrollerpatternwasusedtoprovidecontinuouscompactionofthelongitudinaljoint.The air temperatures varied from a low of 45 to a high of 88oF during construction of theproject as shown in Table 20. Low temperature varied from 45 to 64oF and the hightemperaturevariedfrom62to79oFforthefirstthreelots.Thelowtemperaturevariedfrom59
Aschenbrener,Brown,Tran,Blankenship
56
to67oFandthehightemperaturevariedfrom77to88oFforlot4.ThemixtemperaturewhenaddedtotheMTVgenerallyrangedfrom285to300oF.Table20.TemperaturesduringConstructionDate AmbientTemperature,oFJun6 64to79Jun7 63to64Jun9 45to62Jun10 47to75Jun13 58to62Jun14 52to67Jul19 67to77Jul20 59to88Jul21 59to87Thefourlotshadvaryingnumbersofsublotswitheachsublotrepresenting400to500tonsofasphaltmixture.Lotnumbers1and2eachhadfivesublots, lot3hadthreesublots,andlot4hadsevensublots.Atotalof20densitytestswereconductedforthefourlots(fiveforlot1,fiveforlot2,threeforlot3,andsevenforlot4).Theaverageofdensitytestsforlot1was94.4withastandarddeviationof2.7.Theaverageforlot2was96.1withastandarddeviationof0.6.Theaveragedensityfromlot3was96.2withastandarddeviationof0.8.Theaveragedensityforlot4was96.1withastandarddeviationof1.0.Thiswouldseemtoindicatethatlot1,constructedtomeettheexistingminimumindividualsublotspecification,reachedalowerdensitythanlots2-4, whichwere constructed tomeet the specification being considered for adoption. All ofthesesampleswererandomlyselectedandtherewerenooutliers.Acloserlookshowsthatthefirsttwotestsinlot1weresignificantlylowerthanthelastthreetestsinthelot,whichwereclosertothedensityinlots2to4.Also,thepavementintheareawherethefirsttwosublotswereplacedwasplacedwithpaversinechelonwithoutadditionalrolling;itisbelievedthatthisisthereasonthatthedensityforthesetwotestresultswaslower.Also,therewasnoapparentchangeincompactionproceduresbetweenlot1andlots2to4,soeven though the specificationwas different between lot 1 and the other lots, therewas nodifferenceincompactionequipmentorproceduresused,sotherewasnoreasontobelievethatthedensityinlot1wouldbedifferentfromtheotherlots.Therewasasignificantdifferenceinthestandarddeviation.Fortheminimumindividualsublotspecificationwithfivesublotsper lot,thestatewideaveragestandarddeviationwas1.55.ForthepilotPWLspecificationwithfivesublotsperlot,thestatewideaveragestandarddeviationwas0.95.TheuseofthenewpilotPWLspecificationdemonstratedanincreasedconsistency.
For State 7, the percent density increased only slightly with the new PWL specification, buttherewasasignificantimprovementinconsistencyasmeasuredbythestandarddeviation.Thestandarddeviationwasloweredfrom1.55to0.95forstatewideaverages.Belowisasummaryofobservations fromthisparticulardemonstrationproject that fitswiththecommonthemesfromthetendemonstrationprojects.
o The field acceptance specification for the test section was PWL with a lowerspecificationlimitof92.0percent.
o On projects using the pilot PWL specification, the standard deviation wassignificantlylower.
o Thespecificationhadincentivesanddisincentives.
5.8 State8
5.8.1 ProjectDescription
The demonstration project was located on a four-lane principal arterial that was part of anurban areawith a larger population. The 2015 AADT for the test sectionwas 30,746with 6percenttrucks.Theprojectwasoversixmileslongandthecontrolandtestsectionswere1.5miles long.Thetotalquantityofasphaltmixtureproducedforthisprojectwasapproximately8,440tons.ItwaspavedatnightbetweenJuly13andAugust10of2016.Theexistingasphaltpavementcontaineda1.8-inchasphaltsurfacepavedin2001.Itwasplacedover 4.8 to 6 inches of asphalt pavement, over 4.2 inches of asphalt treated base, over 3.6inches of untreated base. The pavement was in fair condition with low tomedium severityalligator cracking, low and medium severity longitudinal cracking, low severity transversecracking, and low severity patching. The plans generally called for milling with a 1.8-inchoverlay.
5.8.2 AsphaltMixtureDesign
The gradationwas a½-inchNMASblend thatwas slightly on the coarse side of the primarycontrol sieve. The aggregates were provided by a local supplier and met all of the agencyspecificationrequirementsincludingsandequivalent(54percent),uncompactedvoidsforfineaggregate(46percent),andpercentfractureforcoarseaggregate(100percent).Therewerenorecycledmaterialsintheasphaltmixture.Thet/NMASwas3.6.TheasphaltbinderwasaPG64-22.The mix design used 100 gyrations with the Superpave gyratory compactor. The optimumasphaltbindercontentwas5.7percentandwasselectedat4.0percentairvoids.TheVMAof
Aschenbrener,Brown,Tran,Blankenship
58
16.4 percent exceeded theminimum of 14.0. The gyrations, design air voids, andminimumVMA matched the AASHTO Superpave requirements. The Hamburg wheel-track testing wasusedasaperformancerequirement.
5.8.3 FieldVerificationoftheAsphaltMixtureDesign
Forfieldverificationoftheasphaltmixturedesign,theagency’sstandardrequirementsweretouse asphalt content, gradation, and volumetric properties. The asphalt mixture design wasverified during field production and results are shown in Table 21. This table includes theasphaltcontentandvolumetricpropertiesalongwiththeirupperandloweracceptancecriteria,standarddeviation,andmeanresults.Table21.FieldVerificationResultsoftheAsphaltMixtureDesigns Binder
TheagencyusesaPWLspecificationwiththe lowerspecification limitof91.0percentandanupperspecificationlimitof100.0percentofthefield-produced,theoreticalmaximumdensity.Percent densitywas determinedby comparing the in-placedensitymeasuredby thenucleargauge to the theoretical maximum density. The nuclear gauge was correlated to cores. Thefield-produced theoretical maximum density was determined using a moving average. Thefrequencyoftesting isgenerallyevery100tons. Incentivesanddisincentivesareapplied.Thestatewide historical results have averaged approximately 93.0 percent with a standarddeviationof1.39.Forthedemonstrationproject,fielddensitytestingwasmeasuredusingaTroxler3450nucleargauge operating in direct transmissionmode at a depth of 2 inches. More than 75 nucleardensitymeasurementsweretakenonthecontrolsection,andatotalof11weretakenonthetestsection.
5.8.5 ControlandTestSectionConstructionandResults
Thedemonstrationprojectinvolvednightpaving.EnddumptruckshauledasphaltmixturetoaWeiler E2850 MTV, which remixed the asphalt mixture before transferring into the CATAP1055E paver. A traditional rolling trainwas used. The breakdown rollerwas a CAT CB68Bvibratory,steel-wheelroller.TheintermediaterollerwasaDynapacCP30pneumaticrollerwithaCATCB54Bsteel-wheelfinishrolleroperatinginanon-vibratorymode.
Aschenbrener,Brown,Tran,Blankenship
59
Thebasicrollerpatternconsistedofeightpassesofthebreakdownroller,allinvibratorymode.Thebreakdown rollermadeone additional pass to pinch the inside joint from the cold side,withatotalofninepasses.Thevibratoryrollerwidthwas84inchessoiteasilycoveredthematin two passes. The pneumatic roller followed a somewhat erratic pattern but generallyconsistedof13to17passes.Theeffortofthepneumaticrollerwasskewedtothemiddleofthematalthough severalpasseswerenormallymadeon theedgeof themataswell. The finishrolleroperatedinstaticmodeandwasusedtoremoverollermarks.The weather was slightly overcast with ambient air temperature of 70°F and surfacetemperaturesof68°F.Thetemperatureoftheasphaltmixtureasitwasloadedintothedeliverytruckswas310°F.Thetemperatureoftheasphaltmixtureatthescreedwas285°Fatthestartofpavingbutsoonincreasedto295°Fshortlyafterproductionpavingwasunderway.Thecontractor’splan toachieve increaseddensity in the test section includedan increase intheweight of the intermediate pneumatic roller form 13.4 tons to 16.5 tons by adding 800gallonsofwater.Primarily,therewasattentiontobettercontroltherollerpatternwithcloserspacingduringcompaction.Atotalof77densitysampleswereobtainedforthe7,415tonsofasphaltmixtureplacedonthecontrolsection.Theaverageresultwas93.1percentwithastandarddeviationof1.58.Theseresultsprovidedapayfactorof1.04.Atotalof11densityresultswereobtainedfromthe1,025tonsofHMAplaced for the test section. Theaveragedensity resultwas93.0percentwithastandarddeviationof0.67.Table22liststhedataforboththecontrolandtestsections.Table22.ResultsfromtheControlandTestSectionsSection TotalTonnage NumberofTests Average(%) Std.Dev High(%) Low(%)Control 7415 77 93.1 1.58 96.4 89.9Test 1025 11 93.0 0.67 94.0 91.6
The decrease in variability of the two sections was demonstrated by the reduction of thestandard deviation from the control section,whichwas 1.58, to the test section,whichwas0.67.ForthesamePWL,alowerstandarddeviationequatedtoadifferentlowerspecificationlimit. Effectively, this was an increase in 1.0 of the lower specification limit. This is showngraphicallyinFigure10.
ForState8,thepercentdensitydidnotchangebyimplementingbetterpracticeswiththerollerpatternbuttherewasasignificantimprovementinconsistencyasthestandarddeviationwaslowered from 1.58 to 0.67. Below is a summary of observations from this particulardemonstrationprojectthatfitswiththecommonthemesfromthetendemonstrationprojects.
utilized1103 tons, test section1utilized1057 tons,and test section2utilized862 tons.Thecontrol sectionwas constructed on September 14, 2016. Test section 1 was constructed onSeptember15andtestsection2wasconstructedonSeptember16.Thepavement sectionconsistedofapproximately8 inchesofasphaltmixturewith the latestoverlay being placed in 2007. The existing pavement had some low to moderate fatiguecrackingwithsomeareasofhighseveritycracking.Theplanscalledfora2-inchoverlaytobeplaced.Nomillingorlevelcoursewasrequiredonthisproject.
5.9.2 AsphaltMixtureDesign
The gradationwas a½-inchNMASblend thatwas slightly on the coarse side of the primarycontrolsieve.Thegradationfortheasphaltmixturedesign isprovided inTable23alongwiththe average production gradations. The aggregates met all of the agency specificationrequirements. The aggregate blend used all crushed material except for some uncrushedmaterialthatmayhavebeencontainedintheRAP.Nonaturalsandwasaddedtothemixture.Themixturecontained16percentRAP.Thet/NMASwas4.0forthesurfacelayer.TheasphaltbinderusedforthisprojectwasaPG64S-22,whichistypicallyusedbytheagencyformixturesdesignedfor0to3millionESALs.ThemixalsousedaWMAadditivetoimproveadhesionandcompactability.The same asphalt mixture design was used in all sections. The asphalt mixture design wasperformedwith50gyrationswithaSuperpavegyratorycompactor.Thevolumetricpropertiesfortheasphaltmixturedesignalongwithin-placedensityresultsareprovidedinTable24.Theoptimumvirginasphaltbindercontentforthemixturewasselectedtobe5.6percentandthisresultedinanairvoidcontentof3.1percent.TheVMAofthedesignedmixwas15.6percentand thevoids filledwithasphaltwere80.5percent.Theminimumrequirement forVMAwas15.0 percent, which is 1.0 percent higher than the requirement in the AASHTO Superpavestandard.Therequirementsforvoidsfilledwithasphaltwere73to79percent.TheminimumTSRwasrequiredtobeatleast0.80butnoresultswerereportedinthemixdesigninformation.
5.9.3 FieldVerificationoftheAsphaltMixtureDesign
Forfieldverificationoftheasphaltmixturedesign,theagency’sstandardrequirementsaretouse asphalt content, gradation, and volumetric properties. The asphalt mixture design wasverifiedduringfieldproductionandresultsareshowninTables23and24.ThesetablesincludetheJMF,productiontestresults,andin-placedensity.
The agency used a specification based on the percent density from the control strip. Theminimum required percent density was 98.0 percent and themaximumwas 102.0 percent.Percent density was determined by comparing the in-place densitymeasured by cores. Thestatewidehistoricalresultshadaveragedapproximately91percentofthetheoreticalmaximumdensity.For the demonstration project, the percent density was expressed as a percentage of thetheoreticalmaximumdensity.Atotalof10coresweretakenfromeachofthethreesections.As shown in Table 24, the average density was 92.2 percent for the control section, 92.0percentfortestsection1,and92.0percentfortestsection2.Thetargetforthecontrolsectionwas92.5percentandthetargetforthetestsectionswas94.0percent.Themeasureddensitydidnotmeetthetargetdensityrequirements.
andwasnotusedduringplacementofthecontrolsectionbutwasusedfortestsections1and2.EventhoughanMTVwasusedforthetwotestsections,itdidnotremixmaterialsduetoanissuewith itsmixing component. Thematerial was simply transferred by theMTV from thetruckto thepaver.Thetackcoatusedonthisprojectwasareducedtrackingemulsifiedtackcoatappliedat0.05gallonspersquareyard.Threerollerswereavailableforcompaction.Roller1wasaCATCB64Beleven-tonrollerwithintelligentcompaction.Roller2consistedofaHAMMHD+90nine-tonrollerwithoscillatorvibration.TheHammrollerusedvibrationandoscillation.Roller3wasan IngersollRandDD-90HFnine-tonfinishroller.Forthecontrolsection,roller1appliedthreevibratoryandsixstaticpasses,followedbysevenstaticpasseswithroller2.Fortestsection1,roller1appliedfivevibratoryandtwostaticpasses,followedbytwooscillatorypassesandonestaticpasswithroller2.Fortestsection2,roller1appliedfivevibratorypasses,followedbytwooscillatorypassesandthreestaticpasseswithroller2.Theairtemperatureduringplacementofthecontrolsectionrangedfrom69to93oF; fortestsection1itrangedfrom69to77oF,andfortestsection2itrangedfrom69to78oF.Thecontractor’splanwastocompactthecontrolsectionusingnormalcompactionprocedures.The targetminimum density for the control sectionwas 92.2 to 92.5 percent of theoreticalmaximumdensity.Thegoalwastoachieve1.5percenthigherdensity inthetestsections.Asshown in Table 24, the density changed very little between the control section and the testsections.Hence,thegoalof increasingthedensityby1.5percentwasnotachieved. Itshouldalsobenotedthattherewasnotasignificantdifferenceinthefieldcompactiveeffortappliedtotheasphaltpavementforthevarioussections.
5.9.6 UtilizationofNewTechnologies
AWMAadditivewasusedinallsectionstoimprovecompactabilityandtoimproveadhesion.TheMOBA Pave-IR Systemwas used tomonitor temperatures at the paver. These readingsshowedasignificantdegreeoftemperaturesegregation.Intelligentcompactiontechnologywasused.Eventhoughseveralnewtechnologieswereused,theywerelikelynotoptimizedorusedfor feedback since each section was relatively small. They were simply used to provideinformation,andhence,didnotleadtoimproveddensity.
5.9.7 SummaryofStateFindings
ForState9,therewasnochangeinthepercentdensityinthetestsections.Thisdemonstrationproject used the least amount of compactive effort in the field of all the demonstrationprojects.Below isa summaryofobservations fromthisparticulardemonstrationproject thatfitswiththecommonthemesfromthetendemonstrationprojects.
o Thefieldacceptancespecificationwasbasedonthepercentofthecontrolstripwithaminimumof98.0percent.
o Thereweredisincentivesontheproject.
5.10 State10
5.10.1 ProjectDescription
The demonstration projectwas located on a four-lane divided primary highwaywith 50,000ADT.Thelengthoftheprojectwas15.2miles.Theteststripwasconstructedpriortostartofworkonthecontrolsectionandtestsectionsandcontained615tonsofasphaltmixture.Thepurposeoftheteststripwastodeveloparollingpatternandvalidateothertechniquestobeusedforthecontrolsectionandtestsections.Thecontrolsectioncontained1670tonsandthetestsectioncontained3570tons.Atotalofapproximately50,000tonsweretobeplacedinthetestsection,butonly3570tonswereplacedin2016withtheremaindertobeplacedin2017.Thisreportonlyincludesresultsfromthe3570tonsplacedinthetestsectionin2016.TheteststripwasplacedonSeptember10and thecontrol sectionwasplacedonSeptember13.ThetestsectionwasplacedonSeptember18and19.ThemixproducedonSeptember10,13,and18wasproducedinthefirstplantandthemixproducedonSeptember19wasproducedinasecondplantduetoabreakdownofthefirstasphaltplant.Thiswasanightpavingproject.Thepavingprojectconsistedofa2.0-inchmillandfill.Duetotheuseofstuddedtires,thisroadhadbeengenerallyoverlaidevery six to sevenyears. Theexistingpavement (before themilland fill project) had experienced rutting in some places exceeding 1.75 inches and in someplacesdelaminationhadoccurred.
5.10.2 AsphaltMixtureDesign
Thereweretwoasphaltmixturedesignsdevelopedforthisproject.Twoplantswereusedfortheprojectandeachplanthaditsownmixdesign.Thegradationsforthetwodesignswere3/4-inchNMASblends.Thefirstasphaltmixturedesignwasslightlyonthefinesideoftheprimarycontrolsieveandthesecondwasslightlyonthecoarseside.Thegradationsforthetwoasphaltmixture designs are provided in Tables 25 and 26. The aggregates met all of the agencyspecification requirements. No RAP was used in the mixture. The t/NMAS was 2.7 for thesurfacelayer.TheasphaltbinderusedforthisprojectwasaPG64-40thatwashighlypolymermodified.BothmixdesignsusedaWMAtechnologytoimproveadhesionandworkability.The asphalt mixture designs were performed using 75 gyrations with a Superpave gyratorycompactor.Thefirstasphaltmixturedesignhadanoptimumasphaltcontentof5.6percentandprovided 4.0 percent air voids. The second asphalt mixture design had an optimum asphaltcontentof5.5percentandprovidedanairvoidlevelof3.7percent.Theasphaltbindercontentfor the second asphalt mixture design, required to provide 4.0 percent air voids, was 5.2percent.However,theoptimumasphaltcontentwasincreasedto5.5percentsothatthemixwouldhavealittlemoreasphaltbinderandimproveddurability.
Theagency’sstandardrequirementsforfieldverificationoftheasphaltmixturedesignweretouseasphaltcontent,gradation,andvolumetricsforcontrol.Theasphaltmixturedesignswereverified during field production and test results are shown on Tables 25 through 27. Thesetablesincludetheaggregategradations,volumetricproperties,andspecificationrequirements.Table25.AggregateGradationsforMixDesign1SieveSize
The agency used a PWL specificationwith a lower specification limit of 92.0 percent and anupperspecificationlimitof100.0percentofthetheoreticalmaximumdensity.Essentially,therewasnotanupperspecificationlimit.Percentdensitywasdeterminedbycomparingthein-placedensitymeasuredby cores to the theoreticalmaximumdensity for acceptance. Fielddensitywas measured using a nuclear density gauge for quality control. The specification hadincentivesanddisincentives.Thestatewidehistoricalresultshadaveraged95.1percent.Thespecificationrequirementsforthecontrolsectionweresetataminimumof92.0percentforthematandaminimumof91.0percentforthejoint.Thespecificationrequirementsforthetestsectionweresetataminimumof96.0percentforthematandaminimumof94.0percentforthejoints.Nojointdensityresultswereprovided.ThedensityresultsforthematareshowninTable27.
CC72rollers,equippedwith intelligentcompactiontechnology,wereusedforbreakdownandintermediate rolling. Both sections received nine vibratory passes from the breakdown andintermediate rollers for a total of 18 passes. The MOBA Pave-IR System and intelligentcompactionwereusedforthetestsectionbutnotforthecontrolsection.ThefinishrollerwasaCATCB64.Arollingdensitymeterwasusedtomeasurethedensityduringthelasttwonightsofpavingforthetestsection.Thecontractor’splanwastocompactthecontrolsectionusingnormalcompactionprocedures.Theplan for the test sectionwas touseanMTV, intelligentcompaction technology,a rollingdensitymeter,andWMAtechnology.Theaveragecompactioninthecontrolsectionwas95.6percent,whichexceededtheminimumspecifieddensityrequirements.Thedensityresultsforthe test section averaged95.0percent for the firstmixture and95.7percent for the secondmixture.Whilethesedensityresultsareslightlylowerthanthe96percenttarget,theyareveryclose to thedesired results. Further, therewasnosignificantdifference in thedensityof thecontrolsectionandthetestsection.Themethodofrollingthesetwosectionswasverysimilar,soitwasnotsurprisingthattherewasnosignificantdifferencebetweentheresults.Verygooddensitywasachievedforallpavingperformedonthisproject.Itwasconcludedthatthetechnologyutilizedinthetestsectiondidnotresultinincreasedmeandensities.Thiswaslikelyduetothecontractorusingverygoodcompactionequipmentandprovidingagoodrollerpatternonarelativelynarrowmat.The75gyrationmixwasrelativelyeasytocompactforthesiteconditionsandequipmentpresent,andtheuseofEvothermWMAadditivelikelyresultedinamixthatwascompactablewellbelowtherecommendedcompactiontemperatureof305to315oF,resultinginlittleimpactfrommattemperaturedifferentials.Further,thedensitywasverygoodinbothsectionssoit is likelythatthemaximumachievabledensitywasreachedornearlyreachedinbothsections.
5.10.6 UtilizationofNewTechnologies
Severalnewtechnologieswereinvestigatedinthisproject,includingintelligentcompaction,theMOBAPave-IRSystem,WMA,andarollingdensitymeter.The agency’s goal was to identify cold spots in the mat behind the paver and record theirlocations.inordertoperformadensityprofileaftercompaction.Theagencyspecificationsforthisprojectrequiredthecontractortoapplyinfraredheattolowdensityareasinthematandre-compact until the minimum acceptable density was obtained. Due to insufficienttelecommunications between local cellular service providers and theMOBA Pave-IR System,theagencywasunable toprocessdata in real timeand the locationsof cold spotswerenotavailableuntilthefollowingnight.Sincetheroadwayhadbeenre-openedtotraffic,itwasnotpossible to perform density profiling at these cold spots. Upgrades to the Pave-IRcommunicationsmodule are expected to allow real-time location of cold spotswhen pavingresumesinthespringof2017.An example of the use of the new technology is shown in Figure 11. The topportionof thefigure shows an aerial view of the highwaywith two lanes in each direction separated by a
Aschenbrener,Brown,Tran,Blankenship
68
median. The middle portion shows the MOBA Pave-IR scan data. The red is the hottesttemperatureandtheblueisthecoolesttemperature.ThebottomportionshowstheRDMdata.Theredrepresentsthelowestdensityandthebluerepresentsthehighestdensity.
Third)Thelowestdensity,92.8percentfromdrilledcores,wasatStation1245+30aslocatedbythepink circle. That location was identified by the MOBA Pave-IR scan during an 1100 feetcalibrationscanat thestartofpavingonSeptember19,2016.ThePave-IR scanat this samelocationshowsacoldspot.APave-IRscanwasperformedincalibrationmodeandselected15points for coring to establish the best correlation between dielectric value and core voidcontent. Once the core data was entered, the percent density was displayed instead ofdielectricvalue.Theagencywasonlyabletodrilltwoofthe15corelocations,sotheyselectedthehighestandlowestlocations.
5.10.7 SummaryofStateFindings
ForState10,verygooddensitywasachieved forallpavingperformedon thisproject. Itwasconcluded that the technology utilized in the test section did not result in increased meandensities.Thiswas likelydueto thecontractorusingverygoodcompactionequipmentandagood rollerpattern in the control section, and itwasdifficult to improveon this for the testsection.Belowisasummaryofobservationsfromthisparticulardemonstrationprojectthatfitswiththecommonthemesfromthetendemonstrationprojects.
• Observationsfromnewtechnologies(bothagenciesandcontractors)o TheMOBA Pave IR scanner, intelligent compaction, and rolling density meter
havethepotentialtobevaluablequalitycontroltools.
6 OBSERVATIONS
Density can be improved through focused efforts on field compaction. Eight of ten statesimproveddensitiesbyatleastonepercentontheirdemonstrationprojects.Oneofthestatesthatdidnotimprovethedensitydidimprovetheconsistencyorstandarddeviation.Therewasenoughimprovementinthestandarddeviationtoeffectivelyraisethelowerspecificationlimitbyonepercent. Intheotherstatethatdidnotseeanimprovementindensity,therewasnotmuchcompactiveeffortforthecontrolsectionandverylittleadditionalcompactioneffortforthetestsection.Basedontheobservationsfromthesetendemonstrationprojects,techniqueswereidentifiedtoimprovedensitythatwillbeofinteresttoagenciesandcontractors.Theywillbepresentedhereinnoparticularorder.
6.1 Overview
There were at least two pavement sections constructed within each of the 10 states thatparticipated in this demonstration project to enhance durability through increased density.Manyofthestatesconstructedmorethantwopavementsections.Atotalof38sectionswereconstructed.Thereweremanyvariablesincludingmixturetypes,constructionequipment,andproceduresbetween statesandwithin states,making it verydifficult to compare thedensityresults between various pavement sections. The number of variables thatwere intentionallychangedwithina statewasmuch less than thenumberof changesbetweenstates.Thiswasexpected,asitwasademonstrationprojectandnotaformalexperiment.Asademonstrationproject, each state (the contractor and agency) was empowered to focus on changes toimprovedensitythattheythoughtwouldbemostbeneficialfortheirsituation.So,itwasmucheasier to compare the changesmadewithin a state to show the effect of these changes onperformance.Asummaryoftheasphaltmixturedataalongwithin-placedensityisprovidedinTable28.Theobservedeffectofeachof thesevariables isprovided in the followingparagraphs.Note:9.5-mmmixturesbelow47percentpassing the2.36-mmsievewerecoarse-gradedand12.5-mmmixtures below 39 percent passing 2.36-mm sieve were coarse-graded. The primary controlsieveandcontrolpointasdefinedinAASHTOM323wereusedtomakethisdetermination.
Asdiscussedpreviously, density relates topermeability. Permeability is also impactedby thetypeofgradation(coarsevs.fine)andtheNMAS.Aonepercentimprovementindensitymeansmuchmore to the long-termperformance for a coarse gradationwith a largerNMAS thana
o Fourstatesusedfinegradations(States1,4,5and10),ando Sixstatesusedcoarsegradations(States2,6,7,8,9and10).
Forthemostpart,thetestsectionswithineachstatedidnotattempttoevaluatetheeffectofchangingtheaggregategradation.Onereasonforthismaybethatitisverydifficulttoquantifya change in gradation. A few states did make some changes in the mixture but it was notpossibletodeterminetheeffectofchangesingradationonthemeasureddensity.Experience has shown that fine-gradedmixtures are generallymore workable and easier tocompactthancoarse-gradedmixtures. It isclear fromthedata inTable28thatgoodorpoordensity could be obtained with either fine-graded or coarse-gradedmixtures. Based on thisdata, it appeared that rolling procedures could generally be adjusted to obtain adequatedensitywhenmixturevariablessuchasairvoids,NMAS,andlaboratorycompactionlevelwerevaried.Thereweremanyotherfactors,suchasmixturevolumetricproperties,thatlikelyhadagreatereffectonin-placedensitythantheaggregategradation.
Changing theNMASalso changed the t/NMASwhen the layer thickness remained the same.ThismadeitdifficulttomakeadirectcomparisonbetweentwodifferentNMASs.Generally,itisdesirablethatthet/NMASbeatleast3.0forfine-gradedmixturesandatleast4.0forcoarse-gradedmixtures.Thet/NMASusedonthedemonstrationprojectsgenerallyfollowedthebestpracticeguidelines.Thet/NMASonthedemonstrationprojectswere:
o Oneoftenstates<3.0(State10),o Nineoftenstates≥3.0(States1,2,3,4,5,6,7,8and9),ando Eightoftenstates≥4.0(States1,2,3,4,5,6,7and9).
States3and4bothevaluatedtheeffectoftwodifferentNMASswiththesameliftthickness.Eachstateproducedatleastonesectionwitha12.5-mmmixtureandatleastonesectionwith9.5-mmmixture.State3showedthata94.1percentaveragedensitywasobtainedwith12.5-mm mixture and 93.8 average density was obtained with 9.5-mm mixtures. These densityresultswere not significantly different. State 4 showed 94.1 percent average density for the12.5-mm mixture and 95.2 percent density for the 9.5-mm mixture. This difference of 1.1percentdensityisprobablysignificant.ThepurposeofchangingtheNMASwastoexaminetheeffectofthet/NMAS.
Aschenbrener,Brown,Tran,Blankenship
72
6.4 AsphaltMixtureDesign
Superpave requirements for asphaltmixture design are defined in AASHTO standards. Thereare several factors in an asphalt mixture that might affect the compacted density. The twobiggestfactorsarelikelygyrationlevelduringlaboratorycompactionandthelevelofairvoidsused for selecting theoptimumasphalt content. Engineering adjustments to these standardscanbemade,butitisrecommendedtofollowtheguidelinesintheFHWATechBrief(2010).Ifthegyrationlevelisreduced,theamountofasphaltneededtofillthevoidstothedesiredlevelisincreasedforthesamegradation.Hence,iftheonlyvariableisthegyrationlevel,anincreaseinthegyrationlevelwillresultinloweroptimumasphaltcontent.Some statesobtainhigherdensitybyaddingadditional asphaltbinder to themixandothersobtainhigherdensitybyincreasingcompactionwithrollers.Thesetwoapproachesofreducingthe in-place air voids don’t have the same effect on performance. It is important that asatisfactorymixbedesignedandproducedtoensuregoodperformanceandthat thismixbecompactedtotheadequatedensityinthefield.Asawordofcaution,addingadditionalasphaltsolely for compaction changes themixture properties, and this adjustedmix should only beusediflaboratorytestresultshaveshownthatthisadjustedmixissatisfactory.Four of ten states made engineering adjustments to the AASHTO Superpave mix design toobtainhigheroptimumAC:States3,4,5and6.Thesestateshadanincreaseof0.1to0.3percentasphalt.Engineeringadjustmentstoobtainaslightlyhigheroptimumasphaltcontentincludedadjustinggyrations(States3and6)andairvoidregression(States4and5).The gyration level for State 3 was varied and in this case the increase in density was 1.2percent.State6reducedthegyrationlevelfrom100to50andthein-placedensityincreasedbyapproximately 2.1 percent. State 6 simultaneously decreased the air void content at designfrom 4 to 3 percent and increased the VMA requirement from 15 to 16 percent. Hence, asexpected,States3and6showedthatlowergyrationsduringlaboratorycompactionultimatelyresultedinahigherin-placedensity(lowerairvoids).Another factor in mix design that has an effect on density is the design air void level. Apavementsectiondesignedwithlowerdesignairvoidswillbeeasiertocompactthanonewithhigherdesignairvoidsforthesamegradation.Twostatesthatlookedatvaryingthelaboratoryair voids without significantly changing other mixture properties or compaction procedureswereStates4and5.TheresultsfromState5showedthat loweringthedesignairvoidsfrom4.0 to 3.0 percent resulted in an approximate 2.5 percent increase in in-place density. TheresultsfromState4showedthatloweringthedesignairvoidsfrom4.0to3.0percentwithoutchangingthegradationresultedinanapproximate1.9percentincreaseinin-placedensity.When the starting point for the optimum asphalt content is determined from the AASHTOSuperpavestandards,thenengineeringadjustmentstotheasphaltmixturedesigntoaddupto0.3percentasphaltcontentareappropriate.Forthoseagenciesstartingwithhigheroptimumasphalt contents than would be provided from the AASHTO Superpave standards, then it is
Aschenbrener,Brown,Tran,Blankenship
73
recommended to conduct performance testing on the asphalt mixture, including rutting,cracking and moisture damage testing. If an agency does make engineering adjustments toincreasetheoptimumasphaltcontent,thentheagencyshouldalsoadjustthepercentdensityrequirement.
6.5 Field-ProducedMixtureProperties
Theasphaltmixturedesignpropertieswillhaveaneffectonin-placecompactionbutthiseffectcan likely be better evaluated based onmixture properties during field production. Randomvariation,breakdownofaggregates,andotherissueshappenduringproductionthatwillmakethemixturepropertiesdifferentthanthatshowninthedesign.Theselaboratorypropertiesofthe asphaltmixtureduringproduction should correlatebetterwith in-placedensity than thedesignproperties.Theasphaltmixturedesignwasadequatelyverifiedbyeachofthestatesandadjustments were made as needed to ensure the production gradations and mixturevolumetricsmetthespecificationrequirements.
Thenumberofcompactionrollersvariedfromasfewasonerollerononeofthedemonstrationprojects(State2)anduptofivecompactionrollersonanotherdemonstrationproject(State3).This is a tremendous difference in compaction effort. A summary of some key observationsincluded:
• When vibratory or oscillatory rollers were used, generally all of the passes used thevibratory or oscillatorymode. In some cases theremayhavebeen a final oneof twopassesthatwerestatic.However,onestatedidnotusethevibratorymodeasmuch.
o Twooftenstatesusedthevibratorymodeoftherollerononlytwoorlessof10passesinthecontrolsection(States1and9).
It should be noted that none of these particular projects that used pneumatic rollersusedpolymermodifiedasphalt.
States2,8,and9clearlyhadthelowestdensityvaluescomparedtotheotherstates.State2usedonerollerforcompactionbutwasstillabletomakeanimprovementindensitybyusingjusttwomorepasses.State8usedtworollersforcompaction.State8focusedonconsistencyandloweredthestandarddeviationsufficientlytoeffectivelyraisethelowerspecificationlimitby1.0percent.Finally,State9usedonevibratoryrollerandoneoscillatingrollerbutwithveryfewpasses.State9wastheonlystatenotabletomakeanimprovementindensityintheirtestsection. In fact, they used fewer passes in their test section than the control section. Asexpected,thisshowedthattheamountofrollingsignificantlyaffectedthedensity.An additional rollerwas helpful in increasing density. Three of ten states used an additionalroller:States1,3,and4.Thesestateswereall successfulatobtaininghigherdensity.State1obtainedhigherdensitywiththeadditionofapneumaticroller.Additionaldensitycouldnotbeachievedwithonlytheuseofthesteel-wheeledrollers.State4conductedacost-benefitanalysisforusinganadditionalroller.AsummaryisshowninTable 30. An estimate of the improved benefit from a life-cycle cost analysis is 10 percent,conservatively.Foranasphaltmixturethatcosts$60perton,a10percent improvementwastheequivalentof“sixdollarsigns”asshowninTable30.State4evaluatedthecosts(one“$”isrelative to the $60 per tonmixture) of the other factors to increase density as part of thedemonstration project. These factors are also shown in the table. State 4 believes theseadjustmentswerecosteffective.Table30.State4Cost-BenefitAnalysisofAdjustmentstoIncreaseIn-placeDensity
It should be noted that there aremany best practices to achieve higher density other thanadding a roller, which could include: roller settings, vibration vs. speed, mat temperature,vibrating screed, paver speed, etc. These best practices may even be less costly than anadditional roller.Manyof thesewereoutside the scopeof eachof the SHA’s demonstrationproject.Duringplacementandcompaction, therewereasurprisingnumberof issueswithequipmentoperation.Fiveofthetenstateshadequipment-relatedissues(States1,4,8,9and10).Ineachofthesedemonstrations,theequipmentissuewasanimpedimenttoachievinghigherdensity.An agency may need to require a QC plan to make sure compaction equipment is workingproperlypriortopaving.
6.7 LongitudinalJoints
Whilelongitudinaljointswerenotaspecificpartofthisstudy,goodcompactioninthejointsisveryimportantforgoodperformance.Someofthedemonstrationprojectshadarollerfocusingon the density at the joint. Some of the demonstration projects included application of asealant.Thesealantwasappliedasathinstripofasphaltsealantthatisprovidedinarollandcanbeunrolledandplacedon the freeedgeofapreviouslyplaced lanebefore theadjacentlaneisplaced.Notestingwasdonetodeterminetheeffectiveness,butthisissomethingthathasbeendoneinthepasttoimprovejointperformance.Jointheaterswereusedonsomeofthedemonstrationprojects.Theeffectivenessofanyoftheseeffortsonthelongitudinal jointwasnotevaluatedaspartofthisstudy.
6.8 MeasuringandReportingDensity
Somestatesspecifiedandcontrolleddensityusingamethodother thanpercentofTMD.ForTables28and29,thedensityisreportedforallstatesaspercentofTMD.TwoofthetenstatesthatusedamethodotherthanTMDincluded:States2and9.The primary property that is important during compaction is the percent air voids in the in-place mixture. Reporting density as percent of TMD directly provides the air voids in thecompactedmix.Othermethodsof specifying andmeasuringdensityonlyprovidean indirectmeasureoftheairvoidsandinsomecasescanbemisleading.
• The contractors’ job is to be the low bidder and meet the specifications. Simply byasking for higher density, two of ten states (States 1 and 2) achieved higher density.Although thiswould notwork in all of the states, some states could simply raise theminimumdensity requirementsand the contractors couldeasilymakeadjustments totheircompactionmethodstomeetspecifications.
• AnadvantageofaPWLspecificationovertheminimumlotaveragespecificationisthatthe consistency, as measured by the standard deviation, is included as part of the
Aschenbrener,Brown,Tran,Blankenship
78
specification.Theconsistencyinanimportantfactor.Twooftenstates(States7and8)demonstrated improvements in the standard deviation, and showed that standarddeviationsbelow1.00werepossible.
o WMAwasusedbysixofthetenstates(States3,4,5,7,9and10),o MOBAPave-IRSystemwasusedbythreeofthetenstates(States3,9and10),o ICwasusedbythreeofthetenstates(States3,9and10)ando RDMwasusedbytwoofthetenstates(States3and10).
All of these new technologies showed some promise. However, although these newtechnologieswereusedanddatawascollected,very littleanalysisofdatawasmade inmostcases,particularly in real time.Mostof thesetechnologieshavethepotential to improvethequalityoflargeprojectsbutwerenotveryeffectivewhenusedinsmallsectionsasusedonthisproject. These technologies generally provided information that would have been useful inmaking adjustments as work progresses so would be most useful for larger projects. Theapplicationof thesenewtechnologieswasevaluatedbut theyhad littlebenefit inplacementandcompactionofthesesmallsections.Apotentialbenefitofsomeofthesenewtechnologiesisthattherewillbemoretestresultsandbetterquantificationofin-placematerials.Therecanbechallengeswiththenewtechnologies,such as issues getting real-time data in order tomake project adjustments. Also, the use ofsomeoftheresultsforacceptancepurposeshasnotbeenfullydemonstratedtobeaccurate.Althoughthesenewtechnologiesmaybeagoodqualitycontroltool,careshouldbeexercisedforacceptance.
7 SUMMARYOFOBSERVATIONS
The demonstration projects show that density can be improved. Eight of the ten statesimproveddensitiesbyatleastonepercentontheirdemonstrationprojects.Asummaryofthemethods used to obtain increased density seemed to fall into one of the following fivecategories.
1. Improvingtheagency’sspecificationbyincludingorincreasingincentivesandexaminingtheminimumpercent density requirements. Therewas a significant difference in thenumberofrollersusedforcompactionbetweenstates.Somestatesusedaslittleasone
Aschenbrener,Brown,Tran,Blankenship
79
compaction roller while others used asmany as four or five compaction rollers. Thenumber of passes for each roller used varied considerably among states. There is astrong association between the rolling effort and the agency’s requirements. Somestateswere able to obtain high density in the range of 95.0 to 96.0 percent of TMDwhileotherstatesonlyobtaineddensityintherangeof90to91percent.Asexpected,using fewer rollers and fewer vibratory passes generally resulted in lower in-placedensity,andusingmorerollersresultedinhigherin-placedensity.
2. Makingengineeringadjustmentstotheasphaltmixturedesigntoobtainslightlyhigheroptimum asphalt content was successful at achieving higher in-place densities. Also,reducingthenumberofgyrationsduringmixdesignresultedinincreaseddensityinthefield. Some states obtain higher density by increasing the optimum asphalt bindercontent with engineering adjustments. It is important that a satisfactory mix bedesignedandproducedtoensuregoodperformanceandthatthismixbecompactedtoadequatedensityinthefield.Asawordofcaution,addingadditionalasphaltsolelyforcompactionchangesthemixturepropertiesandthisadjustedmixshouldonlybeusediflaboratorytestresultshaveshownthatthisadjustedmixissatisfactory.
3. Consistency is one of the most important factors in improving in-place density.Consistency can be generally defined as consistency in temperatures, paver speeds,rollerpatterns,andalloftheotherfactorsthatimpactdensityandstandarddeviationofdensitymeasurements. Improving consistency asmeasuredby the standarddeviationwasaccomplishedbytwoofthestates.Informationfromstates7and8demonstratedthatastandarddeviationbelow1.00waspossibleandcouldbeachievedroutinely.
4. Followingbestpracticesisimportant.Therewasalotofattentionontheconstructionofthe control and test sections. Since this was part of an experiment, there wasmoreattention tobestpractices than therewouldnormallyhavebeen. Inmany states, theresults in the control sectionwere greater than that of the statewide average resultsthatwould normally be expected.When examining the improvement in density fromthe control to the test section, the increases could have been even greater.Improvement in density reported from each of the demonstration projectswas likelyevenbetterthandocumentedinthisreport.Manyof thepavement sectionsconstructed in thisprojectwerevery small and somestatesreducedthespeedofthepaverandrollersduetothelowerproductionrate.Thisslower rate of placement likely aided good compaction for these states. Hence, it islikelythatthein-placedensitymaydecreaseforsomewhenfullscaleproductionoccurs.Finally,itshouldbenotedthattherearemanybestpracticesotherthanthoseusedforthesedemonstrationprojects.Althoughthestatestriedmanythings,therewerelikelymanyotherbestpracticesthatcouldhavemadeadifference.Bestpracticesotherthanadding another roller could include: roller settings, vibration vs. speed, mat
5. Using new technologies was helpful. These technologies used included warm-mixasphalt,MOBAPave-IRSystem,rollingdensitymeterandintelligentcompaction.Allofthesenewtechnologiesshowedsomepromise.