NCH update report AREA 6 COMMITTEE (Dales, St Anns & Mapperly) – June 2015 Title of paper: Nottingham City Homes Update Report Director(s)/ Corporate Director(s): Nick Murphy Chief Executive of Nottingham City Homes Wards affected: Dales, St Anns & Mapperly Report author(s) and contact details: Kristian Murden Tenancy and Estate Manager [email protected]Other colleagues who have provided input: None Date of consultation with Portfolio Holder(s) (if relevant) Relevant Council Plan Strategic Priority: Cutting unemployment by a quarter Cut crime and anti-social behaviour Ensure more school leavers get a job, training or further education than any other City Your neighbourhood as clean as the City Centre Help keep your energy bills down Good access to public transport
Transcript
NCH update report AREA 6 COMMITTEE (Dales, St Anns & Mapperly) – June 2015
Title of paper: Nottingham City Homes Update Report
Ensure more school leavers get a job, training or further education than any other City
Your neighbourhood as clean as the City Centre
Help keep your energy bills down
Good access to public transport
Nottingham has a good mix of housing
Nottingham is a good place to do business, invest and create jobs
Nottingham offers a wide range of leisure activities, parks and sporting events
Support early intervention activities
Deliver effective, value for money services to our citizens
Summary of issues (including benefits to customers/service users):
The area performance reports provide updates on key issues and themes which link back to local priorities
and the strategic themes for Nottingham City Homes.
The reports provide summary updates on the following key themes:
Capital Programme and major work
Area Regeneration and Environmental Issues
Key messages from the Tenant and Leasehold Congress
Tenant and Residents Associations updates
Area Performance Figures
Good news stories & positive publicity
Recommendation(s):
Area Committee note the allocation of funds for 2015/16 appendix 1
Area Committee note and comment on paragraphs 1-6 listed below.
That Area Committee approve the Area Capital Programme Funding for Dales, Mapperly and St Anns
Wards as set out in appendix 2
1 REASONS FOR RECOMMENDATIONS (INCLUDING OUTCOMES OF CONSULTATION)
1.1
1.2
The Nottingham City Homes Update Report provides a descriptive and statistical picture of what is
happening at an area level and invite community representatives to comment, debate, and challenge and
identify how they can add value to improve their neighbourhoods.
The Nottingham City Homes Update Report also monitors progress in the wards and acts as a catalyst
for debate about the key performance issues impacting upon the ward on a quarterly basis.
2 BACKGROUND (INCLUDING OUTCOMES OF CONSULTATION)
2.1 The Nottingham City Homes Update Report has been important for a number of years in Nottingham
as a means of engaging better with tenants and leaseholders and to drive forward service
improvement.
2.2 Nottingham City Homes has a goal to ‘create homes and places where people want to live’ and to
give tenants and leaseholders an input in shaping what happens in their area. The Nottingham City
Homes Update Report helps us to understand where we are doing well and which areas need to be
improved.
2.3 Following the decision for Nottingham City Homes reps to attend Area Committee, it was decided to
provide the Nottingham City Homes Update Report to Area Committee.
3 OTHER OPTIONS CONSIDERED IN MAKING RECOMMENDATIONS
3.1 None
4 FINANCIAL IMPLICATIONS (INCLUDING VALUE FOR MONEY/VAT)
4.1 None
5 RISK MANAGEMENT ISSUES (INCLUDING LEGAL IMPLICATIONS AND CRIME AND
DISORDER ACT IMPLICATIONS)
5.1 None
6 EQUALITY IMPACT ASSESSMENT
Has the equality impact been assessed?
Not needed (report does not contain proposals or financial decisions)
No
Yes— Equality impact Assessment attached
7 LIST OF BACKGROUND PAPERS OTHER THAN PUBLISHED WORKS OR THOSE
DISCLOSING CONFIDENTIAL OR EXEMPT INFORMATION
7.1 None
8 PUBLISHED DOCUMENTS REFERRED TO IN COMPILING THIS REPORT
Time: 6.30pm Date: 23rd June 2015 Presented by: Gary Nelmbs
Item Executive Summary / Key Points For information or decision
1
Capital Programme & major works
Decent Homes Background The Nottingham Decent Homes programme has been running for the past six years aimed at improving more than 18,000 homes across the city. It started in 2009 after it was revealed that more than 40 per cent of council houses in Nottingham did not meet national standards. The programme was funded 80 per cent by central government and 20 per cent by Nottingham City Council. Nottingham City Homes took the opportunity to go beyond the government’s decent homes standard with the Nottingham Decent Homes Plus Standard. What we have achieved Citywide Bathrooms, kitchens, boilers and roofs have been replaced and upgraded at a cost of £200 million in the Secure Warm Modern programme. It means that every Nottingham council home (100%) now meets the government's minimum 'decent homes' specifications compared to just 44 per cent when the project began. Zero per cent non decency achieved by 31 March 2015
• 14,325 Bathrooms • 18,959 Kitchens
Information
• 37,607 Secure by Design Doors • 18,729 properties have received (80,000) Grade A Secure by Design
windows • 4,478 Loft Insulations • 14,910 Electrical upgrades • 15,460 New Grade A energy efficient boilers • 14,621 Heating distribution upgrades (this is radiators, pipework and
programmes) • 567 New roofs • £200 million investment • 200+ apprentices taken on and trained • Up to 600 employed on the scheme at any one time • Satisfaction with quality / condition of home up from 57% to 87%
The future A planned programme of maintaining decency will continue year after year to continue a level of quality within our housing stock. £13m has been set aside for 2015/6 to uphold this goal. The maintaining decency project will remain under the title of Secure Warm Modern which is, and always has been, based on tenant priorities. Stock condition data and Energy Performance information collected about our housing stock is helping to produce an additional planned programme of energy efficiency works across the City including insulation work to solid wall, BISF (British Steel Frame) and other hard to treat properties. Victoria Centre The corridor lighting to each floor is being replaced with reactive LED lighting thereby helping to reduce costs. Work commenced on the top floors and
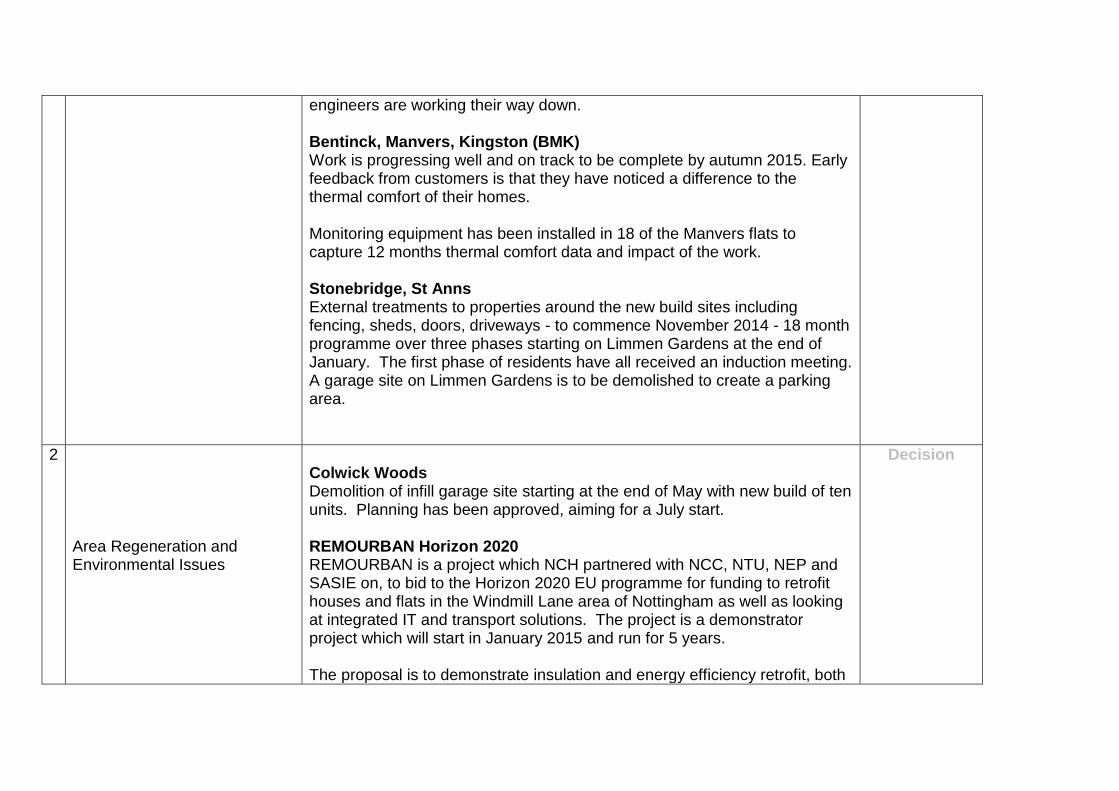
engineers are working their way down. Bentinck, Manvers, Kingston (BMK) Work is progressing well and on track to be complete by autumn 2015. Early feedback from customers is that they have noticed a difference to the thermal comfort of their homes. Monitoring equipment has been installed in 18 of the Manvers flats to capture 12 months thermal comfort data and impact of the work. Stonebridge, St Anns External treatments to properties around the new build sites including fencing, sheds, doors, driveways - to commence November 2014 - 18 month programme over three phases starting on Limmen Gardens at the end of January. The first phase of residents have all received an induction meeting. A garage site on Limmen Gardens is to be demolished to create a parking area.
2
Area Regeneration and Environmental Issues
Colwick Woods Demolition of infill garage site starting at the end of May with new build of ten units. Planning has been approved, aiming for a July start. REMOURBAN Horizon 2020 REMOURBAN is a project which NCH partnered with NCC, NTU, NEP and SASIE on, to bid to the Horizon 2020 EU programme for funding to retrofit houses and flats in the Windmill Lane area of Nottingham as well as looking at integrated IT and transport solutions. The project is a demonstrator project which will start in January 2015 and run for 5 years. The proposal is to demonstrate insulation and energy efficiency retrofit, both
Decision
based on the current standards we achieve, similar to Clifton, as well as potential future standards which we would like to achieve, including Passivhaus for retrofit (Enerphit). The project involves three EU Cities, with the other two being in Spain (Valladolid) and Turkey (Eskisehir). Nottingham is set to receive 7 million EUROS funding from the European Commission over 5 years and is expected to lead to visits from policymakers and interested experts from around the continent. One of the project’s main initiatives is expected to cut overall energy usage in an almost entire neighbourhood of properties in Sneinton, a central suburb of the city, by up to 50 per cent. The project is led by Nottingham Trent University in partnership with Nottingham City Council, Nottingham City Homes, Nottingham Energy Partnership, Infohub Ltd, a data communications SME and Sasie Ltd, a Nottingham-based renewable energy company. The project is led by Nottingham Trent University in partnership with Nottingham City Council, Nottingham City Homes, Nottingham Energy Partnership, Infohub Ltd, a data communications SME and Sasie Ltd, a Nottingham-based renewable energy company The project is led by Nottingham Trent University in partnership with Nottingham City Council, Nottingham City Homes, Nottingham Energy Partnership, Infohub Ltd, a data communications SME and Sasie Ltd, a Nottingham-based renewable energy company. The project will last five years. It will involve:
Transforming 427 solid wall properties in Sneinton with retrofitted external solid wall insulation;
Fitting those properties with smart meters which provide live data on energy usage and allow the control of heating remotely by smart phone;
Construction of a UK-first low temperature extension to the city’s district heating system to provide energy for four blocks of flats;
Establishing a new tourist route with two electric-powered buses; taking visitors on a circular route between Green’s Windmill in Sneinton to Wollaton Park via Nottingham Castle;
A last-mile delivery hub, based in Sneinton, which will involve eight electric vehicles taking small deliveries on behalf of hauliers to help reduce the number of lorries entering the city centre;
The establishment of an electric car rental scheme which will allow people to rent vehicles by the hour from a number of points across the city;
The insulation of a further nine properties in West Walk, Sneinton, to Enerphit standards (Passivhaus for Retrofit) - the highest level of energy performance in the world. Nottingham was selected for funding due to its healthy track record in delivering green initiatives and the project will build on the city’s existing reputation as one of the cleanest and least car-dependent cities in the UK
3
Key messages from the Tenant and Leasehold Congress
TLC has recently undergone review and a number of improvements have been identified and implemented following on from further consultation with tenants. The first ‘new style’ meeting was held on Wednesday 29th April at the New Art Exchange and involved interactive workshops to shape the future structure and direction of the group. The group also decided on a new name and will now be known as the ‘Communities in Action’ group. Membership has been widen to include representatives from each of the NCH customer panels, each of the
X
recognised Tenants & Residents groups across the city, ensuring wider and more local representation and engagement and there is also an open invitation in place for all NCH Board members to attend.
4 Tenant and Residents Associations updates
STOP TRA
Delivering multi sports activity sessions during weekdays and Saturdays for over 14’s the community.
Also delivering football training sessions for young children on Thursday evenings and Saturday mornings in partnership with EPIC.
STOP TRA Community Café Open Day took place on the 9th April, with lots of activities and information on employment and training from the Nottingham Hub and Nottingham City Homes
A Hanging Basket workshop was recently held with STOP through the NCH Tenant Academy with over 10 tenants involved
Bi monthly Public Meetings take place at the Pavilion on King Edward Park – all welcome.
STANRA
Bi Monthly meetings – held at the Wells Road Community Centre
AGM is due to take place in June. The group are working closely with NCH to be a recognised TRA. Also looking at new projects for the coming year.
X
5 Area Performance Figures
Please see below
X
6
Good news stories & positive publicity
NCH in close partnership with Community Protection have been successful in gaining the first “Closure Order” on a residential property in the City. This new power was bought in under new Anti-Social Behaviour Legislation in
X
early 2015. NCH worked hard to resolve this dispute, however using the new powers afforded to Local Authorities; we were able to apply for the Closure Order to provide rest bite for neighbours whilst we pursue Possession Proceedings.
Area report - St ann's, Dales & Mapperley Generated on: 15 May 2015
AC6-1 Anti-social behaviour
Performance indicator and definition Target
2014/15 2013/14 2012/13
Latest Note Value Status
Long Trend
Value Value
% of ASB cases resolved by first intervention – St ann's Note: This PI monitors how many ASB cases NCH resolved on the first intervention e.g. written warning. Data for this indicator is not available by ward and is reported by Housing Office.
84% 78.43% 82.22% 81.97%
It is pleasing to note that St Anns ASB cases resolved at 1st Intervention are above target. Staff have been reminded with briefings at what stage a case can be attributed to this key stage. The only case not resolved at 1st Intervention for Dec 2014 was ReACT # 7535, which has been audited and is correct
% of ASB cases resolved – Stanns Note: This PI measures the proportion of ASB cases NCH has successfully resolved. Data for this PI is not available by ward and is reported by Housing Office.
97.8% 100% 100% 99.03%
Investigated reasons why performance below target. It has been found that ReACT Case # 6011 was closed without the "outcome" being inputted. The HPM has been advised of this and reminded that this PI is an important performance figure.
Number of new ASB cases – St Ann's Note: Data for this PI is only available by Housing Office.
158 233 266 .
Tenant satisfaction with the ASB service - St ann's Note: Data for this PI is only available by Housing Office.
7.45 5 7.99
AC6-2 Repairs
Performance indicator and definition Target
2014/15 2013/14 2012/13
Latest Note Value Status
Long Trend
Value Value
% of repairs completed in target – AC - St ann's, Dales & Mapperley Note: This PI monitors the proportion of repairs being completed within agreed timescales.
96% 92.87%
% of repairs completed in target – Dales Ward Note: This PI monitors the proportion of repairs being completed within agreed timescales.
96% 97.81% 96.86% 93.35%
% of repairs completed in target – Mapperley Ward Note: This PI monitors the proportion of repairs being completed within agreed timescales.
96% 97.91% 97.28% 91.7%
% of repairs completed in target – St ann's Ward Note: This PI monitors the proportion of repairs being completed within agreed timescales.
96% 97.58% 96.96% 92.65%
Tenant satisfaction with the repairs service Note: Data for this PI is only available citywide
9 8.9 8.78 8.64
Whilst slightly short of the Corporate Plan target of 9, performance of 8.9 in 2014/15 is higher than all previous annual outturns. We call all customers who have rated us lower than 5/10 to discuss the specifics of their dissatisfaction and use this feedback to deliver improvements to the repairs service. Satisfaction survey results are discussed at team meetings, highlighting both good and bad feedback and challenging staff not following processes.
AC6-3 Rent Collection
Performance indicator and definition Target
2014/15 2013/14 2012/13
Latest Note Value Status
Long Trend
Value Value
% of rent collected Note: This PI measures the amount of rent collected (including tenant arrears) as a percentage of rent due for the current year. Data for this indicator is not available by ward and is reported city wide. Trend shows as improving if value is over 100% as arrears are decreasing.
100% 100.56% 100.02% 100.21%
The rent collection rate for 2014-15 was above target at 100.56%, an improvement on the figure at the end of 2013-14 which was 100.02%. Measures taken to ensure a high level of collection included evening and weekend working by the team. We also conducted a campaign to contact all customers who paid at local housing offices (where the cash payment facility was due to close) to offer support with alternative payment methods and to sign as many as possible up for Direct Debit. This resulted in approximately 600 extra customers signing up to pay by direct debit. A revised Service Level Agreement is being finalised between NCH and Nottingham Revenue and Benefits Ltd - the new company formed to deal with Housing Benefit claims on behalf of the City Council. This is expected to be in place early in 2015-16 and is designed to improve the relationship between the two organisations and ensure that targets set for processing of claims etc will be monitored and met. This is expected to have a positive effect on our rent arrears and collection performance. 2015-16 will see the introduction of Universal Credit. This will result a significant percentage of our weekly rent debit being paid directly to tenants, where it is currently paid directly to NCH as housing benefit. Several measures are being taken to ensure the impact of this on our rent collection figures is minimised, including: Communications activity e.g. via the tenants' newsletter Tenancy Sustainment Team holding events in local communities and targetting support Updating Northgate IT system to better enable management of affected accounts Staff training across NCH to ensure support to tenants is provided by the whole organisation
% of tenancies ending due to eviction Note: This PI monitors the percentage of tenants being evicted due to rent arrears and is reported citywide.
0.75% 0.56% 0.74% 0.55%
This performance indicator is of particular importance to the team as we are committed to sustaining as many tenancies as possible and have measures in place to support tenants in arrears. The Tenancy Sustainment Team receive referrals from Rent Account Managers relating to tenants who require additional support. The Team supports such tenants to manage their finances more effectively with the aim of maintaining their tenancy and avoiding eviction. We have evicted 148 tenants in the last 12 months, this compares to 197 during 2013-14. We will work to ensure that this downward trend continues.
AC6-4a Empty properties - Average relet time
Performance indicator and definition Target
2014/15 2013/14 2012/13
Latest Note Value Status
Long Trend
Value Value
Average void re-let time (calendar days) – AC - St ann's, Dales & Mapperley Note: This PI measures how long it takes NCH to re-let empty properties from the end of the old tenancy to the start of the new tenancy
25 25.28 29.73 31.38 See below
Average void re-let time (calendar days) – Dales Ward Note: This PI measures how long it takes NCH to re-let empty properties from the end of the old tenancy to the start of the new tenancy
25 31.72 23.14 32.25
The Housing Services and Property Services teams work jointly to ensure the time properties remain empty is minimised. The target for 2014-15 was not met and this was due to low demand issues with some Independent Living accommodation at Kingston Court.
Average void re-let time (calendar days) – Mapperley Ward Note: This PI measures how long it takes NCH to re-let empty properties from the end of the old tenancy to the start of the new tenancy
25 14.16 32.71 25.05 The Housing Services and Property Services teams work jointly to ensure the time properties remain empty is minimised. The target for 2014-15 was met.
Average void re-let time (calendar days) – St Anns Ward Note: This PI measures how long it takes NCH to re-let empty properties from the end of the old tenancy to the start of the new tenancy
25 24.19 31.77 30.3 The Housing Services and Property Services teams work jointly to ensure the time properties remain empty is minimised. The target for 2014-15 was met.
AC6-4b Empty properties - Lettable voids
Performance indicator and definition Target
2014/15 2013/14 2012/13
Latest Note Value Status
Long Trend
Value Value
Number of lettable voids – AC - St ann's, Dales & Mapperley Note: Lettable voids are empty properties available for re-letting. They will receive repair work and then be re-let to a new tenant.
24 45 44
The Housing Services and Property Services teams work jointly to ensure the time properties remain empty is minimised with a decrease of 21properties from the previous year.
Number of lettable voids – Dales Ward Note: Lettable voids are empty properties available for re-letting. They will receive repair work and then be re-let to a new tenant.
6 15 11
The Housing Services and Property Services teams work jointly to ensure the time properties remain empty is minimised with a decrease of 9 properties from the previous year.
Number of lettable voids – Mapperley Ward Note: Lettable voids are empty properties available for re-letting. They will receive repair work and then be re-let to a new tenant.
2 3 3
The Housing Services and Property Services teams work jointly to ensure the time properties remain empty is minimised with a decrease of 1property from the previous year.
Number of lettable voids – St Anns Ward Note: Lettable voids are empty properties available for re-letting. They will receive repair work and then be re-let to a new tenant.
16 27 30
The Housing Services and Property Services teams work jointly to ensure the time properties remain empty is minimised with a decrease of 11properties from the previous year.
AC6-4c Empty properties - Decommissioning
Performance indicator and definition Target
2014/15 2013/14 2012/13
Latest Note Value Status
Long Trend
Value Value
Number of empty properties awaiting decommission – Dales Ward Note: This PI shows the number of empty properties which will not be re-let and includes those being decommissioned and / or demolished.
0 2 6 NA
Number of empty properties awaiting decommission – Mapperley Ward Note: This PI shows the number of empty properties which will not be re-let and includes those being decommissioned and / or demolished.
0 5 6 NA
Number of empty properties awaiting decommission – St Anns Ward Note: This PI shows the number of empty properties which will not be re-let and includes those being decommissioned and / or demolished.
5 0 28 This relates to properties at Robin Hood Chase which have subsequently been demolished.
AC6-5 Tenancy sustainment
Performance indicator and definition Target
2014/15 2013/14 2012/13
Latest Note Value Status
Long Trend
Value Value
Percentage of new tenancies sustained - AC - St ann's, Dales & Mapperley Note: This PI measures the number of new tenants who are still in their tenancy 12 months later.
93.5% 96.54% 93.83% 92.67% Staff have been and continue to work hard in ensuring everything possible is done to assist our customers in sustaining their tenancies.
Percentage of new tenancies sustained - Dales Ward Note: This PI measures the number of new tenants who are still in their tenancy 12 months later.
93.5% 94.12% 92.93% 95.19%
HPm's are working hard to identify possible trends regarding NTQ's and reasons why a tenancy may fail. It is hoped that the new type of tenancy visits will help to bring an upward trend in this PI
Percentage of new tenancies sustained - Mapperley Ward Note: This PI measures the number of new tenants who are still in their tenancy 12 months later.
93.5% 94.87% 100% 91.67% Staff have been and continue to work hard in ensuring everything possible is done to assist our customers in sustaining their tenancies.
Percentage of new tenancies sustained - St Anns Ward Note: This PI measures the number of new tenants who are still in their tenancy 12 months later.
93.5% 97.61% 93.68% 91.87% Staff have been and continue to work hard in ensuring everything possible is done to assist our customers in sustaining their tenancies.