A-1 INTRODUCTION In Task 1, a literature search and review of information rel- evant to the use of the restricted zone in the Superpave spec- ification (i.e., AASHTO MP2-97) was conducted. This search included, in particular, Strategic Highway Research Program Report SHRP-A-408, Level One Mix Design: Materials Selec- tion, Compaction, and Conditioning (see Review 1). The sur- vey also included work in progress from other research projects in order to integrate that work with NCHRP Project 9-14. The literature search and review was directed at answering the following questions: 1. What is the basis of the restricted zone? 2. What are the conclusions and recommendations of re- searchers who have evaluated gradations violating the restricted zone? 3. What are the potential variables that should be studied to evaluate gradations passing through the restricted zone? Using the information obtained from the review, the experi- mental plan (see Chapter 2) was developed. REVIEWS Individual summaries or reviews of the items found in the literature follow. The first review discusses the process by which the restricted zone was selected for Superpave mix design. The second discusses the definitions associated with the restricted zone and other gradation terms. Subsequent reviews are in chronological sequence. 1. Cominsky, R., R. B. Leahy, and E. T. Harrigan, 1994. Level One Mix Design: Materials Selection, Com- paction, and Conditioning (SHRP-A-408). Transporta- tion Research Board, National Research Council, Washington, DC. This report summarizes the research devoted to the key aspects of Superpave volumetric mixture design system under the Strategic Highway Research Program (SHRP). The first chapter documents the development of the mix design criteria for both aggregates and mixtures through a modified Delphi method. The modified Delphi method consists of presenting a series of questions to a group of expert members. This pro- cess is evolutionary in that the first set of questions discusses general issues while each subsequent set becomes more spe- cific. Under a normal Delphi process, the group members do not meet face to face; however, for the SHRP research, the experts were allowed to meet during the process, resulting in a modified Delphi method. The first two sets of questions pertained to aggregate char- acteristics and asphalt-aggregate characteristics. The members were asked to rate their degree of agreement or disagree- ment on the following seven characteristics in the Superpave method: 1. Gradation limits (6.18, 6.15), 2. Crushed faces (6.04, 5.77), 3. Natural sand content (4.54, 4.92), 4. L.A. abrasion (4.67, 4.65), 5. Aggregate soundness (5.45, 4.85), 6. Deleterious materials (5.33, 5.31), and 7. Sand equivalent (4.17, 4.23). Average rankings for each characteristic during the first- and second-round questionnaires are provided in parenthe- ses, respectively. A rating of “1” represents “very strongly disagree,” and a rating of “7” represents “very strongly agree.” In the first set of questions, controlling the gradation had the highest degree of agreement. This agreement also occurred in the second and third sets. Interestingly, limiting the natural sand content was ranked sixth in the first questionnaire and moved up to fourth during the second. The third questionnaire con- tained a few additional characteristics that were subsets of the original seven aggregate characteristics. Within gradation limits, three additional characteristics were added: minimum/ maximum aggregate sizes, control points/restricted zone, and control points only. Based on the ratings (see Table A-1), “control points only” had the highest degree of agreement, and “control points/restricted zone” had the lowest. After the third round of questions, the researchers believed it was reasonably clear which characteristics should be in- cluded in the specifications. However, specification values were less clear; therefore, a fourth-round required the group members to rank each characteristic assuming each would be included as a specification. Gradation limits were ranked sec- ond highest in the fourth round behind coarse aggregate angularity. No mention of the restricted zone was made in the report for the fourth round. The fifth and final round of questions had the following purposes: to determine specification limits and to assess the impact of external factors on the selected limits. The fifth round also asked the group members about restrictions on aggregate gradation. The majority of experts specified ag- gregate gradations either above or below the restricted zone although about half recommended gradations below the restricted zone for high traffic conditions. This is interesting APPENDIX A REVIEW OF LITERATURE RELEVANT TO RESTRICTED ZONE
Transcript
A-1
INTRODUCTION
In Task 1, a literature search and review of information rel-evant to the use of the restricted zone in the Superpave spec-ification (i.e., AASHTO MP2-97) was conducted. This searchincluded, in particular, Strategic Highway Research ProgramReport SHRP-A-408, Level One Mix Design: Materials Selec-tion, Compaction, and Conditioning (see Review 1). The sur-vey also included work in progress from other research projectsin order to integrate that work with NCHRP Project 9-14.
The literature search and review was directed at answeringthe following questions:
1. What is the basis of the restricted zone?2. What are the conclusions and recommendations of re-
searchers who have evaluated gradations violating therestricted zone?
3. What are the potential variables that should be studied toevaluate gradations passing through the restricted zone?
Using the information obtained from the review, the experi-mental plan (see Chapter 2) was developed.
REVIEWS
Individual summaries or reviews of the items found in theliterature follow. The first review discusses the process bywhich the restricted zone was selected for Superpave mixdesign. The second discusses the definitions associated withthe restricted zone and other gradation terms. Subsequentreviews are in chronological sequence.
1. Cominsky, R., R. B. Leahy, and E. T. Harrigan, 1994.Level One Mix Design: Materials Selection, Com-paction, and Conditioning (SHRP-A-408). Transporta-tion Research Board, National Research Council,Washington, DC.
This report summarizes the research devoted to the keyaspects of Superpave volumetric mixture design system underthe Strategic Highway Research Program (SHRP). The firstchapter documents the development of the mix design criteriafor both aggregates and mixtures through a modified Delphimethod. The modified Delphi method consists of presenting aseries of questions to a group of expert members. This pro-cess is evolutionary in that the first set of questions discussesgeneral issues while each subsequent set becomes more spe-cific. Under a normal Delphi process, the group members donot meet face to face; however, for the SHRP research, the
experts were allowed to meet during the process, resulting ina modified Delphi method.
The first two sets of questions pertained to aggregate char-acteristics and asphalt-aggregate characteristics. The memberswere asked to rate their degree of agreement or disagree-ment on the following seven characteristics in the Superpavemethod:
Average rankings for each characteristic during the first-and second-round questionnaires are provided in parenthe-ses, respectively. A rating of “1” represents “very stronglydisagree,” and a rating of “7” represents “very strongly agree.”
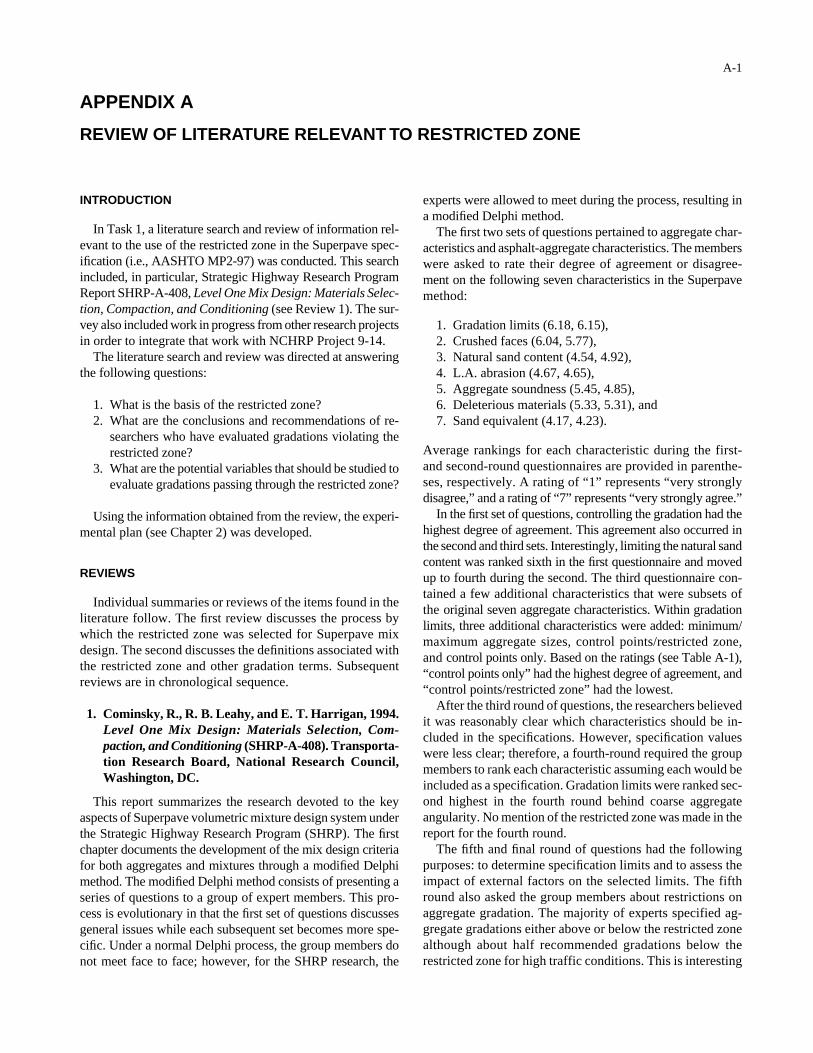
In the first set of questions, controlling the gradation had thehighest degree of agreement. This agreement also occurred inthe second and third sets. Interestingly, limiting the natural sandcontent was ranked sixth in the first questionnaire and movedup to fourth during the second. The third questionnaire con-tained a few additional characteristics that were subsets ofthe original seven aggregate characteristics. Within gradationlimits, three additional characteristics were added: minimum/maximum aggregate sizes, control points/restricted zone,and control points only. Based on the ratings (see Table A-1),“control points only” had the highest degree of agreement, and“control points/restricted zone” had the lowest.
After the third round of questions, the researchers believedit was reasonably clear which characteristics should be in-cluded in the specifications. However, specification valueswere less clear; therefore, a fourth-round required the groupmembers to rank each characteristic assuming each would beincluded as a specification. Gradation limits were ranked sec-ond highest in the fourth round behind coarse aggregateangularity. No mention of the restricted zone was made in thereport for the fourth round.
The fifth and final round of questions had the followingpurposes: to determine specification limits and to assess theimpact of external factors on the selected limits. The fifthround also asked the group members about restrictions onaggregate gradation. The majority of experts specified ag-gregate gradations either above or below the restricted zonealthough about half recommended gradations below therestricted zone for high traffic conditions. This is interesting
APPENDIX A
REVIEW OF LITERATURE RELEVANT TO RESTRICTED ZONE
because the fourth-round questionnaire did not mention therestricted zone.
At the conclusion of the fifth round, the SHRP researchersdeveloped criteria and specifications. For gradation controls, a0.45 power chart was selected for plotting gradations. Defini-tions associated with gradation control were provided for nom-inal maximum aggregate size (NMAS), maximum aggregatesize, restricted zone, and maximum density line. The restrictedzone was defined as follows: “a zone lying on the maximumdensity line extending from the 300 µm (No. 50) sieve to the2.36 mm (No. 8) sieve through which it is undesirable for thegradation to pass.”
Based on this discussion of how the restricted zone wasselected as a Superpave specification, it is unclear why therestricted zone was specified—it had the lowest degree ofagreement for gradation controls during round three and wasnot mentioned specifically again within the report until thefifth round.
2. McGennis, R. B., R. M. Anderson, T. W. Kennedy, andM. Solaimanian, 1994.Background of Superpave Asphalt Mixture Design andAnalysis (Report FHWA-SA-95-003), FHWA.
This document is a training manual provided by FHWA forthe implementation of Superpave mix design. Along withasphalt binder and mixture criteria, it details how gradationsare specified in Superpave design and provides definitions forterms relating to gradation controls such as NMAS, maximumaggregate size, maximum density line, and control points. Fol-lowing are the definitions under Superpave for these terms.These definitions are provided so that the reader is familiarwith the terminology in subsequent reviews.
• NMAS: “One sieve size larger than the first sieve toretain more than 10 percent.”
• Maximum Aggregate Size: “One sieve size larger thanthe nominal maximum aggregate size.”
• Maximum Density Line: “A line connecting the origin atthe lower left of the 0.45 power gradation chart to thegradation’s maximum aggregate size [as defined above]at the upper right of the chart.”
• Control Points: “. . . function as the master range throughwhich gradations must pass.”
The manual states that the restricted zone resides along themaximum density line between intermediate sizes (either the
A-2
4.75- or 2.36-mm) and the 0.3-mm size. It also states that therestricted zone forms a band through which gradations are notpermitted to pass. This contradicts the SHRP-A-408 report (seeReview 1, Cominsky et al. 1994) which states: “Gradationsthat pass through the restricted zone are undesirable.”
After defining the restricted zone, the manual states thatgradations that pass through the restricted zone have oftenbeen called “humped gradations” because of the characteris-tic hump in the gradation curve. It indicates that humped gra-dations typically have too much fine sand in relation to totalsand and that humped gradations practically always result intender mixtures that are difficult to compact in the field. It alsostates that gradations violating the restricted zone possess weakaggregate structures and are sensitive to asphalt content.
3. Hveem, F. N., 1940.“Gradation of Mineral Aggregates for Dense GradedBituminous Mixtures,” Proceedings, Association ofAsphalt Paving Technologists, Vol. 11.
In this paper, Hveem discussed numerous aggregate gra-dations for both hot-mix asphalt (HMA) and portland cementconcrete. One such gradation for HMA had the characteris-tic hump between the 0.6- and 0.15-mm size. Hveem indi-cated that the hump was caused by an excessive amount ofsand in this size fraction. He said that the hump is indicativeof windblown sand (smooth-textured, rounded sand) withinthe mixture and, based on his experience, resulted in HMAmixtures of low stability that are often permeable.
4. Nijboer, L. W., 1948.Plasticity as a Factor in the Design of Dense BituminousRoad Carpets. Elsevier Publishing Company, Inc.
This book is the basis of the 0.45 power gradation chart.Nijboer employed a double logarithmic gradation chart inorder to study the influence of aggregate gradation on mineralvoids (VMA). He used both a rounded gravel and an angularcoarse aggregate to show that for a gradation having a slopeof 0.45, the aggregates exhibited minimum voids in VMA.
5. Goode, J. F., and L. A. Lufsey, 1962.“A New Graphical Chart for Evaluating AggregateGradations,” Proceedings, Association of AsphaltPaving Technologists, Vol. 31.
The concept of a restricted zone around the maximum den-sity line near the 0.6-mm sieve size can probably be indi-
TABLE A-1 Average ratings from the third questionnaire (excerpt)
rectly traced back to this paper. Based on the work by Nijboer,Goode and Lufsey presented a 0.45 power grading chart forplotting aggregate gradations. This grading chart uses the sievesize (in microns) raised to the 0.45 power as the horizontal axisand the percent passing (by mass) in arithmetical scale as thevertical axis.
Within the paper, Goode and Lufsey also present theirmethod for identifying the maximum density line. Theirinterpretation consisted of drawing a straight line from theorigin of the chart to the percentage point plotted for thelargest sieve with material retained. Goode and Lufsey usedthe term “effective aggregate size.”
To use the newly developed gradation chart, Goode andLufsey evaluated 24 gradations to observe the effect of sandcontent on the stability of mixtures. The effect of sand con-tent was evaluated by producing gradations with different“hump” characteristics. These included gradations from threeparts of the country that had exhibited the tenderness prob-lem. Two of the gradations showed humps beginning belowtheir maximum density line, extending above the maximumdensity line at the 1.18-mm sieve, and falling back below themaximum density line at the 0.15-mm sieve. The other gra-dation started below the maximum density line, crossed overat the 0.25-mm sieve, and showed the hump between the1.18-mm and 0.15-mm sieves.
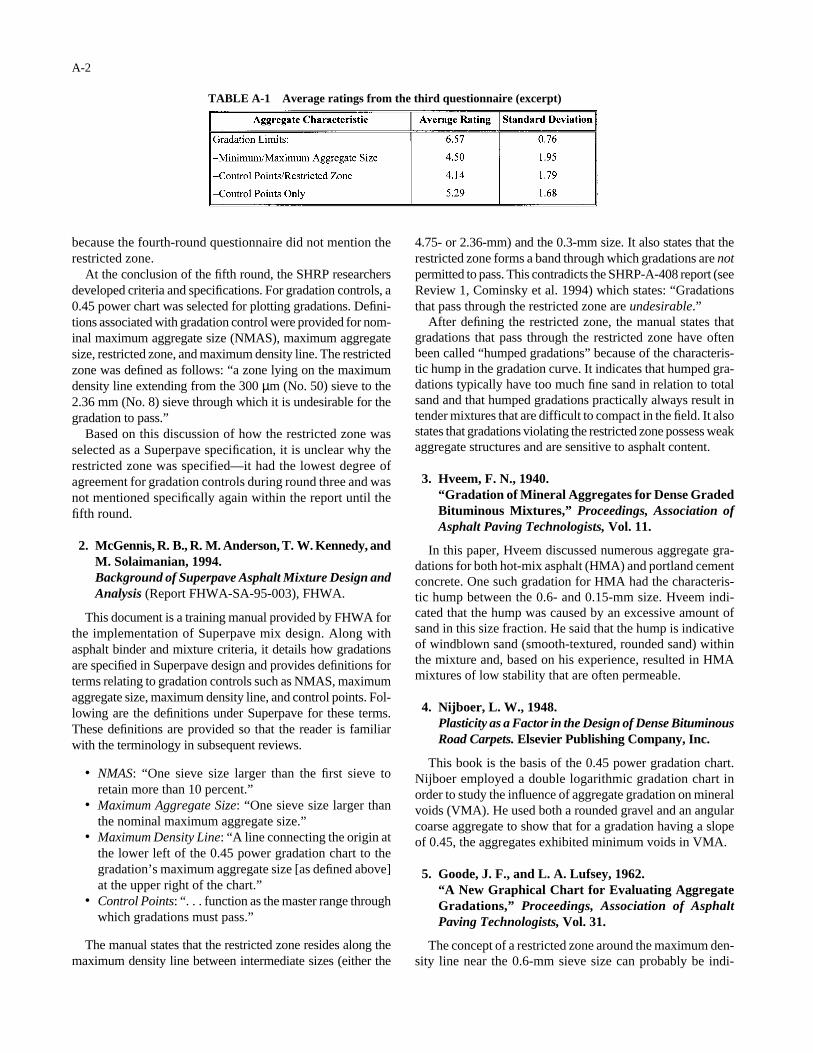
Goode and Lufsey used three different types of mixture intheir study: low in total sand, medium in total sand, and highin total sand. A gravel coarse aggregate was used that had itsfirst material retained on the 12.5-mm sieve. The blends withmedium sand content are shown in Figure A-1. The Super-
A-3
pave defined maximum density line and restricted zone arealso shown superimposed on the figure.
Goode and Lufsey found that, in general, gradations thatshow appreciable humps above the maximum density line atabout the 0.6-mm sieve produced higher VMA and lowerMarshall stabilities than did gradations plotted with lesserhumps. They used rounded gravel, sand, and a commerciallimestone filler as the aggregates for this study; the VMA andMarshall stabilities for the six medium sand content mixturesare also presented in Figure A-1. Hence, Goode and Lufseyrecommended that gradations avoid humps near the 0.6-mmsieve and not pass above the maximum density line. This rec-ommendation can be viewed as the beginning of the conceptof restricted zone. Goode and Lufsey used uncrushed coarseand fine aggregate. Their conclusions may not be valid foraggregate gradations using crushed materials.
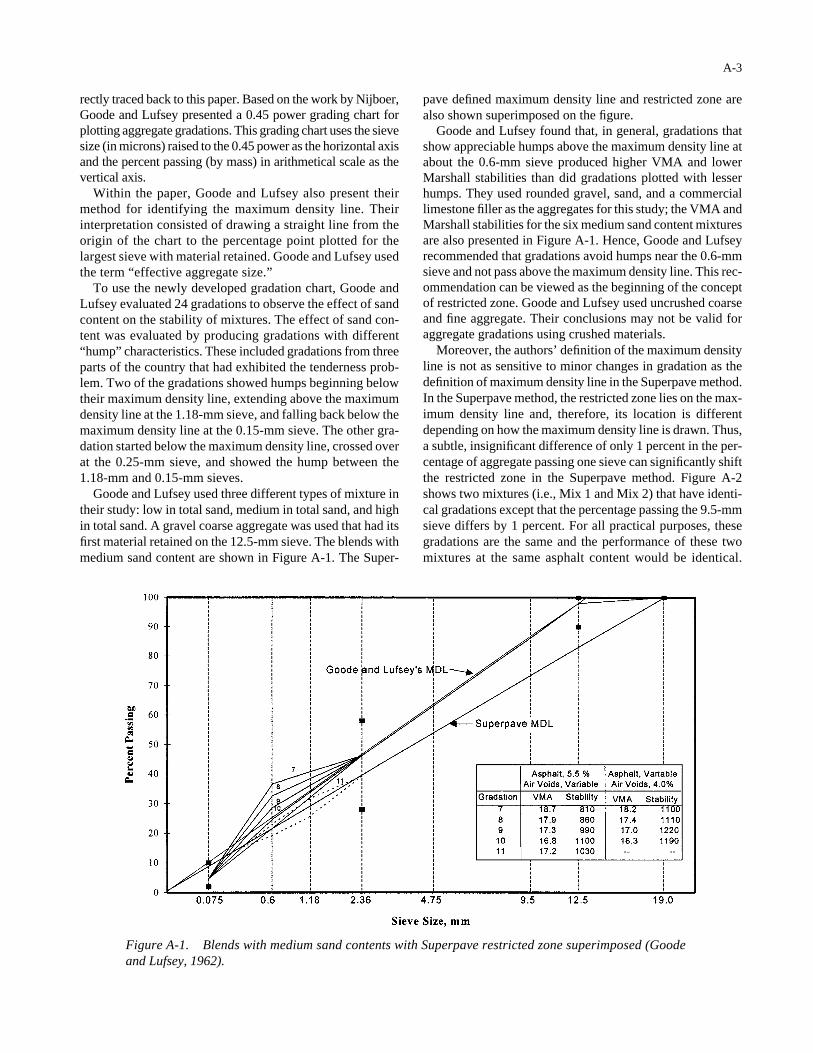
Moreover, the authors’ definition of the maximum densityline is not as sensitive to minor changes in gradation as thedefinition of maximum density line in the Superpave method.In the Superpave method, the restricted zone lies on the max-imum density line and, therefore, its location is differentdepending on how the maximum density line is drawn. Thus,a subtle, insignificant difference of only 1 percent in the per-centage of aggregate passing one sieve can significantly shiftthe restricted zone in the Superpave method. Figure A-2shows two mixtures (i.e., Mix 1 and Mix 2) that have identi-cal gradations except that the percentage passing the 9.5-mmsieve differs by 1 percent. For all practical purposes, thesegradations are the same and the performance of these twomixtures at the same asphalt content would be identical.
Figure A-1. Blends with medium sand contents with Superpave restricted zone superimposed (Goodeand Lufsey, 1962).
However, their maximum density lines and, hence, theirrestricted zones are different.
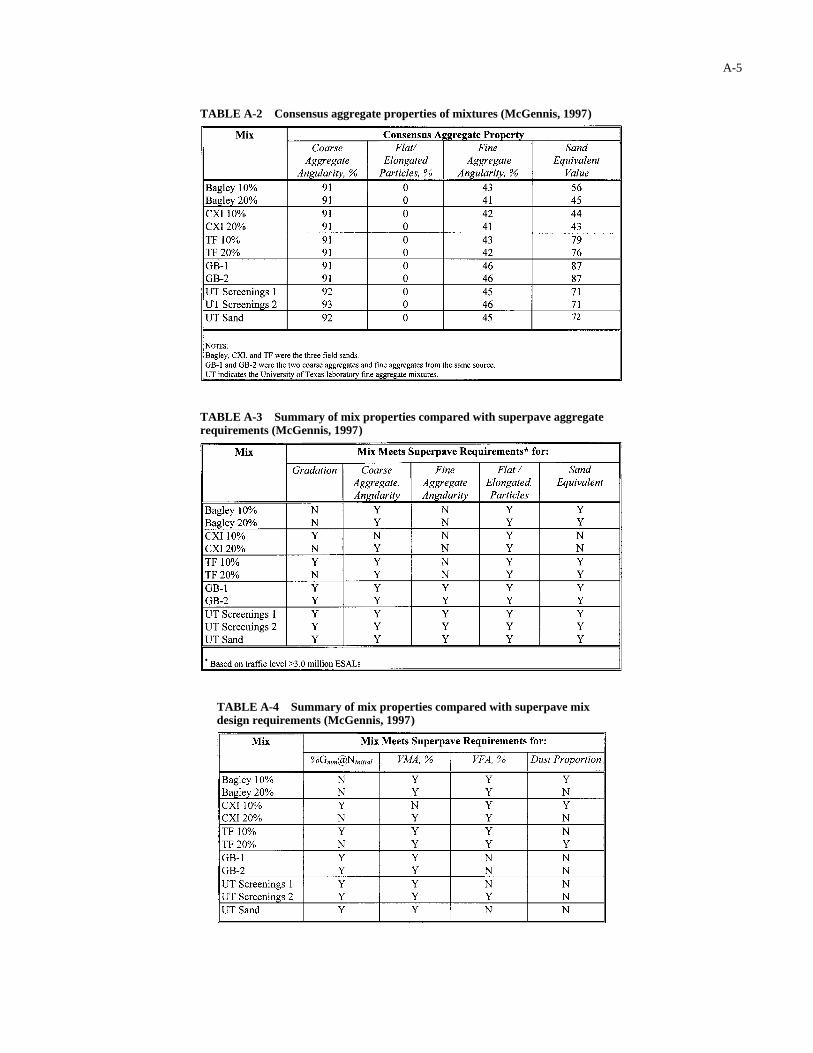
6. McGennis, R. B., 1997.“Evaluation of Materials From Northeast Texas UsingSuperpave Mix Design Technology,” TransportationResearch Record No. 1583. Transportation ResearchBoard, National Research Council, Washington, DC;pp. 98–105.
In this paper, the author presents results of a laboratorystudy to evaluate materials with known performance usingSuperpave mix design technology. The study was conductedbecause of problems encountered in asphalt overlays usingcrushed gravels.
Aggregates used included two coarse, crushed gravels anda fine aggregate from one source. It was unclear from the paperwhether the fine aggregate was the result of crushing or wasunprocessed. Additionally, two locally available unprocessedfine aggregates (i.e., Bagley and CXI), called field sands,which were characterized as marginal in quality, were used.The final aggregate used in the study was a fine aggregate (i.e.,TF) that was judged to be of higher quality than were the twounprocessed fine aggregates. The asphalt binder used in thestudy was a PG 64-22.
Various combinations of the materials were evaluatedusing Superpave mix design tests. For the mixture grada-tions, the coarse aggregate percentages were fixed and thepercentages of the different fine aggregates were varied toobtain different blends of a 19.0-mm nominal maximum sizegradation. Each of the fine aggregates, not including the onefrom the same source as the two coarse aggregates, wasblended at both 10 and 20 percent of the total aggregate mass.
A-4
The resulting gradations showed that the blends with 20 per-cent were above the Superpave restricted zone and that theblends with 10 percent were through the restricted zone.
For comparison purposes, the author blended two gradations(i.e., GB1 and GB2) using the same two gravel coarse aggre-gates and the fine aggregate from the same source. These twowere used as a baseline to compare the other mixtures. Addi-tionally, three blends (i.e., UT Scrn 1, UT Scrn 2, and UT Sand)were made using a University of Texas laboratory standard fineaggregate (limestone) with the two coarse, crushed gravels.
All 11 gradation blends were tested using the Superpave con-sensus property tests. These results are shown in Table A-2.Each of the 11 gradations were combined with the PG 64-22asphalt binder and compacted with a Superpave gyratorycompactor (SGC). The design equivalent single axle loads(ESALs) compaction effort for the mixtures was 3 to 10 mil-lion. This equated to an initial, design, and maximum numberof gyrations of 8, 96, and 152, respectively.
Full volumetric mix designs were not performed for the11 gradation blends; the author combined each gradationwith asphalt binder and then normalized the compactiondata to 4 percent air voids at the design number of gyrations(i.e., 96) using the Superpave procedures.
The properties used to evaluate the different mixtures areprovided in Tables A-3 and A-4. As is shown in these twotables, none of the 11 mixtures met all Superpave criteria (i.e.,aggregate consensus properties, or mixture volumetrics, orboth). Fine aggregate angularity precluded all of the “fieldsands” (i.e., Bagley, CXI, and TF; see Table A-3). Interest-ingly, percent theoretical maximum density at the initial num-ber of gyrations (%Gmm@Ninitial) would not have precluded twoof the field sand mixtures that passed through the restrictedzone (see Table A-4).
Figure A-2. Different restricted zones for two almost identical gradations.
TABLE A-2 Consensus aggregate properties of mixtures (McGennis, 1997)
TABLE A-3 Summary of mix properties compared with superpave aggregaterequirements (McGennis, 1997)
TABLE A-4 Summary of mix properties compared with superpave mixdesign requirements (McGennis, 1997)
A-5
Moreover, the combination of the fine aggregate angular-ity and the %Gmm@Ninitial requirement of less that 89 percentprecluded all of the mixtures that were shown to have badperformance, independently of the restricted zone guideline.Based on the results of this study, therefore, the restrictedzone was not needed to identify bad-performing mixtures.However, the fine aggregate angularity (FAA) is important.
7. Anderson, R. M., and H. U. Bahia, 1997.“Evaluation and Selection of Aggregate Gradations forAsphalt Mixtures Using Superpave,” TransportationResearch Record No. 1583. Transportation ResearchBoard, National Research Council, Washington, DC;pp. 91–97.
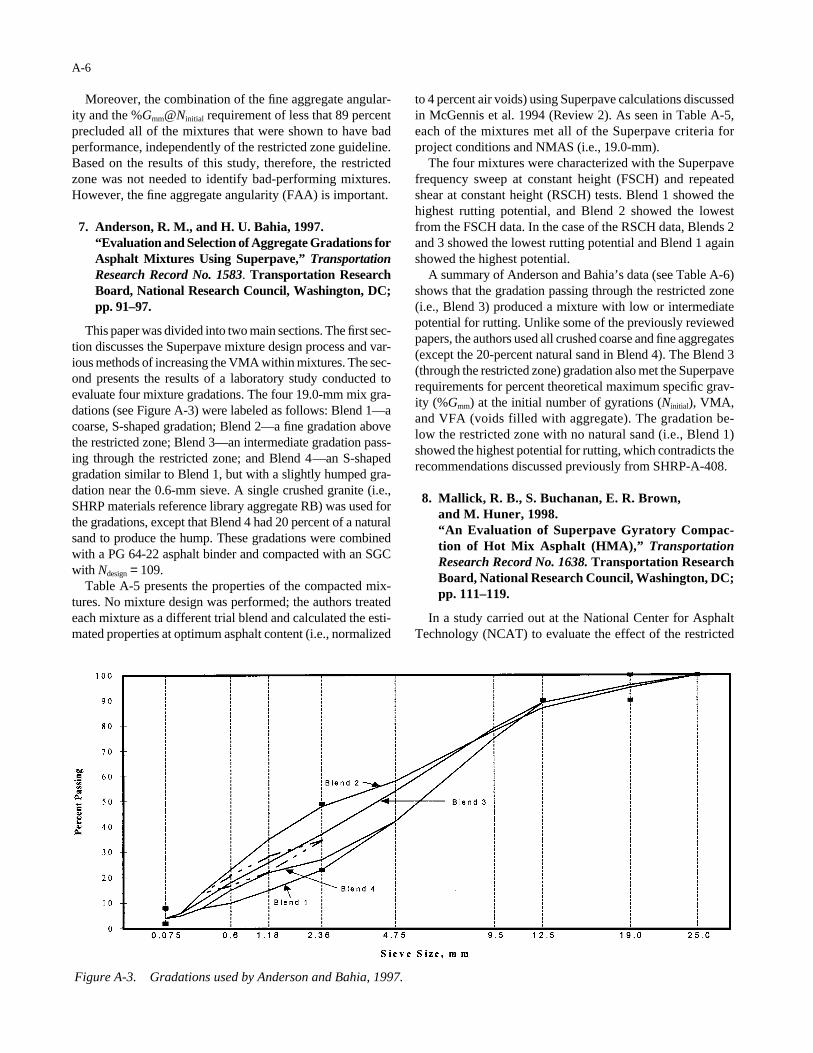
This paper was divided into two main sections. The first sec-tion discusses the Superpave mixture design process and var-ious methods of increasing the VMA within mixtures. The sec-ond presents the results of a laboratory study conducted toevaluate four mixture gradations. The four 19.0-mm mix gra-dations (see Figure A-3) were labeled as follows: Blend 1—acoarse, S-shaped gradation; Blend 2—a fine gradation abovethe restricted zone; Blend 3—an intermediate gradation pass-ing through the restricted zone; and Blend 4—an S-shapedgradation similar to Blend 1, but with a slightly humped gra-dation near the 0.6-mm sieve. A single crushed granite (i.e.,SHRP materials reference library aggregate RB) was used forthe gradations, except that Blend 4 had 20 percent of a naturalsand to produce the hump. These gradations were combinedwith a PG 64-22 asphalt binder and compacted with an SGCwith Ndesign = 109.
Table A-5 presents the properties of the compacted mix-tures. No mixture design was performed; the authors treatedeach mixture as a different trial blend and calculated the esti-mated properties at optimum asphalt content (i.e., normalized
A-6
to 4 percent air voids) using Superpave calculations discussedin McGennis et al. 1994 (Review 2). As seen in Table A-5,each of the mixtures met all of the Superpave criteria forproject conditions and NMAS (i.e., 19.0-mm).
The four mixtures were characterized with the Superpavefrequency sweep at constant height (FSCH) and repeatedshear at constant height (RSCH) tests. Blend 1 showed thehighest rutting potential, and Blend 2 showed the lowestfrom the FSCH data. In the case of the RSCH data, Blends 2and 3 showed the lowest rutting potential and Blend 1 againshowed the highest potential.
A summary of Anderson and Bahia’s data (see Table A-6)shows that the gradation passing through the restricted zone(i.e., Blend 3) produced a mixture with low or intermediatepotential for rutting. Unlike some of the previously reviewedpapers, the authors used all crushed coarse and fine aggregates(except the 20-percent natural sand in Blend 4). The Blend 3(through the restricted zone) gradation also met the Superpaverequirements for percent theoretical maximum specific grav-ity (%Gmm) at the initial number of gyrations (Ninitial), VMA,and VFA (voids filled with aggregate). The gradation be-low the restricted zone with no natural sand (i.e., Blend 1)showed the highest potential for rutting, which contradicts therecommendations discussed previously from SHRP-A-408.
8. Mallick, R. B., S. Buchanan, E. R. Brown, and M. Huner, 1998.“An Evaluation of Superpave Gyratory Compac-tion of Hot Mix Asphalt (HMA),” TransportationResearch Record No. 1638. Transportation ResearchBoard, National Research Council, Washington, DC;pp. 111–119.
In a study carried out at the National Center for AsphaltTechnology (NCAT) to evaluate the effect of the restricted
Figure A-3. Gradations used by Anderson and Bahia, 1997.
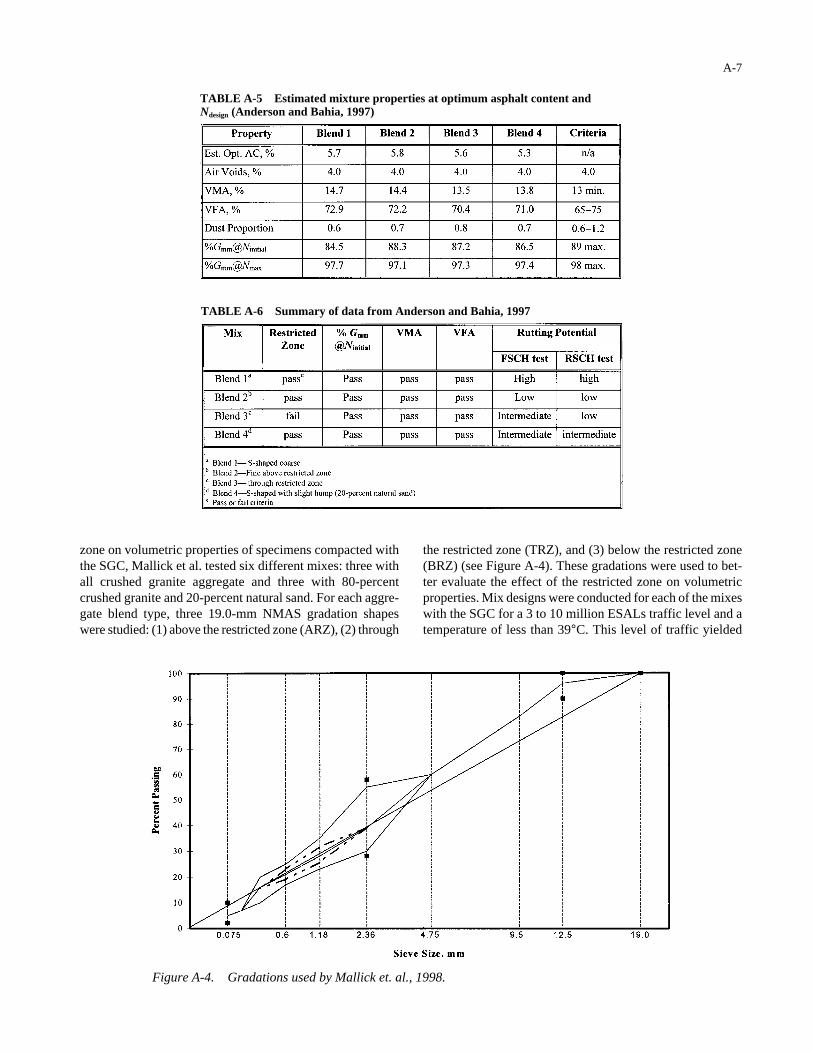
zone on volumetric properties of specimens compacted withthe SGC, Mallick et al. tested six different mixes: three withall crushed granite aggregate and three with 80-percentcrushed granite and 20-percent natural sand. For each aggre-gate blend type, three 19.0-mm NMAS gradation shapeswere studied: (1) above the restricted zone (ARZ), (2) through
A-7
the restricted zone (TRZ), and (3) below the restricted zone(BRZ) (see Figure A-4). These gradations were used to bet-ter evaluate the effect of the restricted zone on volumetricproperties. Mix designs were conducted for each of the mixeswith the SGC for a 3 to 10 million ESALs traffic level and atemperature of less than 39°C. This level of traffic yielded
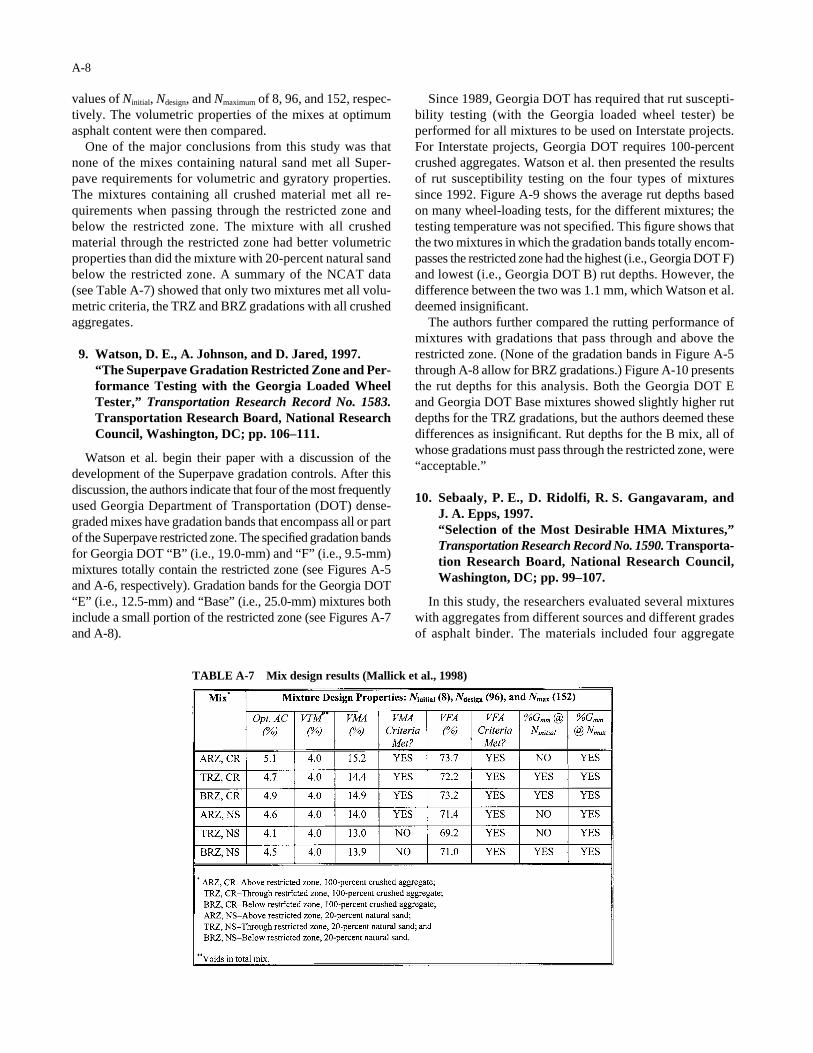
TABLE A-5 Estimated mixture properties at optimum asphalt content and Ndesign (Anderson and Bahia, 1997)
TABLE A-6 Summary of data from Anderson and Bahia, 1997
Figure A-4. Gradations used by Mallick et. al., 1998.
values of Ninitial, Ndesign, and Nmaximum of 8, 96, and 152, respec-tively. The volumetric properties of the mixes at optimumasphalt content were then compared.
One of the major conclusions from this study was thatnone of the mixes containing natural sand met all Super-pave requirements for volumetric and gyratory properties.The mixtures containing all crushed material met all re-quirements when passing through the restricted zone andbelow the restricted zone. The mixture with all crushedmaterial through the restricted zone had better volumetricproperties than did the mixture with 20-percent natural sandbelow the restricted zone. A summary of the NCAT data(see Table A-7) showed that only two mixtures met all volu-metric criteria, the TRZ and BRZ gradations with all crushedaggregates.
9. Watson, D. E., A. Johnson, and D. Jared, 1997.“The Superpave Gradation Restricted Zone and Per-formance Testing with the Georgia Loaded WheelTester,” Transportation Research Record No. 1583.Transportation Research Board, National ResearchCouncil, Washington, DC; pp. 106–111.
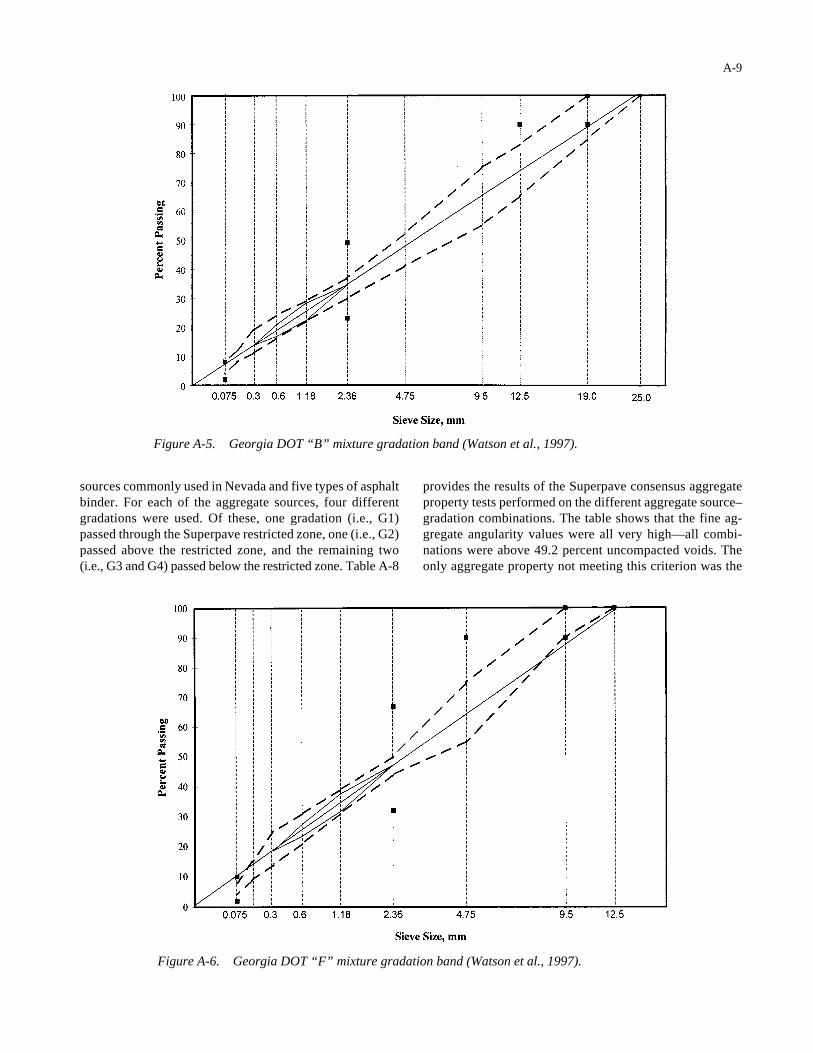
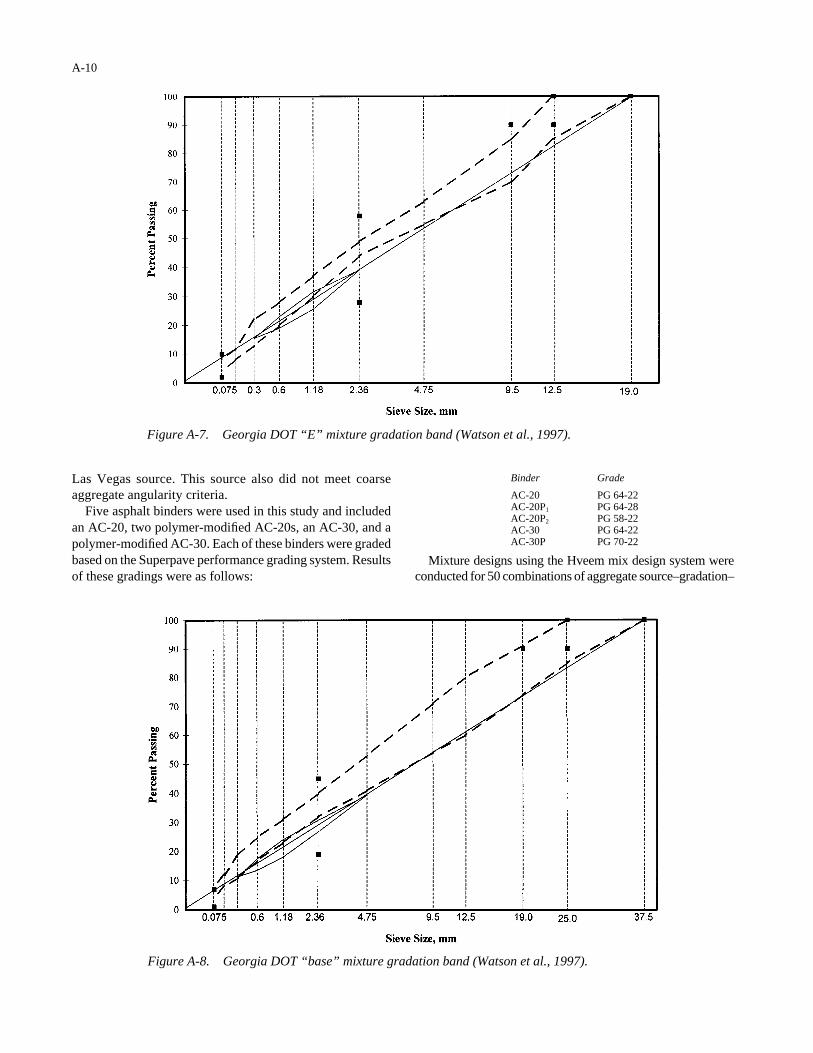
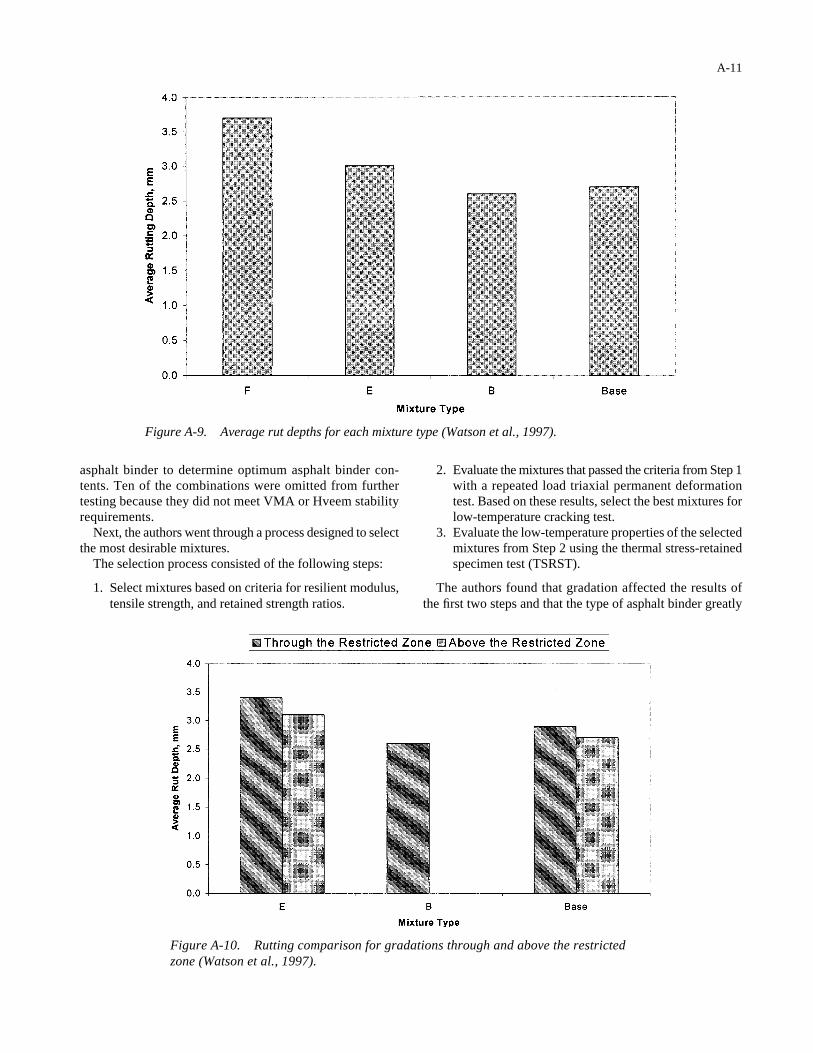
Watson et al. begin their paper with a discussion of thedevelopment of the Superpave gradation controls. After thisdiscussion, the authors indicate that four of the most frequentlyused Georgia Department of Transportation (DOT) dense-graded mixes have gradation bands that encompass all or partof the Superpave restricted zone. The specified gradation bandsfor Georgia DOT “B” (i.e., 19.0-mm) and “F” (i.e., 9.5-mm)mixtures totally contain the restricted zone (see Figures A-5and A-6, respectively). Gradation bands for the Georgia DOT“E” (i.e., 12.5-mm) and “Base” (i.e., 25.0-mm) mixtures bothinclude a small portion of the restricted zone (see Figures A-7and A-8).
A-8
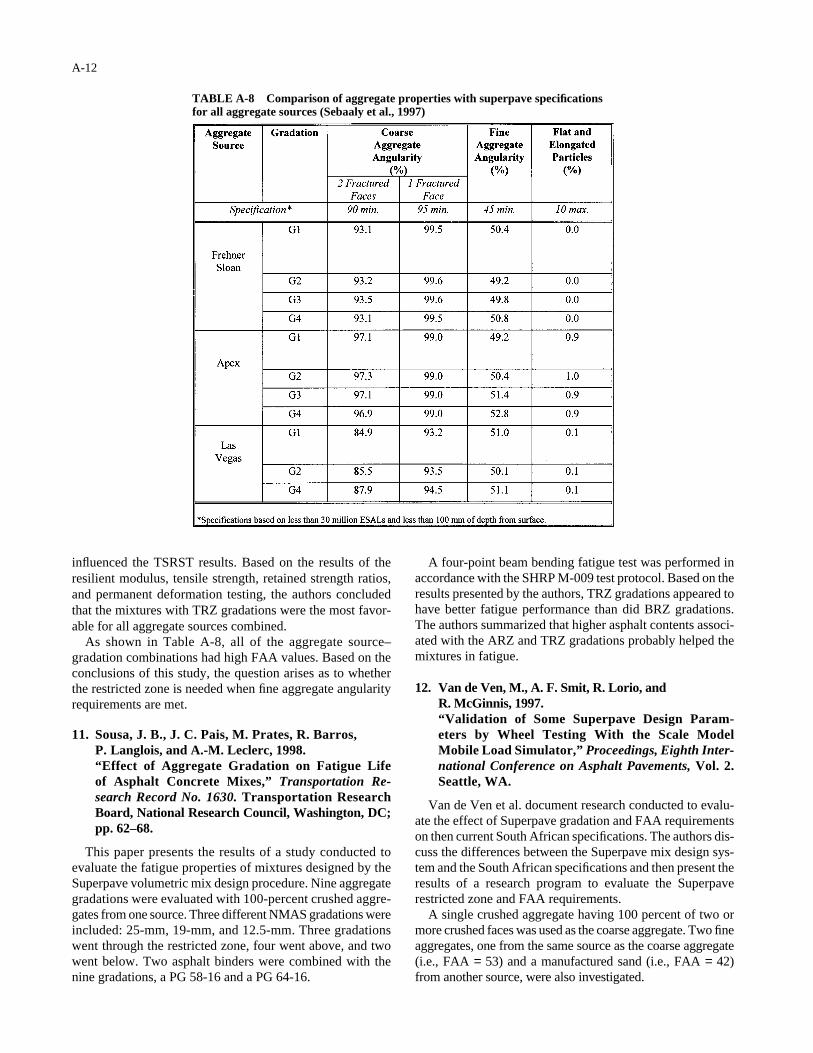
Since 1989, Georgia DOT has required that rut suscepti-bility testing (with the Georgia loaded wheel tester) be performed for all mixtures to be used on Interstate projects.For Interstate projects, Georgia DOT requires 100-percentcrushed aggregates. Watson et al. then presented the resultsof rut susceptibility testing on the four types of mixturessince 1992. Figure A-9 shows the average rut depths basedon many wheel-loading tests, for the different mixtures; thetesting temperature was not specified. This figure shows thatthe two mixtures in which the gradation bands totally encom-passes the restricted zone had the highest (i.e., Georgia DOT F)and lowest (i.e., Georgia DOT B) rut depths. However, thedifference between the two was 1.1 mm, which Watson et al.deemed insignificant.
The authors further compared the rutting performance ofmixtures with gradations that pass through and above therestricted zone. (None of the gradation bands in Figure A-5through A-8 allow for BRZ gradations.) Figure A-10 presentsthe rut depths for this analysis. Both the Georgia DOT Eand Georgia DOT Base mixtures showed slightly higher rutdepths for the TRZ gradations, but the authors deemed thesedifferences as insignificant. Rut depths for the B mix, all ofwhose gradations must pass through the restricted zone, were“acceptable.”
10. Sebaaly, P. E., D. Ridolfi, R. S. Gangavaram, and J. A. Epps, 1997.“Selection of the Most Desirable HMA Mixtures,”Transportation Research Record No. 1590. Transporta-tion Research Board, National Research Council,Washington, DC; pp. 99–107.
In this study, the researchers evaluated several mixtureswith aggregates from different sources and different gradesof asphalt binder. The materials included four aggregate
TABLE A-7 Mix design results (Mallick et al., 1998)
sources commonly used in Nevada and five types of asphaltbinder. For each of the aggregate sources, four differentgradations were used. Of these, one gradation (i.e., G1)passed through the Superpave restricted zone, one (i.e., G2)passed above the restricted zone, and the remaining two(i.e., G3 and G4) passed below the restricted zone. Table A-8
A-9
provides the results of the Superpave consensus aggregateproperty tests performed on the different aggregate source–gradation combinations. The table shows that the fine ag-gregate angularity values were all very high—all combi-nations were above 49.2 percent uncompacted voids. Theonly aggregate property not meeting this criterion was the
Figure A-5. Georgia DOT “B” mixture gradation band (Watson et al., 1997).
Figure A-6. Georgia DOT “F” mixture gradation band (Watson et al., 1997).
Las Vegas source. This source also did not meet coarseaggregate angularity criteria.
Five asphalt binders were used in this study and includedan AC-20, two polymer-modified AC-20s, an AC-30, and apolymer-modified AC-30. Each of these binders were gradedbased on the Superpave performance grading system. Resultsof these gradings were as follows:
Mixture designs using the Hveem mix design system wereconducted for 50 combinations of aggregate source–gradation–
Figure A-7. Georgia DOT “E” mixture gradation band (Watson et al., 1997).
Figure A-8. Georgia DOT “base” mixture gradation band (Watson et al., 1997).
asphalt binder to determine optimum asphalt binder con-tents. Ten of the combinations were omitted from furthertesting because they did not meet VMA or Hveem stabilityrequirements.
Next, the authors went through a process designed to selectthe most desirable mixtures.
The selection process consisted of the following steps:
1. Select mixtures based on criteria for resilient modulus,tensile strength, and retained strength ratios.
A-11
2. Evaluate the mixtures that passed the criteria from Step 1with a repeated load triaxial permanent deformationtest. Based on these results, select the best mixtures forlow-temperature cracking test.
3. Evaluate the low-temperature properties of the selectedmixtures from Step 2 using the thermal stress-retainedspecimen test (TSRST).
The authors found that gradation affected the results ofthe first two steps and that the type of asphalt binder greatly
Figure A-9. Average rut depths for each mixture type (Watson et al., 1997).
Figure A-10. Rutting comparison for gradations through and above the restrictedzone (Watson et al., 1997).
influenced the TSRST results. Based on the results of theresilient modulus, tensile strength, retained strength ratios,and permanent deformation testing, the authors concludedthat the mixtures with TRZ gradations were the most favor-able for all aggregate sources combined.
As shown in Table A-8, all of the aggregate source–gradation combinations had high FAA values. Based on theconclusions of this study, the question arises as to whetherthe restricted zone is needed when fine aggregate angularityrequirements are met.
11. Sousa, J. B., J. C. Pais, M. Prates, R. Barros, P. Langlois, and A.-M. Leclerc, 1998.“Effect of Aggregate Gradation on Fatigue Life of Asphalt Concrete Mixes,” Transportation Re-search Record No. 1630. Transportation ResearchBoard, National Research Council, Washington, DC; pp. 62–68.
This paper presents the results of a study conducted toevaluate the fatigue properties of mixtures designed by theSuperpave volumetric mix design procedure. Nine aggregategradations were evaluated with 100-percent crushed aggre-gates from one source. Three different NMAS gradations wereincluded: 25-mm, 19-mm, and 12.5-mm. Three gradationswent through the restricted zone, four went above, and twowent below. Two asphalt binders were combined with thenine gradations, a PG 58-16 and a PG 64-16.
A-12
A four-point beam bending fatigue test was performed inaccordance with the SHRP M-009 test protocol. Based on theresults presented by the authors, TRZ gradations appeared tohave better fatigue performance than did BRZ gradations.The authors summarized that higher asphalt contents associ-ated with the ARZ and TRZ gradations probably helped themixtures in fatigue.
12. Van de Ven, M., A. F. Smit, R. Lorio, and R. McGinnis, 1997.“Validation of Some Superpave Design Param-eters by Wheel Testing With the Scale ModelMobile Load Simulator,” Proceedings, Eighth Inter-national Conference on Asphalt Pavements, Vol. 2.Seattle, WA.
Van de Ven et al. document research conducted to evalu-ate the effect of Superpave gradation and FAA requirementson then current South African specifications. The authors dis-cuss the differences between the Superpave mix design sys-tem and the South African specifications and then present theresults of a research program to evaluate the Superpaverestricted zone and FAA requirements.
A single crushed aggregate having 100 percent of two ormore crushed faces was used as the coarse aggregate. Two fineaggregates, one from the same source as the coarse aggregate(i.e., FAA = 53) and a manufactured sand (i.e., FAA = 42)from another source, were also investigated.
TABLE A-8 Comparison of aggregate properties with superpave specificationsfor all aggregate sources (Sebaaly et al., 1997)
Three aggregate gradations using the single source wereinitially designed using Superpave protocols with an initial,design, and maximum number of gyrations equal to 9, 142,and 233, respectively. Two of the gradations met a 9.5-mmNMAS gradation and passed above and below the restrictedzone. One of the gradations was a 12.5-mm NMAS, but had 88 percent passing the 9.5-mm sieve and was consid-ered a 9.5-mm NMAS gradation by the authors. Using thecharacteristics of 9.5-mm NMAS gradations, this gradationpassed through the restricted zone. Two additional grada-tions were developed with the BRZ blend using 25 and 50 percent of the manufactured fine aggregate (i.e., FAA = 43). This was done to evaluate the effect of FAA on mixproperties.
Performance testing conducted on the five mixes includedindirect tensile strength and stiffness at 25°C; dynamic creepat 40°C; direct shear test at 40, 50, and 60°C; and the modelmobile load simulator (MMLS) at 40°C.
Results of the testing indicated that the TRZ mix providedhigher indirect tensile strength and stiffness, resistance todynamic creep, resistance to shear failure (i.e., direct shear),and rutting under the MMLS. Based upon these results, theauthors concluded that the restricted zone specification doesnot necessarily influence rutting resistance.
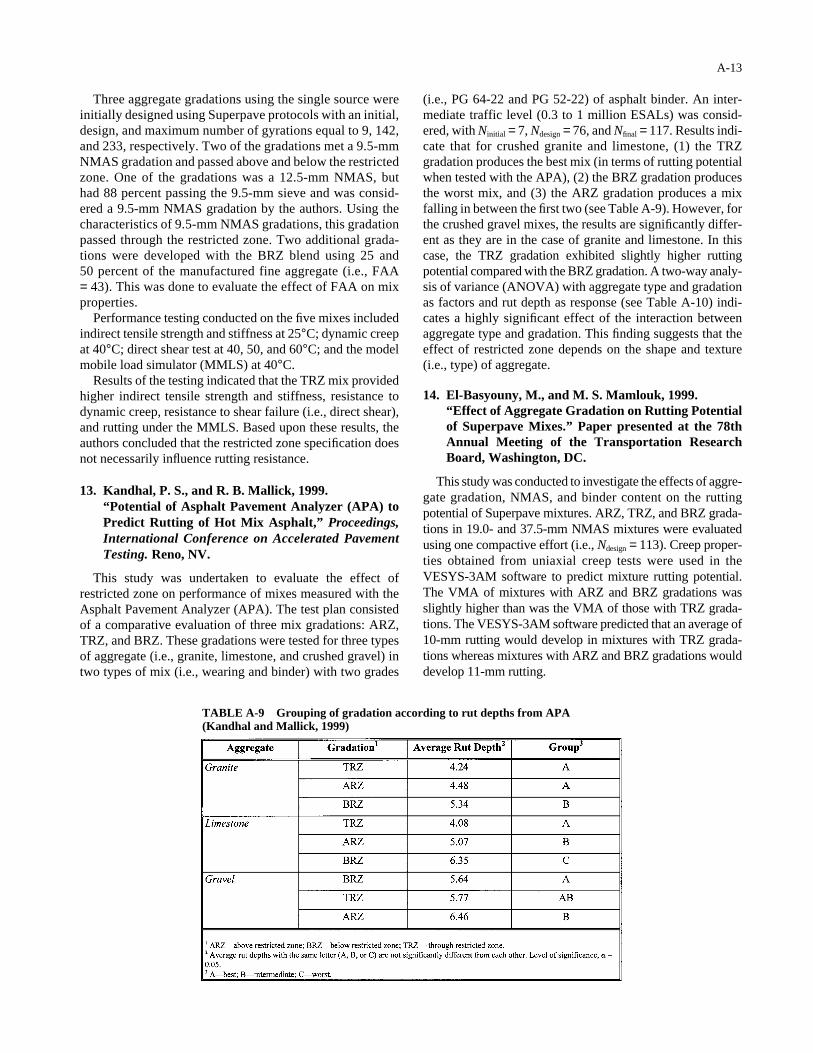
13. Kandhal, P. S., and R. B. Mallick, 1999.“Potential of Asphalt Pavement Analyzer (APA) toPredict Rutting of Hot Mix Asphalt,” Proceedings,International Conference on Accelerated PavementTesting. Reno, NV.
This study was undertaken to evaluate the effect ofrestricted zone on performance of mixes measured with theAsphalt Pavement Analyzer (APA). The test plan consistedof a comparative evaluation of three mix gradations: ARZ,TRZ, and BRZ. These gradations were tested for three typesof aggregate (i.e., granite, limestone, and crushed gravel) intwo types of mix (i.e., wearing and binder) with two grades
A-13
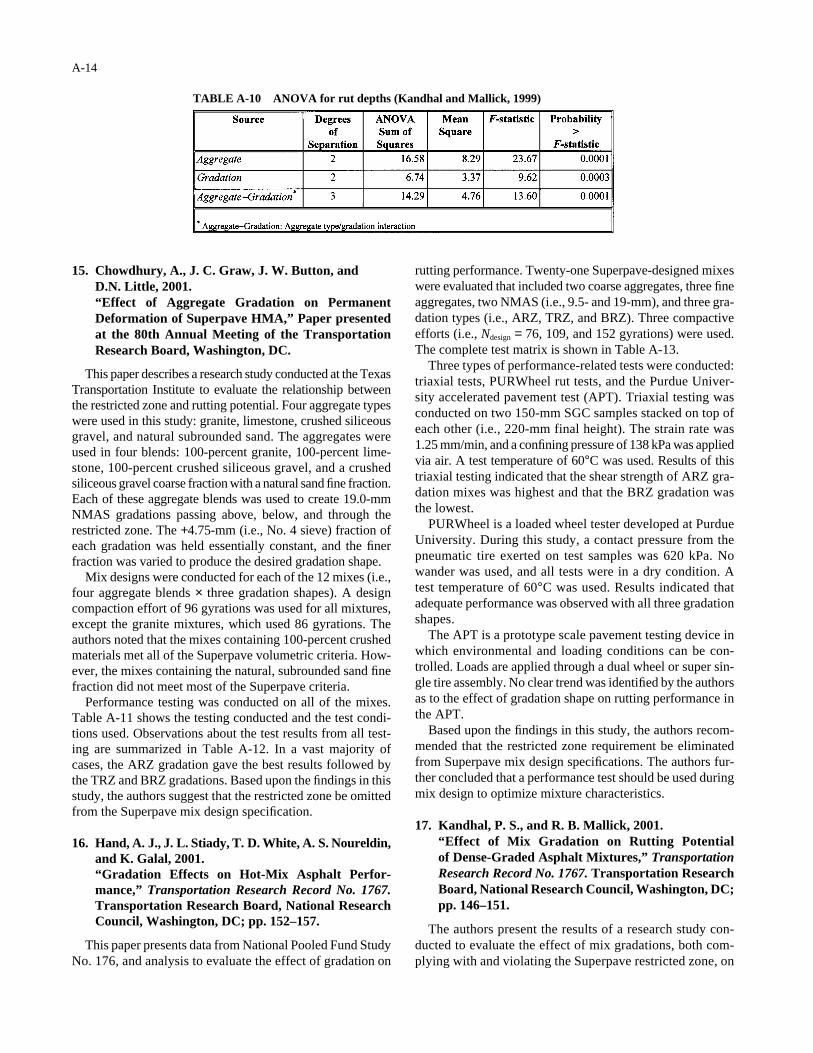
(i.e., PG 64-22 and PG 52-22) of asphalt binder. An inter-mediate traffic level (0.3 to 1 million ESALs) was consid-ered, with Ninitial = 7, Ndesign = 76, and Nfinal = 117. Results indi-cate that for crushed granite and limestone, (1) the TRZgradation produces the best mix (in terms of rutting potentialwhen tested with the APA), (2) the BRZ gradation producesthe worst mix, and (3) the ARZ gradation produces a mixfalling in between the first two (see Table A-9). However, forthe crushed gravel mixes, the results are significantly differ-ent as they are in the case of granite and limestone. In thiscase, the TRZ gradation exhibited slightly higher ruttingpotential compared with the BRZ gradation. A two-way analy-sis of variance (ANOVA) with aggregate type and gradationas factors and rut depth as response (see Table A-10) indi-cates a highly significant effect of the interaction betweenaggregate type and gradation. This finding suggests that theeffect of restricted zone depends on the shape and texture(i.e., type) of aggregate.
14. El-Basyouny, M., and M. S. Mamlouk, 1999.“Effect of Aggregate Gradation on Rutting Potentialof Superpave Mixes.” Paper presented at the 78thAnnual Meeting of the Transportation ResearchBoard, Washington, DC.
This study was conducted to investigate the effects of aggre-gate gradation, NMAS, and binder content on the ruttingpotential of Superpave mixtures. ARZ, TRZ, and BRZ grada-tions in 19.0- and 37.5-mm NMAS mixtures were evaluatedusing one compactive effort (i.e., Ndesign = 113). Creep proper-ties obtained from uniaxial creep tests were used in theVESYS-3AM software to predict mixture rutting potential.The VMA of mixtures with ARZ and BRZ gradations wasslightly higher than was the VMA of those with TRZ grada-tions. The VESYS-3AM software predicted that an average of10-mm rutting would develop in mixtures with TRZ grada-tions whereas mixtures with ARZ and BRZ gradations woulddevelop 11-mm rutting.
TABLE A-9 Grouping of gradation according to rut depths from APA (Kandhal and Mallick, 1999)
15. Chowdhury, A., J. C. Graw, J. W. Button, and D.N. Little, 2001.“Effect of Aggregate Gradation on PermanentDeformation of Superpave HMA,” Paper presentedat the 80th Annual Meeting of the TransportationResearch Board, Washington, DC.
This paper describes a research study conducted at the TexasTransportation Institute to evaluate the relationship betweenthe restricted zone and rutting potential. Four aggregate typeswere used in this study: granite, limestone, crushed siliceousgravel, and natural subrounded sand. The aggregates wereused in four blends: 100-percent granite, 100-percent lime-stone, 100-percent crushed siliceous gravel, and a crushedsiliceous gravel coarse fraction with a natural sand fine fraction.Each of these aggregate blends was used to create 19.0-mmNMAS gradations passing above, below, and through therestricted zone. The +4.75-mm (i.e., No. 4 sieve) fraction ofeach gradation was held essentially constant, and the finerfraction was varied to produce the desired gradation shape.
Mix designs were conducted for each of the 12 mixes (i.e.,four aggregate blends × three gradation shapes). A designcompaction effort of 96 gyrations was used for all mixtures,except the granite mixtures, which used 86 gyrations. Theauthors noted that the mixes containing 100-percent crushedmaterials met all of the Superpave volumetric criteria. How-ever, the mixes containing the natural, subrounded sand finefraction did not meet most of the Superpave criteria.
Performance testing was conducted on all of the mixes.Table A-11 shows the testing conducted and the test condi-tions used. Observations about the test results from all test-ing are summarized in Table A-12. In a vast majority ofcases, the ARZ gradation gave the best results followed bythe TRZ and BRZ gradations. Based upon the findings in thisstudy, the authors suggest that the restricted zone be omittedfrom the Superpave mix design specification.
16. Hand, A. J., J. L. Stiady, T. D. White, A. S. Noureldin,and K. Galal, 2001.“Gradation Effects on Hot-Mix Asphalt Perfor-mance,” Transportation Research Record No. 1767.Transportation Research Board, National ResearchCouncil, Washington, DC; pp. 152–157.
This paper presents data from National Pooled Fund StudyNo. 176, and analysis to evaluate the effect of gradation on
A-14
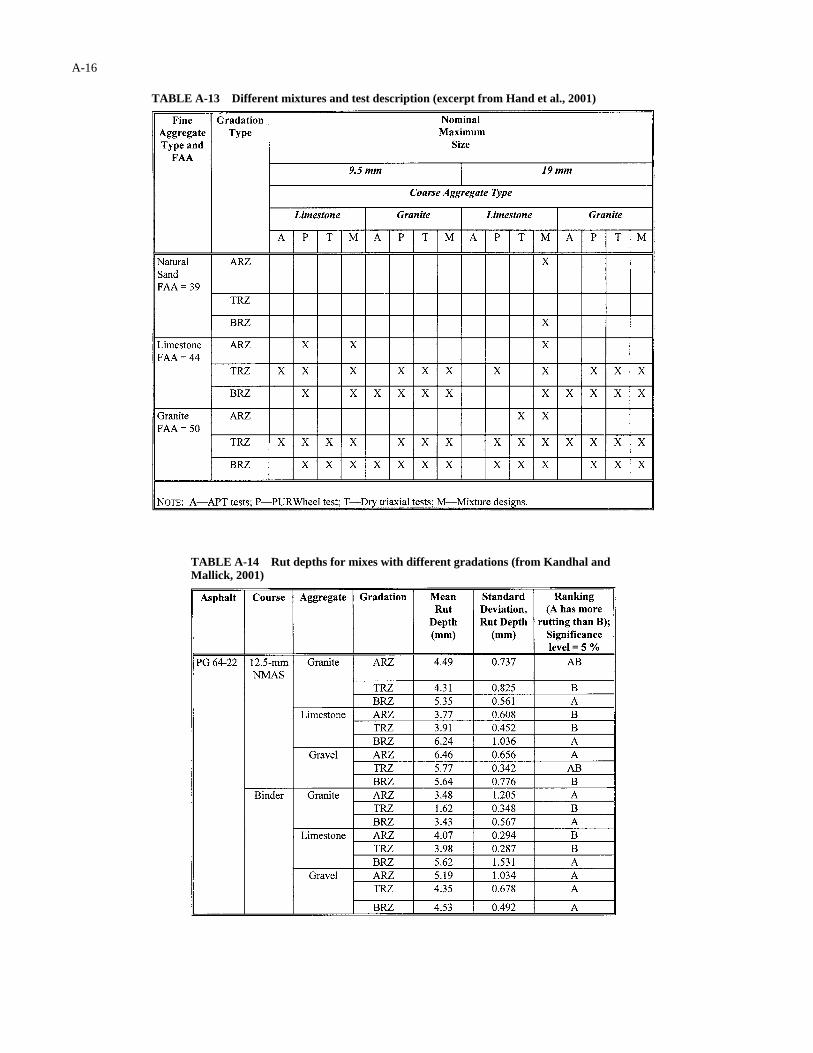
rutting performance. Twenty-one Superpave-designed mixeswere evaluated that included two coarse aggregates, three fineaggregates, two NMAS (i.e., 9.5- and 19-mm), and three gra-dation types (i.e., ARZ, TRZ, and BRZ). Three compactiveefforts (i.e., Ndesign = 76, 109, and 152 gyrations) were used.The complete test matrix is shown in Table A-13.
Three types of performance-related tests were conducted:triaxial tests, PURWheel rut tests, and the Purdue Univer-sity accelerated pavement test (APT). Triaxial testing wasconducted on two 150-mm SGC samples stacked on top ofeach other (i.e., 220-mm final height). The strain rate was1.25 mm/min, and a confining pressure of 138 kPa was appliedvia air. A test temperature of 60°C was used. Results of thistriaxial testing indicated that the shear strength of ARZ gra-dation mixes was highest and that the BRZ gradation wasthe lowest.
PURWheel is a loaded wheel tester developed at PurdueUniversity. During this study, a contact pressure from thepneumatic tire exerted on test samples was 620 kPa. Nowander was used, and all tests were in a dry condition. Atest temperature of 60°C was used. Results indicated thatadequate performance was observed with all three gradationshapes.
The APT is a prototype scale pavement testing device inwhich environmental and loading conditions can be con-trolled. Loads are applied through a dual wheel or super sin-gle tire assembly. No clear trend was identified by the authorsas to the effect of gradation shape on rutting performance inthe APT.
Based upon the findings in this study, the authors recom-mended that the restricted zone requirement be eliminatedfrom Superpave mix design specifications. The authors fur-ther concluded that a performance test should be used duringmix design to optimize mixture characteristics.
17. Kandhal, P. S., and R. B. Mallick, 2001.“Effect of Mix Gradation on Rutting Potential of Dense-Graded Asphalt Mixtures,” TransportationResearch Record No. 1767. Transportation ResearchBoard, National Research Council, Washington, DC;pp. 146–151.
The authors present the results of a research study con-ducted to evaluate the effect of mix gradations, both com-plying with and violating the Superpave restricted zone, on
TABLE A-10 ANOVA for rut depths (Kandhal and Mallick, 1999)
TABLE A-11 Different mixtures and test description (excerpt from Chowdhuryet al., 2001)
TABLE A-12 Resistance to permanent deformation ranking (at 46°C and design asphalt content)(excerpt from Chowdhury et al., 2001)
A-15
A-16
TABLE A-13 Different mixtures and test description (excerpt from Hand et al., 2001)
TABLE A-14 Rut depths for mixes with different gradations (from Kandhal andMallick, 2001)
rutting potential. Three aggregates (i.e., granite, limestone,and crushed gravel), two NMAS (i.e., 12.5- and 19.0-mm),and three gradation shapes (i.e., ARZ, BRZ, and TRZ) wereincluded in the study. Superpave mix designs were con-ducted on the 18 mix combinations using an Ndesign value of76 gyrations.
Two performance tests, both related to permanent defor-mation, were conducted on each of the 18 mixes. First, theAPA was used to test the specimens. Samples for APAtesting were cylindrical and compacted to 4 percent airvoids. A test temperature of 64°C was used. The secondtest was the RSCH test conducted with the Superpaveshear tester.
Results of APA testing are summarized in Table A-14.This table also shows the results of the Duncan’s multiplerange tests for each subset of NMAS and gradation. For thegranite and limestone aggregates (i.e., both NMAS), the BRZgradation had the highest magnitude of rutting, and the TRZhad the lowest. For the gravel aggregate, the BRZ gradationhad the lowest amount of rutting, and the ARZ gradation hadthe highest.
Similar results were shown for the granite and limestoneaggregates with the RSCH test; the BRZ gradation had thehighest peak shear strain, and the TRZ gradation tended tohave the lowest. For the gravel aggregate, the TRZ gradationalways had the lowest peak shear strain, and the ARZ grada-tion had the highest. It was concluded that TRZ gradations per-form as well (if not better) than do gradations that fall outsidethe restricted zone with respect to rutting.
A-17
18. Hand, A. J., and A. L. Epps, 2001.“Impact of Gradation Relative to SuperpaveRestricted Zone on Hot-Mix Asphalt Performance,”Transportation Research Record No. 1767. Trans-portation Research Board, National Research Coun-cil, Washington, DC; pp. 158–166.
This paper constituted a literature review of 13 publishedpapers or research reports to provide a summary of recentwork related to the impact of the Superpave restricted zone onHMA performance. The documents surveyed included anextensive range of aggregate types, NMAS, gradation shapes,and performance testing. Performance tests included dynamiccreep, triaxial, gyratory testing machine, beam fatigue tests,loaded wheel testers, and a model mobile load simulator.
Based upon the findings reviewed, the authors stated thatARZ and TRZ gradations were clearly better performersthan were BRZ gradations. The authors concluded that norelationship existed between the restricted zone and HMAperformance.
SUMMARY OF FINDINGS
Various researchers have evaluated the restricted zone inmixes with NMAS ranging from 9.5 to 37.5 mm and differentcompactive efforts ranging from 75 to 150 Ndesign gyrations.Generally, the mixtures that did not violate the restricted zonewere not necessarily superior to the mixtures that did violatethe restricted zone.
B-1
The compacted aggregate resistance (CAR) test evaluatesthe shear resistance of fine aggregate materials. The follow-ing procedure is intended for use on the combined fine aggre-gate materials to be used in the paving mixture. The perfor-mance of individual components can be judged providedcommon sense is used. For example, a high-fines componentwill give a high value, but could not represent 100 percent ofthe fine aggregate material.
EQUIPMENT NEEDED
• Marshall mold with base-plate attached (welded orsecured in a permanent manner),
• Marshall mold collar,• Marshall compaction hammer,• Mixing bowl and utensils,• Riffle splitter,• Screen shaker,• 2.36-m (No. 8) sieve,• Drying oven,• Balance (at least 8000-g capacity accurate to 0. 1 g),• Marshall stability and flow machine,• Graph recorder with 5,000-lb graph paper, and• 1.5-in.-diameter × 1.5-in.-high steel round stock (top and
bottom are flat).
PROCEDURE
1. Secure a representative 5000- to 6000-g sample by rif-fle splitting. Splitting should be performed at or nearsaturated–surface dry (SSD) condition to prevent lossof fines.
2. Sieve this portion to refusal over a 2.36-mm (No. 8)screen, again, at or near SSD to prevent the loss of fines.A Gilson 2′ × 3′ screen shaker is recommended. Discardthe material retained on the 2.36-mm (No. 8) sieve.
3. Oven dry the material finer than the No. 8 sieve to aconstant weight at 110 ± 5°C (230 ± 10°F).
4. Remove from the oven and cool the material to ambi-ent temperature.
5. Weigh the material to the nearest 0. 1 g.6. Add 1.75 percent water by dry weight of the sample
and mix thoroughly.7. Reduce material by riffle splitting or quartering to
approximately 1100 g as quickly as possible to reducemoisture loss. Record this weight. Remaining preparedmaterial may be used within 1 h if kept in a sealed con-
tainer. Secondary absorption after a period of time mayrequire that the drying procedure be repeated.
8. Cover the Marshall compaction hammer striking facewith cellophane (plastic wrap held in place with a rub-ber band) or aluminum foil. This will prevent particlesfrom adhering to the striking face surface and willproduce a smooth bearing surface on the compactedspecimen.
9. Place material in 4-in.-diameter Marshall mold meet-ing the requirements of ASTM D1559. Spade thematerial with a spatula 15 times around the perimeterand 10 times over the interior. Remove the collar andsmooth the surface with the spatula to a slightly roundedshape.
10. Replace collar and place mold assembly with speci-men on the compaction pedestal. Compact specimenusing 50 blows from the Marshall hammer. Unlike theMarshall method, only one surface of the specimen isto be compacted.
11. After compaction, carefully remove mold assemblyfrom the compaction pedestal. Remove collar andmeasure distance from top of mold to top of specimen.Calculate specimen height. The specimen should be6.35 ± 0.318 cm (2.5 ± 0.125 in.) in height. If speci-men does not meet the height requirements, discardcompacted specimen.
12. Compact a new specimen using remaining preparedmaterial adjusting the amount required to achieve a specimen height of 6.35 cm (2.5 in.) using the following formula:– Adjusted weight of aggregate = (2.5 × weight of
13. Place compacted sample, with base plate and mold stillin the upright, vertical position (compacted face up),along with appropriate spacers (to minimize travel), onthe Marshall stability and flow machine. Place 1.5-in.-diameter × 1.5-in.-high steel round stock (flat top andbottom) on the center of the compacted specimen andalign vertically under the load cell.
14. Operate stability and flow recorder at 2-in./min. travelusing the 5,000-lb scale and plot shear resistance versuspenetration (stability versus flow) on the graph paper.Carry the penetration to 10 percent of the specimenthickness (flow of 25).
The need for averaging replicate specimens has not yetbeen determined.
APPENDIX B
COMPACTED AGGREGATE RESISTANCE TEST
C-1
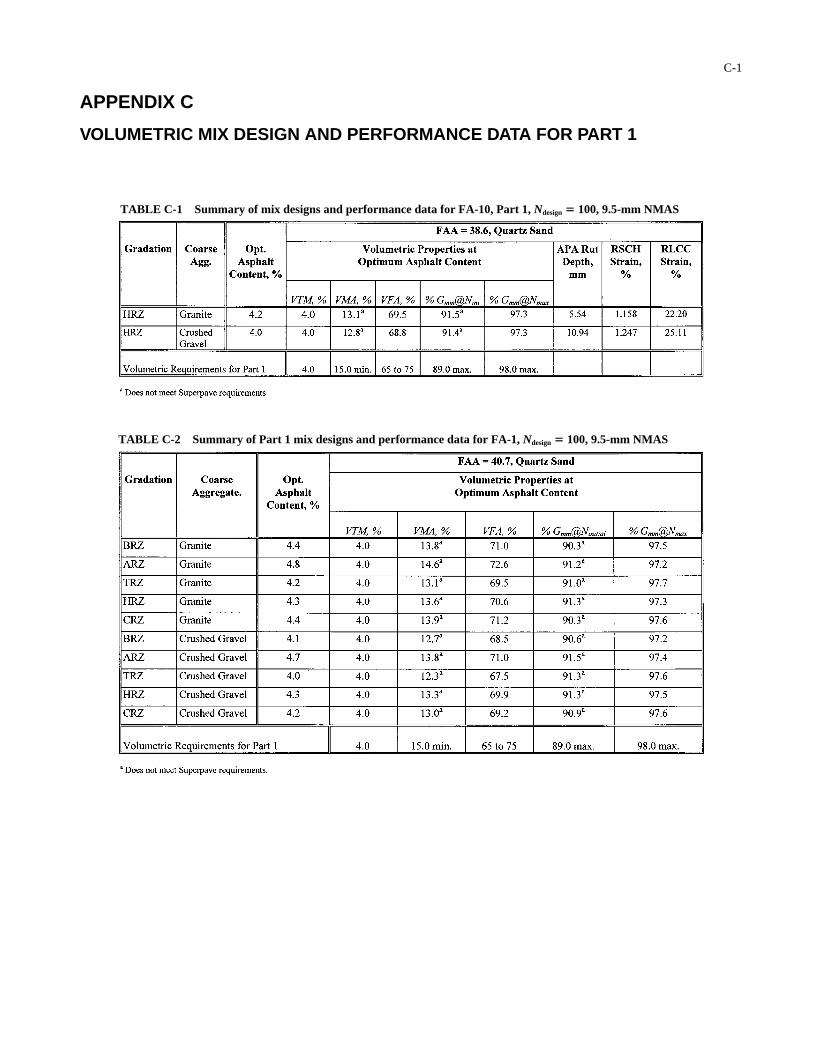
APPENDIX C
VOLUMETRIC MIX DESIGN AND PERFORMANCE DATA FOR PART 1
TABLE C-1 Summary of mix designs and performance data for FA-10, Part 1, Ndesign � 100, 9.5-mm NMAS
TABLE C-2 Summary of Part 1 mix designs and performance data for FA-1, Ndesign � 100, 9.5-mm NMAS
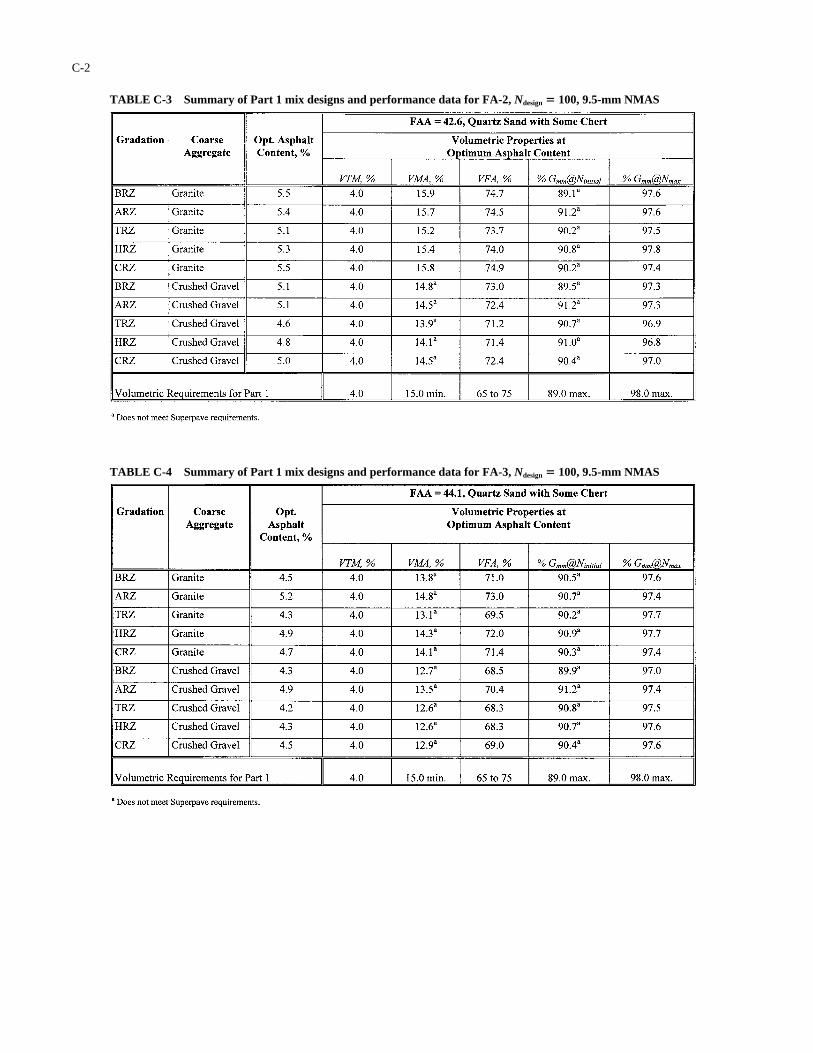
C-2
TABLE C-3 Summary of Part 1 mix designs and performance data for FA-2, Ndesign � 100, 9.5-mm NMAS
TABLE C-4 Summary of Part 1 mix designs and performance data for FA-3, Ndesign � 100, 9.5-mm NMAS
C-3
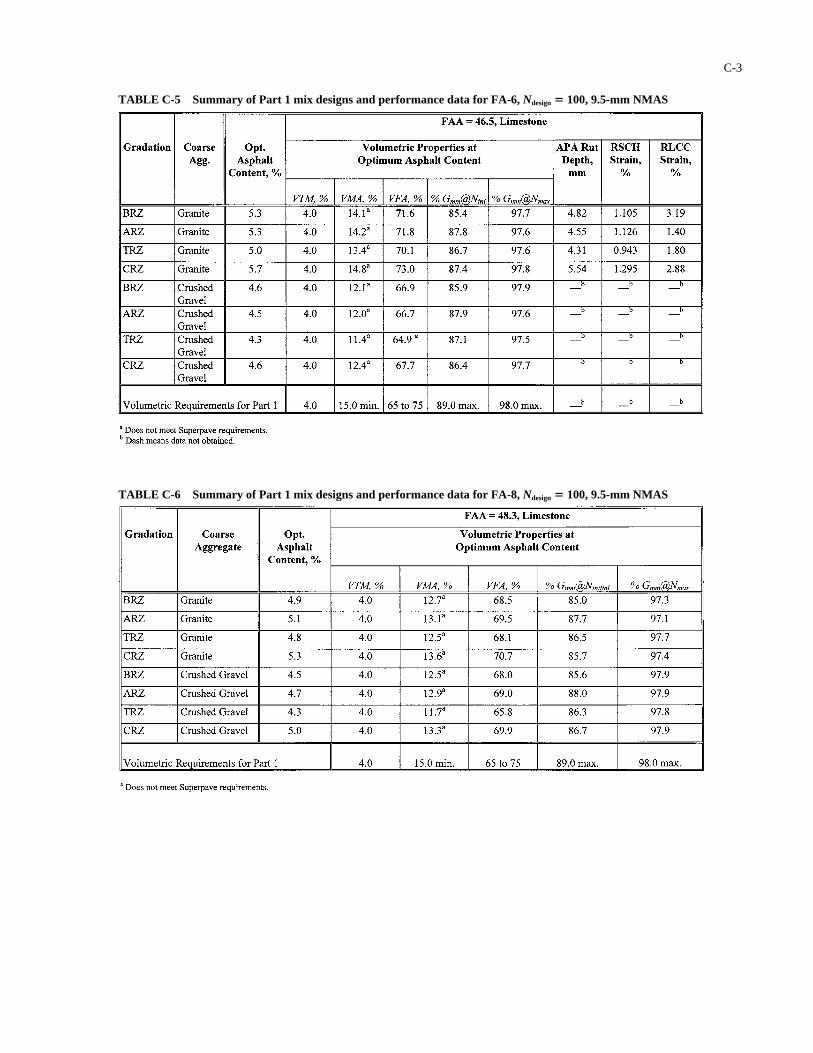
TABLE C-5 Summary of Part 1 mix designs and performance data for FA-6, Ndesign � 100, 9.5-mm NMAS
TABLE C-6 Summary of Part 1 mix designs and performance data for FA-8, Ndesign � 100, 9.5-mm NMAS
C-4
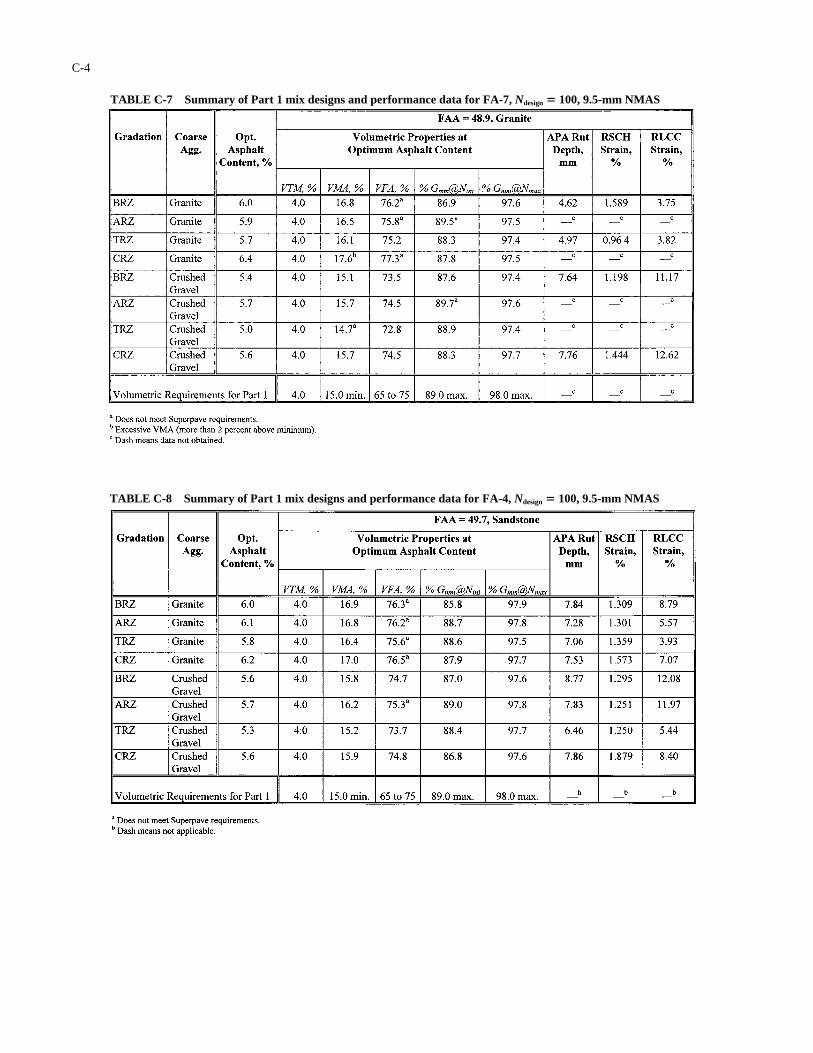
TABLE C-7 Summary of Part 1 mix designs and performance data for FA-7, Ndesign � 100, 9.5-mm NMAS
TABLE C-8 Summary of Part 1 mix designs and performance data for FA-4, Ndesign � 100, 9.5-mm NMAS
C-5
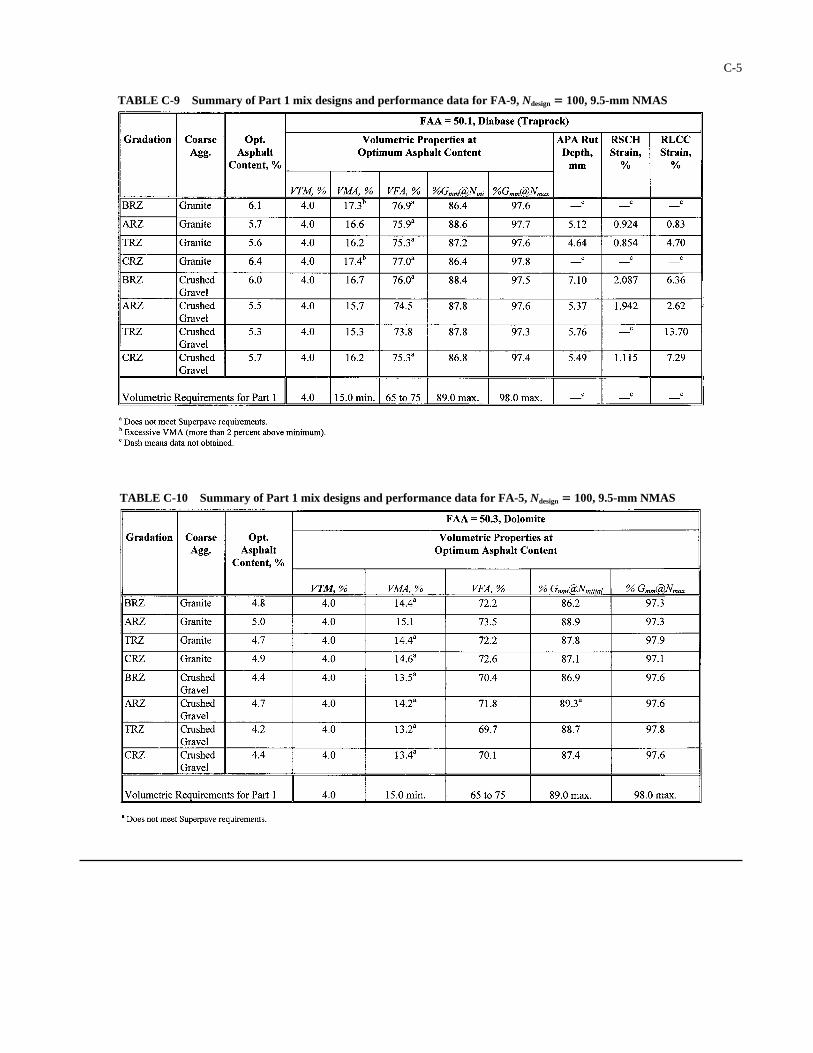
TABLE C-9 Summary of Part 1 mix designs and performance data for FA-9, Ndesign � 100, 9.5-mm NMAS
TABLE C-10 Summary of Part 1 mix designs and performance data for FA-5, Ndesign � 100, 9.5-mm NMAS
D-1
APPENDIX D
VOLUMETRIC MIX DESIGN AND PERFORMANCE DATA FOR PART 2
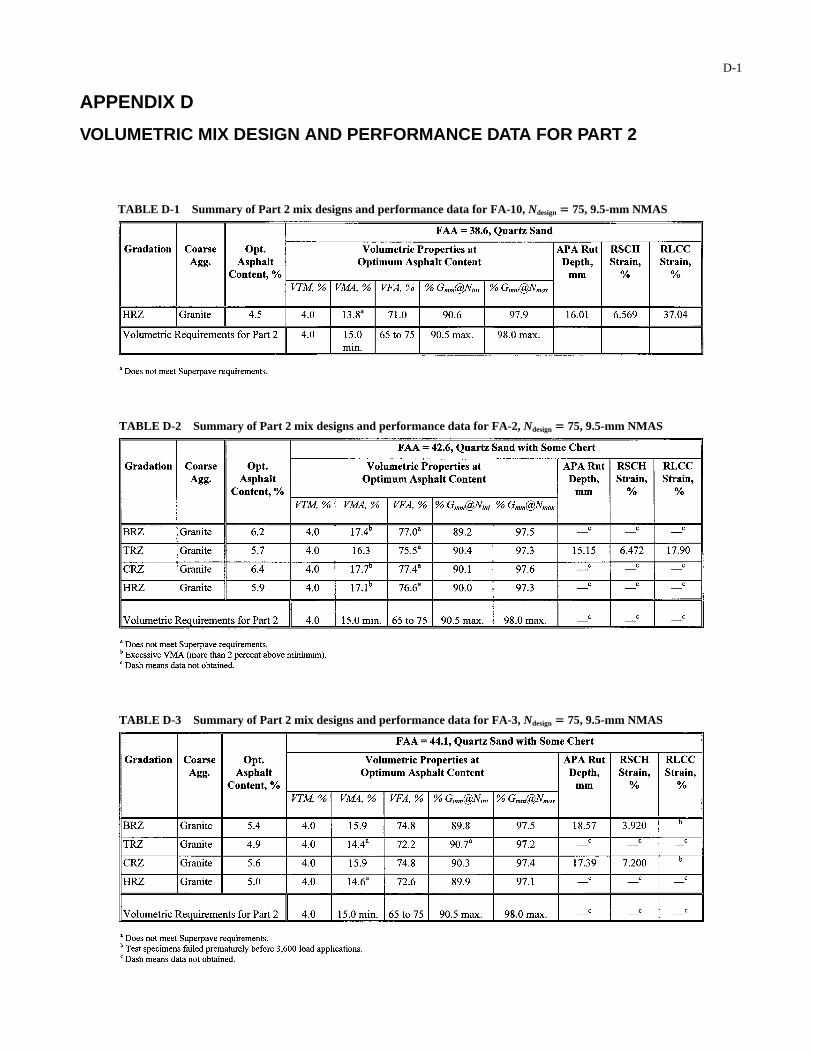
TABLE D-1 Summary of Part 2 mix designs and performance data for FA-10, Ndesign � 75, 9.5-mm NMAS
TABLE D-2 Summary of Part 2 mix designs and performance data for FA-2, Ndesign � 75, 9.5-mm NMAS
TABLE D-3 Summary of Part 2 mix designs and performance data for FA-3, Ndesign � 75, 9.5-mm NMAS
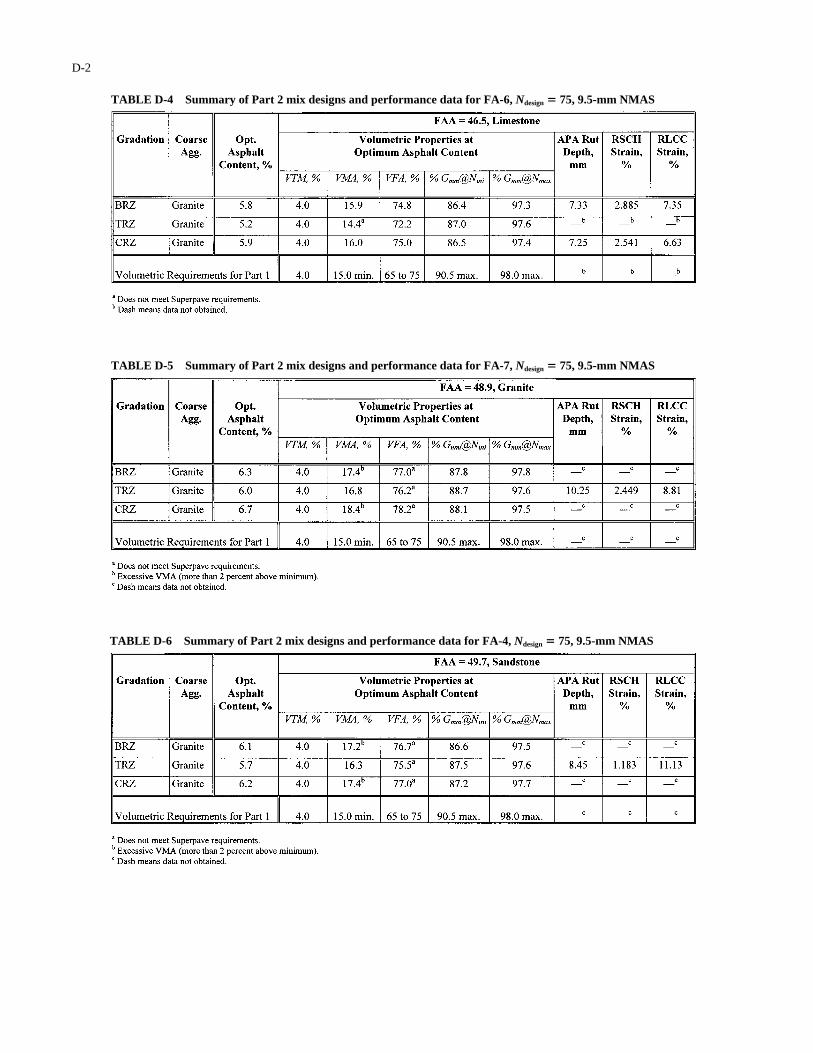
TABLE D-4 Summary of Part 2 mix designs and performance data for FA-6, Ndesign � 75, 9.5-mm NMAS
TABLE D-6 Summary of Part 2 mix designs and performance data for FA-4, Ndesign � 75, 9.5-mm NMAS
D-2
TABLE D-5 Summary of Part 2 mix designs and performance data for FA-7, Ndesign � 75, 9.5-mm NMAS
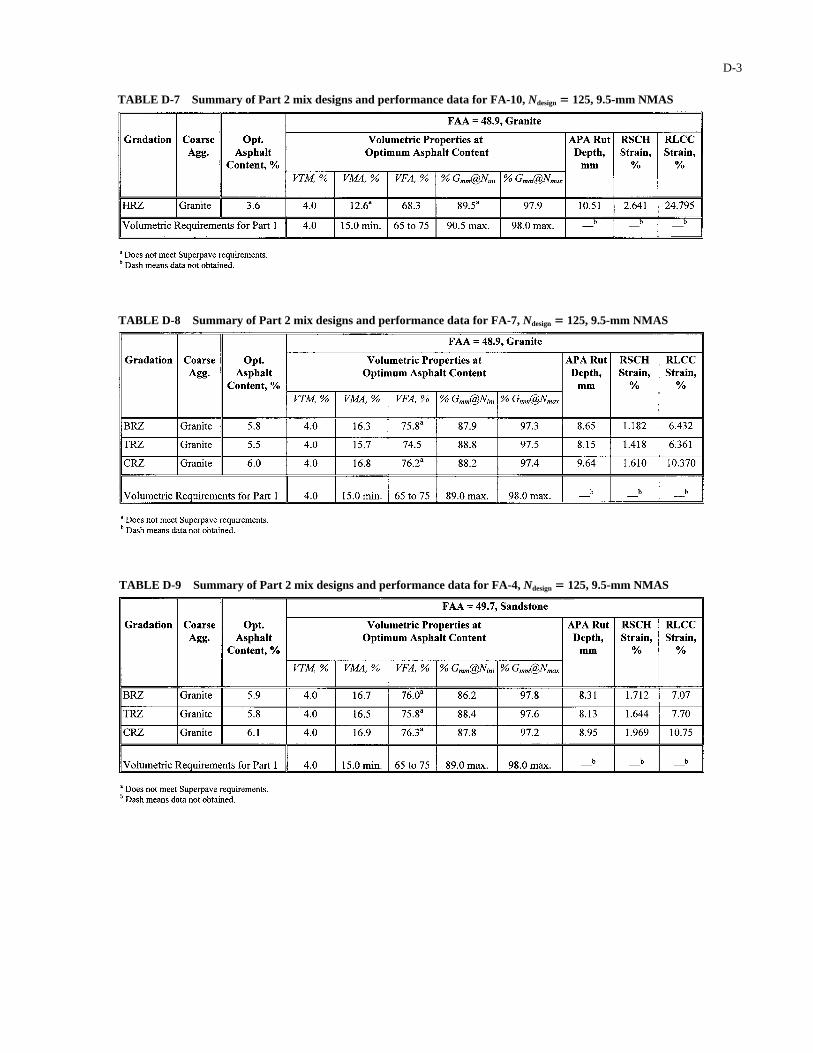
TABLE D-8 Summary of Part 2 mix designs and performance data for FA-7, Ndesign � 125, 9.5-mm NMAS
TABLE D-7 Summary of Part 2 mix designs and performance data for FA-10, Ndesign � 125, 9.5-mm NMAS
D-3
TABLE D-9 Summary of Part 2 mix designs and performance data for FA-4, Ndesign � 125, 9.5-mm NMAS
TABLE D-10 Summary of Part 2 mix designs and performance data for FA-9, Ndesign � 125, 9.5-mm NMAS
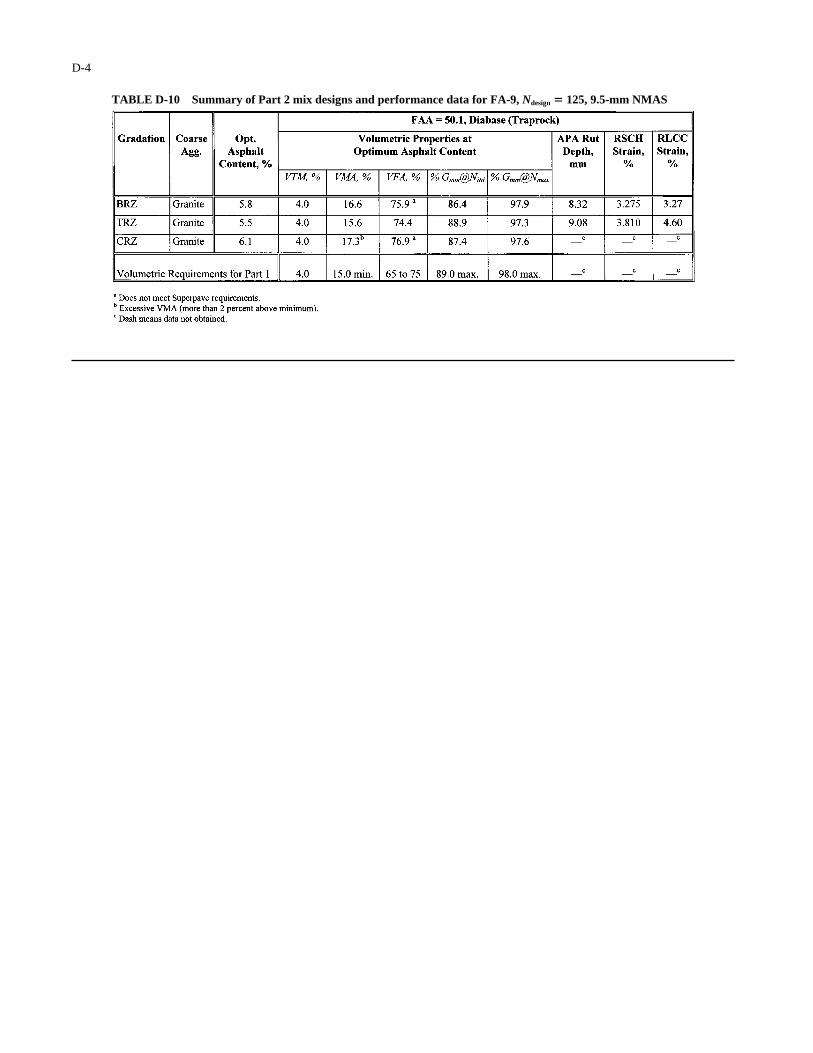
D-4
TABLE E-4 Results of Part 3 mix designs and performance testing for FA-6, Ndesign � 75, 19.0-mm NMAS
TABLE E-3 Results of Part 3 mix designs and performance testing for FA-3, Ndesign � 75, 19.0-mm NMAS
TABLE E-2 Results of Part 3 mix designs and performance testing for FA-2, Ndesign � 75, 19.0-mm NMAS
E-1
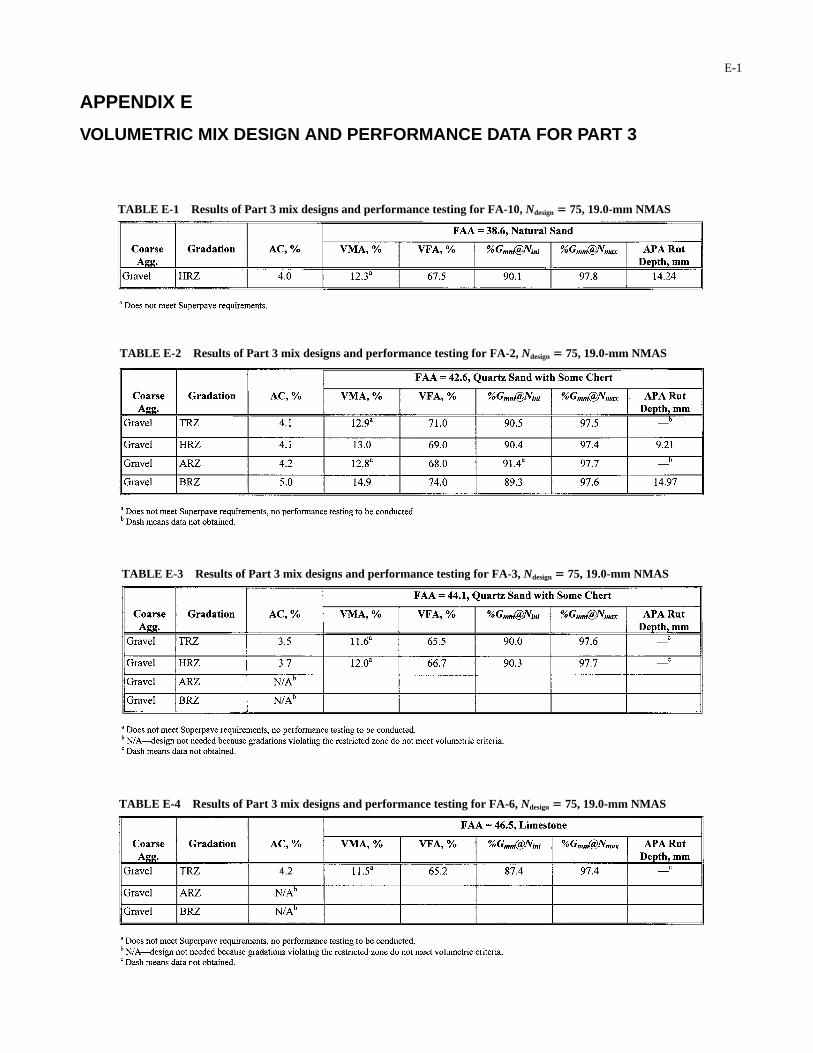
APPENDIX E
VOLUMETRIC MIX DESIGN AND PERFORMANCE DATA FOR PART 3
TABLE E-1 Results of Part 3 mix designs and performance testing for FA-10, Ndesign � 75, 19.0-mm NMAS
TABLE E-6 Results of Part 3 mix designs and performance testing for FA-4, Ndesign � 75, 19.0-mm NMAS
TABLE E-5 Results of Part 3 mix designs and performance testing for FA-7, Ndesign � 75, 19.0-mm NMAS
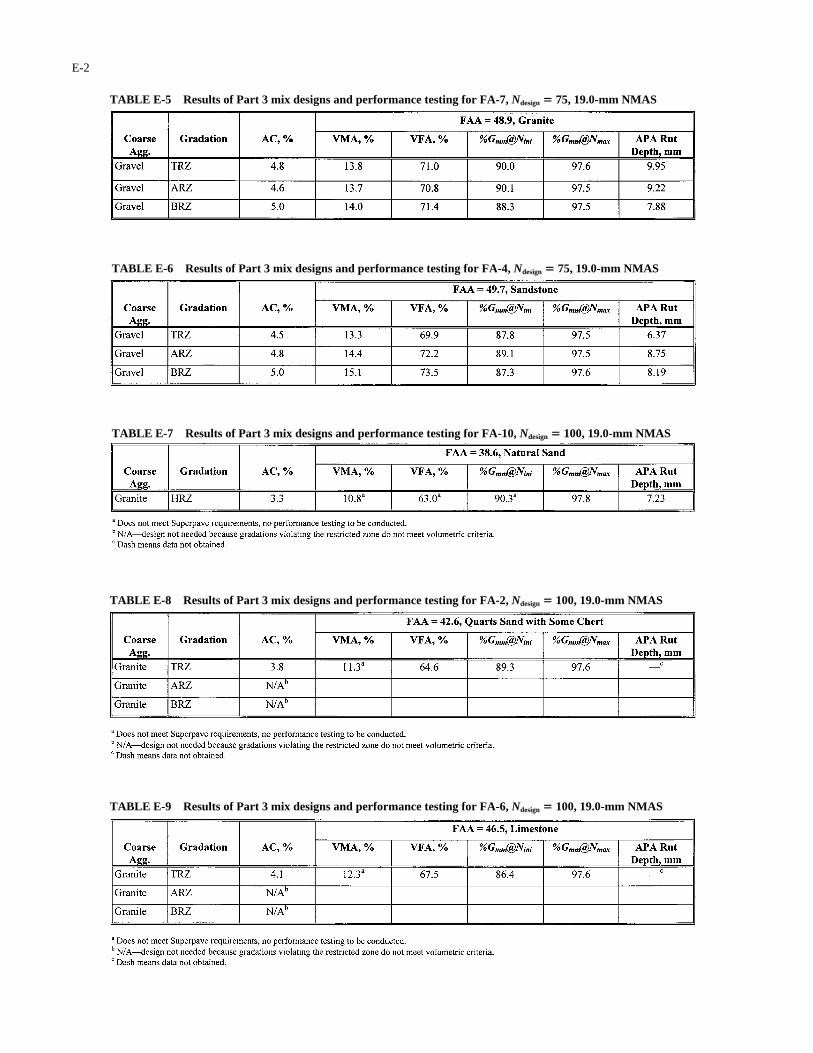
E-2
TABLE E-7 Results of Part 3 mix designs and performance testing for FA-10, Ndesign � 100, 19.0-mm NMAS
TABLE E-8 Results of Part 3 mix designs and performance testing for FA-2, Ndesign � 100, 19.0-mm NMAS
TABLE E-9 Results of Part 3 mix designs and performance testing for FA-6, Ndesign � 100, 19.0-mm NMAS
E-3
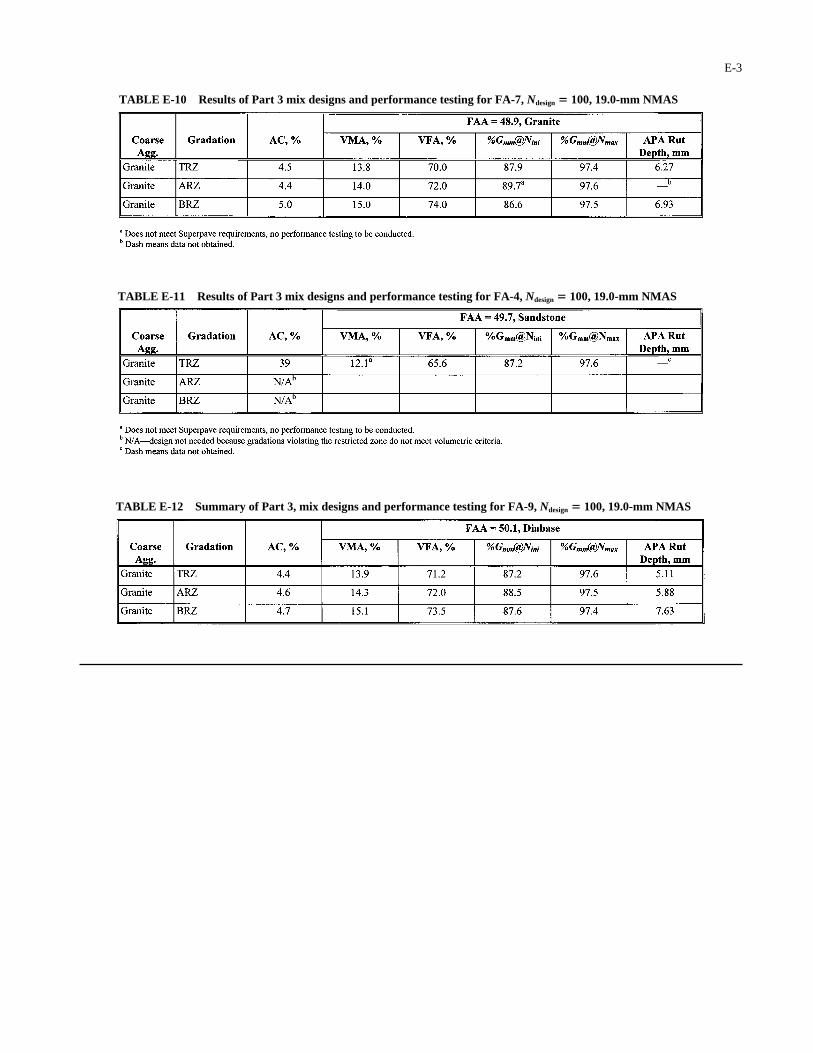
TABLE E-10 Results of Part 3 mix designs and performance testing for FA-7, Ndesign � 100, 19.0-mm NMAS
TABLE E-11 Results of Part 3 mix designs and performance testing for FA-4, Ndesign � 100, 19.0-mm NMAS
TABLE E-12 Summary of Part 3, mix designs and performance testing for FA-9, Ndesign � 100, 19.0-mm NMAS
Abbreviations used without definitions in TRB publications:
AASHO American Association of State Highway OfficialsAASHTO American Association of State Highway and Transportation OfficialsASCE American Society of Civil EngineersASME American Society of Mechanical EngineersASTM American Society for Testing and MaterialsFAA Federal Aviation AdministrationFHWA Federal Highway AdministrationFRA Federal Railroad AdministrationFTA Federal Transit AdministrationIEEE Institute of Electrical and Electronics EngineersITE Institute of Transportation EngineersNCHRP National Cooperative Highway Research ProgramNCTRP National Cooperative Transit Research and Development ProgramNHTSA National Highway Traffic Safety AdministrationSAE Society of Automotive EngineersTCRP Transit Cooperative Research ProgramTRB Transportation Research BoardU.S.DOT United States Department of Transportation
Advisers to the Nation on Science, Engineering, and Medicine
National Academy of SciencesNational Academy of EngineeringInstitute of MedicineNational Research Council
The Transportation Research Board is a unit of the National Research Council, which serves the National Academy of Sciences and the National Academy of Engineering. The Board’s mission is to promote innovation and progress in transportation by stimulating and conducting research, facilitating the dissemination of information, and encouraging the implementation of research results. The Board’s varied activities annually draw on approximately 4,000 engineers, scientists, and other transportation researchers and practitioners from the public and private sectors and academia, all of whom contribute their expertise in the public interest. The program is supported by state transportation departments, federal agencies including the component administrations of the U.S. Department of Transportation, and other organizations and individuals interested in the development of transportation.
The National Academy of Sciences is a private, nonprofit, self-perpetuating society of distin-guished scholars engaged in scientific and engineering research, dedicated to the furtherance of science and technology and to their use for the general welfare. Upon the authority of the charter granted to it by the Congress in 1863, the Academy has a mandate that requires it to advise the federal government on scientific and technical matters. Dr. Bruce M. Alberts is president of the National Academy of Sciences.
The National Academy of Engineering was established in 1964, under the charter of the National Academy of Sciences, as a parallel organization of outstanding engineers. It is autonomous in its administration and in the selection of its members, sharing with the National Academy of Sciences the responsibility for advising the federal government. The National Academy of Engineering also sponsors engineering programs aimed at meeting national needs, encourages education and research, and recognizes the superior achievements of engineers. Dr. William A. Wulf is president of the National Academy of Engineering.
The Institute of Medicine was established in 1970 by the National Academy of Sciences to secure the services of eminent members of appropriate professions in the examination of policy matters pertaining to the health of the public. The Institute acts under the responsibility given to the National Academy of Sciences by its congressional charter to be an adviser to the federal government and, upon its own initiative, to identify issues of medical care, research, and education. Dr. Kenneth I. Shine is president of the Institute of Medicine.
The National Research Council was organized by the National Academy of Sciences in 1916 to associate the broad community of science and technology with the Academy’s purpose of furthering knowledge and advising the federal government. Functioning in accordance with general policies determined by the Academy, the Council has become the principal operating agency of both the National Academy of Sciences and the National Academy of Engineering in providing services to the government, the public, and the scientific and engineering communities. The Council is administered jointly by both the Academies and the Institute of Medicine. Dr. Bruce M. Alberts and Dr. William A. Wulf are chairman and vice chairman, respectively, of the National Research Council.