73
Prestress Losses in Pretensioned High-Strength Concrete Bridge Girders NATIONAL COOPERATIVE HIGHWAY RESEARCH PROGRAM NCHRP REPORT 496

Prestress Losses inPretensioned High-Strength
Concrete Bridge Girders
NATIONALCOOPERATIVE HIGHWAYRESEARCH PROGRAMNCHRP
REPORT 496

TRANSPORTATION RESEARCH BOARD EXECUTIVE COMMITTEE 2003 (Membership as of March 2003)
OFFICERSChair: Genevieve Giuliano, Director and Professor, School of Policy, Planning, and Development, University of Southern California,
Los AngelesVice Chair: Michael S. Townes, Executive Director, Transportation District Commission of Hampton Roads, Hampton, VA Executive Director: Robert E. Skinner, Jr., Transportation Research Board
MEMBERSMICHAEL W. BEHRENS, Executive Director, Texas DOTJOSEPH H. BOARDMAN, Commissioner, New York State DOTSARAH C. CAMPBELL, President, TransManagement, Inc., Washington, DCE. DEAN CARLSON, Secretary of Transportation, Kansas DOTJOANNE F. CASEY, President, Intermodal Association of North AmericaJAMES C. CODELL III, Secretary, Kentucky Transportation CabinetJOHN L. CRAIG, Director, Nebraska Department of RoadsBERNARD S. GROSECLOSE, JR., President and CEO, South Carolina State Ports AuthoritySUSAN HANSON, Landry University Professor of Geography, Graduate School of Geography, Clark UniversityLESTER A. HOEL, L. A. Lacy Distinguished Professor, Department of Civil Engineering, University of VirginiaHENRY L. HUNGERBEELER, Director, Missouri DOTADIB K. KANAFANI, Cahill Professor and Chairman, Department of Civil and Environmental Engineering, University of California
at Berkeley RONALD F. KIRBY, Director of Transportation Planning, Metropolitan Washington Council of GovernmentsHERBERT S. LEVINSON, Principal, Herbert S. Levinson Transportation Consultant, New Haven, CTMICHAEL D. MEYER, Professor, School of Civil and Environmental Engineering, Georgia Institute of TechnologyJEFF P. MORALES, Director of Transportation, California DOTKAM MOVASSAGHI, Secretary of Transportation, Louisiana Department of Transportation and DevelopmentCAROL A. MURRAY, Commissioner, New Hampshire DOTDAVID PLAVIN, President, Airports Council International, Washington, DCJOHN REBENSDORF, Vice President, Network and Service Planning, Union Pacific Railroad Co., Omaha, NECATHERINE L. ROSS, Executive Director, Georgia Regional Transportation AgencyJOHN M. SAMUELS, Senior Vice President-Operations Planning & Support, Norfolk Southern Corporation, Norfolk, VAPAUL P. SKOUTELAS, CEO, Port Authority of Allegheny County, Pittsburgh, PAMARTIN WACHS, Director, Institute of Transportation Studies, University of California at BerkeleyMICHAEL W. WICKHAM, Chairman and CEO, Roadway Express, Inc., Akron, OH
MIKE ACOTT, President, National Asphalt Pavement Association (ex officio)MARION C. BLAKEY, Federal Aviation Administrator, U.S.DOT (ex officio)REBECCA M. BREWSTER, President and CEO, American Transportation Research Institute, Atlanta, GA (ex officio)THOMAS H. COLLINS (Adm., U.S. Coast Guard), Commandant, U.S. Coast Guard (ex officio)JENNIFER L. DORN, Federal Transit Administrator, U.S.DOT (ex officio)ELLEN G. ENGLEMAN, Research and Special Programs Administrator, U.S.DOT (ex officio)ROBERT B. FLOWERS (Lt. Gen., U.S. Army), Chief of Engineers and Commander, U.S. Army Corps of Engineers (ex officio)HAROLD K. FORSEN, Foreign Secretary, National Academy of Engineering (ex officio)EDWARD R. HAMBERGER, President and CEO, Association of American Railroads (ex officio)JOHN C. HORSLEY, Executive Director, American Association of State Highway and Transportation Officials (ex officio)MICHAEL P. JACKSON, Deputy Secretary of Transportation, U.S.DOT (ex officio)ROGER L. KING, Chief Applications Technologist, National Aeronautics and Space Administration (ex officio)ROBERT S. KIRK, Director, Office of Advanced Automotive Technologies, U.S. Department of Energy (ex officio)RICK KOWALEWSKI, Acting Director, Bureau of Transportation Statistics, U.S.DOT (ex officio)WILLIAM W. MILLAR, President, American Public Transportation Association (ex officio) MARY E. PETERS, Federal Highway Administrator, U.S.DOT (ex officio)SUZANNE RUDZINSKI, Director, Office of Transportation and Air Quality, U.S. Environmental Protection Agency (ex officio)JEFFREY W. RUNGE, National Highway Traffic Safety Administrator, U.S.DOT (ex officio)ALLAN RUTTER, Federal Railroad Administrator, U.S.DOT (ex officio)ANNETTE M. SANDBERG, Deputy Administrator, Federal Motor Carrier Safety Administration, U.S.DOT (ex officio)WILLIAM G. SCHUBERT, Maritime Administrator, U.S.DOT (ex officio)
NATIONAL COOPERATIVE HIGHWAY RESEARCH PROGRAM
Transportation Research Board Executive Committee Subcommittee for NCHRPGENEVIEVE GIULIANO, University of Southern California,
Los Angeles (Chair)E. DEAN CARLSON, Kansas DOTLESTER A. HOEL, University of VirginiaJOHN C. HORSLEY, American Association of State Highway and
Transportation Officials
MARY E. PETERS, Federal Highway Administration ROBERT E. SKINNER, JR., Transportation Research BoardMICHAEL S. TOWNES, Transportation District Commission
of Hampton Roads, Hampton, VA

T R A N S P O R T A T I O N R E S E A R C H B O A R DWASHINGTON, D.C.
2003www.TRB.org
NATIONAL COOPERATIVE HIGHWAY RESEARCH PROGRAM
NCHRP REPORT 496
Research Sponsored by the American Association of State Highway and Transportation Officials in Cooperation with the Federal Highway Administration
SUBJECT AREAS
Bridges, Other Structures, and Hydraulics and Hydrology • Materials and Construction
Prestress Losses inPretensioned High-Strength
Concrete Bridge Girders
MAHER K. TADROS
NABIL AL-OMAISHI
University of Nebraska
Lincoln, NE
STEPHEN J. SEGUIRANT
Concrete Technology Corporation
Tacoma, WA
AND
JAMES G. GALLT
Palmer Engineering Company
Winchester, KY
NATIONAL COOPERATIVE HIGHWAY RESEARCH PROGRAM
Systematic, well-designed research provides the most effectiveapproach to the solution of many problems facing highwayadministrators and engineers. Often, highway problems are of localinterest and can best be studied by highway departmentsindividually or in cooperation with their state universities andothers. However, the accelerating growth of highway transportationdevelops increasingly complex problems of wide interest tohighway authorities. These problems are best studied through acoordinated program of cooperative research.
In recognition of these needs, the highway administrators of theAmerican Association of State Highway and TransportationOfficials initiated in 1962 an objective national highway researchprogram employing modern scientific techniques. This program issupported on a continuing basis by funds from participatingmember states of the Association and it receives the full cooperationand support of the Federal Highway Administration, United StatesDepartment of Transportation.
The Transportation Research Board of the National Academieswas requested by the Association to administer the researchprogram because of the Board’s recognized objectivity andunderstanding of modern research practices. The Board is uniquelysuited for this purpose as it maintains an extensive committeestructure from which authorities on any highway transportationsubject may be drawn; it possesses avenues of communications andcooperation with federal, state and local governmental agencies,universities, and industry; its relationship to the National ResearchCouncil is an insurance of objectivity; it maintains a full-timeresearch correlation staff of specialists in highway transportationmatters to bring the findings of research directly to those who are ina position to use them.
The program is developed on the basis of research needsidentified by chief administrators of the highway and transportationdepartments and by committees of AASHTO. Each year, specificareas of research needs to be included in the program are proposedto the National Research Council and the Board by the AmericanAssociation of State Highway and Transportation Officials.Research projects to fulfill these needs are defined by the Board, andqualified research agencies are selected from those that havesubmitted proposals. Administration and surveillance of researchcontracts are the responsibilities of the National Research Counciland the Transportation Research Board.
The needs for highway research are many, and the NationalCooperative Highway Research Program can make significantcontributions to the solution of highway transportation problems ofmutual concern to many responsible groups. The program,however, is intended to complement rather than to substitute for orduplicate other highway research programs.
Note: The Transportation Research Board of the National Academies, theNational Research Council, the Federal Highway Administration, the AmericanAssociation of State Highway and Transportation Officials, and the individualstates participating in the National Cooperative Highway Research Program donot endorse products or manufacturers. Trade or manufacturers’ names appearherein solely because they are considered essential to the object of this report.
Published reports of the
NATIONAL COOPERATIVE HIGHWAY RESEARCH PROGRAM
are available from:
Transportation Research BoardBusiness Office500 Fifth Street, NWWashington, DC 20001
and can be ordered through the Internet at:
http://www.national-academies.org/trb/bookstore
Printed in the United States of America
NCHRP REPORT 496
Project D18-07 FY’99
ISSN 0077-5614
ISBN 0-309-08766-X
Library of Congress Control Number 2003110071
© 2003 Transportation Research Board
Price $19.00
NOTICE
The project that is the subject of this report was a part of the National Cooperative
Highway Research Program conducted by the Transportation Research Board with the
approval of the Governing Board of the National Research Council. Such approval
reflects the Governing Board’s judgment that the program concerned is of national
importance and appropriate with respect to both the purposes and resources of the
National Research Council.
The members of the technical committee selected to monitor this project and to review
this report were chosen for recognized scholarly competence and with due
consideration for the balance of disciplines appropriate to the project. The opinions and
conclusions expressed or implied are those of the research agency that performed the
research, and, while they have been accepted as appropriate by the technical committee,
they are not necessarily those of the Transportation Research Board, the National
Research Council, the American Association of State Highway and Transportation
Officials, or the Federal Highway Administration, U.S. Department of Transportation.
Each report is reviewed and accepted for publication by the technical committee
according to procedures established and monitored by the Transportation Research
Board Executive Committee and the Governing Board of the National Research
Council.

The National Academy of Sciences is a private, nonprofit, self-perpetuating society of distinguished schol-ars engaged in scientific and engineering research, dedicated to the furtherance of science and technology and to their use for the general welfare. On the authority of the charter granted to it by the Congress in 1863, the Academy has a mandate that requires it to advise the federal government on scientific and techni-cal matters. Dr. Bruce M. Alberts is president of the National Academy of Sciences.
The National Academy of Engineering was established in 1964, under the charter of the National Acad-emy of Sciences, as a parallel organization of outstanding engineers. It is autonomous in its administration and in the selection of its members, sharing with the National Academy of Sciences the responsibility for advising the federal government. The National Academy of Engineering also sponsors engineering programs aimed at meeting national needs, encourages education and research, and recognizes the superior achieve-ments of engineers. Dr. William A. Wulf is president of the National Academy of Engineering.
The Institute of Medicine was established in 1970 by the National Academy of Sciences to secure the services of eminent members of appropriate professions in the examination of policy matters pertaining to the health of the public. The Institute acts under the responsibility given to the National Academy of Sciences by its congressional charter to be an adviser to the federal government and, on its own initiative, to identify issues of medical care, research, and education. Dr. Harvey V. Fineberg is president of the Institute of Medicine.
The National Research Council was organized by the National Academy of Sciences in 1916 to associate the broad community of science and technology with the Academy’s purposes of furthering knowledge and advising the federal government. Functioning in accordance with general policies determined by the Acad-emy, the Council has become the principal operating agency of both the National Academy of Sciences and the National Academy of Engineering in providing services to the government, the public, and the scientific and engineering communities. The Council is administered jointly by both the Academies and the Institute of Medicine. Dr. Bruce M. Alberts and Dr. William A. Wulf are chair and vice chair, respectively, of the National Research Council.
The Transportation Research Board is a division of the National Research Council, which serves the National Academy of Sciences and the National Academy of Engineering. The Board’s mission is to promote innovation and progress in transportation through research. In an objective and interdisciplinary setting, the Board facilitates the sharing of information on transportation practice and policy by researchers and practitioners; stimulates research and offers research management services that promote technical excellence; provides expert advice on transportation policy and programs; and disseminates research results broadly and encourages their implementation. The Board’s varied activities annually engage more than 4,000 engineers, scientists, and other transportation researchers and practitioners from the public and private sectors and academia, all of whom contribute their expertise in the public interest. The program is supported by state transportation departments, federal agencies including the component administrations of the U.S. Department of Transportation, and other organizations and individuals interested in the development of transportation. www.TRB.org
www.national-academies.org

COOPERATIVE RESEARCH PROGRAMS STAFF FOR NCHRP REPORT 496
ROBERT J. REILLY, Director, Cooperative Research ProgramsCRAWFORD F. JENCKS, Manager, NCHRPAMIR N. HANNA, Senior Program OfficerEILEEN P. DELANEY, Managing EditorKAMI CABRAL, Associate EditorANDREA BRIERE, Associate Editor
NCHRP PROJECT D18-07 PANELField of Materials and Construction—Area of Concrete Materials
WILLIAM N. NICKAS, Florida DOT (Chair)SALIM M. BAIG, New Jersey DOTSCOT BECKER, Wisconsin DOTSTEVEN L. ERNST, FHWAJOSE GOMEZ, Virginia DOTSHAWN P. GROSS, Villanova UniversityBIJAN KHALEGHI, Washington State DOTTOORAK ZOKAIE, Leap Software, Inc., Gold River, CA JOEY HARTMANN, FHWA Liaison RepresentativeWILLIAM WRIGHT, FHWA Liaison RepresentativeSTEPHEN F. MAHER, TRB Liaison Representative
AUTHOR ACKNOWLEDGMENTSThe research reported herein was performed under NCHRP Proj-
ect 18-07 by the University of Nebraska—Lincoln, the contractorfor this study, jointly with Concrete Technology Corporation,Tacoma, Washington, and Palmer Engineering, Lexington, Ken-tucky. Maher K. Tadros, Cheryl Prewett Professor of Civil Engi-neering, was the principal investigator, and Nabil Al-Omaishi,Research Assistant Professor, was a prime participant in theresearch. Other major participants in the project were Stephen J.Seguirant of Concrete Technology Corporation and James G. Galltof Palmer Engineering.
Sherif Yehia, Nick Meek, Kelvin Lein, and Wilast Amornrat-tanopong of the University of Nebraska provided assistance during
the experimental phases of the project. David Scott of New Hamp-shire Department of Transportation, Bill Augustus of NortheastConcrete Products, Robert Steffen of the University of New Hamp-shire, Kevin Pruski of Texas Department of Transportation, BursonPatton of Texas Concrete Company, Arlen Clark of Clark County,Washington, Jim Parkins of Concrete Technology Corporation, andMark Lafferty of Concrete Industries provided assistance in instru-mentation and data acquisition of instrumented bridges in Nebraska,New Hampshire, Texas, and Washington. Karen Harris of the Uni-versity of Nebraska contributed to the project administration. AudraHansen, Nipon Jongpitaksseel, Ann Kulik, Chuanbing Sun, andEmil Tadros contributed to report preparation.
This report presents guidelines to help bridge designers obtain realistic estimates ofprestress losses in high-strength pretensioned concrete bridge girders and thus achieveeconomical designs. These guidelines incorporate procedures that yield more accuratepredictions of modulus of elasticity, shrinkage, and creep of concrete and more realisticestimates of prestress losses than those provided by the procedures contained in currentspecifications. This report will be of particular interest to engineers, researchers, and oth-ers concerned with the design of pretensioned concrete bridge structures.
The use of high-strength concrete for pretensioned concrete bridge girders hasbecome accepted practice by many state highway agencies because of its engineeringand economic benefits. High-strength concrete permits longer girders and increasedgirder spacing, thus reducing total bridge cost. Design of pretensioned concrete gird-ers requires accurate estimates of prestress losses. These losses are affected by factorssuch as mix design, curing, concrete strength, and service exposure conditions.
Recent research has indicated that the current provisions used for calculating pre-stress losses in normal-strength concrete may not provide reliable estimates for high-strength concrete bridge girders. Thus, research was needed to evaluate the applicabil-ity of the current provisions for estimating prestress losses in high-strength concretebridge girders and to develop guidelines for better estimating these losses in order tohelp bridge design engineers develop economic designs for such girders.
Under NCHRP Project 18-07, “Prestress Losses in Pretensioned High-Strength Con-crete Bridge Girders,” the University of Nebraska—Lincoln was assigned the task ofdeveloping design guidelines for estimating prestress losses in pretensioned high-strengthconcrete bridge girders. To accomplish this objective, the researchers reviewed relevantdomestic and foreign literature; identified limitations on the methods currently used forestimating prestress losses; conducted laboratory tests for evaluating relevant propertiesof concrete; derived formulas for predicting modulus of elasticity, shrinkage, and creepof concrete; and developed a “detailed” method and an “approximate” method for esti-mating prestress losses in pretensioned high-strength concrete bridge girders.
The research also included (a) field measurements on seven full-scale bridge gird-ers in four states selected to represent a wide range of geographic and construction prac-tices and (b) analysis of data from earlier field measurements on 31 pretensioned gird-ers in seven states. The report gives numerical examples that illustrate the use of thesemethods and demonstrate that the methods developed in this research yield better esti-mates of prestress losses than those obtained from the current methods.
The methods developed in this research can be used to obtain realistic estimates ofprestress losses in pretensioned high-strength concrete bridge girders. These methodswill be particularly useful to highway agencies and consulting firms involved in thedesign of pretensioned concrete bridge structures and are recommended for consider-ation and adoption by AASHTO as part of the LRFD Bridge Design Specifications.
FOREWORDBy Amir N. Hanna
Staff OfficerTransportation Research
Board

1 SUMMARY
3 CHAPTER 1 IntroductionProblem Statement, 3Objectives and Scope of the Research, 3Research Approach, 3Organization of the Report, 4Applicability of Results to Highway Practice, 4
5 CHAPTER 2 Background and Literature SearchIntroduction, 5Definitions, 5Components of Prestress Losses in Pretensioned Girders, 6Factors Influencing Modulus of Elasticity, 6Factors Influencing Shrinkage, 8Factors Influencing Creep, 8Factors Influencing Relaxation of Strands, 9Time-Dependent Stress Analysis, 9Prestress Loss Calculation Methods, 10Time-Step Prestress Loss Methods, 10Refined Prestress Loss Methods, 11Lump-Sum Methods, 13
14 CHAPTER 3 Research ResultsIntroduction, 14Experimental Program, 14Modulus of Elasticity, 17Experimental Shrinkage Results, 18 Experimental Creep Results, 20 Proposed Creep and Shrinkage Correction Factors, 21Proposed Shrinkage Formula, 27Proposed Creep Formula, 28Relaxation of Prestressing Strands, 28Proposed AASHTO-LRFD Revisions, 29 Numerical Example of Material Properties Using Proposed Prediction
Formulas, 29Prestress Loss, 30Experimental Program, 30Other Experimental Data, 35Proposed Detailed Prestress Loss Method, 38Proposed Approximate Prestress Loss Method, 45Comparison of Measured and Predicted Losses, 48Comparison with Previously Reported Experimental Results, 49Numerical Examples: Comparison of Proposed Prestress Loss Prediction
Methods with AASHTO-LRFD Methods, 49
56 CHAPTER 4 Conclusions and Suggested ResearchConclusions, 56Suggested Research, 57
58 SIGN CONVENTION AND NOTATION
61 REFERENCES
63 APPENDIX A Other Methods of Shrinkage Strain Prediction
63 APPENDIX B Other Methods of Creep Coefficient Prediction
63 APPENDIX C Other Methods of Prestress Losses Prediction
63 APPENDIX D Material Testing
63 APPENDIX E Modulus of Elasticity Data
63 APPENDIX F Shrinkage Data
63 APPENDIX G Creep Data
CONTENTS

63 APPENDIX H Temperature Readings
63 APPENDIX I Strain Readings
63 APPENDIX J Specific Details of the Previous Measured Prestress Losses Experimental Data
63 APPENDIX K Prestress Loss Data
63 APPENDIX L Detailed Method Spreadsheet
63 APPENDIX M Proposed AASHTO-LRFD Revisions

The objective of this research was to develop design guidelines for estimating prestresslosses in high-strength pretensioned concrete girder bridges. The guidelines are intendedto address limitations in the current AASHTO-LRFD Bridge Design Specifications.Two main areas were identified for improvement: (a) prediction of modulus of elastic-ity, shrinkage, and creep of concrete, especially as they relate to the high-strength con-crete and (b) methods for estimating prestress losses that would account for the effects ofdifferential creep and shrinkage between precast concrete girder and cast-in-place con-crete deck and for relatively high prestress levels and low creep and shrinkage in high-strength concrete.
The research consisted of experimental and theoretical programs. The experimentalprogram consisted of measurements of properties of materials and of prestress loss inseven full-scale bridge girders in four states, representing a range of geographic con-ditions and construction practices: Nebraska, New Hampshire, Texas, and Washington.In addition, test results previously reported for 31 pretensioned girders in seven states,Connecticut, Illinois, Nebraska, Ohio, Pennsylvania, Texas, and Washington, wereincluded in the study. Additionally, relevant data reported by American Concrete Insti-tute (ACI) Committee 363 and FHWA were considered.
Formulas for prediction of modulus of elasticity, shrinkage, and creep of concretethat were consistent in form with the AASHTO-LRFD formulas were developed.These formulas produced comparable results for conventional concrete with those of theAASHTO-LRFD formulas. It was concluded that local material properties significantlyimpacted the prediction of modulus of elasticity, shrinkage, and creep. The proposedformulas produce national averages; factors are given to adjust these averages for thefour states covered in the project.
A “detailed method” based on pseudo-elastic analysis theory using modified “age-adjusted effective modulus” of elasticity of concrete is proposed for estimating prestresslosses. The method considers the effects of composite action between the precast con-crete girder and the cast-in-place concrete deck, material properties, environmental con-ditions, and construction schedule parameters available. An “approximate method” thatproduces reasonable estimates for commonly encountered conditions is also proposed.
SUMMARY
PRESTRESS LOSSES IN PRETENSIONED HIGH-STRENGTH CONCRETE BRIDGE GIRDERS

Both methods produced better correlation with test results than current AASHTO-LRFDmethods.
Numerical examples are given to demonstrate the proposed loss prediction methodsand to explain the recommendation that no elastic shortening losses at prestress trans-fer or elastic elongation gains at application of additional load, be considered in the cal-culation of concrete stresses, if transformed section properties are used.
2

3
CHAPTER 1
INTRODUCTION
PROBLEM STATEMENT
Use of high-strength concrete for pretensioned concretebridge girders has become accepted practice by many statehighway agencies because of its technical and economicbenefits. High-strength concrete permits longer girders andincreased girder spacing, thus reducing total bridge cost.The design of pretensioned concrete girders requires accu-rate estimates of prestress losses. These losses are affectedby factors such as mix design, curing, concrete strength, andservice exposure conditions.
Recent research has indicated that the current provisionsdeveloped for calculating prestress losses in normal-strengthconcrete may not provide reliable estimates for high-strengthconcrete bridge girders. Thus, research was needed to evalu-ate the applicability of the current provisions for estimatingprestress losses in high-strength concrete bridge girders and todevelop guidelines for estimating these losses. This informa-tion will help bridge design engineers to develop economicaldesigns for such girders. This project was conducted to addressthis need.
If one underestimates prestress losses, there is a risk ofcracking the girder bottom fibers under full service loads. Onthe other hand, if prestress losses are overestimated, a higherprestress force must be provided, which will result in largeramounts of camber and shortening than is necessary. It is,therefore, important to have a reasonably accurate estimate ofprestress losses.
OBJECTIVE AND SCOPE OF THE RESEARCH
The objective of this research was to develop designguidelines for estimating prestress losses in pretensionedhigh-strength concrete bridge girders. The research waslimited to the materials and practices currently used by statehighway agencies in the design and production of prestressedconcrete bridge girders and to assess their effects on prestresslosses.
To accomplish this objective the following tasks wereperformed:
1. Relevant literature, design specifications, research find-ings, and current practices for estimating prestress losses
in pretensioned concrete bridge girders were collectedand reviewed. This information was assembled frompublished and unpublished reports, contacts with statetransportation agencies, industry organizations, and otherdomestic and foreign sources.
2. Based on the information gathered in Task 1, the appli-cable range of concrete strengths for which the currentAASHTO provisions for estimating prestress losses inpretensioned concrete bridge girders was determined.
3. Based on the information gathered in Task 1, the mate-rial properties and other factors such as curing, exposure,and loading conditions that affect prestress losses in pre-tensioned high-strength concrete girders were studied.The test methods used for determining these materialproperties were identified.
4. A detailed experimental research plan, which encom-passed the investigation of full-scale girders and associ-ated analysis, was developed for evaluating the effects ofthe material properties and other factors on the prestresslosses in pretensioned concrete bridge girders. This planaddressed concrete strength levels that are currently usedby state highway agencies and are beyond the applica-bility range of the current AASHTO Specifications.
5. The plan developed in Task 4 was executed. It includeda material testing program for the field and laboratoryand a full-scale testing of seven bridge girders in fourstates. Also, an implementation plan for putting theresults of this research into practice was suggested.
6. Design guidelines for estimating prestress losses in pre-tensioned high-strength concrete bridge girders weredeveloped based on the results of the entire researcheffort.
RESEARCH APPROACH
Time-dependent prestress loss is influenced by creep andshrinkage of concrete and stress relaxation of the prestressingstrands. As concrete shrinks, the prestressing steel shortensand loses some of its tension. Consequently, concrete creepsless than in the case of sustained constant compression; so-called “creep recovery” takes place. Also, as concrete creepsand shrinks, the prestressing strands relax at a slower rate thanthey would if they were stressed and kept stretched between
two fixed points; thus, the “reduced” relaxation is less than the“intrinsic” relaxation that occurs in a constant-length labora-tory test. This interaction between shrinkage and creep of con-crete and relaxation of prestressing strands is partially takeninto account in the current prediction formulas of theAASHTO-LRFD Specifications (1).
The effect of high compressive strength concrete on the pre-stress loss due to creep and shrinkage strain is not taken intoaccount in the current AASHTO-LRFD Specifications (1).The use of high-strength concrete to improve the structuralefficiency of pretensioned bridge girders has created the needfor an accurate estimation of material properties that impactthe time-dependent components of prestress losses.
Also, the current AASHTO-LRFD formulas do not con-sider the interaction between the precast pretensioned con-crete girder and the precast or cast-in-place concrete deck.The concrete deck, if used, can induce significant shrinkagedeformation that results in additional stresses, thus affectingthe magnitude of the prestress losses and the tensile stress atthe girder bottom.
ORGANIZATION OF THE REPORT
This report consists of four chapters. This chapter providesthe introduction and research approach, describes the prob-lem statement and research objective, and outlines the scopeof the study. Chapter 2 describes the findings of the literaturereview, relevant material properties, and current loss predic-tion methods. The conditions for which the current AASHTO-LRFD loss prediction methods are applicable are indicated.
4
Chapter 3 discusses the material properties that affect prestresslosses. It also covers the experimental program for materialproperties and prestress loss measurements in seven full-scalegirders located in Nebraska, New Hampshire, Texas, andWashington. The proposed formulas for prediction of mod-ulus of elasticity, shrinkage, and creep of concrete and relax-ation of prestressing strands are presented. A detailed methodand an approximate method for estimating prestress lossesin pretensioned bridge girders and numerical examples todemonstrate their use are presented in Chapter 3. Chapter 4summarizes the significant conclusions of this project andpresents suggestions for future research.
APPLICABILITY OF RESULTS TO HIGHWAY PRACTICE
The design and construction of precast prestressed concretebridge girders is impacted by the amount of prestressing thatcould be applied to the girders and the effective prestressremaining after elastic and short-term losses have developed.The findings presented in Chapters 3 and 4 on the predictionof modulus of elasticity, shrinkage, and creep of concrete andon the estimation of prestress losses could be included in theAASHTO-LRFD Specifications to provide designers of pre-stressed concrete bridges with more realistic estimates of pre-stress losses. Realistic estimates of prestress losses, especiallyfor high-strength concrete, would prevent specifying exces-sive prestress forces and should result in economical designswith realistic concrete stresses at service conditions and rela-tively moderate girder camber.
5
INTRODUCTION
There are two sources of possible inaccuracies in prestresslosses calculations: (a) incorrect theory and (b) inaccurateestimate of material properties. The research team revieweddomestic and foreign literature, research findings, and exper-imental data. The literature search focused on experimentsrelated to concrete material properties and prestress losses.
The prestress losses prediction formulas are used by currentAASHTO-LRFD and AASHTO Standard Specifications (2)for considering the effects of variation in material proper-ties, especially concrete strength. The range of conditions forwhich the current AASHTO-LRFD and the AASHTO Stan-dard Specifications are applicable, was determined fromthree parametric studies. The first study assessed the vari-ability of the prestress loss component attributed to concretecreep. The second study evaluated the shrinkage componentwith consideration to type of beam cross section, concretecompressive strength, relative humidity, and amounts of pre-stressing steel. The third study compared prestress losses fora number of designs using the AASHTO-LRFD methods.
DEFINITIONS
Definitions of the significant terms used in this study aregiven below because some of the terms, such as long-termprestress loss, have no universally accepted definitions. Thismakes comparing the results of some methods misleading.
Prestress Loss
The primary purpose of calculating the effective prestressforce acting on a prestressed concrete section is to evaluateconcrete stresses and deformations under service conditions.The most representative definition of prestress loss is the lossof compressive force acting on the concrete component ofa prestressed concrete section. Creep and shrinkage causemember shortening and a loss of tension in the prestressingtendons as well as a compression force increment in nonpre-stressed reinforcement, if such reinforcement exists in a mem-ber. The sum of the reduction in tensile force in the tendonsand compression force increment in the non-prestressed re-inforcement is equal and opposite to the incremental loss ofcompression force in concrete. That force is the force neededfor concrete stress analysis.
Since this project deals with pretensioned members, whichare generally reinforced in flexure with prestressing strandsonly, loss of tension in the strands is equal and opposite to lossof compression in the concrete. Therefore, the more common,though less comprehensive, definition of prestress loss, thatis, loss of tension in the prestressing strands is adopted. Pre-stress loss is considered a positive quantity, even though it isa compression increment in the strands.
Total Loss of Prestress
Theoretically, total loss of prestress is the reduction oftension from the time strands are tensioned until the end ofservice life of the prestressed concrete member. Only thepart of that total loss that is of practical significance tobridge designers is considered in this project. Thus, the totalloss of prestress is defined as the difference in the stress inthe strands immediately before transfer to the concrete mem-ber and the stress at the end of service life of the member.
Elastic Loss (or Gain)
As the prestressing force is released from the bed and trans-ferred to the concrete member, the member undergoes short-ening and cambers upward between its two ends. The elasticloss at transfer is the tensile stress loss due to prestress com-bined with stress gain due to member weight. As an addi-tional load, for example, the deck weight, is introduced to themember, the strands elongate, and thus undergo elastic gain.As will be shown in Chapters 3 and 4, the elastic losses andgains do not have to be calculated. They can be automaticallyaccounted for when transformed section properties are used.When prestress loss prediction methods are compared, it is important to isolate elastic losses and gains and properlyaccount for them in the comparison. Elastic gain is considereda negative quantity in the total loss value.
Long-Term Losses
Long-term prestress loss is the loss due to creep and shrink-age of concrete and relaxation of steel. In this study, the elas-tic losses or gains due to applied dead and live loads are notincluded in the long-term prestress loss. Because the currentAASHTO Specifications do not include any terms for elastic
CHAPTER 2
BACKGROUND AND LITERATURE SEARCH
gain due to any of the loads applied after prestress transfer,the long-term losses given in these specifications implicitlyinclude these elastic gain increments.
COMPONENTS OF PRESTRESS LOSSES IN PRETENSIONED GIRDERS
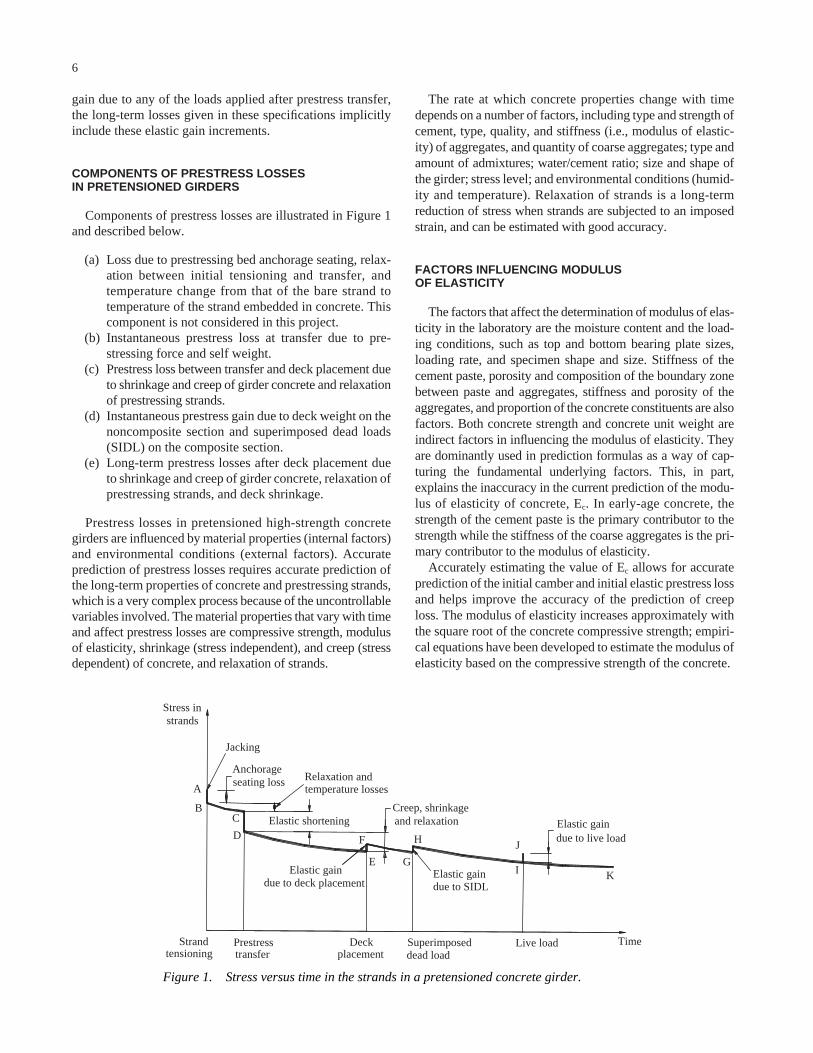
Components of prestress losses are illustrated in Figure 1and described below.
(a) Loss due to prestressing bed anchorage seating, relax-ation between initial tensioning and transfer, andtemperature change from that of the bare strand totemperature of the strand embedded in concrete. Thiscomponent is not considered in this project.
(b) Instantaneous prestress loss at transfer due to pre-stressing force and self weight.
(c) Prestress loss between transfer and deck placement dueto shrinkage and creep of girder concrete and relaxationof prestressing strands.
(d) Instantaneous prestress gain due to deck weight on thenoncomposite section and superimposed dead loads(SIDL) on the composite section.
(e) Long-term prestress losses after deck placement dueto shrinkage and creep of girder concrete, relaxation ofprestressing strands, and deck shrinkage.
Prestress losses in pretensioned high-strength concretegirders are influenced by material properties (internal factors)and environmental conditions (external factors). Accurateprediction of prestress losses requires accurate prediction ofthe long-term properties of concrete and prestressing strands,which is a very complex process because of the uncontrollablevariables involved. The material properties that vary with timeand affect prestress losses are compressive strength, modulusof elasticity, shrinkage (stress independent), and creep (stressdependent) of concrete, and relaxation of strands.
6
The rate at which concrete properties change with timedepends on a number of factors, including type and strength ofcement, type, quality, and stiffness (i.e., modulus of elastic-ity) of aggregates, and quantity of coarse aggregates; type andamount of admixtures; water/cement ratio; size and shape ofthe girder; stress level; and environmental conditions (humid-ity and temperature). Relaxation of strands is a long-termreduction of stress when strands are subjected to an imposedstrain, and can be estimated with good accuracy.
FACTORS INFLUENCING MODULUS OF ELASTICITY
The factors that affect the determination of modulus of elas-ticity in the laboratory are the moisture content and the load-ing conditions, such as top and bottom bearing plate sizes,loading rate, and specimen shape and size. Stiffness of thecement paste, porosity and composition of the boundary zonebetween paste and aggregates, stiffness and porosity of theaggregates, and proportion of the concrete constituents are alsofactors. Both concrete strength and concrete unit weight areindirect factors in influencing the modulus of elasticity. Theyare dominantly used in prediction formulas as a way of cap-turing the fundamental underlying factors. This, in part,explains the inaccuracy in the current prediction of the modu-lus of elasticity of concrete, Ec. In early-age concrete, thestrength of the cement paste is the primary contributor to thestrength while the stiffness of the coarse aggregates is the pri-mary contributor to the modulus of elasticity.
Accurately estimating the value of Ec allows for accurateprediction of the initial camber and initial elastic prestress lossand helps improve the accuracy of the prediction of creeploss. The modulus of elasticity increases approximately withthe square root of the concrete compressive strength; empiri-cal equations have been developed to estimate the modulus ofelasticity based on the compressive strength of the concrete.
Stress in strands
TimeStrand Prestress Deck tensioning transfer placement
Anchorage seating loss
Jacking
Relaxation and temperature losses
Creep, shrinkage and relaxation
Elastic gaindue to deck placement
A
BC
D
E
F
Superimposed
H
I KElastic gaindue to SIDL
Elastic gain due to live load
J
Live load
G
Elastic shortening
dead load
Figure 1. Stress versus time in the strands in a pretensioned concrete girder.

When the unit weight of concrete, wc, is different from0.145 kcf (assumed for the normal unit weight concrete inSection C5.4.2.4 of the AASHTO-LRFD Specifications), andin the absence of more laboratory data, the modulus of elas-ticity, according to the AASHTO-LRFD (1), the ACI-318 (3),and the Precast/Prestressed Concrete Institute Bridge DesignManual (PCI-BDM) (4), is based on the compressive strengthand unit weight of concrete (AASHTO Equation 5.4.2.4-1and ACI-318 Equation 8.5.1):
The above formula is applicable to concretes with unitweights between 0.090 and 0.155 kip/ft3 (1,442 and 2,483 kg/m3). According to ACI-363 Committee Report (5 ),this formula tends to significantly overestimate the modulusof elasticity for concretes with compressive strengths over6 ksi (41 MPa). Other equations were proposed, and thefollowing formula was adopted by ACI Committee 363(ACI-363 Equation 5-1):
This formula does not account for factors other than the unitweight and compressive strength that clearly affect the valueof Ec, such as coarse aggregate content in concrete and prop-erties of the aggregates. Myers and Carrasquillo (6) showedthat elastic modulus appeared to be a function of the coarseaggregate content and type.
E w f kcf and ksi
E w f kg m and MPa
c c c
c c c
= ( ) + ′( ) ( )
= ( ) + ′( ) ( )
0 145 1000 1265 2
86 6900 3320
1 5
1 5 3
. ( ).
.
E w f kg m and MPac c c= ′ ( )0 043 1 5 3. .
E w f kcf and ksic c c= ′ ( )33 000 11 5, ( ).
7
The prediction of the modulus of elasticity can be consider-ably improved if the influence of the modulus of elasticity ofthe particular type of aggregate used in the concrete is takeninto account. This has been reflected in the Comité Euro-Inter-national du Beton-Fédération Internationale de la Précontrainte(CEB-FIP) Model Code (7), which introduced the empiricalcoefficient αE to reflect the strength of the aggregate used:
where: Ec = tangent modulus of elasticity at zero stress andat a concrete age of 28 days and fcm = mean compressivestrength of concrete. The values of the empirical coefficientαE are 1.2 for basalt and dense limestone, 1.0 for quartzaggregates, 0.9 for limestone, and 0.7 for sandstone.
Figure 5.3 of the ACI-363 Committee Report compares val-ues for the modulus of elasticity of concrete experimentallydetermined from previous research with those predicted by theACI-318 Building Code formula and based on a dry unit weightof 0.145 kip/ft3. This chart was reproduced and is included inFigure 2, which also includes experimental data collected fromthe FHWA Showcase (8). Deviations from predicted values arehighly dependent on the properties of the coarse aggregate.
The research work at the University of Minnesota indicated,based on the use of local materials, that the AASHTO-LRFDequation overestimated the modulus of elasticity of high-strength concrete (Ahlborn [9]). Researchers at the Universityof Texas (6 ) reported all high-strength concrete mixes testedin their research had moduli of elasticity larger than thosepredicted by ACI Committee 363 formula. Huo (10) and Huoet al. (11) indicated that both the AASHTO-LRFD and the
E f ksi
E f MPa
c E cm
c E cm
= ( ) ( )
= ( ) ( )
3100 1 44
21500 103
1 3
1 3
α
α
.( )
0
1000
2000
3000
4000
5000
6000
7000
8000
9000
10000
0.0 1.0 2.0 3.0 4.0 5.0 6.0 7.0 8.0 9.0 10.0 11.0 12.0 13.0 14.0 15.0 16.0 17.0 18.0
Compressive Strength (ksi)
Modulus of Elasticity (ksi)
(ksi)fAASHTO-LRFD, Ec = 33,000w1.5 c
'
( ) (ksi)0.145
wcf 'c – 1,0001265ACI 363, Ec =
1.5
� �
Figure 2. Modulus of elasticity versus compressive strength data obtained from ACI-363 Report (5) and FHWA Showcase (8).

ACI Committee 363 equations underestimated the modulusof elasticity of three high-strength concrete mixes studiedin that research.
The differing opinions among researchers on the predictionequations for the modulus of elasticity have raised a questionas to how to correctly predict the value of Ec for high-strengthconcrete. Although all the prediction equations for modulusof elasticity have compressive strength of concrete f ′c as a vari-able, other factors clearly affect the value of Ec, such as coarseaggregate content in the concrete and properties of the aggre-gates. These factors will be further explored in Chapter 3.
FACTORS INFLUENCING SHRINKAGE
Shrinkage depends on many variables, including water-to-binder ratio, moisture, relative humidity of the environment,ambient temperature, aggregate properties, and size and shapeof the structural member. It is assumed to be independent ofloading and results primarily from shrinkage of the cementpaste. Because aggregates tend to restrain the shrinkage ofthe paste, the stiffness and proportion of aggregates influenceshrinkage.
Shrinkage is conveniently expressed as a dimensionlessstrain under steady conditions of relative humidity and tem-perature. The AASHTO-LRFD formula for estimating shrink-age strain, �sh, as a function of a time-development factor, ktd,and the ultimate shrinkage (at time infinity), �sh, u, is:
= −( ) ≥3 10012
H70
for H 80% ( )
k humidity factor for shrinkage
H
70for H < 80%,
hs =
= −140 11( )
k V/S ratio size correction factor
te t
tt
V S
s
V S
= ( )
= +
+
−
26
45
1064 94923
100 36.
( )
γsh s hsk k= ( )9
kt
tafter days of moist curingtd =
+357 8( )
k tt
after days of accelerated curing
td =+55
1 37
–( )
�sh,u sh for moist curing= × −510 10 66 γ ( )
�sh,u sh for accelerated curing= × −560 10 56 γ ( )
� �sh td sh,uk= ( )4
8
In these equations, t is drying time after end of curing indays, H is relative humidity of ambient air, and V/S ratio isvolume-to-surface ratio in inches. Other methods of predict-ing shrinkage strain such as the PCI-BDM, the ACI-209 (12),and the CEB-FIP are presented in Appendix A.
FACTORS INFLUENCING CREEP
The creep of concrete depends on many factors otherthan time, such as volume content of hydrated cementpaste, relative humidity, the type and volume of the aggre-gate, the age of the concrete at the time of loading, the stresslevel, the duration the concrete is stressed, and the geome-try of the member. The size and shape of a concrete mem-ber can significantly influence the rate and the magnitudeof creep. Hansen (13) observed that the rate and magnitudeof ultimate creep were substantially smaller for largermembers.
Creep in high-strength concrete is generally smaller thanin normal-strength concrete loaded to a similar stress levelbecause of the lower water-to-binder ratio of high-strengthconcrete. At any time, the creep strain can be related to theinitial elastic strain by a creep coefficient, ψ (t, ti), which isthe ratio of creep strain to elastic strain. Creep strain willreach its ultimate value with an ultimate creep coefficient,ψu, at the end of the service life of the structure.
The AASHTO-LRFD creep prediction formulas are pre-sented here. Other methods, for example, the PCI-BDM, theACI-209, and the CEB-FIP are presented in Appendix B.
k loading age factor tla = = −1
0 118 19. ( )
k humidity factor for creepH
120hc = = −1 58
18.
( )
k size factor
te t
tt
.77e
c
V S -0.54V S
=
= +
+
+
26
45
1 80 1
2 587
170 36. .
.
( )
k concrete strength factor
fwith f in ksi
f
cc
=
=+ ′ ′1
0 679
16
.
( )
γcr f c hc lak k k k= ( )15
ψ γu cr= 3 5 14. ( )
ψ ψt, t ki td u( ) = ( )13

ti = age of concrete, in days, when load is initially appliedfor accelerated curing or the age minus 6 days formoist curing.
FACTORS INFLUENCING RELAXATION OF STRANDS
If a strand is stressed and then held at constant strain, thestress decreases with time. The decrease in stress is calledintrinsic relaxation loss. The intrinsic relaxation loss is largerwith larger initial stress and higher temperature. Strands usedin current practice are low-relaxation strands, which undergoconsiderably less relaxation than stress-relieved strands. As aresult, the relaxation component of prestress loss has becomea very small one.
The intrinsic relaxation loss for stress-relieved strand 1:
The intrinsic relaxation loss for low-relaxation strand 1:
where: t is time in days from time of initial stressing, fpj (ksi),fpy (ksi) is yield strength of prestressing steel estimated at
∆ft
40.0
f
ffpR1
pi
pypj=
( )−
log .. ( )
24 00 55 22
∆ft
10.0
f
ffpR1
pi
pypj=
( )−
log .. ( )
24 00 55 21
k time-development factort t
t ttd
i
i
= = −( )+ −( )
0 6
0 61020
.
. ( )
9
85% of ultimate strength for stress relieved strands and 90%for low-relaxation strands. Relaxation loss in prestressingstrands after transfer is given by the formulas:
For stress-relieved strand:
For low-relaxation strand:
where: ∆fpES is loss due to elastic shortening, ∆fpSR is loss dueto shrinkage, and ∆fpCR is loss due to creep. Low-relaxationstrands are the standard product for concrete girders. In mostapplications, the relaxation loss after transfer is in the 1.8 to3.0 ksi range—a relatively small component of the total pre-stress loss.
TIME-DEPENDENT STRESS ANALYSIS
Stress-Strain Relationships
The strain that occurs upon initial loading in a concrete spec-imen subjected to a sustained axial load is the elastic strain.Additional strain then develops with time due to creep andshrinkage. Shrinkage strain is stress-independent. The ratio ofcreep strain at time t to elastic strain for a concrete specimenloaded at time ti is creep coefficient, ψ (t, ti). Figure 3 shows
∆ ∆ ∆ ∆f f f f ksipR2 pES pSR pCR= − − +( ) ( )6 0 0 12 0 06 24. . . ( )
∆ ∆ ∆ ∆f f f f ksipR2 pES pSR pCR= − − +( ) ( )20 0 0 4 0 2 23. . . ( )
Stress
Time
Constant stress
Variable stressStress f
Strain
Time
sh
c2
f ε = (1+χψ )+ E
ε sh
c
1f ε = (1+ ψ )+ E
ε
c
f ε = EVariable stress
Constant stress
Figure 3. Creep strain for constant and variable stress conditions.
creep strain versus time for constant and variable concretestress conditions.
Age-Adjusted Effective Modulus
Elastic and creep strains of concrete can be combined andtreated as if they were elastic deformations through use of an“age-adjusted” effective modulus of elasticity. For constantsustained stress, the elastic-plus-creep strain is equal to (1 +ψ) times the elastic strain. Thus, the elastic-plus-creep straincan be thought of as elastic-only strain if an effective modu-lus of elasticity is used to calculate that pseudo-elastic strain.
Therefore, the total concrete strain under long-term con-ditions is:
If the concrete stress varies with time, the elastic-plus-creep strain becomes (1 + χψ) where the coefficient χ is theaging coefficient, initially proposed by Trost (14) and furtherdeveloped by Bazant (15) and Dilger (16). It varies between0 and 1 depending on concrete stress variability and the agingprocess of the member being considered. The age-adjustedeffective modulus of elasticity of concrete is thus defined as:
The total concrete strain is:
Thus, the time-dependent analysis for the effects of allconstant sustained loads (initial prestress, self weight, deckweight, and SIDL) can be carried out using an effective elas-ticity modulus E ′c as defined by Equation 25, and for variablestress inducing effects (prestress loss and differential creepand shrinkage between the precast and cast-in-place compo-nents of section) using the age-adjusted effective modulusdefined by Equation 27. Tadros et al. (17, 18) demonstratedthat, for precast prestressed concrete members, the agingcoefficient ranges between 0.6 and 0.8.
Procedure for Time-Dependent Stress Analysis
The procedure presented by Dilger (16 ) may be used forcomputing time-dependent stresses in prestressed concretemembers. The analysis is based on initial strain theory often
� �2 28=′′
+fE
c
csh ( )
′′ =+
E E1c
c
χψ( )27
� �1 26=′
+f
Ec
csh ( )
′ =+
EE
cc
125
ψ( )
10
employed in finite-element analysis of the effects of temper-ature change in structures.
The following three steps illustrate this analysis for simplysupported precast concrete members.
Step 1: Immediately after transfer of prestress, separate thevarious components of the cross section into free-to-deformelements to allow deformation due to creep, shrinkage, andrelaxation. Deformation of mild reinforcement is assumed tobe zero. Concrete deformation will occur due to creep andshrinkage, and prestressing steel deformation will be relatedto its relaxation.
Step 2: The deformation of each of the components isbrought to zero by applying axial force and bending momentto the concrete and axial force to the prestressing steel, usingage-adjusted concrete modulus of elasticity.
Step 3: The various components are then reconnectedassuming full bond between them to restore equilibrium. Thisis done by applying equal and opposite forces to the restrain-ing forces calculated in Step 2. These new forces are com-bined into an axial force and a bending moment introduced tothe age-adjusted equivalent transformed composite section.The deformation of the member due to this step is the totaldeformation. The stresses in the various components are thesum of the stresses obtained in Step 2 and Step 3.
PRESTRESS LOSS CALCULATION METHODS
Estimating prestress loss requires an accurate predictionof material properties and of the interaction between creepand shrinkage of concrete and the relaxation of steel. In addi-tion, prestress losses are influenced by composite action be-tween the cast-in-place concrete deck and the precast concretegirders. Use of high-strength concrete in precast prestressedconcrete allows for high levels of prestress and long spancapacities. However, experience in estimating prestress lossfor high-strength concrete is limited. Approaches for esti-mating prestress losses can be divided into the followingthree major categories, listed in descending order of complex-ity and accuracy:
(a) Time-Step methods(b) Refined methods(c) Lump-Sum methods
TIME-STEP PRESTRESS LOSS METHODS
These methods are based on a step-by-step numericalprocedure implemented in specialized computer programsfor the accurate estimation of long-term prestress losses. Thisapproach is especially useful in multi-stage bridge construc-tion such as spliced girder and segmental box girder bridges.As concrete creeps and shrinks, the prestressing strands shortenand decrease in tension. This, in turn, causes the strands to relaxless than if they were stretched between two fixed points.Hence, “reduced” rather than “intrinsic” relaxation loss takes

place. As the prestressing strand tension is decreased, con-crete creeps less, resulting in some recovery.
To account for the continuous interactions between creepand shrinkage of concrete and the relaxation of strands withtime, time will be divided into intervals; the duration of eachtime interval can be made progressively larger as the concreteage increases. The stress in the strands at the end of each inter-val equals the initial conditions at the beginning of that timeinterval minus the calculated prestress losses during the inter-val. The stresses and deformations at the beginning of aninterval are the same as those at the end of the preceding inter-val. With this time-step method, the prestress level can beestimated at any critical time of the life of the structure. Moreinformation on these methods is given in Tadros et al. (19),Abdel-Karim (20) and the PCI-BDM (4).
REFINED PRESTRESS LOSS METHODS
In these methods, individual components of prestress lossare calculated separately and the total prestress losses are thencalculated by summing up the separate components. How-ever, none of these methods accounts for composite actionbetween deck slabs and precast girders. Because the deckconcrete shrinks more and creeps less than the precast girderconcrete, prestress gain rather than prestress loss may occur.
Data representing the properties of materials, loading con-ditions, environmental conditions, and pertinent structuraldetails have been incorporated in the prediction formulasused for computing the individual prestress loss components.Over the years, several methods have been developed. Amongthese methods, are the current AASHTO-LRFD Refinedmethod (1), the AASHTO Standard Specifications method (2),and the PCI-BDM method (4).
In the eleventh edition of the AASHO (currently calledAASHTO) Specifications, total losses were estimated as asum of individual components. The provisions for prestressloss that appeared in the 1973 Specifications (21) were firstintroduced in the 1971 Interim Specifications. These provi-sions marked the first use of a rational method of estimatingloss of prestress in the AASHO/AASHTO Specifications.The following equation was introduced in the 1971 InterimSpecifications:
where: ∆fs = total loss of prestress, ES = loss due to elasticshortening, SH = loss due to concrete shrinkage, CRC = loss
∆f ES SH CR CRs C S= + + + ( )29
11
due to creep of concrete, and CRS = loss due to relaxation ofprestressing steel.
Elastic Shortening Losses
Elastic shortening losses were estimated using the follow-ing equation:
where: fcgp = average concrete stress at the center of gravity ofthe prestressing steel at time of release. The coefficient 7 inthis equation was apparently an estimate of the modular ratioof Es to Eci. Losses due to elastic shortening after release ofprestressing force in the AASHTO 1977 Specifications (22)were given by:
where: Es = modulus of elasticity of prestressing steel andEci = modulus of elasticity of concrete at time of release.
Shrinkage Losses
Losses due to concrete shrinkage provided in the 1973 Spec-ifications (21) are given in Table 1. These values correspondto a value for ultimate shrinkage strain of approximately 550 ×10−6 for concrete and a modulus of elasticity of approximately28,000 ksi for prestressing tendons. A reduction factor, of 0.77was used to adjust the ultimate shrinkage strain for a V/S ratioof approximately 4 in. Correction factors for average ambientrelative humidity were applied by the PCI Committee on Pre-stress Losses (23); the final values appearing in the StandardSpecifications are shown in Table 2.
Starting with the twelfth edition in 1977, the AASHTOSpecifications (22) provisions for estimating loss of prestresshave remained essentially unchanged. The prestress lossesformula was repeated in its original form from the 1973 Spec-ifications (21), but changes in equations for estimating thecomponents were made. These changes were first introducedinto the Specifications with the 1975 Interim AASHTO Spec-ifications. Losses due to shrinkage of concrete were given by:
where: H = mean annual ambient relative humidity, in percent.This equation was developed to yield similar results as those
SH H= −17 000 150 32, ( )
ESE
Efs
cicgp= ( )31
ES fcgp= 7 30( )
Average ambient relative humidity (percent) SH losses (ksi)
100 - 75 5 75 - 25 10 25 - 0 15
TABLE 1 Shrinkage losses versus humidity in 1973 AASHO Specifications (21)
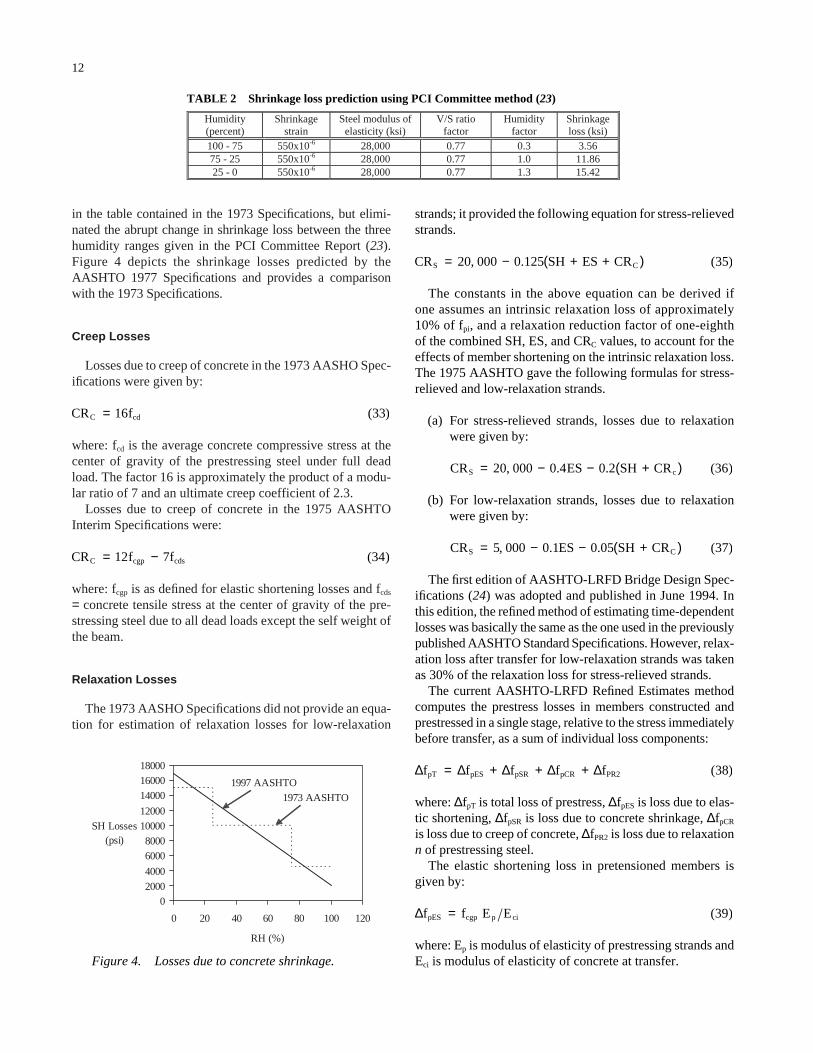
in the table contained in the 1973 Specifications, but elimi-nated the abrupt change in shrinkage loss between the threehumidity ranges given in the PCI Committee Report (23). Figure 4 depicts the shrinkage losses predicted by theAASHTO 1977 Specifications and provides a comparisonwith the 1973 Specifications.
Creep Losses
Losses due to creep of concrete in the 1973 AASHO Spec-ifications were given by:
where: fcd is the average concrete compressive stress at thecenter of gravity of the prestressing steel under full deadload. The factor 16 is approximately the product of a modu-lar ratio of 7 and an ultimate creep coefficient of 2.3.
Losses due to creep of concrete in the 1975 AASHTOInterim Specifications were:
where: fcgp is as defined for elastic shortening losses and fcds
= concrete tensile stress at the center of gravity of the pre-stressing steel due to all dead loads except the self weight ofthe beam.
Relaxation Losses
The 1973 AASHO Specifications did not provide an equa-tion for estimation of relaxation losses for low-relaxation
CR f fC cgp cds= −12 7 34( )
CR fC cd= 16 33( )
12
strands; it provided the following equation for stress-relievedstrands.
The constants in the above equation can be derived ifone assumes an intrinsic relaxation loss of approximately10% of fpi, and a relaxation reduction factor of one-eighthof the combined SH, ES, and CRC values, to account for theeffects of member shortening on the intrinsic relaxation loss.The 1975 AASHTO gave the following formulas for stress-relieved and low-relaxation strands.
(a) For stress-relieved strands, losses due to relaxationwere given by:
(b) For low-relaxation strands, losses due to relaxationwere given by:
The first edition of AASHTO-LRFD Bridge Design Spec-ifications (24) was adopted and published in June 1994. Inthis edition, the refined method of estimating time-dependentlosses was basically the same as the one used in the previouslypublished AASHTO Standard Specifications. However, relax-ation loss after transfer for low-relaxation strands was takenas 30% of the relaxation loss for stress-relieved strands.
The current AASHTO-LRFD Refined Estimates methodcomputes the prestress losses in members constructed andprestressed in a single stage, relative to the stress immediatelybefore transfer, as a sum of individual loss components:
where: ∆fpT is total loss of prestress, ∆fpES is loss due to elas-tic shortening, ∆fpSR is loss due to concrete shrinkage, ∆fpCR
is loss due to creep of concrete, ∆fPR2 is loss due to relaxationn of prestressing steel.
The elastic shortening loss in pretensioned members isgiven by:
where: Ep is modulus of elasticity of prestressing strands andEci is modulus of elasticity of concrete at transfer.
∆f f E EpES cgp p ci= ( )39
∆ ∆ ∆ ∆ ∆f f f f fpT pES pSR pCR PR2= + + + ( )38
CR ES . 5 SH CRS C= − − +( )5 000 0 1 0 0 37, . ( )
CR ES . SH CRS c= − − +( )20 000 0 4 0 2 36, . ( )
CR SH ES CRS C= − + +( )20 000 0 125 35, . ( )
Humidity (percent)
Shrinkage strain
Steel modulus of elasticity (ksi)
V/S ratio factor
Humidity factor
Shrinkage loss (ksi)
100 - 75 550x10-6 28,000 0.77 0.3 3.56 75 - 25 550x10-6 28,000 0.77 1.0 11.86 25 - 0 550x10-6 28,000 0.77 1.3 15.42
TABLE 2 Shrinkage loss prediction using PCI Committee method (23)
02000
4000
60008000
1000012000
14000
1600018000
0 20 40 60 80 100 120
RH (%)
SH Losses (psi)
1997 AASHTO1973 AASHTO
Figure 4. Losses due to concrete shrinkage.
Loss due to shrinkage of concrete is taken as a function ofthe relative humidity only, and does not take into account thevariability of shrinkage with other parameters as indicated inSection 5.4.2.3.3 of the AASHTO-LRFD. Shrinkage loss isestimated by the following equation:
where: H = mean annual ambient relative humidity.
Loss due to creep may be taken as:
where: ∆fcdp = change in concrete stress at the center of grav-ity of the prestressing strands due to the permanent loads, withthe exception of the load acting at the time the prestressingforce is applied. Values of ∆fcdp should be calculated at thesame section or at the sections for which fcgp is calculated.
The relaxation after transfer is:
Other methods of prestress losses prediction such as thePCI-BDM method (4), CEB-FIP Model Code method (25),Ontario Bridge Design Code method (26), ACI-ASCE Com-mittee 423 method (27), Concrete Technology Associates(CTA) method (28), Modified Rate of Creep method (29), andTadros et al. method (19) and are given in Appendix C.
LUMP-SUM METHODS
Lump-sum methods represent average conditions. Theyare useful in preliminary design, but the estimated loss shouldbe recalculated in the final design. According to the currentAASHTO-LRFD Approximate method, prestress loss forgirders with 270 ksi low-relaxation strands is given by thefollowing formulas:
∆ ∆ ∆ ∆f f f fpR2 pES pSR pCR= − − +( )6 0 0 12 0 06 42. . . ( )
∆ ∆f 1 f fpCR cgp cdp= − ≥2 0 7 0 0 41. . ( )
∆f 1 HpSR = −7 0 0 15 40. . ( )
13
where: PPR is the partial prestress ration, which normally= 1 for precast pretensioned members. These formulasreflect trends obtained from a computerized time-stepanalysis of different beam sections for an ultimate concretecreep coefficient ranging from 1.6 to 2.4, ultimate concreteshrinkage strain ranging from 0.0004 to 0.0006, and rela-tive humidity ranging from 40% to 100%.
This procedure recognizes reduction in prestress loss forconcrete compressive strengths above 6.0 ksi. However, itdoes not recognize higher prestress levels for higher concretestrengths. It assumes, without justification, a large differencein prestress loss prediction for box girders and I-girders, andconversely no difference in loss values for vastly differentproduct types: I-girders, double tee beams, and voided slabs.
Based on a review of available information, it was evidentthat additional research is required to establish realistic esti-mates of modulus of elasticity, creep, and shrinkage of high-strength concrete. The AASHTO-LRFD provisions need tobe updated (1) to consider high-strength concrete in Sections5.4.2.3 and 5.4.2.4, (2) to improve the prestress loss calcu-lation methods of Section 5.9.5 for high-strength concrete,and (3) to link the material property formulas of Sections5.4.2.3. and 5.4.2.4 with prestress loss prediction formulasof Section 5.9.5 into one integrated approach. Both detailedand approximate estimation of prestress losses are neededin design depending on the design stage and the type ofmember.
33 1 0 15 6 6 6 8
46
− ′ −( )[ ] + ( ).
( )
f PPR– ksi
for Double Tees and Voided Slabs;
c
33 1 0 15 6 6 6 6 45− ′ −( )[ ] + ( ). ( )f PPR– ksi for I-Girders;c
26 4 644
+ ( )PPR– ksi for Rectangular Beams and Solid Slabs; ( )
19 4 4 43+ ( )PPR ksi for Box Girders;– ( )

INTRODUCTION
This chapter presents the prediction formulas of modulusof elasticity, creep, and shrinkage of high-strength concrete.The experimental basis for the proposed prediction formu-las is given. Seven bridge girders in the states of Nebraska,New Hampshire, Texas, and Washington were instrumentedfor prestress loss measurement. Two methods are proposed forthe estimation of prestress losses, a detailed method and anapproximate method. The laboratory and field measurementswere used to verify and calibrate the prediction methods.
In applying the proposed prediction methods, two alter-natives for the input material properties were used. The firstalternative was to use the measured material properties for thebridge girders that had been instrumented for prestress loss.The second alternative was to use specified and predictedmaterial values that would normally be available to designers.In the latter alternative, specified concrete strength, assumedconstruction schedule, and the corresponding estimated mod-ulus of elasticity, creep, and shrinkage were input into the lossprediction formulas. Comparisons were also given betweenmeasured loss values and those predicted by other methods inorder to demonstrate the improvements offered by the pro-posed method.
Formulas presently used by various codes for computingconcrete modulus of elasticity, shrinkage, and creep have beenempirically established based primarily on data for normal-strength concrete with compressive strength up to 6.0 ksi (30).There has been recent interest in reevaluating these formulasand extending their applicability to concrete strengths between8.0 and 12.0 ksi. Experimental work included both laboratorytests and field measurements.
This section covers the material testing program of con-crete mixes used in Nebraska, New Hampshire, Texas, andWashington for pretensioned concrete girders and presentsthe results of previously reported research. For each materialproperty, a summary of measured values is presented, fol-lowed by a proposed estimation method. A record of all datacollected in this research is given in the appendixes (which arenot published herein) for the various parameters evaluated.
EXPERIMENTAL PROGRAM
The materials testing program consisted of laboratorymaterial tests conducted at the University of Nebraska (lab-
14
oratory tests) and material tests conducted at girder produc-tion plants and at construction sites (on-site tests).
Laboratory Material Tests
The precast concrete producer in each of the four statesprovided three concrete mix designs and furnished raw ma-terials for making and testing specimens at the University ofNebraska. One of the mixes represented the concrete intendedto be used in the instrumented bridge girders. In addition, eachparticipating state highway agency arranged for shipping rawmaterials and for producing this mix in laboratories that pro-vided one mix design for the normal-strength concrete usedin bridge deck construction. Proportions of state highwayagency mixes are given in Tables 3 through 6. Additionaldetails are given in Appendix D.
Twenty-seven 4 in. by 8 in. concrete cylinders were madefor each of the three high-strength concrete mixes and for thenormal-strength concrete deck mix. For each concrete mix, aset of three cylinders was tested for concrete compressivestrength and modulus of elasticity at each of the followingages—1, 3, 7, 14, 28, 56, 90, 128, and 256 days. Shrinkagemeasurements were performed using three 4 in. by 4 in. by24 in. specimens per concrete mix design. A total of 12 spec-imens were required for testing three high-strength mixes forthe girder mix and one normal-strength mix for the deck. Atotal of 48 specimens were tested.
Four 4 in. by 4 in. by 24 in. specimens were used to obtainthe creep measurements for each of the three girder mixes.Three specimens were loaded at the age of 1 day, and onespecimen was loaded at 56 days. Twelve specimens wererequired for the three high-strength concrete mixes producedfor each state. A total of 48 creep tests were performed.
On-Site Materials Testing
In addition to the laboratory specimens, similar specimenswere made and monitored in the field. They were subjected tothe same curing and environmental conditions as the bridgegirders. The on-site testing program consisted of the follow-ing. Eighteen 4 in. by 8 in. cylinders were produced at each ofthe four plants. Sets of three cylinders were tested for concretecompressive strength and modulus of elasticity at the agesof 1, 3, 7, 14, 28, and 56 days. A set of three 4 in. by 4 in. by
CHAPTER 3
RESEARCH RESULTS

15
Mix designation NE09G NE10G NE12G NE04D
Size (in.)/Type 0.75,
ASTM Grade 5 0.5,
ASTM Grade 5 0.375,
ASTM Grade 5 1.5,
ASTM Grade 5 Crushed limestone
Quantity (pcy) 1530 1860 1913 883
Size/Type Nebraska 47B None Nebraska 47B Nebraska 47B Sand and gravel
Quantity (pcy) 765 None 933 2039
Size/Type ASTM C33 ASTM C33 None None Sand
Quantity (pcy) 765 990 None None
Potable water Quantity (pcy) 250 240 254 263
Type III I III I Cement type
Quantity (pcy) 705 750 680 658 Silica fume Quantity (pcy) None 50 None None
Type None Class C Class C None Fly ash
Quantity (pcy) None 200 320 None Type Prokrete N Prokrete N WRDA 19 Prokrete N
High-range water reducer Quantity (oz/100
lb of binder) 30 30 34.2 5-14
Type Conchem SP-L Type A None Conchem SP-L Water-reducer Quantity (oz/100
lb of binder 10-20 None4 3-5
Type None None Daratar 17 None Retarder Quantity (oz/100
lb of binder) None None 4 None
Air content Amount (%) 5-7 5-7 5-7 6
Mix designation NH10G NH11G NH12G NH04D
Size (in.)/Type 0.75,
ASTM Grade 5 0.75,
ASTM Grade 5 0.75,
ASTM Grade 5 1.0,
ASTM Grade 5 Crushed river gravel
Quantity (pcy) 1850 1850 1850 1805
Sand Quantity (pcy) 940 925 950 1205
Potable water Quantity (pcy) 250 250 242 250
Type II II II II Cement
Quantity (pcy) 800 800 800 658 Silica fume Quantity (pcy) 56 75 100 None
Type None None None Class F Fly ash
Quantity (pcy) None None None 132 Type Adva Flow Adva Flow Adva Flow None High-range water
reducer Quantity (oz/cy) 51.4 53 63 None Type Mira Mira Mira Daracem 100
Water-reducer Quantity (oz/cy) 51.4 53 63 118
Type Darex II Darex II Darex II Darex II Air entraining admixture Quantity (oz/cy) 3 3 4 10
Type DCI-S DCI-S DCI-S None Corrosion inhibitor Quantity (oz/cy) 33 33 33 None
TABLE 3 Mix properties for Nebraska girders and deck
TABLE 4 Mix properties for New Hampshire girders and deck
24 in. shrinkage specimens were produced from the same mixdesign used for the pretensioned bridge girders; measure-ments were taken for 3 months. The results from the labora-tory tests were compared with those obtained from varioussites, to determine the effects of the various curing and envi-ronmental conditions.
Mixing and Sampling Procedures
Concrete mixing in the laboratory was done using 5.5-cfbatches in a 9-cf capacity rotary drum. ASTM C192 (31),“Standard Practice for Making and Curing Concrete TestSpecimens in the Laboratory” was followed for making the

16
Mix designation
TX08G TX09G TX10G TX04D
Size (in.)/Type 0.75,
ASTM Grade 5 0.75,
ASTM Grade 5 0.75,
ASTM Grade 5 None Crushed
limestone Quantity (pcy) 2029 2011 1975 None
Size/Type None None None 1.5, River gravel Gravel
Quantity (pcy) None None None 1811
Size/Type Natural river sand Natural river sand Natural river sand Natural river sand Sand
Quantity (pcy) 1237 1340 1237 1192
Potable water
Quantity (pcy) 206 192 197 244
Type III III III I Cement
Quantity (pcy) 611 564 705 611 Silica fume Quantity (pcy) None None None None
Type None None None Class C Fly ash
Quantity (pcy) 152 Type Rheobuild 1000 Rheobuild 1000 Rheobuild 1000 None High-range
water reducer
Quantity (oz/100 lb of binder)
27 21 29 None
Type Pozzolith 300R Pozzolith 300R Pozzolith 300R None Water-reducer Quantity (oz/100
lb of binder 3.5 3.0 3.5 None
Retarder Quantity (oz/100
lb of binder) 6
Air content Amount (%) 2 2 2 2
Mix designation WA10G WA11G WA12G WA04D
Size/Type 0.75,
ASTM Grade 5 0.75,
ASTM Grade 5 0.75
ASTM Grade 5 1.0,
ASTM Grade 5 Gravel Quantity (pcy) 2010 1877 1959 1810
Size/Type Natural river
sand Natural river
sand Natural river
sand Natural river
sand Sand Quantity (pcy) 1235 1383 1204 1046
Potable water Quantity (pcy) 219 217 213 263
Type III III III I-II Cement
Quantity (pcy) 705 658 752 660 Silica fume Quantity (pcy) None None 50 None
Type None None None Class F Fly ash
Quantity (pcy) None None None 75 Type Advacast Advacast Advacast None
High-range water reducer Quantity (oz/100
lb of binder) 7 7 7 None
Type WRDA-64 WRDA-64 WRDA-64 Pozz-80 Water-reducer Quantity (oz/100
lb of binder) 4 4 4 6
Air content Amount (%) 1.5 1.5 1.5 2
TABLE 5 Mix properties for Texas girders and deck
TABLE 6 Mix properties for Washington girders and deck
test specimens. The concrete cylinders were made accordingto ASTM C192 and cured in the laboratory curing room at anambient temperature of about 73°F for 24 hours. The cylin-ders were then de-molded and returned to the curing roomuntil the test age. Creep and shrinkage specimens were cast
for each of the three girder concrete mixes. After placementand consolidation, the surface was screeded and trowel fin-ished and then covered with burlap. The forms were removedafter 24 hours. The specimens were then left to cure at a roomambient temperature of 73°F.
MODULUS OF ELASTICITY
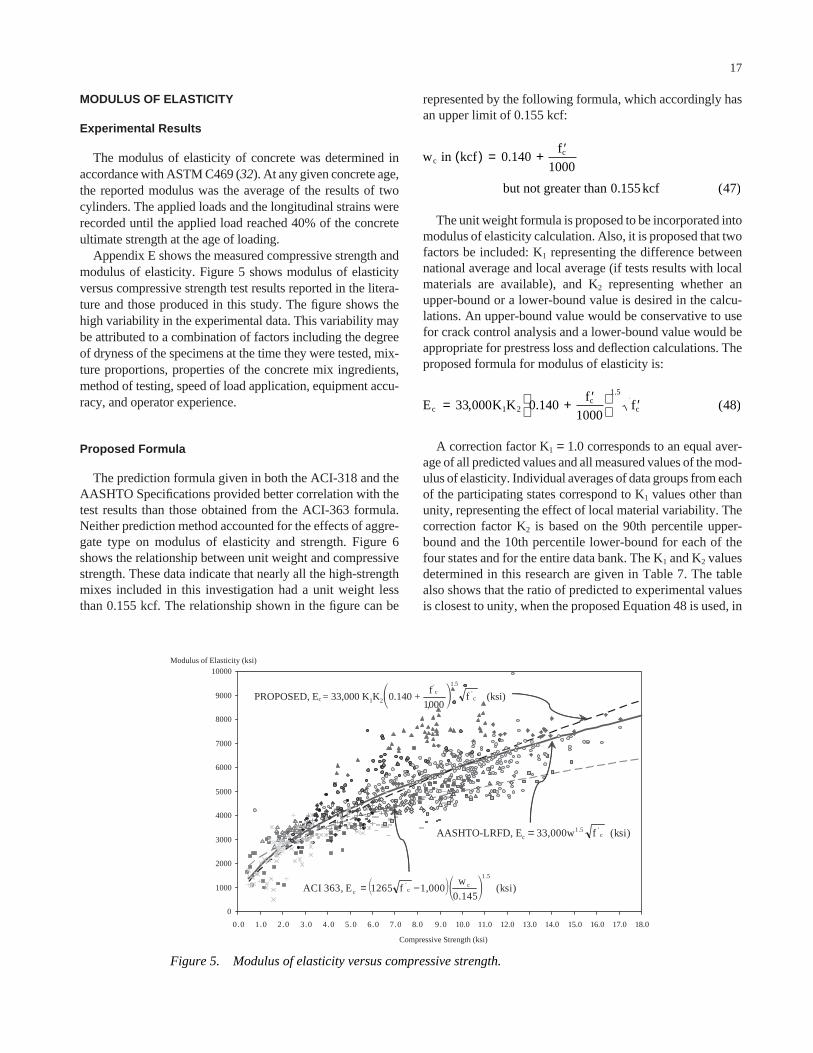
Experimental Results
The modulus of elasticity of concrete was determined inaccordance with ASTM C469 (32). At any given concrete age,the reported modulus was the average of the results of twocylinders. The applied loads and the longitudinal strains wererecorded until the applied load reached 40% of the concreteultimate strength at the age of loading.
Appendix E shows the measured compressive strength andmodulus of elasticity. Figure 5 shows modulus of elasticityversus compressive strength test results reported in the litera-ture and those produced in this study. The figure shows thehigh variability in the experimental data. This variability maybe attributed to a combination of factors including the degreeof dryness of the specimens at the time they were tested, mix-ture proportions, properties of the concrete mix ingredients,method of testing, speed of load application, equipment accu-racy, and operator experience.
Proposed Formula
The prediction formula given in both the ACI-318 and theAASHTO Specifications provided better correlation with thetest results than those obtained from the ACI-363 formula.Neither prediction method accounted for the effects of aggre-gate type on modulus of elasticity and strength. Figure 6shows the relationship between unit weight and compressivestrength. These data indicate that nearly all the high-strengthmixes included in this investigation had a unit weight lessthan 0.155 kcf. The relationship shown in the figure can be
17
represented by the following formula, which accordingly hasan upper limit of 0.155 kcf:
The unit weight formula is proposed to be incorporated intomodulus of elasticity calculation. Also, it is proposed that twofactors be included: K1 representing the difference betweennational average and local average (if tests results with localmaterials are available), and K2 representing whether anupper-bound or a lower-bound value is desired in the calcu-lations. An upper-bound value would be conservative to usefor crack control analysis and a lower-bound value would beappropriate for prestress loss and deflection calculations. Theproposed formula for modulus of elasticity is:
A correction factor K1 = 1.0 corresponds to an equal aver-age of all predicted values and all measured values of the mod-ulus of elasticity. Individual averages of data groups from eachof the participating states correspond to K1 values other thanunity, representing the effect of local material variability. Thecorrection factor K2 is based on the 90th percentile upper-bound and the 10th percentile lower-bound for each of thefour states and for the entire data bank. The K1 and K2 valuesdetermined in this research are given in Table 7. The tablealso shows that the ratio of predicted to experimental valuesis closest to unity, when the proposed Equation 48 is used, in
E K Kf
1000fc 1
cc= + ′
′33 000 0 140 482
1 5
, . ( ).
w in kcff
1000
but not greater than . kcf
cc( ) = + ′
0 140
0 155 47
.
( )
0
1000
2000
3000
4000
5000
6000
7000
8000
9000
10000
0.0 1.0 2.0 3.0 4.0 5.0 6.0 7.0 8.0 9.0 10.0 11.0 12.0 13.0 14.0 15.0 16.0 17.0 18.0
Compressive Strength (ksi)
Modulus of Elasticity (ksi)
(ksi)f,1000
f0.140 +PROPOSED, Ec = 33,000 K1K2 c
'
1.5c
'
�
�
(ksi)fw33,000AASHTO-LRFD, Ec c'1.5=
(ksi)0.145
w1,000�f1265E363,ACI
1.5
cc
'c �
� −= �
Figure 5. Modulus of elasticity versus compressive strength.

comparison to the AASHTO-LRFD formula. Consider aNebraska mix with a specified compressive strength of 8.0 ksi.According to Table 7, the value of K1 = 0.975, the upper-bound K2 = 1.211 and the lower-bound K2 = 0.788. The pre-dicted average, upper-bound, and lower-bound, values of themodulus of elasticity for this concrete strength may be esti-mated as follows:
Upper-bound E
ksi
c = ( )( )
+
=
33 000 0 975 1 211
0 1408
10008 6 275
1 5
, . .
. ,.
Average E
ksi
c = ( ) +( )=
33 000 0 975 0 140 81000
8
5 182
1 5
, . .
,
.
18
Figure 7 shows the measured values versus those predictedusing the proposed method. It demonstrates that the proposedmethod produces an accurate prediction of the average,lower-bound, and upper-bound, values of the modulus of elas-ticity of concrete. Appendix E contains additional compar-isons between the proposed prediction method, the AASHTO-LRFD method, and other methods. Figure 8 illustrates acomparison between test results for a set of high-strength con-crete mixes used in Washington State, with those predicted bythe proposed formula and the AASHTO-LRFD formula. Thesignificant difference between the two prediction methodsillustrates the proposed formula’s ability to more accuratelyaccount for local materials and for high-strength concrete.
EXPERIMENTAL SHRINKAGE RESULTS
Shrinkage specimens were cast at the same time and curedunder the same conditions as the creep specimens. Readingswere taken in parallel with the creep tests for each mix to com-pare the time-dependent strain of loaded and unloaded speci-mens. The creep and shrinkage specimens in this project hada V/S ratio of 1.0. The specimens were at an ambient relativehumidity of 35% to 40%. Demountable mechanical (DEMEC)gages were used at a spacing of about 8 in. to measure the sur-face strains in the longitudinal direction. Five DEMEC pointswere used on each of two surfaces of each specimen. TheDEMEC points were spaced at 4 in. This allowed for 3-to-8-in. gage lengths per surface, or 6 readings per specimen.Shrinkage readings were taken daily for the first week, weeklyfor the first month, and monthly for about 1 year. Figures 9through 12 present the measured shrinkage strains of the
Lower-bound E
ksi
c = ( )( )
+
=
33 000 0 975 0 788
0 1408
10008 4 083
1 5
, . .
. ,.
w = 0.001f'c + 137.28
120
125
130
135
140
145
150
155
160
4000 6000 8000 10000 12000 14000 16000
Compressive Strength (psi)
Uni
t Wei
ght (
pcf)
Figure 6. Relationship between unit weight andcompressive strength of concrete.
Proposed K1 and K2Ratio of Predicted to
Measured
K1
90th percentile K2
10th percentile K2
Proposed AASHTO-LRFD
Nebraska NE09G, NE10G, NE12G
0.975 1.211 0.788 1.000 1.037
New Hampshire NH10G, NH11G, NH12G
0.911 1.123 0.878 1.000 1.122
Texas TX08G, TX09G, TX10G
1.321 1.115 0.886 1.000 0.768
Washington WA10G, WA11G, WA12G
1.154 1.182 0.817 1.000 0.889
All data 1.000 1.224 0.777 1.020 1.037
TABLE 7 K-values and predicted-to-measured ratios of modulus ofelasticity of concrete
0
1000
2000
3000
4000
5000
6000
7000
8000
9000
10000
0 1000 2000 3000 4000 5000 6000 7000 8000 9000 10000
Measured modulus of elasticity (ksi)
Predicted modulus of elasticity (ksi)
Average
Upper Bound
Lower Bound
AASHTO-LRFD
0
1000
2000
3000
4000
5000
6000
7000
8000
9000
10000
0 1000 2000 3000 4000 5000 6000 7000 8000 9000 10000
Measured modulus of elasticity (ksi)
Predicted modulus of elasticity (ksi)
Average
Upper Bound
Lower Bound
AASHTO-LRFD
Figure 7. Predicted versus measured values of modulus of elasticity, nationwideexperiments with wide strength range.
Figure 8. Predicted versus measured values of modulus of elasticity, Washington Statehigh-strength concrete mixes.

specimens produced in the laboratory. Appendix F containsdata for all test specimens. The ratio of estimated shrinkagestrains to measured values, with the AASHTO-LRFD and theACI-209 formulas, are also shown in Table 8. It can be seenthat the predicted shrinkage strains are generally much higherthan the measured quantities confirming the need for improvedshrinkage prediction formulas.
EXPERIMENTAL CREEP RESULTS
Creep tests were performed at the laboratory on the 12 high-strength concrete mixtures in accordance with the ASTM
20
0
100
200
300
400
500
600
700
800
900
0 50 100 150 200 250 300
Time (days)
Shrinkage Strain (microstrains)
S1
S2
S3
ACI 209
AASHTO
Proposed
0
100
200
300
400
500
600
700
800
0 50 100 150 200 250 300 350 400
Time (days)
Shrinkage Strain(microstrains)
S1
S2
S3
ACI 209
AASHTO
Proposed
Figure 9. Shrinkage for Nebraska mix NE09G-S.
Figure 10. Shrinkage for New Hampshire mix NH10G-S.
Standard C 512 (33). Similar to the shrinkage strain measure-ments, DEMEC mechanical strain gages were used. A totalof four specimens were cast for each mix. Three of thesespecimens were loaded at the age of 1 day, and the fourth wasloaded at the age of 56 days. The specimens were then loadedat an intensity of not more than 40% of the compressivestrength at the age of loading.
The initial strain readings were taken immediately beforeand after loading. Creep measurements were then taken dailyfor the first week, weekly for the first month and monthly forabout 1 year. The creep coefficients were calculated from themeasured total strains, elastic strains, and shrinkage strains.Figures 13 through 16 show the test results for the four mixes
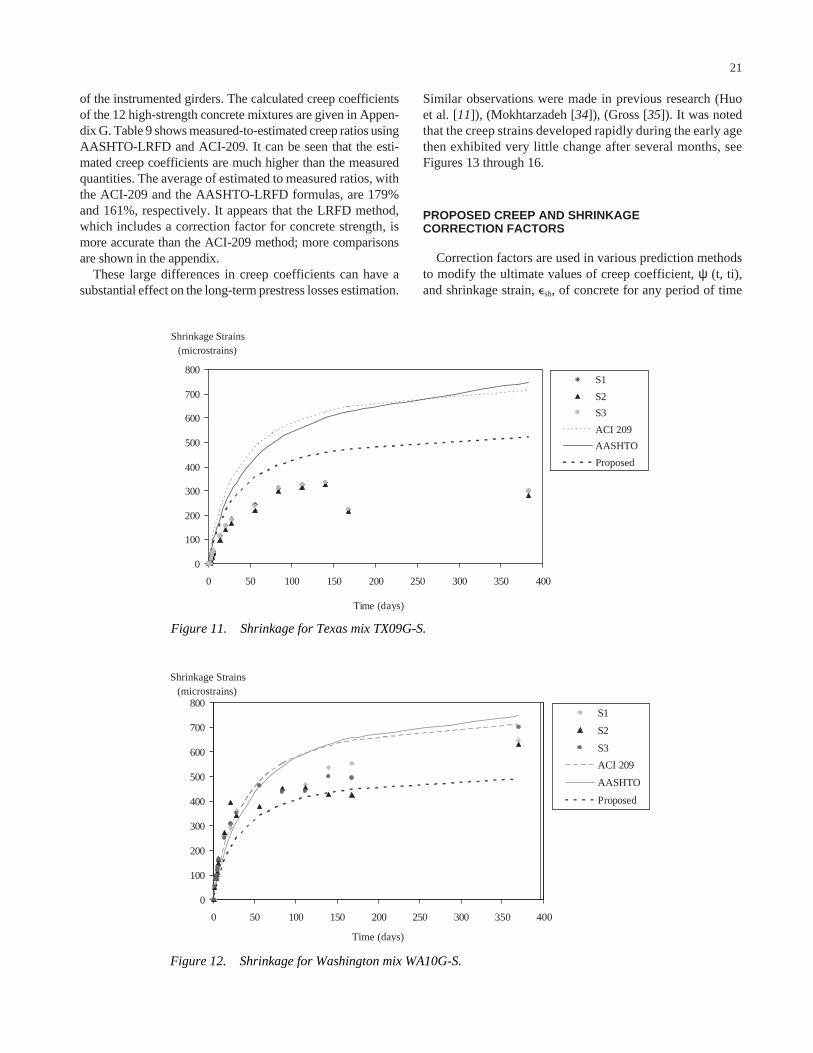
of the instrumented girders. The calculated creep coefficientsof the 12 high-strength concrete mixtures are given in Appen-dix G. Table 9 shows measured-to-estimated creep ratios usingAASHTO-LRFD and ACI-209. It can be seen that the esti-mated creep coefficients are much higher than the measuredquantities. The average of estimated to measured ratios, withthe ACI-209 and the AASHTO-LRFD formulas, are 179%and 161%, respectively. It appears that the LRFD method,which includes a correction factor for concrete strength, ismore accurate than the ACI-209 method; more comparisonsare shown in the appendix.
These large differences in creep coefficients can have asubstantial effect on the long-term prestress losses estimation.
21
Similar observations were made in previous research (Huo et al. [11]), (Mokhtarzadeh [34]), (Gross [35]). It was notedthat the creep strains developed rapidly during the early agethen exhibited very little change after several months, seeFigures 13 through 16.
PROPOSED CREEP AND SHRINKAGECORRECTION FACTORS
Correction factors are used in various prediction methodsto modify the ultimate values of creep coefficient, ψ (t, ti),and shrinkage strain, �sh, of concrete for any period of time
0
100
200
300
400
500
600
700
800
0 50 100 150 200 250 300 350 400
Time (days)
Shrinkage Strains (microstrains)
S1
S2
S3
ACI 209
AASHTO
Proposed
0
100
200
300
400
500
600
700
800
0 50 100 150 200 250 300 350 400
Time (days)
Shrinkage Strains(microstrains)
S1
S2
S3
ACI 209
AASHTO
Proposed
Figure 11. Shrinkage for Texas mix TX09G-S.
Figure 12. Shrinkage for Washington mix WA10G-S.

22
Ratio of predicted-to-measured shrinkage strainMix
ACI-209 AASHTO-LRFD Nebraska, NE09G, NE10G, NE12G
1.75 1.91
New Hampshire NH10G, NH11G, NH12G
1.13 1.27
Texas TX08G, TX09G, TX10G
2.26 2.60
Washington WA10G, WA11G, WA12G
1.05 1.18
Combined data 1.55 1.74
TABLE 8 Ratios of predicted-to-measured shrinkage strain for laboratory-stored specimens
0.00
0.50
1.00
1.50
2.00
2.50
3.00
0 20 40 60 80 100 120 140 160 180 200 220 240 260 280 300
Time (days)
Creep Coefficient
C1
C2
C3
ACI 209
AASHTO
Proposed
0.00
0.50
1.00
1.50
2.00
2.50
0 50 100 150 200 250 300 350 400
Time (days)
Creep Coefficient
C1
C2
C3
ACI 209
AASHTO
Proposed
Figure 13. Creep for Nebraska mix NE09G-01 loaded at 1 day.
Figure 14. Creep for New Hampshire mix NH10G-01 loaded at 1 day.
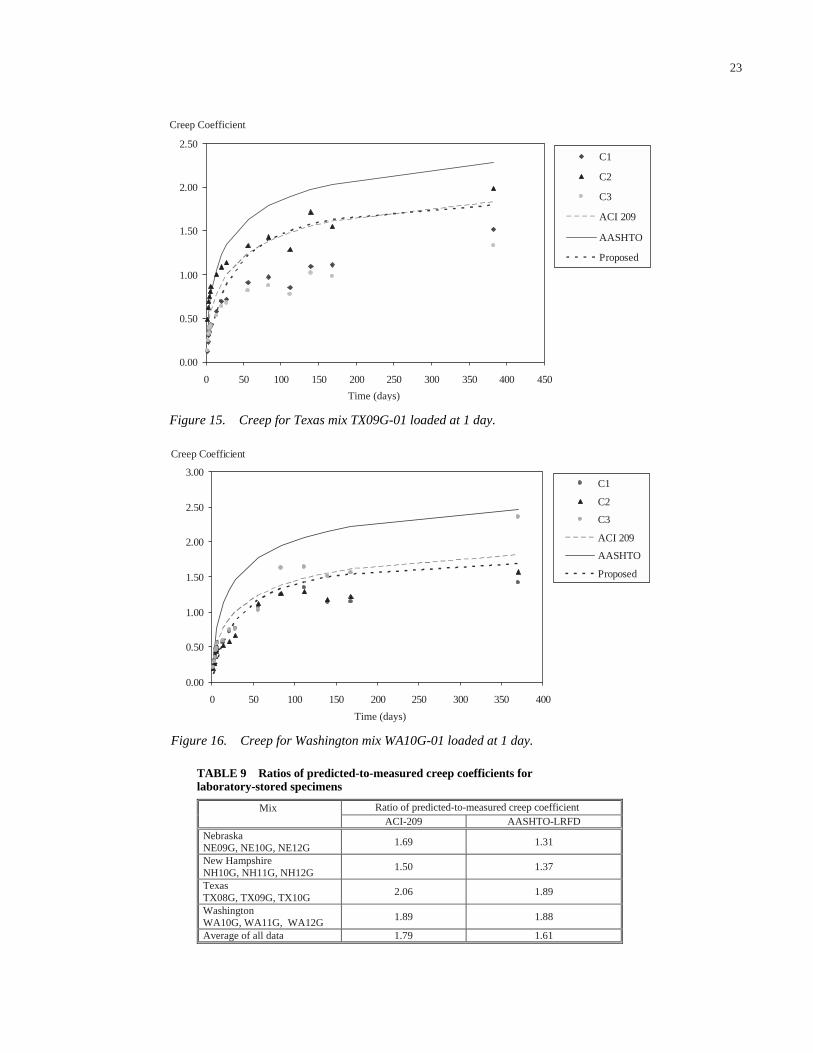
23
0.00
0.50
1.00
1.50
2.00
2.50
0 50 100 150 200 250 300 350 400 450
Time (days)
Creep Coefficient
C1
C2
C3
ACI 209
AASHTO
Proposed
0.00
0.50
1.00
1.50
2.00
2.50
3.00
0 50 100 150 200 250 300 350 400
Time (days)
Creep Coefficient
C1
C2
C3
ACI 209
AASHTO
Proposed
Ratio of predicted-to-measured creep coefficientMixACI-209 AASHTO-LRFD
Nebraska NE09G, NE10G, NE12G
1.69 1.31
New Hampshire NH10G, NH11G, NH12G
1.50 1.37
Texas TX08G, TX09G, TX10G
2.06 1.89
Washington WA10G, WA11G, WA12G
1.89 1.88
Average of all data 1.79 1.61
Figure 15. Creep for Texas mix TX09G-01 loaded at 1 day.
Figure 16. Creep for Washington mix WA10G-01 loaded at 1 day.
TABLE 9 Ratios of predicted-to-measured creep coefficients forlaboratory-stored specimens

and for conditions other than the so-called “standard condi-tions.” These standard conditions, in some methods, referredto laboratory specimen sizes and relative humidity conditions,which differed considerably from average bridge membersizes and environmental conditions. For example, for the ACI-209 method, a relative humidity of 40% is considered a stan-dard condition, while most of the U.S. bridges are subject toan approximate average humidity of 70%. Another exampleis the V/S ratio of about 1.5 in. being considered representa-tive of a standard member size in the LRFD creep and shrink-age prediction formulas, while most bridge members have anaverage V/S ratio of about 3.5 in. These uncommon conditionsaccount for some of the apparently high creep coefficient andshrinkage strain given in the AASHTO-LRFD and ACI-209formulas.
In the following presentation, factors are introduced toaccount as much as possible for the average conditions com-monly encountered in practices (i.e., 70% annual averageambient relative humidity, V/S ratio of 3.5 in., loading age of1 day for precast pretensioned members and 7 days for cast-in-place deck slabs, and accelerated curing for 1 day or moistcuring for 7 days.)
Relative Humidity Correction Factor
Figure 17 shows the correction factor for a range of relativehumidity when using the AASHTO-LRFD, the PCI-BDM,and the ACI-209 formulas to estimate creep coefficient andshrinkage strain. This figure shows essentially two trends
24
when normalized to a default value of 1.0 at 70% relativehumidity. Figure 18, adopted from AASHTO-LRFD (Figure5.4.2.3.3-1), shows the range of the annual average ambientrelative humidity for various parts of the United States andCanada. For the range of 30% to 80% ambient relative humid-ity encountered in the United States, one formula may beapplied to shrinkage strain and another may be used for creepcoefficient:
where: H = relative humidity, in percent.
Volume-to-Surface Ratio (Size) Correction Factor
Relatively thick members do not dry as easily as thin mem-bers when they are subjected to the ambient air. This effectis accounted for by using the V/S ratio factor. Member sizeaffects short-term creep and shrinkage much more than it doesultimate value. Because the ultimate values are of primaryimportance for most bridges (except segmentally constructedbox girder bridges), the V/S ratio factor formula can be greatlysimplified when ultimate prestress loss and final concrete bot-tom fiber stress are the primary design values. The V/S ratio ofthe member may be computed as the ratio of cross-sectionalarea to the perimeter exposed to the environment.
Creep: k H (50)hc = −1 56 0 008. .
Shrinkage: k H (49)hs = −2 00 0 0143. .
0.00
0.20
0.40
0.60
0.80
1.00
1.20
1.40
1.60
1.80
30 40 50 60 70 80 90
Relative Humidity(%)
Humidity Correction Factor
ShrinkageACI : 1.43kh =1.43(1.4-0.01H) for H<80
ACI : 1.43kh =1.43(3.00-0.03H) for H>80
AASHTO : Table 5.4.2.3.3-1-Factor kh
PCI : kh=2.00-0.0143H for H<80
PCI : kh=4.286-0.0429H for H>80
Creep
ACI : 1.25kh=1.25*(1.27-0.0067H)
AASHTO : kh=1.58-H/120
PCI : kh=1.586-0.0084H
Range encountered in the U.S.
Figure 17. Humidity correction factor for the various prediction methods.
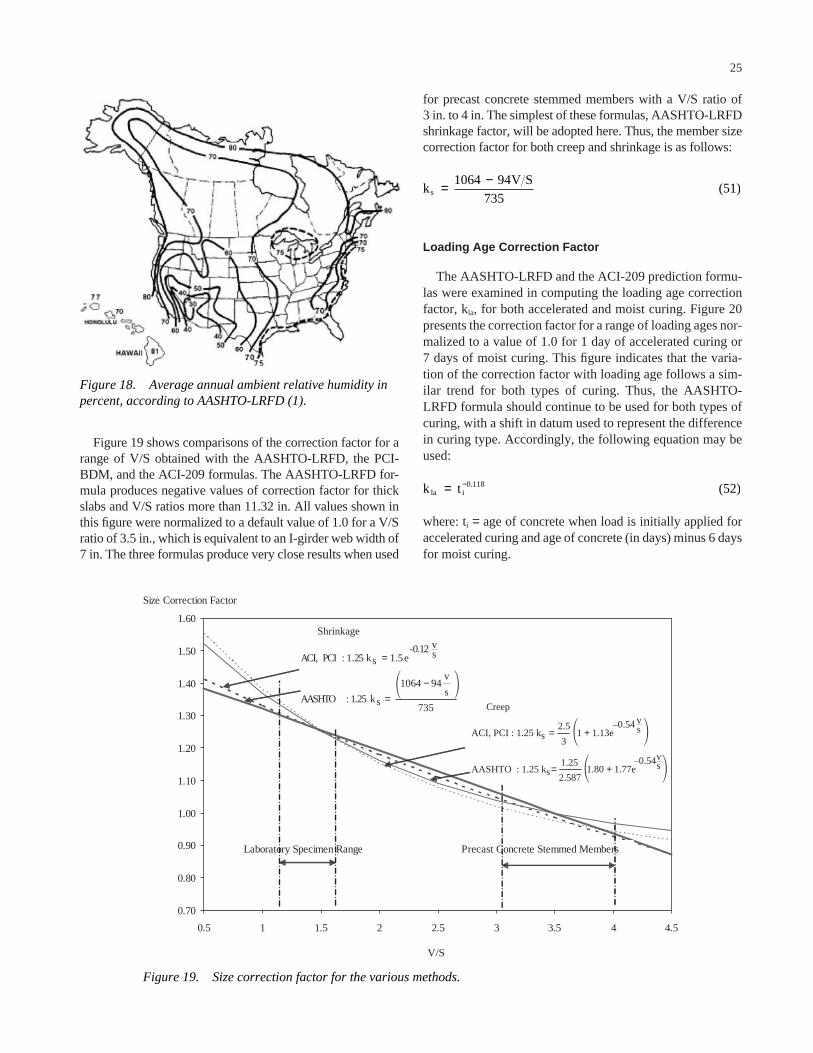
Figure 19 shows comparisons of the correction factor for arange of V/S obtained with the AASHTO-LRFD, the PCI-BDM, and the ACI-209 formulas. The AASHTO-LRFD for-mula produces negative values of correction factor for thickslabs and V/S ratios more than 11.32 in. All values shown inthis figure were normalized to a default value of 1.0 for a V/Sratio of 3.5 in., which is equivalent to an I-girder web width of7 in. The three formulas produce very close results when used
25
for precast concrete stemmed members with a V/S ratio of 3 in. to 4 in. The simplest of these formulas, AASHTO-LRFDshrinkage factor, will be adopted here. Thus, the member sizecorrection factor for both creep and shrinkage is as follows:
Loading Age Correction Factor
The AASHTO-LRFD and the ACI-209 prediction formu-las were examined in computing the loading age correctionfactor, kla, for both accelerated and moist curing. Figure 20presents the correction factor for a range of loading ages nor-malized to a value of 1.0 for 1 day of accelerated curing or 7 days of moist curing. This figure indicates that the varia-tion of the correction factor with loading age follows a sim-ilar trend for both types of curing. Thus, the AASHTO-LRFD formula should continue to be used for both types ofcuring, with a shift in datum used to represent the differencein curing type. Accordingly, the following equation may beused:
where: ti = age of concrete when load is initially applied foraccelerated curing and age of concrete (in days) minus 6 daysfor moist curing.
k t (52)la i0.118= −
kV S
(51)s = −1064 94
735
0.70
0.80
0.90
1.00
1.10
1.20
1.30
1.40
1.50
1.60
0.5 1 1.5 2 2.5 3 3.5 4 4.5
Size Correction Factor
Laboratory Specimen Range Precast Concrete Stemmed Members
735
s
v941064
sk1.25:AASHTO
sv0.12-
e5.1sk25.1:PCIACI,
Shrinkage
� � − =
=
� �
� �
=
=
sv–0.54
1.80 + 1.77e2.587
1.25AASHTO : 1.25 ks
sv–0.54
1 + 1.13e3
2.5ACI, PCI : 1.25 ks
Creep
V/S
Figure 18. Average annual ambient relative humidity inpercent, according to AASHTO-LRFD (1).
Figure 19. Size correction factor for the various methods.
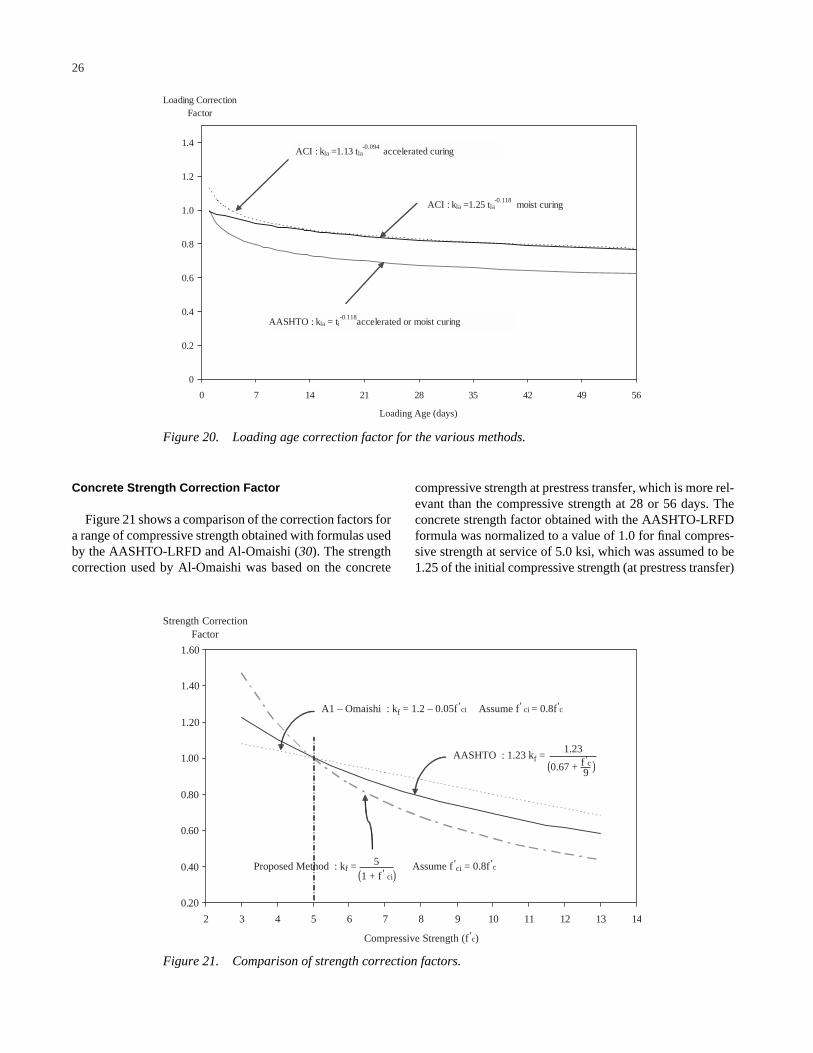
26
0
0.2
0.4
0.6
0.8
1.0
1.2
1.4
0 7 14 21 28 35 42 49 56
Loading Age (days)
Loading Correction Factor
ACI : kla =1.13 tla-0.094
accelerated curing
AASHTO : kla = ti-0.118
accelerated or moist curing
ACI : kla =1.25 tla-0.118
moist curing
0.20
0.40
0.60
0.80
1.00
1.20
1.40
1.60
A1 – Omaishi : kf = 1.2 – 0.05f 'ci Assume f' ci = 0.8f'c
2 3 4 5 6 7 8 9 10 11 12 13 14
Compressive Strength (f 'c)
Strength CorrectionFactor
AASHTO : 1.23 kf =
Proposed Method : kf = Assume f 'ci = 0.8f 'c
(0.67 + )f 'c9
1.23
(1 + f ' ci)5
Figure 20. Loading age correction factor for the various methods.
Figure 21. Comparison of strength correction factors.
Concrete Strength Correction Factor
Figure 21 shows a comparison of the correction factors fora range of compressive strength obtained with formulas usedby the AASHTO-LRFD and Al-Omaishi (30). The strengthcorrection used by Al-Omaishi was based on the concrete
compressive strength at prestress transfer, which is more rel-evant than the compressive strength at 28 or 56 days. Theconcrete strength factor obtained with the AASHTO-LRFDformula was normalized to a value of 1.0 for final compres-sive strength at service of 5.0 ksi, which was assumed to be1.25 of the initial compressive strength (at prestress transfer)
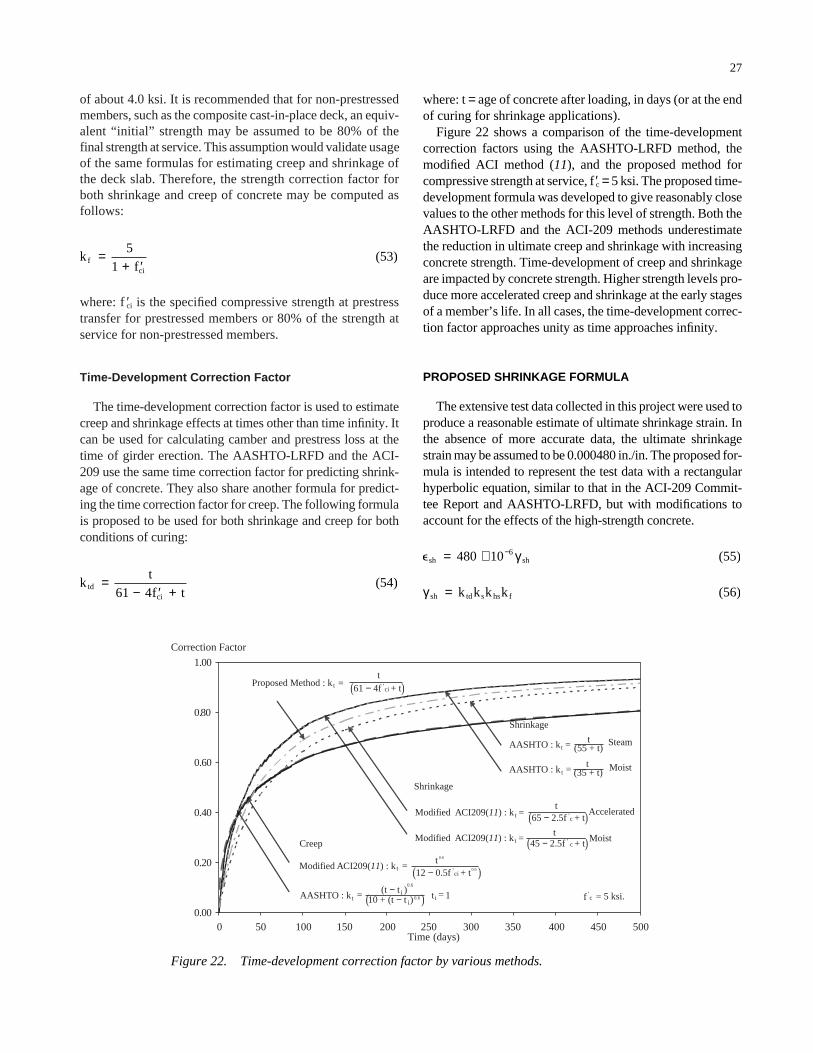
of about 4.0 ksi. It is recommended that for non-prestressedmembers, such as the composite cast-in-place deck, an equiv-alent “initial” strength may be assumed to be 80% of thefinal strength at service. This assumption would validate usageof the same formulas for estimating creep and shrinkage ofthe deck slab. Therefore, the strength correction factor forboth shrinkage and creep of concrete may be computed asfollows:
where: f ′ci is the specified compressive strength at prestresstransfer for prestressed members or 80% of the strength atservice for non-prestressed members.
Time-Development Correction Factor
The time-development correction factor is used to estimatecreep and shrinkage effects at times other than time infinity. Itcan be used for calculating camber and prestress loss at thetime of girder erection. The AASHTO-LRFD and the ACI-209 use the same time correction factor for predicting shrink-age of concrete. They also share another formula for predict-ing the time correction factor for creep. The following formulais proposed to be used for both shrinkage and creep for bothconditions of curing:
kt
f t(54)td
ci
=− ′ +61 4
kf
(53)fci
=+ ′5
1
27
where: t = age of concrete after loading, in days (or at the endof curing for shrinkage applications).
Figure 22 shows a comparison of the time-developmentcorrection factors using the AASHTO-LRFD method, themodified ACI method (11), and the proposed method forcompressive strength at service, f ′c = 5 ksi. The proposed time-development formula was developed to give reasonably closevalues to the other methods for this level of strength. Both theAASHTO-LRFD and the ACI-209 methods underestimatethe reduction in ultimate creep and shrinkage with increasingconcrete strength. Time-development of creep and shrinkageare impacted by concrete strength. Higher strength levels pro-duce more accelerated creep and shrinkage at the early stagesof a member’s life. In all cases, the time-development correc-tion factor approaches unity as time approaches infinity.
PROPOSED SHRINKAGE FORMULA
The extensive test data collected in this project were used toproduce a reasonable estimate of ultimate shrinkage strain. Inthe absence of more accurate data, the ultimate shrinkagestrain may be assumed to be 0.000480 in./in. The proposed for-mula is intended to represent the test data with a rectangularhyperbolic equation, similar to that in the ACI-209 Commit-tee Report and AASHTO-LRFD, but with modifications toaccount for the effects of the high-strength concrete.
γsh td s hs fk k k k (56)=
�sh sh (55)= ∗ −480 10 6 γ
0.00
0.20
0.40
0.60
0.80
1.00
0 50 100 150 200 250 300 350 400 450 500Time (days)
Correction Factor
Proposed Method : kt = t
(61 − 4f 'ci + t)
Creep
Modified ACI209(11) : kt = t 0.6
(12 − 0.5f 'ci + t0.6 )
AASHTO : kt = (t − t i )0.6
(10 + (t − t i) 0.6 ) t i = 1
Shrinkage
Modified ACI209(11) : kt =t
(65 − 2.5f 'c + t)Accelerated
Modified ACI209(11) : kt =t
(45 − 2.5f ' c + t)Moist
Shrinkage
AASHTO : kt = t(55 + t)
Steam
AASHTO : k t = t(35 + t) Moist
f 'c = 5 ksi.
Figure 22. Time-development correction factor by various methods.

ktd, ks, khs, and kf were defined in Equations 54, 51, 49, and53, respectively, as follows:
ktd = time-development factor =
khs = humidity factor for shrinkage = 2.00 − 0.0143H
ks = size factor =
kf = concrete strength factor =
Other factors such as slump, cement content, percentageof fines, and air content that are included in the ACI-209Committee Report have not been included here because oftheir minor effects. Similar to treatment of the modulus ofelasticity, factors K1 and K2 may be used to represent aver-age, and upper- and lower-bound values of shrinkage forlocal materials. Thus, the following equation results:
Values for K1 and K2 were not developed in this project. Thedata given in Appendix F may be used in future research as abasis for developing such values. Appendix F also includes acomparison of the experimental data with predictions of theACI-209, the AASHTO-LRFD method, and the proposedmethod. A summary of this comparison is shown in Table 10.In general, the proposed method produced results in closeragreement with measured data than those obtained with theother methods.
PROPOSED CREEP FORMULA
The proposed formula for estimating the creep coefficientwas developed in a similar manner to the shrinkage predictionformula. The standard conditions have been defined earlier asR.H. = 70%, V/S = 3.5 in., f ′ci = 4 ksi, loading age = 1 day foraccelerated curing and 7 days for moist curing, and loadingduration = infinity. The ultimate creep coefficient for thesestandard conditions equals 1.90, which is comparable to thatpredicted by the AASHTO-LRFD method.
�sh sh4 K K (57)= ∗ −80 10 61 2γ
5
1 + ′fci
1064 V S− 94
735
t
f tci61 4− ′ +
28
ktd, kla, ks, khs, and kf were defined in Equations 54, 52, 50,and 53, respectively, as follows:
Similar to treatment of the modulus of elasticity and shrink-age, factors K1 and K2 may be used to represent average,upper- and lower-bound values of the creep coefficient forlocal materials. Thus, the following equation results:
Appendix G contains a comparison of the experimentaldata with those predicted using the ACI-209, the AASHTO-LRFD, and the proposed creep prediction formulas; a sum-mary of this comparison is shown in Table 11. The proposedformula produced results closer to the measured data thanthose obtained with the other methods.
RELAXATION OF PRESTRESSING STRANDS
The most commonly used type of prestressing steel is thelow-relaxation strand. This type of strand undergoes an extraproduction step of controlled heating to about 660°F and thencooling while under tension, which reduces relaxation loss toabout 25 percent of that for the stress-relieved strand. For low-
ψ γt, t K Ki cr( ) = 1 90 621 2. ( )
k concrete strength factorf
fci
= =+ ′5
1
k size factorV S
s = = −1064 94
735
k humidity factor for creep Hhc = = −1 56 0 008 61. . ( )
k loading factor tla i= = −0 118 60. ( )
k time-development factort
f ttd
ci
= =− ′ +61 4
γcr
td la s hc f
product of the applicable correction factors
k k k k k
=
= ( )59
ψ γt, t i cr( ) = 1 90 58. ( )
Ratio of predicted-to-measured shrinkage strainMix
ACI-209 AASHTO-LRFD Proposed Nebraska NE09G, NE10G, NE12G
1.75 1.91 1.08
New Hampshire NH10G, NH11G, NH12G
1.13 1.27 0.80
Texas TX08G, TX09G, TX10G
2.26 2.60 1.57
Washington WA10G, WA11G, WA12G
1.05 1.18 0.74
Average of all data 1.55 1.74 1.05
TABLE 10 Ratios of predicted-to-measured shrinkage strain specimens
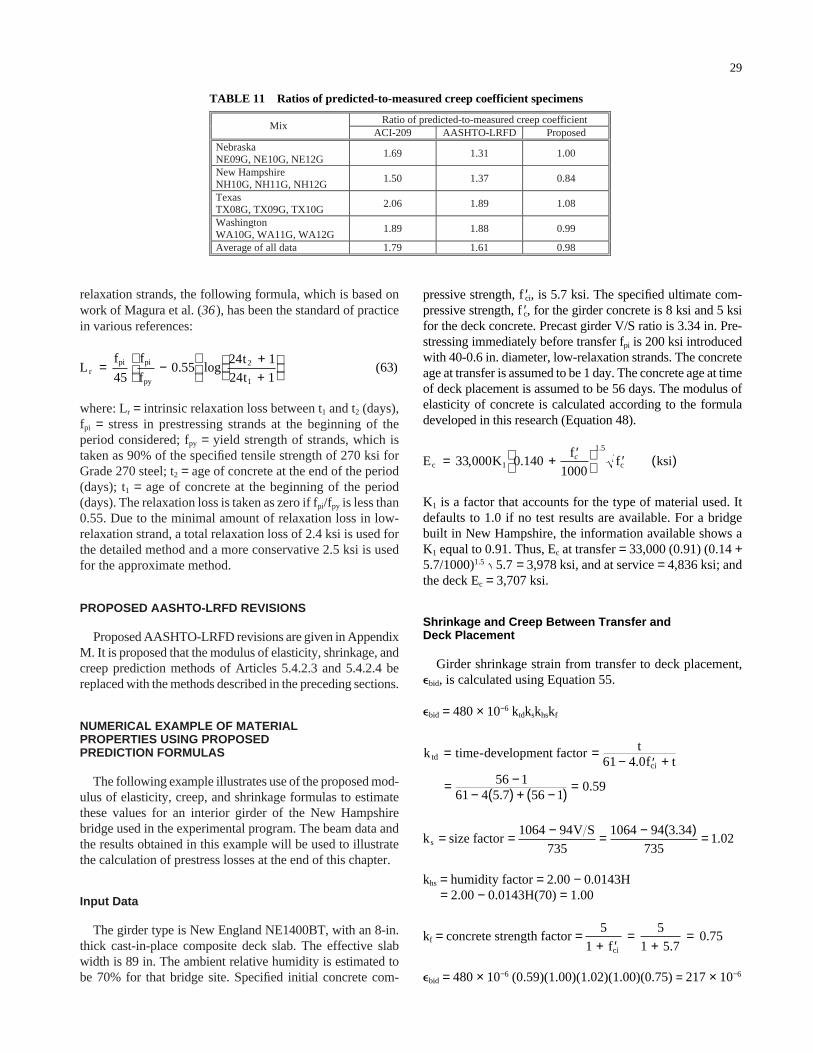
relaxation strands, the following formula, which is based onwork of Magura et al. (36), has been the standard of practicein various references:
where: Lr = intrinsic relaxation loss between t1 and t2 (days),fpi = stress in prestressing strands at the beginning of theperiod considered; fpy = yield strength of strands, which istaken as 90% of the specified tensile strength of 270 ksi forGrade 270 steel; t2 = age of concrete at the end of the period(days); t1 = age of concrete at the beginning of the period(days). The relaxation loss is taken as zero if fpi/fpy is less than0.55. Due to the minimal amount of relaxation loss in low-relaxation strand, a total relaxation loss of 2.4 ksi is used forthe detailed method and a more conservative 2.5 ksi is usedfor the approximate method.
PROPOSED AASHTO-LRFD REVISIONS
Proposed AASHTO-LRFD revisions are given in AppendixM. It is proposed that the modulus of elasticity, shrinkage, andcreep prediction methods of Articles 5.4.2.3 and 5.4.2.4 bereplaced with the methods described in the preceding sections.
NUMERICAL EXAMPLE OF MATERIALPROPERTIES USING PROPOSED PREDICTION FORMULAS
The following example illustrates use of the proposed mod-ulus of elasticity, creep, and shrinkage formulas to estimatethese values for an interior girder of the New Hampshirebridge used in the experimental program. The beam data andthe results obtained in this example will be used to illustratethe calculation of prestress losses at the end of this chapter.
Input Data
The girder type is New England NE1400BT, with an 8-in.thick cast-in-place composite deck slab. The effective slabwidth is 89 in. The ambient relative humidity is estimated tobe 70% for that bridge site. Specified initial concrete com-
Lf
45
f
f
t
tr
pi pi
py
= −
++
0 55
24 1
24 1632
1
. log ( )
29
pressive strength, f ′ci, is 5.7 ksi. The specified ultimate com-pressive strength, f ′c, for the girder concrete is 8 ksi and 5 ksifor the deck concrete. Precast girder V/S ratio is 3.34 in. Pre-stressing immediately before transfer fpi is 200 ksi introducedwith 40-0.6 in. diameter, low-relaxation strands. The concreteage at transfer is assumed to be 1 day. The concrete age at timeof deck placement is assumed to be 56 days. The modulus ofelasticity of concrete is calculated according to the formuladeveloped in this research (Equation 48).
K1 is a factor that accounts for the type of material used. Itdefaults to 1.0 if no test results are available. For a bridgebuilt in New Hampshire, the information available shows aK1 equal to 0.91. Thus, Ec at transfer = 33,000 (0.91) (0.14 +5.7/1000)1.5 = 3,978 ksi, and at service = 4,836 ksi; andthe deck Ec = 3,707 ksi.
Shrinkage and Creep Between Transfer andDeck Placement
Girder shrinkage strain from transfer to deck placement,�bid, is calculated using Equation 55.
�bid = 480 × 10−6 ktdkskhskf
khs = humidity factor = 2.00 − 0.0143H = 2.00 − 0.0143H(70) = 1.00
kf = concrete strength factor =
�bid = 480 × 10−6 (0.59)(1.00)(1.02)(1.00)(0.75) = 217 × 10−6
5
1
5
1 5 70 75
+ ′=
+=
fci ..
k size factor1064 V S 1064
s = = − = − ( )=94
735
94 3 34
7351 02
..
k time-development factor tf ttd
ci= =
− ′ +
= −− ( ) + −( ) =
61 4 056 1
61 4 5 7 56 10 59
.
..
5 7.
E Kf
f ksic c= + ′
′ ( )33 000 0 140
10001
1 5
, ..
c
Ratio of predicted-to-measured creep coefficientMix
ACI-209 AASHTO-LRFD Proposed Nebraska NE09G, NE10G, NE12G
1.69 1.31 1.00
New Hampshire NH10G, NH11G, NH12G
1.50 1.37 0.84
Texas TX08G, TX09G, TX10G
2.06 1.89 1.08
Washington WA10G, WA11G, WA12G
1.89 1.88 0.99
Average of all data 1.79 1.61 0.98
TABLE 11 Ratios of predicted-to-measured creep coefficient specimens
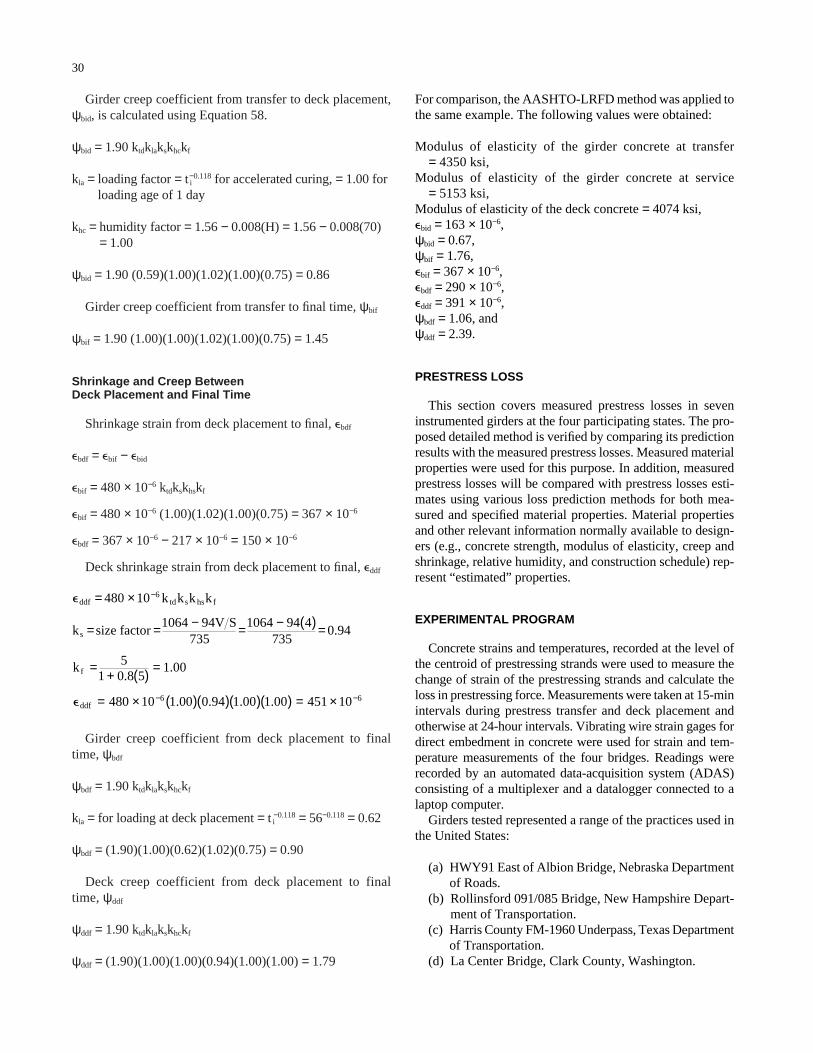
Girder creep coefficient from transfer to deck placement,ψbid, is calculated using Equation 58.
ψbid = 1.90 ktdklakskhckf
kla = loading factor = t i−0.118 for accelerated curing, = 1.00 for
loading age of 1 day
khc = humidity factor = 1.56 − 0.008(H) = 1.56 − 0.008(70) = 1.00
ψbid = 1.90 (0.59)(1.00)(1.02)(1.00)(0.75) = 0.86
Girder creep coefficient from transfer to final time, ψbif
ψbif = 1.90 (1.00)(1.00)(1.02)(1.00)(0.75) = 1.45
Shrinkage and Creep Between Deck Placement and Final Time
Shrinkage strain from deck placement to final, �bdf
�bdf = �bif − �bid
�bif = 480 × 10−6 ktdkskhskf
�bif = 480 × 10−6 (1.00)(1.02)(1.00)(0.75) = 367 × 10−6
�bdf = 367 × 10−6 − 217 × 10−6 = 150 × 10−6
Deck shrinkage strain from deck placement to final, �ddf
Girder creep coefficient from deck placement to finaltime, ψbdf
ψbdf = 1.90 ktdklakskhckf
kla = for loading at deck placement = t i−0.118 = 56−0.118 = 0.62
ψbdf = (1.90)(1.00)(0.62)(1.02)(0.75) = 0.90
Deck creep coefficient from deck placement to finaltime, ψddf
ψddf = 1.90 ktdklakskhckf
ψddf = (1.90)(1.00)(1.00)(0.94)(1.00)(1.00) = 1.79
�
�
ddf td s hs f
s
f
ddf
k k k k
k size factor94V S
k
= ×
= = − = − ( )=
=+ ( ) =
= × ( )( )( )( ) = ×
−
− −
480 10
1064735
1064 94 4735
0 94
51 0 8 5
1 00
480 10 1 00 0 94 1 00 1 00 451 10
6
6 6
.
..
. . . .
30
For comparison, the AASHTO-LRFD method was applied tothe same example. The following values were obtained:
Modulus of elasticity of the girder concrete at transfer = 4350 ksi,
Modulus of elasticity of the girder concrete at service= 5153 ksi,
Modulus of elasticity of the deck concrete = 4074 ksi,�bid = 163 × 10−6,ψbid = 0.67,ψbif = 1.76,�bif = 367 × 10−6,�bdf = 290 × 10−6,�ddf = 391 × 10−6,ψbdf = 1.06, andψddf = 2.39.
PRESTRESS LOSS
This section covers measured prestress losses in seveninstrumented girders at the four participating states. The pro-posed detailed method is verified by comparing its predictionresults with the measured prestress losses. Measured materialproperties were used for this purpose. In addition, measuredprestress losses will be compared with prestress losses esti-mates using various loss prediction methods for both mea-sured and specified material properties. Material propertiesand other relevant information normally available to design-ers (e.g., concrete strength, modulus of elasticity, creep andshrinkage, relative humidity, and construction schedule) rep-resent “estimated” properties.
EXPERIMENTAL PROGRAM
Concrete strains and temperatures, recorded at the level ofthe centroid of prestressing strands were used to measure thechange of strain of the prestressing strands and calculate theloss in prestressing force. Measurements were taken at 15-minintervals during prestress transfer and deck placement andotherwise at 24-hour intervals. Vibrating wire strain gages fordirect embedment in concrete were used for strain and tem-perature measurements of the four bridges. Readings wererecorded by an automated data-acquisition system (ADAS)consisting of a multiplexer and a datalogger connected to alaptop computer.
Girders tested represented a range of the practices used inthe United States:
(a) HWY91 East of Albion Bridge, Nebraska Departmentof Roads.
(b) Rollinsford 091/085 Bridge, New Hampshire Depart-ment of Transportation.
(c) Harris County FM-1960 Underpass, Texas Departmentof Transportation.
(d) La Center Bridge, Clark County, Washington.

Figures 23 through 26 show the plan and cross section ofthe each of the four bridges, and Table 12 provides geometricproperties and loading data. Tables 13 and 14 show specifiedand measured concrete properties, respectively. Table 15 listsmeasured and predicted shrinkage and creep for the concretemixes used. Appendix D provides details of the concrete mixesused in the bridge girders; designated NE09G, NH10G,TX09G, and WA10G for Nebraska, New Hampshire, Texas,and Washington, respectively.
Concrete Industries of Lincoln, Nebraska, produced theNU2000 girders on May 9 and 10, 2000. The girders wereshipped to the site and the deck was placed April 10, 2001.Northeast Concrete Products of Plainville, Massachusetts, fab-ricated the NE 1400 BT girders June 8, 2000. The casting of
31
the deck was completed October 18, 2000. Texas ConcreteCompany of Victoria, Texas, produced the Texas U54B girderJune 15, 2000. The deck was placed January 9, 2001. ConcreteTechnology Corporation of Tacoma, Washington, producedthe W74G girders for La Center Bridge. The girder concretewas placed September 13 and 14, and the deck was completedMarch 24, 2001.
Girder Instrumentation
The testing program included instrumentation of twogirders per bridge, designated Girders 1 and 2, in Nebraska,New Hampshire, and Washington. Because U-beams were
Girder Cross-section
48.2
38.4
Span= 127'
Girder Layout
R=2.0
10'-6"C Girder "B"
C Girder "C"
C Abutment No. 1
C Girder "D"10'-6"
L
10'-6"L
L
L
R=7.9
5.4 11.8
C Girder "A"L
5.3
5.9
17.2
C Abutment No. 2
13.8
L
2.56
Steel diaphragm
Steel diaphragm
L C Roadway
Figure 23. Plan and cross section of HWY91 East of Albion Bridge, Nebraska.

used in Texas, only one girder (Girder 1) was instrumented.Girder 1 was instrumented at two locations along the spanlength (mid-span and a location from the end of the girderequal to the greater of 6 ft or the girder height.) The secondgirder was instrumented at mid-span only.
Figure 27 shows the locations of the five vibrating straingages used at each cross-section of the I-girders. Two gageswere placed transversely at the same depth as the center ofgravity of the prestressing force close to mid-span, one gagewas positioned at web mid-depth, one gage was placed at thecenter of gravity of the top flange, and the fifth gage wasplaced within the cast-in-place deck. For the Texas U-beam,two gages were placed at the top flange and two gages wereplaced within the cast-in-place part of the deck. The verticaldistribution of longitudinal strain can be used to identify thebehavior of the complete cross-section through the linearstrain gradient.
Table 16 lists the type of instrumentation used, the mea-sured data, and their relevance to prestress losses. Figure 28shows vibrating wire gages placed within girders prior toconcrete casting. Once the girders were moved to the bridgesite, one vibrating wire gage was installed in the deck at eachof the instrumented deck sections with the exception ofTexas where two gages were installed in the deck per section.
32
The gage wires were run along the top of the deck’s longitu-dinal reinforcement toward the location of the multiplexernear the end at the abutment or the pier. An ADAS was thenattached to the bridge structure.
Readings were taken at 15-min intervals just before, dur-ing, and immediately after deck placement to capture theinstantaneous deformation due to deck weight. Afterwards,the datalogger was reprogrammed for long-term measure-ments at the rate of once every 24 hours. A conventionaltelephone line was used as a communication means betweenthe ADAS at the job site and the monitoring station at theUniversity of Nebraska in Omaha. Accessing through a tele-phone module located within the ADAS system allowed acomputer equipped with a modem to reprogram and collectdata on a regular basis without the need to travel to the jobsite.
Concrete Temperature
High-strength concrete develops high heat of hydration thataffects member performance especially in the first severaldays of member age. Therefore, data acquisition of membertemperature began as soon as the concrete was placed andcontinued until the concrete temperatures fell to near ambient.
2'-7 7/8"
111'-8"
55'-0"
3'-11 1/4"
7"
8 5/8"
4"
4 sp
ans
at 7
'-5"
= 29
'-8"
10"
GIRDER G4
C Diaphragm
GIRDER G5
L
GIRDER G2
GIRDER G1
GIRDER G3
3 1/2"
55'-0" 10"
Figure 24. Plan and cross section of Rollinsford 091/085 Bridge, New Hampshire.
A typical time-temperature curve is shown in Figure 29. Tem-perature readings of the seven bridge girders were recorded inboth the pretensioned girders and the cast-in-place decks, asshown in Table 17. Examples of temperature variations dur-ing girder casting are shown in Figure 30. A typical plot oftemperature at mid-span of the composite section is presentedin Figure 31. A more complete record of temperature readingsat all significant construction events is given in Appendix H.The maximum temperature difference across the depth of theprecast sections ranged from 35°F to 12°F, and occurred formost girders shortly after the removal of forms. A sharp dropin the girder temperature usually occurs immediately after
33
removal of the forms at the end of the accelerated curingperiod.
Concrete Strains
Table 18 presents a summary of the strain measurements forthe seven instrumented pretensioned bridge girders; all strainmeasurements are included in Appendix I. The measurementof concrete strain prior to transfer is very sensitive to the heatof hydration. The highest temperature recorded was 165°Fduring the casting of Washington girder W83G. Interpretationof concrete strain prior to transfer, especially in high-strength
4x15
.016
'=60
.06'
3x16
.809
'=50
.43'
3x17
.837
'=53
.51'
Span 1
3x14
.625
'=43
.88'
4x13
.38'
=53.
53'
Span 2
2.42
5x12
.013
'=60
.06'
4x12
.602
'=50
.41'
4x10
.969
'=43
.88'
0.79
55.13
64.50
96.00�8.63
47.19
8.25
5.88
50.44
43.00
1.75
21.63
21.2554.00
24.13
11.88
5.00
0.888.25
15.75
Edge of slab
Begin bridge End bridge
Edge of slab
5.670
6.07
'x2=
12.1
4'
6.07
'x2=
12.1
4'
Figure 25. Plan and cross section of Harris County FM 1960 Underpass, Texas.
concrete, is rather complicated. It temporarily impacts thelevel of tension in the embedded strands because they wouldhave a similar temperature to that of the surrounding concrete.When prestress is released to the concrete and the temperatureof the concrete is still elevated, the amount of prestressingapplied to the girder is significantly impacted by the temporaryhigh temperature. The following equation represents strandstress loss due to a temperature rise, ∆T:
where αs is the coefficient of the thermal expansion of steel.Thermal and relaxation loss prior to concrete hardening can
be considered to be “locked in” as the bond forms. Relaxationloss after concrete set can be computed in the same manner asthat prior to concrete set. Thermal effects after concrete bond-ing to prestressing strands tend to change the strains along thestrands because of the difference in the axial stiffness betweenthe girder section and the free strands. After the forms areremoved, the girder cools and the concrete begins to contract.In addition, drying shrinkage causes extensive contractionprior to transfer. The magnitude of contraction is affected bythe level of restraint provided by the formwork, the tempera-
∆ ∆f E T (64)pt s p= α
34
ture increase due to heat of hydration, and other factors suchas concrete mix proportions, curing, environmental condi-tions, and geometry of the section.
Generally the top of the beam experiences some expansion(tensile strains) due to the higher temperature on the freer topflange than that on the restraint bottom flange. The magnitudeof the tensile strains was highly variable. The top flange sub-sequently went into compression because the temperature-related compressive strain exceeded the tensile strain. Becauseof the presence of compressive strain prior to transfer, the“baseline” reading for strain measurements for elastic short-ening was not taken at the stress-free conditions. In addition,measurement of the prestress losses may have been affected bythe concrete strain prior to transfer, depending on when thebond between the concrete and the strands developed.
The residual compressive strain, due to heat of hydrationjust prior to transfer, was taken as the baseline for measuringthe elastic deformation of the section. Therefore, the elasticstrain at transfer was taken as the difference between strain justbefore transfer and that immediately after transfer. Figure 32for Nebraska girder G1 illustrates that the strain decreasesnoticeably at transfer (44 hours) when the concrete tempera-ture is about 72°F (as shown in Figure 30). In contrast, the
3'-2 3/8"
4'-1"
1'-6 1/2"
3"
3"
1'-1 1/8"
C PIER 3
3"4 1/2"
6 1/8"
1" 5"
C GIRDERPAVT. SEAT PIER 1
BACK OF
108'-6"
C BEARINGLL
105'-0"
C GIRDER
3"3"
C PIER 2L
477'-0"
L
L
5'-1"6'-10 5/8"
5 1/8"
L
C PIER 4C GIRDER
C GIRDER
165'-0"
L
L
98'-6"
C BEARINGL
PAVT. SEAT BACK OF
PIER 5
Figure 26. Plan and cross section of Clark County La Center Bridge, Washington.
35
are based on these two effects and on the long-term materialproperties of the concrete and prestressing strands. A typicalgraph of the variation of concrete strain with time is shownin Figure 33.
OTHER EXPERIMENTAL DATA
Prestress loss data obtained from other tests were comparedto those estimated by the proposed methods to assess themethods’ reliability to accurately estimate prestress losses.
Nebraska-East
Albion HWY91
New Hampshire Rollinsford
091/085
Texas-Harris County
FM 1960 Underpass
Washington-Clark County
La Center Bridge
Girder ID 1W2-1 1W2-2 G3 G4 G7 G18 G19 Girder type NU2000 NE1400BT U54B W83G Span, ft 127 110 129.2 159.0 159.8 Spacing, ft 10.6 7.42 11.22 7.17
Girder details h, in. 78.7 55.1 54 82.6 Ag, in.2 903.8 857.2 1121 972 yb, in. 35.7 26.27 22.48 39.66 Ig, in.4 790,592 351,968 404,230 956,329 Girder unit weight, k/ft 0.967 0.893 1.222 1.073
Prestressing strands Number of strands 56 40 64 60 Diameter of strands, in. 0.5 0.6 0.6 0.6 Ap, in.2 8.568 8.680 13.888 13.02 Eccentricity at mid-span ep, in.
31.20 20.62 19.01 34.66
Eccentricity at x1 from end ep, in.
At 7 ft 22.91
At 7 ft 17.17
At 7 ft 19.01
At 8 ft 23.09
Strands initial stress, ksi 202.48 202.76 202.30 202.49 Strands modulus of elasticity, ksi
28,800 28,800 28,000 28,800
Deck details t, in 7.5 8.0 8.0 7.5 Ad, in.2 945 623 1076.8 645 Deck unit weight, k/ft 1.019 0.767 1.160 0.696 ed, in. 46.75 32.83 35.52 46.69
Assumed superimposed dead loads SIDL unit weight, k/ft 0.473 0.334 0.505 0.323
1 x = 7 ft from the girder end or the girder depth, whichever is larger.
Nebraska East
Albion HWY91
New Hampshire Rollinsford
Bridge 091/085
Texas Harris County
FM 1960 Underpass
Washington Clark
County La Center
Bridge
Girder concrete mix ID NE09G NH10G TX09G WA10G Specified strength at transfer, ksi 5.500 5.700 6.960 7.500 Specified strength at service, ksi 8.000 8.000 9.410 10.000 Deck concrete mix ID NE04D NH04D TX04D WA04D Specified strength at service, ksi 4.000 5.000 5.000 4.000
TABLE 12 Properties and loading data
TABLE 13 Specified concrete strength
recorded residual strain just before transfer at 20 hours for asimilar girder G2 was about 191 microstrains. When the girdertemperature was about 100°F, the temperature correctionwould equal αs (Tt − To) = 6.78 (100 − 72) = 190 microstrains.
However, as the concrete cooled, similar readings wererecorded for the two girders, which indicate that strain read-ings were affected by the high temperature. The only forcesacting on the girder between the times of transfer and deckplacement are the initial prestressing force and the selfweight of the girder. During this period, the prestress losses

36
Nebraska
East Albion
HWY91
New Hampshire Rollinsford
Bridge 091/085
Texas Harris County
FM 1960 Underpass
Washington Clark County
La Center Bridge
Girder concrete mix ID NE09G NH10G TX09G WA10G Concrete unit weight, kcf 0.149 0.145 0.152 0.154 Age at transfer, days 44/24 = 1.8 20/24 = 0.8 24/24 = 1.0 20/24 = 0.8 Strength at transfer, ksi 6.250 5.790 7.230 7.530 Modulus of elasticity at transfer, ksi
4,091 4,688 6,280 5,586
Age of girder at deck placement, days
340 130 200 190
Strength of girder at deck placement, ksi
9.025 10.050 10.670 10.280
Modulus of elasticity at deck placement, ksi
5,088 5,396 7,395 6,114
Deck concrete mix ID NE04D NH04D TX04D WA04D Strength at service, ksi 4.200 5.150 5.200 5.150 Modulus of elasticity at service, ksi
3,898 4,357 4,380 4,357
Nebraska
East Albion HWY91 New Hampshire
Rollinsford 091/085 Texas-Harris County FM 1960 Underpass
Washington-Clark County La Center Bridge
Girder mix designation NE09G NH10G TX09G WA10G
Volume-to-surface ratio, V/S, in. 2.95 3.34 2.88 2.95
Ambient relative humidity, % 65 70 70 80
Planned Actual Planned Actual Planned Actual Planned Actual
Age of girder at deck placement, days 56 340 56 130 56 200 56 190
Deck mix designation NE04D NH04D TX04D WA04D
Volume-to-surface ratio, V/S, in. 3.75 4.00 4.00 3.75
Ambient relative humidity, % 65 70 70 80
Material properties Predicted Modified Measured
Predicted Modified Measured
Predicted Modified Measured
Predicted Modified Measured
1. Shrinkage
a) Girder
Initial to final, ε bif 422 334 364 388 325 248 258 328
Initial to deck placement, ε bid 248 302 215 301 203 213 165 282
Deck placement to final, ε bdf 175 32 149 88 122 34 93 46
b) Deck
Deck placement to final, ε ddf 496 392 373 425 373 296 397 377
2. Creep
a) Girder
Initial to final, ψ bif 1.624 1.767 1.444 1.256 1.286 1.182 1.099 1.144
Initial to deck placement, ψ bid 0.952 1.598 0.854 0.973 0.804 1.018 0.704 0.984 Deck placement to final (initial loadings) (ψ bif - ψbid)
0.672 0.169 0.590 0.283 0.482 0.172 0.395 0.160
Deck placement to final (deck loads), ψ bdf
1.010 0.924 0.898 0.707 0.800 0.632 0.683 0.616
b) Deck
Deck placement to final, ψ ddf 1.517 -- 1.176 -- 1.176 -- 1.342 --
TABLE 14 Measured concrete strength and modulus of elasticity
TABLE 15 Measured and predicted shrinkage and creep
37
Strain Gauge Locations
(a) Instrumented Locations
(b) Vibrating Wire
End ofprecastbeam
Bearingcenterline
Instrumented sections
7'
the top flangeof
pretensioned strands
At depth of C.G. of
Mid-depth of girder
At depth of C.G.
along the Girder
4" below top surface of deck
Precastbeam
Cast-in-place deckLC
Figure 27. Instrumentation locations.
Temperature readings were recorded during the first 24 hours of accelerated curing at 15-minute intervalsto ensure measurement of the maximum temperature. Strain readings were taken at 15-minute intervalsduring transfer and deck casting. After the placement of the deck, the strain and temperature readings were taken once a day.
Instrumentation type Measured data Relevance of data
Vibrating wire gages Concrete strains Elastic shortening Long-term prestress losses
Thermistors
Concrete temperatures Hydration temperature Thermal gradient Corrections for strain
Tension-wire system or Precise surveying
Beam camber/deflection Elastic response to transfer ofprestress force
TABLE 16 Instrumentation and measured parameters

38
Prestress loss measurements were reported for tests on 31 pre-tensioned concrete girders in Connecticut, Illinois, Nebraska,Ohio, Pennsylvania, Texas, and Washington ranging in agefrom 200 days to 28 years. They represented a wide range ofenvironmental conditions, material properties, and construc-tions practices. The girders had I and box sections. The spansranged from 45 ft to 152 ft.
Specified compressive concrete strength ranged from3.38 ksi to 7.86 ksi. The specified concrete compressivestrengths ranged from 5.30 ksi to 14.00 ksi. When unavailable,data related to material properties such as shrinkage strain andcreep coefficients were estimated using the proposed shrink-age and creep formulas. The measured prestress loss data wereobtained from published reports and papers (Greuel et al. [37],Pessiki et al. [38], Mossiossian et al. [39] Kebraei et al. [40]Shenoy et al. [41], Stanton et al. [42], Seguirant et al. [43],and Gross et al. [35]). Details related to girder type and sec-tion properties, deck geometry, prestressing strands, loadsand moments, and concrete material properties are includedin Appendix J.
Reported prestress losses data were compared with the esti-mated prestress losses using the AASHTO-LRFD Refined, theAASHTO-LRFD Lump-Sum, the PCI-BDM, and the pro-posed detailed and approximate methods.
PROPOSED DETAILED PRESTRESS LOSS METHOD
The proposed detailed method uses the aging coefficientapproach for computing prestress losses between transfer
Figure 28. Attachment of vibrating wire gages at theend section of Nebraska NU2000 girder.
0
20
40
60
80
100
120
140
160
180
0 2 4 6 8 10 12 14Time Since Concrete Placement (hours)
Temperature (°F)
Figure 29. Typical time-temperature curing cycle (4).
and casting of decks described by Tadros et al. (18) andGallt in the PCI-BDM (4) for precast noncomposite mem-bers. The approach was also adopted by the European CEB-FIP Recommendations (25). The theory is expanded hereto cover composite action between precast concrete gird-ers and cast-in-place deck slabs. The prestress losses ofpretensioned members, ∆fpT, consist of the following four
39
components, each of which relates to a significant con-struction stage:
(a) Instantaneous prestress loss due to elastic shorteningat transfer, ∆fpES.
(b) Long-term prestress losses due to shrinkage of con-crete, (∆pSR)id, and creep of concrete, (∆fpCR)id, and relax-
State Nebraska New Hampshire Texas Washington
Bridge name East Albion
HWY91 Rollinsford Bridge
091/085
Harris County FM 1960
Underpass
Clark County La Center Bridge
Girder ID 1W2-1 1W2-2 G3 G4 G7 G18 G19 Girder type NU2000 NU2000 NE1400BT NE1400BT U54B W83G W83G
Girder temperature
Casting date May
9, 2000 May
10, 2000 June
8, 2000 June
8, 2000 June
15, 2000 September 13, 2000
September 14, 2000
Casting time 10:12 AM
11:05 AM 11:30 AM 11:00 AM 1:00 PM 12:30 PM 4:25 PM
Maximum concrete
temperature, °F161 128 138 135 141 165 163
Location of maximum
temperature
Bottom Flange
Top Flange
Top Flange
Mid-Height Web
Bottom Flange Bottom Flange
Top Flange
Maximum temperature
difference, °F20 19 20 12 35 15 20
Deck temperature Casting date April 10, 2001 October 18, 2000 January 9, 2001 March 24, 2001 Casting time 8:00 AM 9:00 AM 8:00 AM 8:00 AM
Peak concrete temperature, °F
57 69 61 107
TABLE 17 Measured concrete temperature
70
80
90
100
110
120
130
140
150
160
170
0 4 8 12 16 20 24 28 32 36 40 44 48
Time After Girder Concrete Placement (hours)
Temperature (°F)
Bottom Flange
Bottom Flange
Web Mid-Height
Top Flange
Figure 30. Temperature for girder G1 at mid-span during Nebraskagirder casting.

ation of prestressing strands, (∆fpR2)id, between the timeof transfer and just before deck placement.
(c) Instantaneous prestress gain due to the placement ofdeck weight and SIDL, ∆fpED.
(d) Long-term prestress losses, between the time of deckplacement and the final service life of the structure,due to shrinkage of the girder, (∆fpSD)df, creep of the
40
girder, (∆fpCD1 + ∆fpCD2)df, relaxation of prestressingstrands, (∆fpR3)df, and shrinkage of the deck concrete,(∆fpSS)df.
Total prestress losses in pretensioned bridge girders, ∆fpT,relative to the stress immediately before transfer is thus givenby the equation:
0102030405060708090
100110120130140
0 50 100 150 200 250 300 350 400 450 500 550
Time After Girder Concrete Placement (days)
Temperature (°F)
Bottom FlangeBottom FlangeWeb Mid-HeightTop FlangeDeck
All strains are in in. per in. x 10-6.
Girder
Measured elastic
strain at transfer
Measured long-term
strain transfer to
deck placement
Measured elastic strain at deck and
superimposed dead loads
Measured long-term
strain deck
placement to final
Total measured
strain
Age of girder at
final, (days)
Nebraska G1 NU2000
591 543 -221 144 1057 470
Nebraska G2 NU2000
573 672 -218 148 1175 469
New Hampshire G3 NE1400BT
874 745 -234 64 1449 490
New Hampshire G4 NE1400BT
848 723 -228 66 1409 490
Texas G7 U54B
460 613 -267 46 852 400
Washington G18 W83G
959 457 -241 229 1404 380
Washington G19 W83G
885 463 -240 224 1332 380
Figure 31. Temperature for New Hampshire girder G3 at mid-spanfrom girder casting to final time.
TABLE 18 Summary of measured strains

Instantaneous Prestress Loss Due to Elastic Shortening at Transfer
Elastic shortening loss is caused by instantaneous defor-mation of the concrete at the time prestress is transferred to
∆ ∆ ∆ ∆ ∆ ∆
∆ ∆ ∆ ∆ ∆
f f f f f f
f f f f f
pT pES pSR pCR pR2 id pED
pSD pCD1 pCD2 pR3 pSS df
= + + +( ) −
+ + + + −( )
41
-700
-600
-500
-400
-300
-200
-100
0
100
0 4 8 12 16 20 24 28 32 36 40 44 48
Time After Girder Concrete Placement (hours)
Strain Readings(microstrains)
Bottom Flange
Bottom Flange
Web Mid-Height
Top Flange
-1400
-1200
-1000
-800
-600
-400
-200
0
200
0 30 60 90 120 150 180 210 240 270 300 330 360 390 420 450 480 510
Time After Girder Concrete Placement (days)
Strain Readings(microstrains)
Bottom FlangeBottom FlangeWeb Mid-HeightTop FlangeDeck
Figure 32. Strain readings at transfer for Nebraska girder G1 mid-span.
Figure 33. Long-term strain reading at mid-span of Nebraska girder G1.
the member. It does not need to be calculated if the trans-formed section analysis is used to calculate concrete stressesat transfer. Its calculation is given here only to show that itcan be calculated using transformed section properties andto allow for a complete comparison with current prestressloss prediction methods. The concrete stress at steel cen-troid, fcgp, is obtained by applying the initial prestressingforce just prior to transfer, Pi, and the self weight moment,Mg, to a section transformed to precast concrete using amodular ratio at transfer ni.

where: Ati = transformed area; Iti = transformed moment ofinertia; and epti = eccentricity of strands with respect to thetransformed section centroid. The value of concrete stress atsteel centroid is multiplied by the modular ratio to determinethe change in steel stress:
Long-Term Prestress Losses Between theTimes of Transfer and Deck Placement
Long-term prestress losses due to shrinkage and creep ofconcrete and relaxation of prestressing strands are estimatedbased on the net section properties of the noncomposite section.
Prestress Loss Due to Shrinkage
where:
�bid = concrete shrinkage strain of the girder between trans-fer and deck placement,
ψbif = girder creep coefficient minus the ratio of the strainthat exists at the final time to the elastic strain causedwhen the load is applied at the time of transfer,
Kn
fP
A
f E K
idi n n bif
pSRp
ps
pSR bid p id
=+ +( )
=
=
11 1ρ α χψ
∆∆
∆ �
∆P
A
E
E
A
A
A e
IE
EE
1 +
A e
I
A
A
p
ps
p
c1
ps
n
n pn2
nbid p
c1ci
bif
nn pn
n
nps
n
1 1
12
+′′
+
=
′′ =
= +
=
�
χψ
α
ρ
∆ ∆
∆ ∆ ∆
� �
�
p c
p
ps pbid
p
c1 n
p
c1
pn
n
P
A E
P
E A
P
E
e
I
=
= −′′
+′′
2
∆f n fE
EfpES i cgp
p
cicgp= =
f PA
e
I
M e
Icgp i
ti
pti2
ti
g pti
ti= = +
−1
42
αn = factor for initial net (or approximately gross) sectionproperties,
ρn = tensile reinforcement ratio for initial net section,E ″cl = age-adjusted effective modulus of elasticity of
concrete,χ = aging coefficient that accounts for concrete stress
variability with time and may be considered constantfor all concrete members at age 1 to 3 days (Dilger[16] = 0.7, and
Kid = transformed section age-adjusted effective modulusof elasticity factor, for adjustment between time oftransfer and deck placement.
Prestress Loss Due to Creep
where:
E ′cl = age-adjusted effective modulus of elasticity of con-crete and
ψbid = girder creep coefficient minus the ratio of the strainthat exists at the time of deck placement to the elas-tic strain caused when the load is applied at the timeof transfer.
Prestress Loss Due to Relaxation
Relaxation loss from the time of transfer to deck place-ment, φiLi, can be estimated using the intrinsic relaxationloss, Li, (Magura et al. [36]) and the reduction factor, φi,(Tadros et al. [19]) as follows:
Kn
fP
A
f n f K
idi n n bif
pCRp
ps
pCR i cgp bid id
=+ +( )
=
=
1
1 1ρ α χψ
ψ
∆∆
∆
′ =
′′ =+
+ +
+( )
=
EE
EE
P
A
E
E
A
A
A e
I
E
Ef
cci
bid
cci
bif
p
ps
p
ci
ps
n
n pn2
nbif
p
cicgp bid
1
11
1 1 1
ψ
χψ
χψ ψ∆
∆ ∆
∆ ∆ ∆
∆ ∆ ∆
� �p pc
p
ps p
cgp
c1
p
c1 n
p
c1
pn2
n
p
ps p
cgp
cibid
p
ci n
p
ci
pn2
nbif
P
A E
f
E
P
E A
P
E
e
I
P
A E
f
E
P
E A
P
E
e
I
=
=′
−′′
+′′
= − +
+( )ψ χψ1

where:
fpo = stress in prestressing strands just after transfer;fpy = specified yield strength of strands;td = age of the concrete at deck placement, days;ti = age of the concrete at transfer, days;φi = reduction factor that reflects the steady decrease in
strand prestressing due to creep and shrinkage of theconcrete.
In general, the relaxation loss of low-relaxation strand is verysmall, ranging from 1.5 ksi to 4.0 ksi, it may be convenientto assume a constant value of 2.4 ksi, equally split betweenthe two time periods: initial to deck placement and deckplacement to time infinity.
Instantaneous Elastic Prestress Gain at theTime of Deck Placement and SuperimposedDead Loads
As indicated earlier, there is no need for the explicit cal-culation of elastic loss and gain because stress analysis usingthe transformed section automatically accounts for this com-ponent of steel stress change.
Long-Term Prestress Losses Between the Time of Deck Placement and the Final Time
Long-term prestress losses due to the shrinkage and creepof girder concrete, relaxation of prestressing strands, andshrinkage of deck concrete between the time of deck place-ment and the final service life of the structure are computedassuming a composite section to be in action shortly afterdeck placement.
Prestress Loss Due to Shrinkage of GirderConcrete in the Composite Section
∆ ∆
∆ ∆ ∆
� �
�
p c
p
ps pbdf
p
c1 nc
p
c1
pnc2
nc
P
A E
P
E A
P
E
e
I
=
= −′′
+′′
φipSR pCR
po
f f
f= −
+( )1
3 ∆ ∆
∆f L K
forf
fL
f f
f
t
t
forf
fno relaxation loss is assumed to take place
pR2 i i id
po
pyi
po po
py
d
i
po
py
=
≥ = −
++
≤
φ
0 5045
0 5524 1
24 1
0 50
. , . log
. ,
43
where:
�bdf = shrinkage strain of the girder between the time ofdeck placement and the final time;
epnc = eccentricity of strands with respect to centroid ofthe net composite section at service, always takenas positive;
αnc = factor for net composite section properties;ρnc = tensile reinforcement ratio for net composite section
χ = aging coefficient = 0.7; andKdf = transformed section factor based on age-adjusted
effective modulus of elasticity of concrete, used toadjust the small gain in steel stress resulting from thecontinuous interaction between concrete and steelcomponents of the member, between the time ofdeck placement and the final time.
Prestress Loss Due to the Creep of GirderConcrete in the Composite Section Caused by theInitial Prestressing Force and Self Weight
∆ ∆
∆ ∆ ∆
∆
∆ ∆
� �p c
p
ps p
cgp
c2
p
c1 nc
p
c1
pnc2
nc
p
ps p
cgp
cibif bid
p
ci nc
p
ci
pnc2
ncbif
c2ci
bif bid
c1
P
A E
f
E
P
E A
P
E
e
I
P
A E
f
E
P
E A
P
E
e
I
EE
E
=
=′
−′′
+′′
= −( )
− +
+( )
′ =−
′′ =
ψ ψ
χψ
ψ ψ
1
EEci
bif1 + ψ
∆�
p
ps
p
ci
ps
nc
nc pnc2
ncbdf p
c1ci
bif
ncnc pnc
2
nc
nc
P
A
E
E
A
A
A e
IE
EE
1
A e
I
+′′
+
=
′′ =+
= +
=
1 1
1
χψ
α
ρAA
A
Kn
fP
A
f E K
ps
nc
dfi nc nc bif
pSDp
ps
pSD bdf p df
=+ +( )
=
=
1
1 1ρ α χψ
∆∆
∆ �

where:
fcgp = concrete stress at centroid of prestressing strands dueto the initial prestressing force and self weight and
E ′c2 = age-adjusted effective modulus of elasticity ofconcrete.
Prestress Loss Due to the Creep of GirderConcrete in the Composite Section Caused byDeck Weight and Superimposed Dead Loads
where:
∆fcdp = change in concrete stress at centroid of prestressingstrands due to long-term losses between transferand deck placement, deck weight on noncomposite
∆ ∆
∆ ∆ ∆ ∆
∆ ∆ ∆ ∆
� �p c
p
ps p
cdp
c3
p
c1 nc
p
c1
pnc2
nc
p
ps p
cdp
cbdf
p
ci nc
p
ci
pnc2
ncbif
c3c
bdf
c1ci
bif
PA E
fE
PE A
PE
eI
PA E
fE
PE A
PE
eI
E E
EE
=
=′
−′′
+′′
= − +
+( )
′ =
′′ =+
ψ χψ
ψ
ψ
1
1
∆∆
∆∆
∆ ∆
PA
EE
AA
A eI
EE
f
Kn 1
fP
A
f n f K
p
ps
p
ci
ps
nc
nc pnc2
ncbif
p
ccdp bdf
dfi nc nc bif
pCD2p
ps
pCD2 cdp bdf df
1 1 1
11
+ +
+( )
=
=+ +( )
=
=
χψ
ψ
ρ α χψ
ψ
P
A
E
E
A
A
A e
I
E
Ef
Kn 1
fP
A
f n f K
p
ps
p
ci
ps
nc
nc pnc2
ncbif
p
cicgp bif bid
dfi nc nc bif
pCD1p
ps
pCD1 i cgp bif bid df
1 1 1
1
1
+ +
+( )
= −( )
=+ +( )
=
= −( )
χψ
ψ ψ
ρ α χψ
ψ ψ
∆
∆∆
∆
44
section, and superimposed weight on compositesection;
ψbdf = girder creep coefficient minus the ratio of the strainthat exists at the final time to the elastic straincaused when the load is applied at the time of deckplacement; and
E ′c3 = age-adjusted effective modulus of elasticity of theconcrete.
Prestress Loss Due to the Relaxation of Strands in the Composite Section
Relaxation loss can be computed for the composite sec-tion, between the time of deck placement and the final timeof the structure. However a constant value of total loss dueto steel relaxation of low-relaxation prestressing strand of 2.4ksi may be assumed.
Prestress Gain Due to Shrinkage of the Deck in the Composite Section
Prestress loss due to shrinkage of the deck in the compositesection could be given by:
where:
Psd = horizontal force in the deck due to the shrinkage ofthe deck concrete;
∆fcdf = change in the concrete stress at centroid of prestress-ing strands due to shrinkage of the deck concrete;
�ddf = shrinkage strain of the deck concrete between place-ment and the final time;
PA E
P
A E
f
E
P
E A
P
E
e
I
EE
1
fP
A
P e e
I
P
A
E
E
A
A
A e
sdddf d cd
ddf
p c
p
ps p
cdf
c2
p
c1 nc
p
c1
pnc2
nc
c2c
bdf
cdfsd
nc
sd dc pnc
nc
p
ps
p
ci
ps
nc
nc pc
=+( )
=
=′′
−′′
+′′
′′ =+
= −
+ +
�
� �
1
1 1
χψ
χψ
∆ ∆
∆ ∆ ∆ ∆
∆
∆ 22
ncbif
p
ccdf cdf
pSSp
ps
pSS cdf df bdf
I
E
Ef
fP
A
f n f K
+( )
= +( )
=
= +( )
1
1
1
χψ
χψ
χψ
∆
∆∆
∆ ∆
edc = eccentricity of the deck with respect to the trans-formed composite section at the time of applica-tion of SIDL, always taken as negative;
E″c2 = age-adjusted effective modulus of elasticity of con-crete; and
ψddf = deck creep coefficient minus the ratio of the strainthat exists at the final time to the elastic strain causedwhen the load is applied at the time of deck loading.
Summary of Prestress Losses Formulas
The following is a summary of formulas used to estimateprestress losses:
(a) Instantaneous prestress loss due to elastic shortening attransfer (not needed in the calculation of concretestresses when transformed section properties are used).
(b) Long-term prestress losses between transfer and deckplacement due to shrinkage and creep of the girder con-crete and relaxation of the prestressing strands.• Prestress loss due to shrinkage of girder concrete:
• Prestress loss due to creep of girder concrete:
• Prestress loss due to relaxation of strands:
(c) Instantaneous elastic gain at the deck (precast trans-formed section) and SIDL placement (compositetransformed section) are accounted for in concretestress analysis and need not be calculated separately.
(d) Long-term prestress losses between the deck placementand the final time (composite section) due to shrinkageand creep of concrete and relaxation of prestressingstrands in the composite section between the deckplacement and the final time:• Prestress loss due to shrinkage of the girder con-
crete in the composite section:
• Prestress loss due to the creep of the girder underinitial loads in the composite section:
• Prestress gain due to the creep of the girder underthe deck and SIDL in the composite section:
∆ ∆f n f KpCD2 cdp bdf df= ψ ( )71
∆f n f KpCD1 i cgp bif bid df= −( )ψ ψ ( )70
∆f E KpSD bdf p df= � ( )69
∆f L K approximately 1.2 ksipR2 i i id= ( )φ ( )68
∆f n f KpCR i cgp bid id= ψ ( )67
∆f E KpSR bid p id= � ( )66
45
• Prestress loss due to relaxation of strands in thecomposite section:
• Prestress gain due to shrinkage of the deck in thecomposite section:
Spreadsheet Implementation
The spreadsheet given in Appendix L can be used as adesign aid in place of manual calculations with a hand-heldcalculator. A sample output of the spreadsheet is shown inTable 19. It is given for the New Hampshire girder in themanual calculation examples at the end of this chapter.
Proposed AASHTO-LRFD Revisions
Proposed AASHTO-LRFD revisions are given in Appen-dix M. It is proposed that the detailed method describedherein replace the current “REFINED ESTIMATES OFTIME-DEPENDENT LOSSES” in Article 5.9.5.4 of theSpecifications.
PROPOSED APPROXIMATE PRESTRESS LOSS METHOD
A simplified derivation and a parametric study of pre-stress losses in pretensioned high-strength bridge girderwere conducted. Factors considered included the level ofprestressing, girder cross-section shape, and compressivestrength of the concrete. The total long-term loss accordingto the proposed detailed method is given by the followingformula:
The first two terms relate to the effects of shrinkage of thegirder; the last two terms relate to the relaxation of the pre-stressing strands. The remainder of the terms relates to creepof the girder due to prestress, girder weight, deck weight,SIDL, and deck shrinkage. The relaxation loss for low-relaxation strands is a very small quantity and may beassumed to be 1.2 ksi between transfer and deck placementand 1.2 ksi for the remaining life. In this method, a totalrelaxation loss of 2.40 ksi will be assumed. Loss due toshrinkage of the girder, �bidEpKid + �bdfEpKdf, is a function ofEp (which may be assumed a constant 28,500 ksi). The
∆
∆
∆
f E K E K n f K
n f K n f K
n f K L K L K
pLT bid p id bdf p df i cgp bid id
i cgp bif bid df cdp bdf df
cdf df bdf i i id d d df
= + +
+ −( ) +
+ +( ) + +
� � ψ
ψ ψ ψ
χψ φ φ1
∆ ∆f n f KpSS cdf df bdf= +( )1 73χψ ( )
∆f L KpR3 d d df= φ ( )72
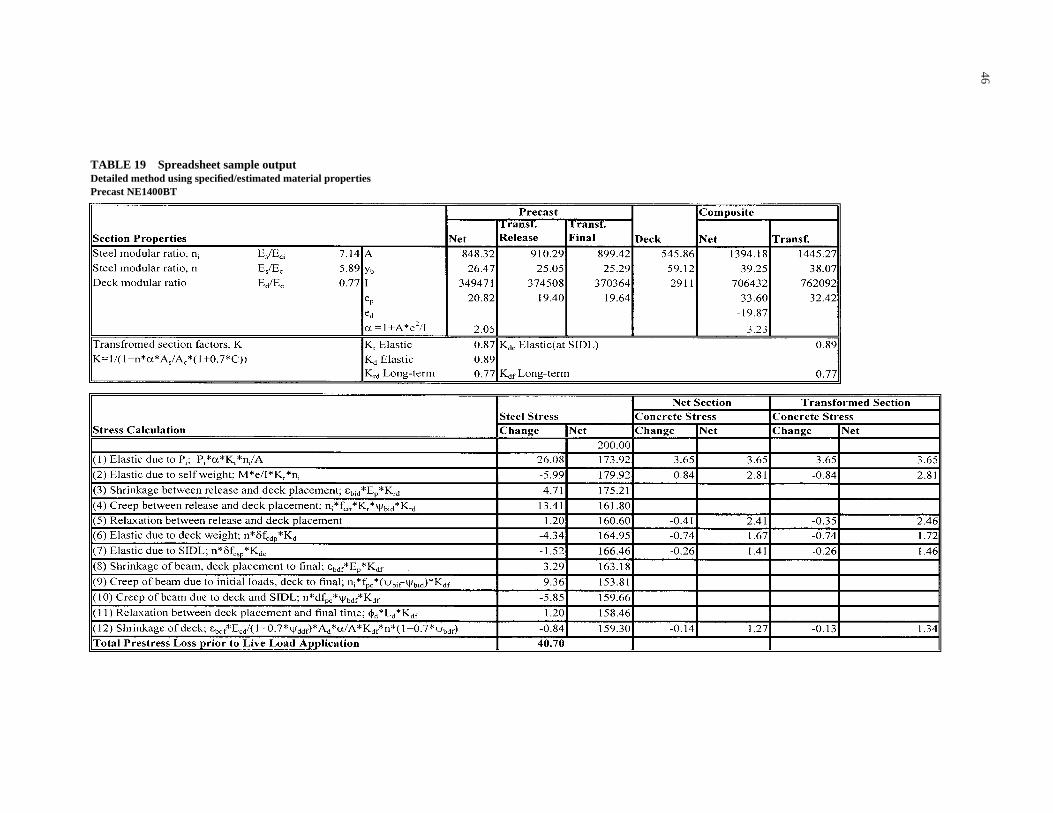
46
TABLE 19 Spreadsheet sample outputDetailed method using specified/estimated material propertiesPrecast NE1400BT
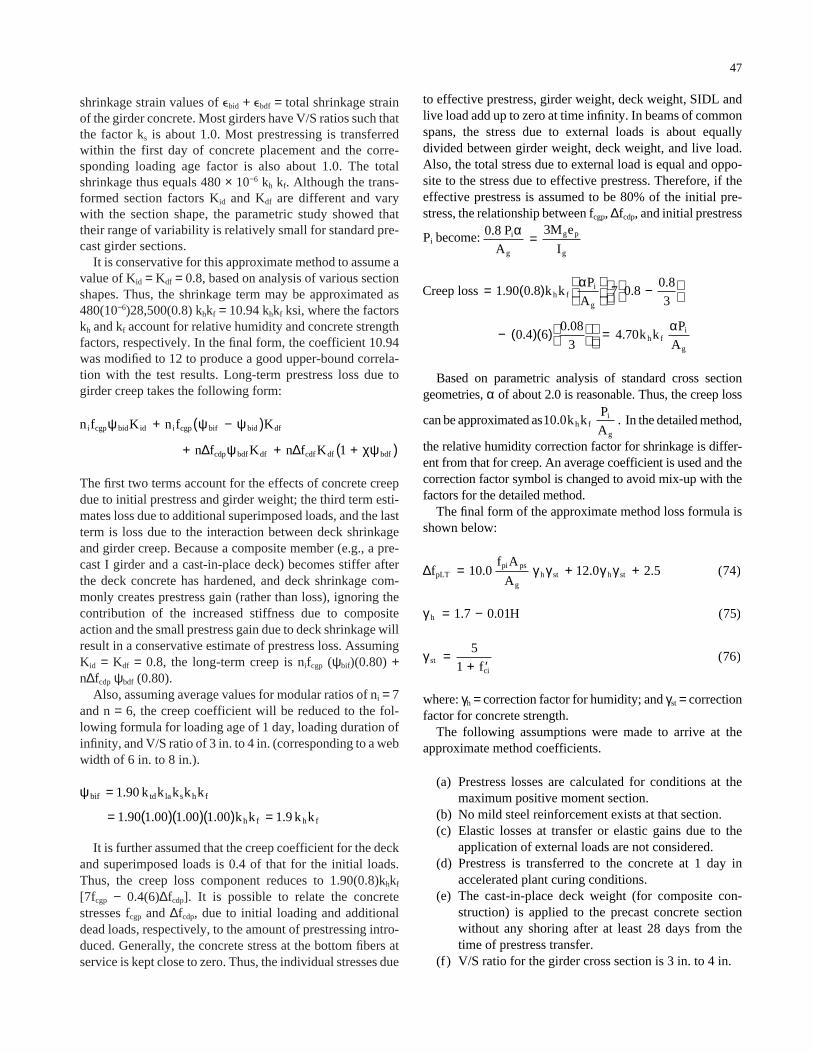
shrinkage strain values of �bid + �bdf = total shrinkage strainof the girder concrete. Most girders have V/S ratios such thatthe factor ks is about 1.0. Most prestressing is transferredwithin the first day of concrete placement and the corre-sponding loading age factor is also about 1.0. The totalshrinkage thus equals 480 × 10−6 kh kf. Although the trans-formed section factors Kid and Kdf are different and varywith the section shape, the parametric study showed thattheir range of variability is relatively small for standard pre-cast girder sections.
It is conservative for this approximate method to assume avalue of Kid = Kdf = 0.8, based on analysis of various sectionshapes. Thus, the shrinkage term may be approximated as480(10−6)28,500(0.8) khkf = 10.94 khkf ksi, where the factorskh and kf account for relative humidity and concrete strengthfactors, respectively. In the final form, the coefficient 10.94was modified to 12 to produce a good upper-bound correla-tion with the test results. Long-term prestress loss due togirder creep takes the following form:
The first two terms account for the effects of concrete creepdue to initial prestress and girder weight; the third term esti-mates loss due to additional superimposed loads, and the lastterm is loss due to the interaction between deck shrinkageand girder creep. Because a composite member (e.g., a pre-cast I girder and a cast-in-place deck) becomes stiffer afterthe deck concrete has hardened, and deck shrinkage com-monly creates prestress gain (rather than loss), ignoring thecontribution of the increased stiffness due to compositeaction and the small prestress gain due to deck shrinkage willresult in a conservative estimate of prestress loss. AssumingKid = Kdf = 0.8, the long-term creep is nifcgp (ψbif)(0.80) +n∆fcdp ψbdf (0.80).
Also, assuming average values for modular ratios of ni = 7and n = 6, the creep coefficient will be reduced to the fol-lowing formula for loading age of 1 day, loading duration ofinfinity, and V/S ratio of 3 in. to 4 in. (corresponding to a webwidth of 6 in. to 8 in.).
It is further assumed that the creep coefficient for the deckand superimposed loads is 0.4 of that for the initial loads.Thus, the creep loss component reduces to 1.90(0.8)khkf
[7fcgp − 0.4(6)∆fcdp]. It is possible to relate the concretestresses fcgp and ∆fcdp, due to initial loading and additionaldead loads, respectively, to the amount of prestressing intro-duced. Generally, the concrete stress at the bottom fibers atservice is kept close to zero. Thus, the individual stresses due
ψbif td la s h f
h f h f
k k k k k
k k k k
=
= ( )( )( ) =
1 90
1 90 1 00 1 00 1 00 1 9
.
. . . . .
n f K n f K
n f K n f K
i cgp bid id i cgp bif bid df
cdp bdf df cdf df bdf
ψ ψ ψ
ψ χψ
+ −( )
+ + +( )∆ ∆ 1
47
to effective prestress, girder weight, deck weight, SIDL andlive load add up to zero at time infinity. In beams of commonspans, the stress due to external loads is about equallydivided between girder weight, deck weight, and live load.Also, the total stress due to external load is equal and oppo-site to the stress due to effective prestress. Therefore, if theeffective prestress is assumed to be 80% of the initial pre-stress, the relationship between fcgp, ∆fcdp, and initial prestress
Pi become:
Based on parametric analysis of standard cross sectiongeometries, α of about 2.0 is reasonable. Thus, the creep loss
can be approximated as In the detailed method,
the relative humidity correction factor for shrinkage is differ-ent from that for creep. An average coefficient is used and thecorrection factor symbol is changed to avoid mix-up with thefactors for the detailed method.
The final form of the approximate method loss formula isshown below:
where: γh = correction factor for humidity; and γst = correctionfactor for concrete strength.
The following assumptions were made to arrive at theapproximate method coefficients.
(a) Prestress losses are calculated for conditions at themaximum positive moment section.
(b) No mild steel reinforcement exists at that section.(c) Elastic losses at transfer or elastic gains due to the
application of external loads are not considered.(d) Prestress is transferred to the concrete at 1 day in
accelerated plant curing conditions.(e) The cast-in-place deck weight (for composite con-
struction) is applied to the precast concrete sectionwithout any shoring after at least 28 days from thetime of prestress transfer.
(f ) V/S ratio for the girder cross section is 3 in. to 4 in.
γstcif
=+ ′5
176( )
γh H= −1 7 0 01 75. . ( )
∆ff A
ApLT
pi ps
gh st h st= + +10 0 12 0 2 5 74. . . ( )γ γ γ γ
10 0. .k kP
Ah f
i
g
Creep loss k kP
A
k kP
A
h fi
g
h fi
g
= ( )
−
− ( )( )
=
1 90 0 8 7 0 80 8
3
0 4 60 08
34 70
. . ..
..
.
α
α
0 8 3. P
A
M e
Ii
g
g p
g
α =
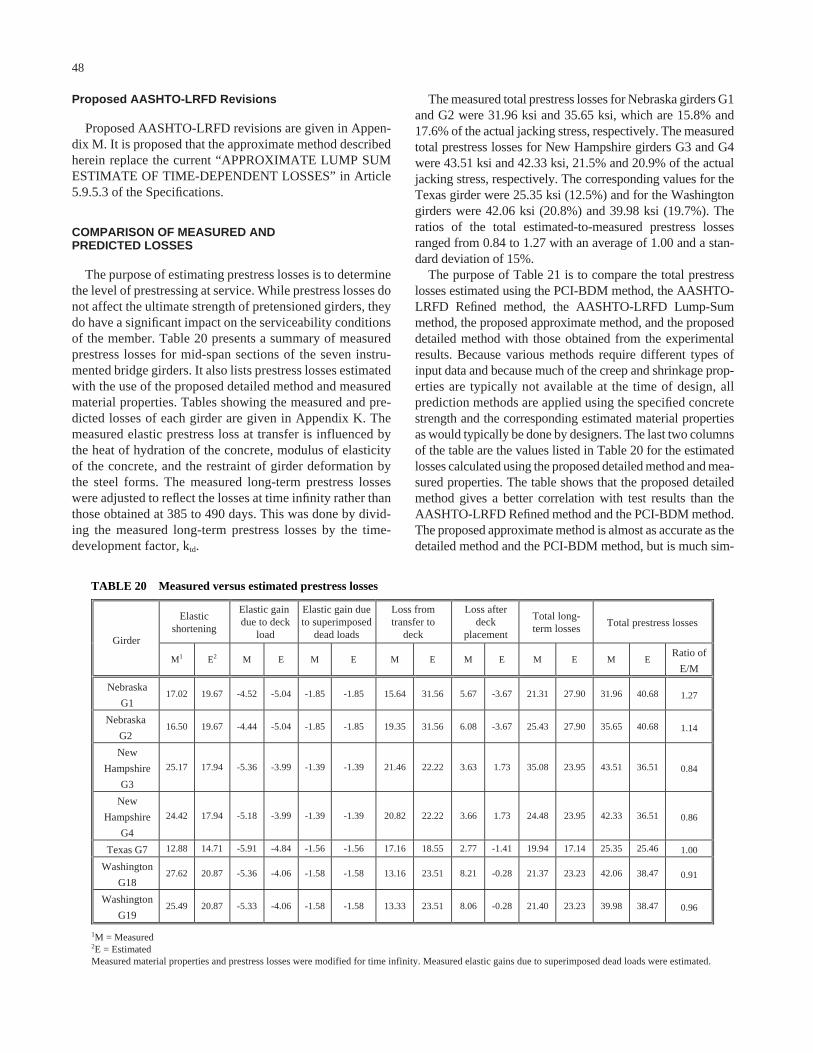
Proposed AASHTO-LRFD Revisions
Proposed AASHTO-LRFD revisions are given in Appen-dix M. It is proposed that the approximate method describedherein replace the current “APPROXIMATE LUMP SUMESTIMATE OF TIME-DEPENDENT LOSSES” in Article5.9.5.3 of the Specifications.
COMPARISON OF MEASURED ANDPREDICTED LOSSES
The purpose of estimating prestress losses is to determinethe level of prestressing at service. While prestress losses donot affect the ultimate strength of pretensioned girders, theydo have a significant impact on the serviceability conditionsof the member. Table 20 presents a summary of measuredprestress losses for mid-span sections of the seven instru-mented bridge girders. It also lists prestress losses estimatedwith the use of the proposed detailed method and measuredmaterial properties. Tables showing the measured and pre-dicted losses of each girder are given in Appendix K. Themeasured elastic prestress loss at transfer is influenced bythe heat of hydration of the concrete, modulus of elasticityof the concrete, and the restraint of girder deformation bythe steel forms. The measured long-term prestress losseswere adjusted to reflect the losses at time infinity rather thanthose obtained at 385 to 490 days. This was done by divid-ing the measured long-term prestress losses by the time-development factor, ktd.
48
The measured total prestress losses for Nebraska girders G1and G2 were 31.96 ksi and 35.65 ksi, which are 15.8% and17.6% of the actual jacking stress, respectively. The measuredtotal prestress losses for New Hampshire girders G3 and G4were 43.51 ksi and 42.33 ksi, 21.5% and 20.9% of the actualjacking stress, respectively. The corresponding values for theTexas girder were 25.35 ksi (12.5%) and for the Washingtongirders were 42.06 ksi (20.8%) and 39.98 ksi (19.7%). Theratios of the total estimated-to-measured prestress lossesranged from 0.84 to 1.27 with an average of 1.00 and a stan-dard deviation of 15%.
The purpose of Table 21 is to compare the total prestresslosses estimated using the PCI-BDM method, the AASHTO-LRFD Refined method, the AASHTO-LRFD Lump-Summethod, the proposed approximate method, and the proposeddetailed method with those obtained from the experimentalresults. Because various methods require different types ofinput data and because much of the creep and shrinkage prop-erties are typically not available at the time of design, allprediction methods are applied using the specified concretestrength and the corresponding estimated material propertiesas would typically be done by designers. The last two columnsof the table are the values listed in Table 20 for the estimatedlosses calculated using the proposed detailed method and mea-sured properties. The table shows that the proposed detailedmethod gives a better correlation with test results than theAASHTO-LRFD Refined method and the PCI-BDM method.The proposed approximate method is almost as accurate as thedetailed method and the PCI-BDM method, but is much sim-
1M = Measured2E = EstimatedMeasured material properties and prestress losses were modified for time infinity. Measured elastic gains due to superimposed dead loads were estimated.
Elasticshortening
Elastic gain due to deck
load
Elastic gain dueto superimposed
dead loads
Loss fromtransfer to
deck
Loss afterdeck
placement
Total long-term losses
Total prestress losses
Girder
M1 E2 M E M E M E M E M E M E Ratio of
E/M
Nebraska
G1 17.02 19.67 -4.52 -5.04 -1.85 -1.85 15.64 31.56 5.67 -3.67 21.31 27.90 31.96 40.68 1.27
Nebraska
G2 16.50 19.67 -4.44 -5.04 -1.85 -1.85 19.35 31.56 6.08 -3.67 25.43 27.90 35.65 40.68 1.14
New
Hampshire
G3
25.17 17.94 -5.36 -3.99 -1.39 -1.39 21.46 22.22 3.63 1.73 35.08 23.95 43.51 36.51 0.84
New
Hampshire
G4
24.42 17.94 -5.18 -3.99 -1.39 -1.39 20.82 22.22 3.66 1.73 24.48 23.95 42.33 36.51 0.86
Texas G7 12.88 14.71 -5.91 -4.84 -1.56 -1.56 17.16 18.55 2.77 -1.41 19.94 17.14 25.35 25.46 1.00
Washington
G18 27.62 20.87 -5.36 -4.06 -1.58 -1.58 13.16 23.51 8.21 -0.28 21.37 23.23 42.06 38.47 0.91
Washington
G19 25.49 20.87 -5.33 -4.06 -1.58 -1.58 13.33 23.51 8.06 -0.28 21.40 23.23 39.98 38.47 0.96
TABLE 20 Measured versus estimated prestress losses
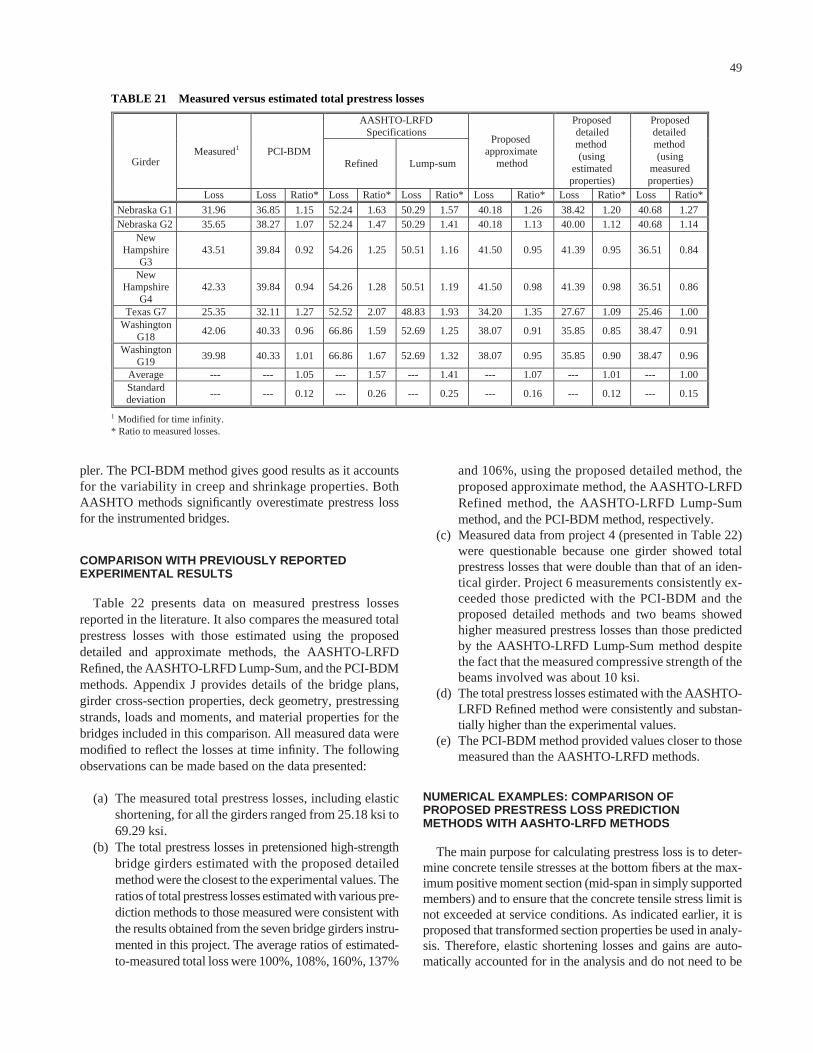
pler. The PCI-BDM method gives good results as it accountsfor the variability in creep and shrinkage properties. BothAASHTO methods significantly overestimate prestress lossfor the instrumented bridges.
COMPARISON WITH PREVIOUSLY REPORTEDEXPERIMENTAL RESULTS
Table 22 presents data on measured prestress lossesreported in the literature. It also compares the measured totalprestress losses with those estimated using the proposeddetailed and approximate methods, the AASHTO-LRFDRefined, the AASHTO-LRFD Lump-Sum, and the PCI-BDMmethods. Appendix J provides details of the bridge plans,girder cross-section properties, deck geometry, prestressingstrands, loads and moments, and material properties for thebridges included in this comparison. All measured data weremodified to reflect the losses at time infinity. The followingobservations can be made based on the data presented:
(a) The measured total prestress losses, including elasticshortening, for all the girders ranged from 25.18 ksi to69.29 ksi.
(b) The total prestress losses in pretensioned high-strengthbridge girders estimated with the proposed detailedmethod were the closest to the experimental values. Theratios of total prestress losses estimated with various pre-diction methods to those measured were consistent withthe results obtained from the seven bridge girders instru-mented in this project. The average ratios of estimated-to-measured total loss were 100%, 108%, 160%, 137%
49
and 106%, using the proposed detailed method, theproposed approximate method, the AASHTO-LRFDRefined method, the AASHTO-LRFD Lump-Summethod, and the PCI-BDM method, respectively.
(c) Measured data from project 4 (presented in Table 22)were questionable because one girder showed totalprestress losses that were double than that of an iden-tical girder. Project 6 measurements consistently ex-ceeded those predicted with the PCI-BDM and the proposed detailed methods and two beams showedhigher measured prestress losses than those predictedby the AASHTO-LRFD Lump-Sum method despitethe fact that the measured compressive strength of thebeams involved was about 10 ksi.
(d) The total prestress losses estimated with the AASHTO-LRFD Refined method were consistently and substan-tially higher than the experimental values.
(e) The PCI-BDM method provided values closer to thosemeasured than the AASHTO-LRFD methods.
NUMERICAL EXAMPLES: COMPARISON OFPROPOSED PRESTRESS LOSS PREDICTIONMETHODS WITH AASHTO-LRFD METHODS
The main purpose for calculating prestress loss is to deter-mine concrete tensile stresses at the bottom fibers at the max-imum positive moment section (mid-span in simply supportedmembers) and to ensure that the concrete tensile stress limit isnot exceeded at service conditions. As indicated earlier, it isproposed that transformed section properties be used in analy-sis. Therefore, elastic shortening losses and gains are auto-matically accounted for in the analysis and do not need to be
AASHTO-LRFDSpecifications
Measured1 PCI-BDMRefined Lump-sum
Proposed approximate
method
Proposeddetailedmethod(using
estimatedproperties)
Proposeddetailedmethod(using
measuredproperties)
Girder
Loss Loss Ratio* Loss Ratio* Loss Ratio* Loss Ratio* Loss Ratio* Loss Ratio*
Nebraska G1Nebraska G2
31.96 36.85 1.15 52.24 1.63 50.29 1.57 40.18 1.26 38.42 1.20 40.68 1.27 35.65 38.27 1.07 52.24 1.47 50.29 1.41 40.18 1.13 40.00 1.12 40.68 1.14
New Hampshire
G3 43.51 39.84 0.92 54.26 1.25 50.51 1.16 41.50 0.95 41.39 0.95 36.51 0.84
New Hampshire
G4 42.33 39.84 0.94 54.26 1.28 50.51 1.19 41.50 0.98 41.39 0.98 36.51 0.86
Texas G7 25.35 32.11 1.27 52.52 2.07 48.83 1.93 34.20 1.35 27.67 1.09 25.46 1.00 Washington
G18 42.06 40.33 0.96 66.86 1.59 52.69 1.25 38.07 0.91 35.85 0.85 38.47 0.91
Washington G19
39.98 40.33 1.01 66.86 1.67 52.69 1.32 38.07 0.95 35.85 0.90 38.47 0.96
Average --- --- 1.05 --- 1.57 --- 1.41 --- 1.07 --- 1.01 --- 1.00 Standard dev
1 Modified for time infinity.* Ratio to measured losses.
iation --- --- 0.12 --- 0.26 --- 0.25 --- 0.16 --- 0.12 --- 0.15
TABLE 21 Measured versus estimated total prestress losses

calculated separately. Since most designers currently use grosssection properties, it is necessary for them to calculate andaccount for elastic losses and gains separately to accuratelydetermine the concrete tensile stresses. The following series ofexamples demonstrate the two main issues being examined:
(1) It is necessary to accurately estimate prestress loss foraccurate calculation of concrete tensile stresses.
(2) Whether gross or transformed section properties areused, the calculated concrete stresses are essentiallythe same if the proper components of the prestress lossare used. Either long-term losses due to creep, shrink-age, and relaxation in conjunction with transformedsection properties, or total losses (including elasticlosses and gains) in conjunction with gross sectionproperties should be used.
An interior beam of the New Hampshire bridge used in theexperimental program is used in these examples. All data
50
used in these examples were those specified in the designdocuments.
Input Data
Girder type: New England NE1400BT, with an 8-in. thickcast-in-place composite deck slab
Effective slab width = 89 in.;Ambient relative humidity at the bridge is estimated to
be 70%;Specified initial concrete compressive strength f ′ci = 5.7 ksi;Specified ultimate compressive strength, f ′c, for the girder
concrete = 8 ksi and that of the deck concrete = 5 ksi;Precast girder properties are Ag = 857 in.2, h = 55.12 in., Ig =
353,196 in.4, yb = 26.26 in.;Prestressing immediately before transfer fpi = 200 ksi intro-
duced with 40-0.6 in. diameter, low-relaxation strands;Aps = 8.68 in.2;
AASHTO-LRFD SpecificationsProject
No. Reference
Measured1 PCI-BDM
RefinedLump-
sum
Proposedapprox. Proposed
detailed
1 Greuel et al. (37) 37.74 34.16 46.31 32.03 35.81 37.83 36.46 42.48 47.45 50.15 34.69 33.74
2 Pessiki et al. (38)36.64 42.99 47.64 50.98 36.27 35.56 32.54 34.07 45.87 52.05 36.72 35.20
3 Mossiossian et al. (39)35.11 34.07 45.87 52.05 36.72 35.20 17.92 23.68 36.61 38.93 23.92 23.71
4 Kebraei et al. (40) 36.77 23.68 36.61 38.93 23.92 23.71
5 Shenoy et al. (41) 25.18 37.32 31.66 32.92 32.25 36.67
34.17 25.76 34.72 41.29 26.71 31.62 34.00 27.52 34.72 41.29 26.71 31.62 65.62 40.14 63.35 54.31 38.45 39.06 55.06 40.14 63.35 54.31 38.45 39.06
6 Stanton et al. (42)
69.29 40.14 63.35 54.31 38.45 39.06 36.11 43.33 50.05 51.25 35.16 41.66 41.65 44.00 50.28 51.69 37.05 46.63 7 Seguirant et al. (43)
35.03 46.06 50.39 53.40 37.91 47.98 35.68 37.98 61.76 48.21 38.50 33.91 30.30 40.24 65.73 49.91 39.50 30.03 32.51 38.41 60.95 47.59 38.01 34.64
8 Gross et al. (35)
26.02 34.00 55.57 46.35 35.89 30.52 43.69 48.63 92.35 58.42 53.29 43.60 50.80 48.87 92.60 58.42 53.43 43.85 43.99 49.29 95.13 57.94 57.10 45.51 44.68 49.81 95.07 58.20 56.40 44.84 49.93 41.68 80.53 53.46 49.51 39.25 50.80 48.90 95.43 59.05 56.46 44.88
9 Gross et al. (35)
48.46 50.45 96.94 59.11 57.47 46.16 28.24 34.18 48.92 47.50 38.81 31.24 27.95 34.18 48.92 47.50 38.81 31.24 26.25 34.18 48.92 47.50 38.81 31.24 10 Gross et al. (35)
23.96 30.64 46.36 47.48 36.76 27.72 Ave. Estimated/Measured Ratio 1.06 1.60 1.37 1.08 1.00
1Modified for time infinity.
TABLE 22 Measured versus estimated total prestress losses for previouslyreported experiments
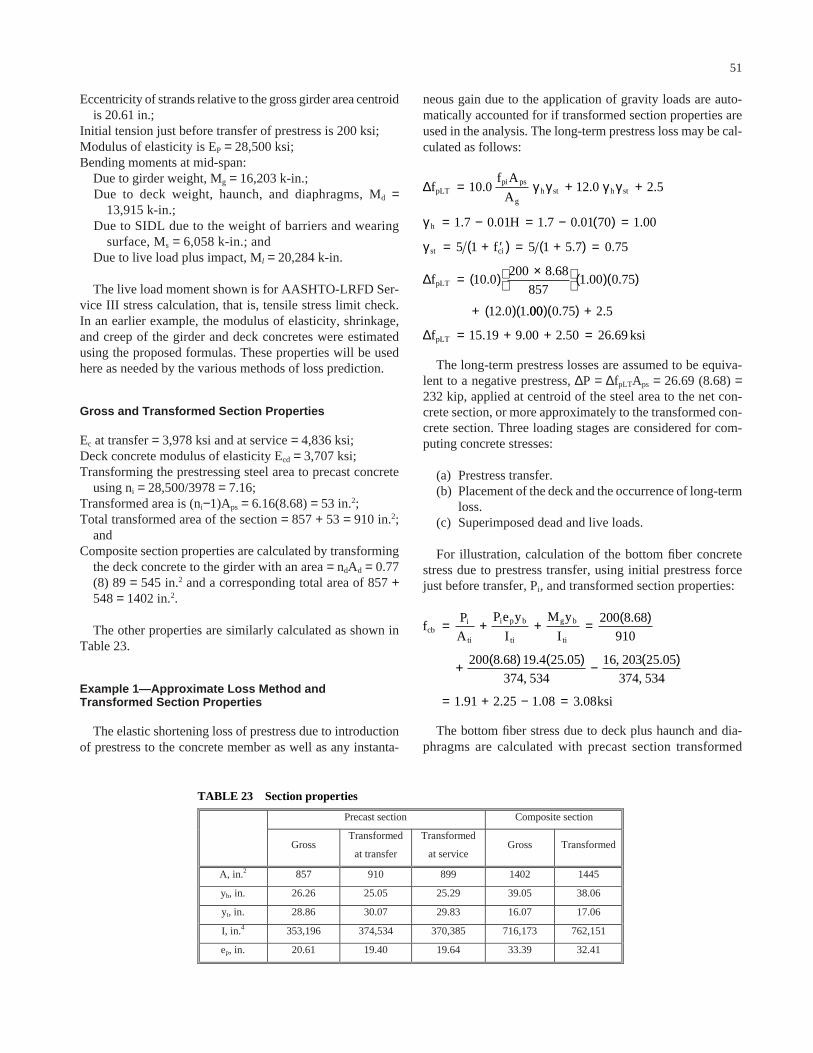
Eccentricity of strands relative to the gross girder area centroidis 20.61 in.;
Initial tension just before transfer of prestress is 200 ksi;Modulus of elasticity is EP = 28,500 ksi;Bending moments at mid-span:
Due to girder weight, Mg = 16,203 k-in.;Due to deck weight, haunch, and diaphragms, Md =
13,915 k-in.;Due to SIDL due to the weight of barriers and wearing
surface, Ms = 6,058 k-in.; andDue to live load plus impact, Ml = 20,284 k-in.
The live load moment shown is for AASHTO-LRFD Ser-vice III stress calculation, that is, tensile stress limit check.In an earlier example, the modulus of elasticity, shrinkage,and creep of the girder and deck concretes were estimatedusing the proposed formulas. These properties will be usedhere as needed by the various methods of loss prediction.
Gross and Transformed Section Properties
Ec at transfer = 3,978 ksi and at service = 4,836 ksi;Deck concrete modulus of elasticity Ecd = 3,707 ksi;Transforming the prestressing steel area to precast concrete
using ni = 28,500/3978 = 7.16;Transformed area is (ni−1)Aps = 6.16(8.68) = 53 in.2;Total transformed area of the section = 857 + 53 = 910 in.2;
andComposite section properties are calculated by transforming
the deck concrete to the girder with an area = ndAd = 0.77(8) 89 = 545 in.2 and a corresponding total area of 857 +548 = 1402 in.2.
The other properties are similarly calculated as shown inTable 23.
Example 1—Approximate Loss Method andTransformed Section Properties
The elastic shortening loss of prestress due to introductionof prestress to the concrete member as well as any instanta-
51
neous gain due to the application of gravity loads are auto-matically accounted for if transformed section properties areused in the analysis. The long-term prestress loss may be cal-culated as follows:
The long-term prestress losses are assumed to be equiva-lent to a negative prestress, ∆P = ∆fpLTAps = 26.69 (8.68) =232 kip, applied at centroid of the steel area to the net con-crete section, or more approximately to the transformed con-crete section. Three loading stages are considered for com-puting concrete stresses:
(a) Prestress transfer.(b) Placement of the deck and the occurrence of long-term
loss.(c) Superimposed dead and live loads.
For illustration, calculation of the bottom fiber concretestress due to prestress transfer, using initial prestress forcejust before transfer, Pi, and transformed section properties:
The bottom fiber stress due to deck plus haunch and dia-phragms are calculated with precast section transformed
fP
A
P e y
I
M y
I
ksi
cbi
ti
i p b
ti
g b
ti
= + + =( )
+( ) ( )
−( )
= + − =
200 8 68
910
200 8 68 19 4 25 05
374 534
16 203 25 05
374 534
1 91 2 25 1 08 3 08
.
. . .
,
, .
,
. . . .
∆
∆
ff A
A
H
f 5
f
pLTpi ps
gh st h st
h
st ci
pLT
= + +
= − = − ( ) =
= + ′( ) = +( ) =
= ( ) ×
( )( )
+ ( )
10 0 12 0 2 5
1 7 0 01 1 7 0 01 70 1 00
5 1 5 1 7 0 75
10 0200 8 68
8571 00 0 75
12 0 1
. . .
. . . . .
. .
..
. .
. .
γ γ γ γ
γ
γ
0000 0 75 2 5
15 19 9 00 2 50 26 69
( )( ) +
= + + =
. .
. . . .∆f ksipLT
Precast section Composite section
Gross Transformed
at transfer
Transformed
at service Gross Transformed
A, in.2 857 910 899 1402 1445
yb, in. 26.26 25.05 25.29 39.05 38.06
yt, in. 28.86 30.07 29.83 16.07 17.06
I, in.4 353,196 374,534 370,385 716,173 762,151
ep, in. 20.61 19.40 19.64 33.39 32.41
TABLE 23 Section properties

properties at service. The SIDL and live load effects are cal-culated with composite section transformed properties. Thevarious stress components are summarized in Table 24.
The AASHTO-LRFD concrete stress limit at service is −0.19 = −0.19 = −0.537 ksi (i.e., tension). The bot-tom fiber stress shown in the table is compression and is thusbelow the limit.
Although not required in design, the elastic shortening lossof steel stress at transfer as well as the elastic changes in steelstress at the time of application of various loads can be deter-mined by simply substituting yb in the above stress formula forep and multiplying the resulting concrete stress at steel centroidby the steel modular ratio ni or n, whichever is applicable.
The following is an example:
Concrete stress at transfer at steel centroid = 200(8.68)/910 + 200(8.68)19.40(19.40)/374,534 − 16,203(19.40)/374,534 = 1.91 + 1.74 − 0.84 = 2.81 ksi and
Elastic loss at transfer = 2.81(7.16) = 20.14 ksi.Similarly, the elastic gain at deck placement is −4.34 ksi,
that due to SIDL is −1.52 ksi and that due to live load is−5.08 ksi.
Example 2—Approximate Loss Method andGross Section Properties
The common practice at present is to use gross concrete sec-tion properties for concrete stress calculation to check against
8 0.′fc
52
code limits. Some commercial software packages give design-ers the option of using transformed section properties, whichgive the impression that considerable savings could resultfrom this refinement. This stipulation is based on the assump-tion that long-term prestress losses given in the AASHTO-LRFD Specifications are valid regardless of whether gross ortransformed section properties are used.
This example demonstrates that proper accounting forelastic prestress loss components produces accurate resultsregardless of whether gross or transformed section propertiesare used. It also shows that the use of gross section proper-ties requires the extra steps of separately calculating elasticshortening loss at transfer and gain increments at variousloading stages. Elastic loss may be calculated using trans-formed section properties as shown in Example 1 or using theapproximate formula given in the AASHTO-LRFD Specifi-cations. For clarity of comparison, the elastic loss value fromExample 1 will be used. Elastic loss calculation according tothe LRFD formula is given in Example 3.
Based on Example 1, the initial prestress, Po, equals (200.00− 20.14)40(0.217) = 1561 kip. The elastic gain due to deckweight = −4.34 ksi = −38 kip, that due to SIDL = −0.52 ksi =−13 kip and that due to live load = −5.08 ksi = 44 kip. All loadsand prestress forces are applied to the gross precast section,except the SIDL and live load and the associated elastic pre-stress gains which are applied to the gross composite section.Table 24 shows that while the results are comparable to themore direct analysis of Example 1, the elastic loss/gain calcu-lation is unnecessary.
Prestress loss method* (ksi) Concrete bottom fiber stress (ksi)Loading stage Loading
1 2 3 4 5 1 2 3 4 5
Prestress transfer Pi 26.13 29.50 29.50 26.13 29.50 4.16 4.69 4.69 4.16 4.69
Girder self weight Mg -6.01 -6.80 -6.80 -6.01 -6.80 -1.08 -1.20 -1.20 -1.08 -1.20
Elastic loss -2.95 -2.95 -2.95 -0.47 -0.47 -0.47
Subtotal 20.12 19.75 19.75 20.12 19.75 3.08 3.02 3.02 3.08 3.02
Deck placement Md -4.34 -4.77 -4.77 -4.34 -4.77 -0.95 -1.03 -1.03 -0.95 -1.03
Elastic gain 0.52 0.10
Long-term
loss 19.31 -0.57 -0.41
Superimposed D.L.
Ms -1.52 -1.65 -1.65 -1.52 -1.65 -0.30 -0.33 -0.33 -0.30 -0.33
Elastic gain 0.17 0.03
Long-term
loss 26.69 26.69 31.35 6.07 34.20 -0.53 -0.74 -0.12 -0.81
Live load + impact
Ml -5.08 -5.57 -5.57 -5.08 -5.57 -1.01 -1.11 -1.11 -1.01 -1.11
Elastic gain 0.61 0.11
Total 35.87 37.75 39.11 34.56 41.96 0.25 0.26 -0.19 0.29 -0.24
* Method 1: proposed approximate method with transformed section properties.Method 2: proposed approximate method with gross section properties.Method 3: AASHTO LRFD Lump-Sum method with gross section properties.Method 4: Proposed detailed method with transformed section properties.Method 5: AASHTO-LRFD Refined method with gross section properties.
TABLE 24 Comparisons of prestress losses and concrete bottom fiber stress
Example 3—AASHTO-LRFD Lump-Sum Method
The proposed approximate method demonstrated in Exam-ples 1 and 2 is intended to be offered as a replacement of theAASHTO-LRFD Lump-Sum method. This example demon-strates the AASHTO-LRFD Lump-Sum method. Accordingto the AASHTO-LRFD Specifications, the elastic shorteningloss at prestress transfer may be calculated using the follow-ing formula:
where: fcgp = concrete stress at the center of gravity of pre-stressing tendons due to the prestressing force at transfer andthe self weight of the member. Exact calculation of fcgp and∆fpES requires knowledge of the prestress force immediatelyafter transfer, which is a function of ∆fpES itself. The Specifi-cations allow use of the approximate value of steel stressafter transfer of 0.70 fpu = 0.70(270) = 189 ksi for the calcu-lation of fcgp.
Alternatively, a formula is given in the AASHTO-LRFDCommentary that implicitly employs the transformed sectionconcept described above for the calculation of ∆fpES. In thatcase, the elastic loss would be 20.14 ksi as calculated inExample 1. For clarity of comparison, the 20.14 ksi value isused here. There is no mention in the AASHTO-LRFD ofelastic stress changes in steel at stages of loading other thanat transfer of prestress. These changes are thus implied to beincluded in the long-term loss formula.
The long-term loss according to Table 5.9.5.3-1 of theAASHTO-LRFD (1) is as follows:
PPR =partial prestress ratio (1.0 for prestressed precast beams)
Example 4—Proposed Detailed Method
The detailed method of prestress loss calculation requirescalculating creep and shrinkage material properties. Therequired values will be calculated as needed for determiningthe concrete bottom fiber stress. The bottom fiber stress and
33 0 1 00 0 156
6 00 6 00
33 1 0 158 6
66 1 0 6 31 35
. . . . .
. . .
− ′ −
+ −
= − −
+ ( ) − =
f
6PPR
ksi
c
fP
A
P e
I
M e
I
ksi
f ksi
cgpo
g
i p2
g
g p
g
pES
= + + =( )
+( )( )
+( )
=
= ( ) =
189 8 68
857
1 89 8 68 20 61
353 196
16 203 20 61
353 1962 94
7 16 2 94 21 05
2
.
. . .
,
, .
,.
. . .∆
∆f n fpES i cgp=
53
the stress at steel centroid will be determined at the variousstages of construction.
Elastic shortening loss due to initial prestress force andgirder self weight is automatically accounted for, as shownin Example 1, if transformed section properties are used. Theconcrete bottom fiber stress at transfer is 3.08 ksi, and thestress at steel centroid is 2.81 ksi.
Girder shrinkage strain from transfer to deck placement: �bid = 217 × 10−6
Girder creep coefficient from transfer to deck placement: ψbid = 0.86
Girder creep coefficient from transfer to final time: ψbif = 1.45
Transformed section factors between transfer and deckplacement:
Long-term prestress losses between transfer and deckplacement:
Shrinkage loss: ∆fpSR = �bidEpKid = 217 × 10−6 (28,500)0.77
= 4.76 ksi
Creep loss: ∆fpCR = ∆fpESψbidKid = 20.16(0.86)0.77
= 13.35 ksi
Relaxation loss: ∆fpR2 = 1.20 ksi
Total losses: ∆fpid = ∆fpSR + ∆fpCR + ∆fpR2
= 4.76 + 13.35 + 1.20
= 19.31 ksi
Therefore, the change in concrete stress at the level of pre-stressing strands, ∆fpc, is:
∆∆
∆ ∆
ff A
Aksi
f f f ksi
cdpid ps
g
pc cgp cd
= =( )
=
= − = − =
α 19 31 8 68 2 03
8570 40
2 81 0 40 2 41
. . ..
. . .
Kn
A
A
id
i gps
gbif
=+ +( )
=+ ( ) + ( )[ ]
=
1
1 1 0 7
1
1 7 16 2 038 68857
1 0 7 1 450 77
α ψ.
. ..
. ..
Substituting the value of e A
Ig
p2
g
g
α = +
= +( )
=
1
120 61 857
353 1962 03
2.
,.

The concrete stresses just prior to deck placement are thesum of the stresses at transfer and the long-term losses betweentransfer and deck placement. The change in concrete stress atthe bottom fiber due to long-term loss is:
Therefore, the concrete bottom stress just prior to deckplacement is = 3.08 −0.41 = 2.67 ksi.
The concrete stress due to deck placement is computedusing precast transformed section properties at service, whilethe concrete stress due to SIDL is calculated using compos-ite transformed section properties. As shown in Example 1,the change in the concrete stress at the bottom fiber of thegirder is = −0.95 −0.30 = −1.25 ksi. Therefore, the concretebottom stress just after placement of the deck and SIDL is= 2.67 −1.25 = 1.42 ksi.
Shrinkage strain from deck placement to final: �bdf = 150 × 10−6
Deck shrinkage strain from deck placement to final: �ddf = 451 × 10−6
Girder creep coefficient from deck placement to final time: ψbdf = 0.90
Deck creep coefficient from deck placement to final time: ψddf = 1.79
Shrinkage loss: ∆fpSD = �bdfEpKdf = 150 × 10−6 (28,500)0.78
= 3.33 ksi
Creep loss due to initial loads:
Creep loss due to deck and SIDL: ∆fpCD2 = n∆fcdpψbdfKdf
The long-term loss between transfer and deck placementproduces a concrete stress change of −0.41 ksi. The change inconcrete stress due to instantaneous application of deck weightand SIDL is −0.95 ksi and −0.30 ksi, respectively, as cal-
∆f n f K
ksi
pCD1 i cgp bif bid df= −( )
= ( ) −( ) =
ψ ψ
7 16 2 81 1 45 0 86 0 78 9 26. . . . . .
K nAA
8.681402
df i gcps
gcbif= + +( )
= + ( ) + ( )[ ]( ) =
1 1 1 0 7
1 1 7 16 3 12 1 0 7 1 45 0 78
α ψ.
. . . . .
∆ ∆
∆
P f A kip
f ksi
pid ps
cb
= = − × = −
= − + − ( )( ) = −
19 31 8 68 168
168899
168 19 64 25 29370 385
0 41
. .
. .,
.
54
culated in Example 1. Thus, ∆fpCD2 = 5.89(−0.41 −0.95 −0.30)(0.90)(0.78) = −6.86 ksi.
Relaxation loss: ∆fpR3 = 1.20 ksiPrestress gain due to shrinkage of the deck: ∆fpSS:Change in concrete stress at the level of prestressing strands
due to shrinkage of the deck.
Total long-term stress change between deck placementand final time:
The change in the concrete stress at the bottom fiber of thegirder due to long-term losses is:
The net concrete bottom fiber stress before live load appli-cation = 1.42 − 0.12 = 1.30 ksi.
Concrete Stresses Due to Live Load
The concrete stress due to live load was calculated inExample 1, using composite transformed section properties,to be −1.01 ksi. Therefore, the net concrete bottom stress atservice = 1.30 − 1.01 = 0.29 ksi.
Example 5—AASHTO-LRFD Refined Method
The AASHTO-LRFD Specifications Refined method ofloss calculation includes elastic loss at transfer as previouslycalculated in addition to long-term losses calculated sepa-rately for shrinkage, creep, and relaxation effects. Similar tothe Lump-Sum method, the elastic gains due to external loads,other than member self weight, are implicitly included in thelong-term estimate.
∆ ∆
∆
P f A kip
f ksi
pdf ps
cb
= = × =
= − −( )
= −
6 07 8 68 53
53
1445
53 32 41 38 06
762 1510 12
. .
. .
,.
∆ ∆ ∆ ∆ ∆ ∆f f f f f f
ksi
pdf pSD pCD1 pCD2 pR2 pSS= + + + +
= + + −( ) + + −( ) =3 33 7 62 6 82 1 20 0 90 6 07. . . . . .
∆
∆ ∆
f
ksi
f f K
ssp
ssp ssp
= × ( )( )+ ( )
+ ( ) − −( )
= −
=
−451 10 712 3 7071 0 7 1 79
11 402
33 39 16 07 4 00716 173
0 12
6 ,. .
,. . .
,.
dfdf bdfn
ksi
1 0 7
0 12 0 78 5 89 1 0 7 0 9 0 90
+( )= − ( ) + ( )[ ] = −
.
. . . . . .
ψ
∆fA E
Ae e
Isspddf d cd
ddf gc
pc dc
gc=
+
+
�1 0 7
1. ψ

Shrinkage Loss: ∆fpSR
Creep Loss: ∆fpCR
∆f f f
ksi
pCR cgp cdp= −
= ( ) −( )
+( )
= − +( ) = −
=
12 0 7 0
12 0 2 81 7 013 915 20 61
353 196
6 058 33 39
716 173
33 72 7 0 0 81 0 28 33 72 7 65
26 07
. .
. . ., .
,
, .
,
. . . . . .
.
∆f H ksipSR = − = − ( ) =17 0 0 15 17 0 15 70 6 51. . . .
55
Relaxation Loss: ∆fpR2
Thus, total long-term loss = 6.51 + 26.07 + 1.63 = 34.20 ksi.The concrete stress analysis is similar to that for Example
3, except that the concrete stress due to long-term losschanges from 0.74 ksi to (−0.74)(34.20/31.35) = −0.81 ksi,and the net final concrete stress changes from −0.19 ksi to −0.26 ksi.
∆ ∆ ∆ ∆f f f f
ksi
pR2 pES pSR pCR= − − +( )[ ]= − ( ) − +( )[ ]
= − −( ) =
0 3 20 0 0 4 0 2
0 3 20 0 0 4 20 16 0 2 6 51 26 07
0 3 20 0 8 06 6 51 1 63
. . . .
. . . . . . .
. . . . .
CONCLUSIONS
Observations, conclusions, and recommendations relatedto individual areas within this research are given in this chap-ter. Below is a summary of general conclusions:
(a) The prestress losses prediction formulas used by cur-rent AASHTO Specifications do not account for thevariability in material properties.
(b) The modulus of elasticity of concrete has been shownto have a high degree of variability, attributed to suchfactors as properties and the proportion of the coarseaggregates used, moisture content and temperature ofthe constituents at time of mixing, methods of mixingand curing, method of testing, size and shape of spec-imens tested, and difference between compaction ofconcrete in the precast member and that in a test cylin-der. A formula has been proposed for estimating mod-ulus of elasticity that assumes a concrete unit weightrelationship to concrete strength. The proposed for-mula has been shown to give more accurate estimatesthan those obtained by the current AASHTO-LRFDand ACI-363 formulas.
(c) This research has determined that concrete compres-sive strength, V/S ratio, curing methods, and timeelapsed after the end of curing influence shrinkage. Aproposed shrinkage formula produced results thataveraged 105% of the measured values, compared to174% when using the AASHTO-LRFD method and155% when using the ACI-209 method.
(d) The creep coefficient is influenced by the same fac-tors that influence the shrinkage coefficient in addi-tion to the age of the concrete at the time of load-ing and the time elapsed after loading. A proposedcreep formula produced results that averaged 98%of the experimental values, compared to 161% forAASHTO-LRFD and 179% for those estimated usingACI-209.
(e) Predictions of modulus of elasticity, shrinkage, andcreep are influenced by local materials and practices.Therefore, data for local materials and mixture pro-portions should be used when available.
(f) Temperature rise in a precast member due to heat ofhydration and steam curing initially restrains the mem-
56
ber as concrete begins to set. However, when the mem-ber cools toward ambient temperature, concrete con-traction leads to tensile stresses which may offset orexceed the internal compressive stresses developedduring initial cement hydration. These effects shouldbe carefully considered in interpreting the concretestrain data, especially in the first 48 hours after con-crete placement.
(g) A detailed method for estimating prestress losses inpretensioned bridge girders has been proposed. Themethod is applicable for noncomposite members,composite precast girders with cast-in-place decks,and high-strength concrete.
(h) An approximate method has been proposed for esti-mating long-term prestress loss due to shrinkage andcreep of concrete and relaxation of strands. The methodproposes coefficients for typically encountered condi-tions in pretensioned girder bridge applications.
(i) Seven girders were instrumented in Nebraska, NewHampshire, Texas, and Washington, representing arange of geographic conditions and construction prac-tices. The measured total prestress losses averaged37.3 ksi.
(j) Measured elastic loss was higher than the averageestimated loss by all prediction methods; it averaged114% of the estimated value. The average measuredtotal loss was very close to the average predicted totalloss.
(k) Test results reported in the literature showed that thetotal prestress losses averaged 38.5 ksi; the initialelastic loss was 19.0% of the jacking stress of 202.5 ksi.
(l) The AASHTO-LRFD Refined method tends to over-estimate creep effects because it does not consider thereduction in the creep coefficient associated with theincrease in concrete strength.
(m) The AASHTO-LRFD Lump-Sum method resultsshowed a better agreement with test results than theRefined method, because it accounts for the variabil-ity of the loss with concrete strength.
(n) The proposed approximate method produces betterestimates of long-term prestress losses than thoseobtained by the AASHTO-LRFD Lump-Sum methodbecause the Lump-Sum method does not account forthe level of prestressing or ambient relative humidity.
CHAPTER 4
CONCLUSIONS AND SUGGESTED RESEARCH

SUGGESTED RESEARCH
This project focused on precast pretensioned girder bridges.Further research is needed to investigate prestress losses inpost-tensioned high-strength concrete bridges. In particular,spliced girder bridges, reinforced with both pretensioning and
57
post-tensioning should be considered because of the multi-stage nature of prestressing.
Further research is also needed to investigate initial andlong-term girder camber. Data from field installations couldbe used to calibrate the analytical results obtained on the basisof the theory developed in this project.

SIGN CONVENTION
The following sign convention is used in this report. A pos-itive moment is one which produces tension in the bottomfibers of a beam. Conversely, a negative moment is one whichproduces tension in the top fibers. Stress (or strain) is positivewhen tensile in steel or compressive in concrete. Downwarddistance from section centroid is positive. Conversely, anupward distance from section centroid is negative.
NOTATION
The symbols used in this report are defined when they firstappear in the text. The symbols are as consistent as possiblewith those used in the AASHTO-LRFD Specifications. Previ-ous relevant research on material properties and prestress losssometimes use symbols that are inconsistent with those inAASHTO-LRFD. Symbols that are unique to that research aredefined when they appear in the text and are not listed below.
SYMBOL DESCRIPTIONAASHTO American Association of State Highway and
Transportation OfficialsACI American Concrete InstituteASTM American Society for Testing and MaterialsAd Area of deck (in.2)Ag gross cross section area (in.2)Agc gross area of composite cross-section (in.2)An net cross section area of precast member (in.2)Anc net area of composite cross section (in.2)Aps area of prestressing steel (in.2)Ati area of transformed cross section at trans-
fer (in.2)CRC loss of prestress due to creep of concrete (ksi)Ec modulus of elasticity of concrete (ksi)Ecd modulus of elasticity of cast-in-place deck
(ksi)Eci modulus of elasticity of girder concrete at
transfer (ksi)E′c1, E′c2, E ′c3 age-adjusted effective modulus of elasticity
of concrete at times 1, 2, and 3 due to con-stant sustained stress (ksi)
E″c1, E″c2 age-adjusted effective modulus of elasticityof concrete at times 1 and 2 due to graduallydeveloping stress (ksi)
Ep modulus of elasticity of prestressing steel(ksi)
edc eccentricity of deck with respect to grosscomposite section, always negative (in.)
58
epc eccentricity of steel with respect to grosscomposite section, always positive (in.)
epn eccentricity of steel with respect to net pre-cast section, always positive (in.)
epnc eccentricity of steel with respect to net com-posite section, always positive (in.)
epti eccentricity of steel with respect to initialtransformed section, always positive (in.)
f ′c specified compressive strength of concrete at28 days, unless another age at service is spec-ified (ksi)
fcb concrete stress at the extreme bottom fiberof precast girder (ksi)
fcgp concrete stress at center of prestressingsteel due to initial prestressing force andmember weight at section of maximummoment (ksi)
f ′ci specified compressive strength of concreteat time of initial loading or prestressing (ksi)
fpc concrete stress at center of prestressing steel(ksi)
fpe effective prestressing steel stress after losses(ksi)
fpi initial prestressing steel stress at the begin-ning of a relaxation loss period (ksi)
fpj prestressing steel stress at jacking (ksi)fps average prestressing steel stress at service
(final) time (ksi)fpt prestressing steel stress immediately after
transfer (ksi)fpu specified tensile strength of prestressing steel
(ksi)fpy yield strength of prestressing steel (ksi)fy specified yield strength of reinforcing bars
(ksi)H average annual ambient mean relative humid-
ity (percent)h overall thickness of member (in.)Ig moment of inertia of the gross precast cross
section (in.4)Igc moment of inertia of gross composite cross
section (in.4)In moment of inertia of net precast cross sec-
tion at transfer (in.4)Inc moment of inertia of net composite cross
section (in.4)Itc moment of inertia of transformed composite
section (in.4)Itd moment of inertia of transformed precast
section (in.4)
SIGN CONVENTION AND NOTATION
Iti moment of inertia of transformed section attransfer (in.4)
K1 correction factor for aggregate type in pre-dicting average value
K2 correction factor for aggregate type in pre-dicting upper and lower bounds
Kdf transformed section age-adjusted effectivemodulus of elasticity factor, for adjustmentbetween the time of deck placement and thefinal time
Kid transformed section age-adjusted effectivemodulus of elasticity factor, for adjustmentbetween the time of transfer and deckplacement
kc volume-to-surface ratio correction factorkf concrete strength creep correction factorkhc humidity correction factor for creepkhs humidity correction factor for shrinkagekh humidity correction factor, used for both
creep and shrinkagekla loading age correction factorks volume-to-surface ratio shrinkage correc-
tion factorktd time-development correction factorL span length (ft)Lr intrinsic relaxation loss, which is the loss of
stress at constant strain (ksi)Li intrinsic relaxation loss between transfer
and deck placement (ksi)Ld intrinsic relaxation loss between deck place-
ment and final time (ksi)Md maximum moment due to deck weight (k-in.)Mg maximum moment due to self weight (k-in.)Ml maximum moment due to live loads with
impact (k-in.)Ms maximum moment due to superimposed
dead loads (k-in.)n steel modular ratio = Ep / Ec
nd deck concrete modular ratio = Ep / Ecd
ni initial steel modular ratio Ep / Eci
Pe effective prestressing force (kip)Pi initial prestressing force (kip)Psd horizontal force in deck due to shrinkage of
deck (kip)PPR partial prestressing ratioSH shrinkaget time (days)td age of concrete at deck placement (days)tf age of concrete at final time (days)ti age of concrete when load is initially applied
(days)V/S volume-to-surface ratio of the memberwc unit weight of concrete (kcf)yb distance from neutral axis to extreme bot-
tom fibers of precast girder (in.)
59
yt distance from neutral axis to extreme topfibers of precast girder (in.)
ytb distance from neutral axis to extreme bottomfibers of transformed section at transfer (in.)
ybd distance from neutral axis to extreme bottomfiber of transformed section at deck place-ment (in.)
ybc distance from neutral axis to extreme bottomfiber of transformed composite section (in.)
yp distance from centroid of prestressing strandsto extreme bottom fiber of precast girder (in.)
αs Coefficient of thermal expansion of steel(per °F)
αg gross precast section properties factorαgc gross composite section properties factorαn net precast section properties factorαnc net composite section properties factor∆fcd change in concrete stress at center of pre-
stressing steel due to long-term losses be-tween transfer and deck placement, deckweight, and superimposed load (ksi)
∆fcdf change in concrete stress at center of pre-stressing steel due to deck shrinkage (ksi)
∆fcdp change in concrete stress at center of pre-stressing steel due to deck and superimposedloads (ksi)
∆fpc change in concrete stress at center of pre-stressing steel (ksi)
∆fpCD1 loss of steel stress due to creep, betweendeck placement and final time, of girderunder initial loads (ksi)
∆fpCD2 loss of steel stress due to creep, betweendeck placement and final time, of girderunder deck and superimposed load (ksi)
∆fpCR loss of steel stress due to creep of girderconcrete (ksi)
∆fpdf loss of steel stress between deck placementand final time (ksi)
∆fpED1 elastic prestress gain due to deck placement(ksi)
∆fpED2 elastic prestress gain due to superimposeddead load (ksi)
∆fpES loss of steel stress due to elastic shortening(ksi)
∆fpLT total long-term loss of steel stress (ksi)∆fpLT1 long-term loss of steel stress between trans-
fer and deck placement (ksi)∆fpLT2 long-term loss of steel stress between deck
placement and final time (ksi)∆fpR loss of steel stress due to relaxation (ksi)∆fpR1 loss of steel stress due to relaxation before
transfer (ksi)∆fpR2 loss of steel stress due to relaxation between
transfer and deck placement (ksi)

60
∆fpR3 loss of steel stress due to relaxation betweendeck placement and final time (ksi)
∆fpSD loss of steel stress due to shrinkage ofgirder between deck placement and finaltime (ksi)
∆fpSR loss of steel stress due to shrinkage of girderconcrete (ksi)
∆fpSS loss of steel stress due to shrinkage of thedeck (ksi)
∆fpSR loss of steel stress due to shrinkage (ksi)∆fpT total loss of steel stress (ksi)∆fpt loss of steel stress due to temperature varia-
tion (ksi)∆Pp change in prestressing force (ksi)∆T Change in temperature (°F)�bdf shrinkage of girder between deck placement
and final time (in./in.)�bid shrinkage of girder between transfer and
deck placement (in./in.)�bif shrinkage of girder between transfer and
final time (in./in.)�ddf shrinkage of deck between deck placement
and final time (in./in.)�sh shrinkage strain at a given time, t, (in./in.)�sh u ultimate shrinkage (in./in.)γh correction factor for humidityγst correction factor for concrete compressive
strength
ρn tensile reinforcement ratio for initial netsection
ρnc tensile reinforcement ratio for net compositesection
χ aging coefficient to account for concretestress variability with time, taken as a con-stant 0.7
ψ(t, ti) creep coefficient minus the ratio of thestrain that exists t days after casting to theelastic strain caused when load is applied ti
days after castingψbdf girder creep coefficient minus the ratio of
the strain that exists at final time to the elas-tic strain caused when load is applied at thetime of deck placement
ψbid girder creep coefficient minus the ratio of thestrain that exists at the time of deck place-ment to the elastic strain caused when load isapplied at the time of transfer
ψbif girder creep coefficient minus the ratio ofthe strain that exists at final time to the elas-tic strain caused when load is applied at thetime of transfer
ψddf deck creep coefficient minus the ratio of thestrain that exists at final time to the elasticstrain caused when load is applied at thetime of deck loading
ψu ultimate creep coefficient
61
REFERENCES
1. American Association of State Highway and TransportationOfficials, “AASHTO-LRFD Bridge Design Specifications,”Second Edition, Washington, DC (1998).
2. American Association of State Highway and TransportationOfficials, “AASHTO Standard Specifications for HighwayBridges,” Fifteenth Edition, Washington, DC (1993).
3. ACI Committee 318, “Building Code Requirements for Re-inforced Concrete,” ACI 318-98/318R-99, American ConcreteInstitute, Detroit, MI (1999).
4. Precast/Prestressed Concrete Institute, “Precast/PrestressedConcrete Bridge Design Manual,” Chicago, IL (1997).
5. ACI Committee 363, “State of the Art Report on High-StrengthConcrete,” American Concrete Institute, Detroit, MI (1992) p. 3.
6. Myers, J. J. and Carrasquillo, R. L., “Production and QualityControl of High Performance Concrete in Texas Bridge Struc-tures,” Research Report 580/589-1, Center for TransportationResearch, University of Texas, Austin, TX (1999) 176 pp.
7. Comité Euro-International du Beton-Fédération Internationalede la Précontrainte, “CEB-FIP Model Code 1990 (CEB-FIPMC90),” Buletin D’Information No. 213/214, Lausanne,Switzerland, May 1993.
8. FHWA, “Compilation and Evaluation of Results from High Per-formance Concrete Bridge Projects,” Contract No. DTFH61-00-C-00009, Federal Highway Administration, Washington, DC(2002).
9. Ahlborn, T. M., French, C. E., and Shield, C. K., “High-Performance Concrete Prestressed Bridge Girders: Long Termand Flexural Behavior,” Report 2000-32, Minnesota Depart-ment of Transportation, St. Paul, MN (2000) p. 91.
10. Huo, X. S., “Time-Dependent Analysis and Application of HighPerformance Concrete in Bridges,” Ph.D. Dissertation, Depart-ment of Civil Engineering, University of Nebraska, Lincoln, NE(August 1997) p. 211.
11. Huo, X. S., Al-Omaishi, N., and Tadros, M. K., “Creep,Shrinkage and Modulus of Elasticity of High PerformanceConcrete,” ACI Materials Journal, Vol. 98, No. 6, Detroit, MI(2001) pp. 440–449.
12. ACI Committee 209, “Prediction of Creep, Shrinkage, and Tem-perature Effects in Concrete Structures,” Committee Report,American Concrete Institute, Detroit, MI (1992).
13. Hansen, T. C. and Mattock, A. H., “Influence of Size andShape of Member on the Shrinkage and Creep of Concrete.”ACI Materials Journal, Vol. 63, No. 2, Detroit, MI (1966) pp. 267–289.
14. Trost, H. “Auswirkungen des Superprositionspringzips aufKriech-und Relaxations-probleme bei Beton and Apannbeton,”Beton und Stahlbetonbau, V. 62, No. 10, 1967, pp. 230–238;No. 11, Germany (1967) pp. 261–269.
15. Bazant, Z. P., “Prediction of Concrete Creep Effects Using Age-Adjusted Effective Modulus Method,” ACI Journal, Vol. 69,No. 4 (April 1972) Detroit, MI, pp. 212–217.
16. Dilger, W. H., “Creep Analysis of Prestressed Concrete Struc-tures Using Creep Transformed Section Properties,” PCI Journal,Vol. 27, No. 1, Chicago, IL (January–February 1982) pp. 89–117.
17. Tadros, M. K., Ghali, A. and Dilger, W. H., “Time-DependentPrestress Loss and Deflection in Prestressed Concrete Mem-
bers,” PCI Journal, Vol. 20, No. 3, Chicago, IL (May–June 1975)pp. 86–98.
18. Tadros, M. K., Ghali, A., and Meyer, A. W., “Prestress Loss andDeflection of Precast Concrete Members,” PCI Journal, Vol. 30,No. 1, Chicago, IL (January–February 1985) pp. 114–141.
19. Tadros, M. K., Ghali, A. and Dilger, W. H., “Time-DependentAnalysis of Composite Frames,” ASCE Journal of StructuralEngineering, New York, NY (April 1977) pp. 871–884.
20. Abdel Karim, A. and Tadros, M. K., “Computer Analysis ofSpliced Girder Bridges,” ACI Structural Journal, Vol. 90, No. 1,Detroit, MI (January–February 1993), pp. 21–31.
21. AASHO, “Standard Specifications for Highway Bridges,”Eleventh Edition, Washington, DC (1973).
22. AASHTO, “Standard Specifications for Highway Bridges,”Twelfth Edition, Washington, DC (1977).
23. PCI Committee on Prestress Losses, “Recommendations forEstimating Prestress Losses,” PCI Journal, Vol. 20, No. 4,Chicago, IL (July–August 1975) pp. 43–75.
24. American Association of State Highway and TransportationOfficials, “AASHTO-LRFD Bridge Design Specifications.”First Edition, Washington, DC (1994).
25. Comité Euro-International du Beton-Fédération Internationalede la Précontrainte, “Practical Design of Structural Concrete,”London, UK (1999) p. 25.
26. Ontario Ministry of Transportation, “Ontario Design HighwayCode-Bridge,” Toronto, Ontario, Canada (1983).
27. ACI-ASCE Joint Committee 423, “Tentative Recommenda-tions for Prestressed Concrete,” Journal of the ACI, Vol. 54,Detroit, MI (1958) pp. 545–1299.
28. Concrete Technology Associates, “Prestress Losses,” Techni-cal Bulletin 73-B7, Concrete Technology Associates, Tacoma,WA (July 1973).
29. Lwin, M. M., Khaleghi, B., and Hsieh, J, C., “Prestressed I-Girder Design Using High Performance Concrete and the NewAASHTO LRFD Specifications,” PCI/FHWA InternationalSymposium on High Performance Concrete New Orleans, LA(October 1997) pp. 406–418.
30. Al-Omaishi, N., “Prestress Losses in Pretensioned High-StrengthConcrete Bridge Girders,” Ph.D. Dissertation, Department ofCivil Engineering, University of Nebraska, Lincoln, NE (2001).
31. ASTM C192/C192M-00, “Standard Practice for Making andCuring Concrete Test Specimens in the Laboratory,” AmericanSociety for Testing and Materials, Annual Book, Philadelphia,PA (1992) pp. 113–119.
32. ASTM C469-94, “Standard Test Method for Static Modulus ofElasticity and Poisson’s Ratio of Concrete in Compression,”American Society for Testing and Materials, Annual Book,Philadelphia, PA (1994) pp. 238–241.
33. ASTM C 512, “Standard Test Method for Creep of Concrete inCompression,” Philadelphia, PA, pp. 267–270.
34. Mokhtarzadeh, A., “Mechanical Properties of High StrengthConcrete,” Ph.D. Dissertation, Department of Civil Engineering,University of Minnesota, Minneapolis, MN (1996).
35. Gross, S. P. and Burns, N. H., “Field Performance of PrestressedHigh Performance Concrete Bridges in Texas,” Research Report

62
580/589-2, Center for Transportation Research, University ofTexas at Austin, Austin, TX (1999).
36. Magura, D. D., Sozen, M. A., and Siess, C. P., “A Study ofStress Relaxation in Prestressing Reinforcement,” PCI Journal,Vol. 9, No. 2, Chicago, IL (April 1964) pp. 13–57.
37. Greuel, A., Rogers, B. T., Miller, R. A., Shahrooz, B. M., andBaseheart, T. M., “Evaluation of a High Performance ConcreteBox Girder Bridge,” Research Report, University of Cincinnati,Cincinnati, OH (2000).
38. Pessiki, S., Kaczinski, M., and Wescott, H. H., “Evaluation ofEffective Prestress Forces in 28-Year-Old Prestressed Con-crete Bridge Beams,” PCI Journal, Vol. 41, No. 5, Chicago, IL(November–December 1996) pp. 78–89.
39. Mossiossian, V. and Gamble, W. L., “Time-dependent Behav-ior of Non-composite and Composite Prestressed Concrete,”
Federal Highway Administration, Illinois State Division ofHighways, Urbana, IL (1972).
40. Kebraei, M., Luedke, J. and Azizinamini, A. A., “High Perfor-mance Concrete in 120th and Giles Bridge, Sarpy County,Nebraska,” University of Nebraska, Lincoln, NE (1997).
41. Shenoy, C. V. and Frantz, G. C. “Structural Test of 27-Year-OldPrestressed Concrete Bridge Beams,” PCI Journal, September–October, Chicago, IL (1991) pp 80–90.
42. Stanton, J. F., Barr, P. and Eberhard, M. O., “Behavior of High-Strength HPC Bridge Girders,” Research Report, University ofWashington, Seattle, WA (2000).
43. Seguirant, Stephen J., “New Deep WSDOT Standard SectionsExtend Spans of Prestressed Concrete Girders,” PCI Journal,Vol. 43, No. 4, Chicago, IL (July–August 1998) pp. 92–119.

63
APPENDIXES A THROUGH M
UNPUBLISHED MATERIAL
Appendixes A through M as submitted by the researchagency on CD-ROM are not published herein. For a limitedtime, they are available from the NCHRP on a loan basis.Please send requests to Cooperative Research Programs;500 Fifth St., NW; Washington, DC 20001. The appendixtitles are as follows:
APPENDIX A Other Methods of Shrinkage Strain Prediction
APPENDIX B Other Methods of Creep Coefficient Prediction
APPENDIX C Other Methods of Prestress Losses Prediction
APPENDIX D Material TestingAPPENDIX E Modulus of Elasticity DataAPPENDIX F Shrinkage DataAPPENDIX G Creep DataAPPENDIX H Temperature ReadingsAPPENDIX I Strain ReadingsAPPENDIX J Specific Details of the Previous Measured
Prestress Losses Experimental DataAPPENDIX K Prestress Loss DataAPPENDIX L Detailed Method SpreadsheetAPPENDIX M Proposed AASHTO-LRFD Revisions

Abbreviations used without definitions in TRB publications:
AASHO American Association of State Highway OfficialsAASHTO American Association of State Highway and Transportation OfficialsAPTA American Public Transportation AssociationASCE American Society of Civil EngineersASME American Society of Mechanical EngineersASTM American Society for Testing and MaterialsATA American Trucking AssociationsCTAA Community Transportation Association of AmericaCTBSSP Commercial Truck and Bus Safety Synthesis ProgramFAA Federal Aviation AdministrationFHWA Federal Highway AdministrationFMCSA Federal Motor Carrier Safety AdministrationFRA Federal Railroad AdministrationFTA Federal Transit AdministrationIEEE Institute of Electrical and Electronics EngineersITE Institute of Transportation EngineersNCHRP National Cooperative Highway Research ProgramNCTRP National Cooperative Transit Research and Development ProgramNHTSA National Highway Traffic Safety AdministrationNTSB National Transportation Safety BoardSAE Society of Automotive EngineersTCRP Transit Cooperative Research ProgramTRB Transportation Research BoardU.S.DOT United States Department of Transportation


