Date post: | 06-Mar-2019 |
Category: |
Documents |
Upload: | nguyenphuc |
View: | 214 times |
Download: | 0 times |
7 December 2015
NCRS Field Day Access
Those of you who are attending the field day on 10 December, at our Northern Crop Research Site
(NCRS), please note there is no access to the site directly off State Highway 1.
Access is via Tamahere Drive from the Airport Road, or from Pencarrow Road and travel along until
Pickering Road, then turn under the new SH1 overbridge and into Oaklea Lane.
FAR signs will be placed opposite Pickering Road and Oaklea Lane entrances.
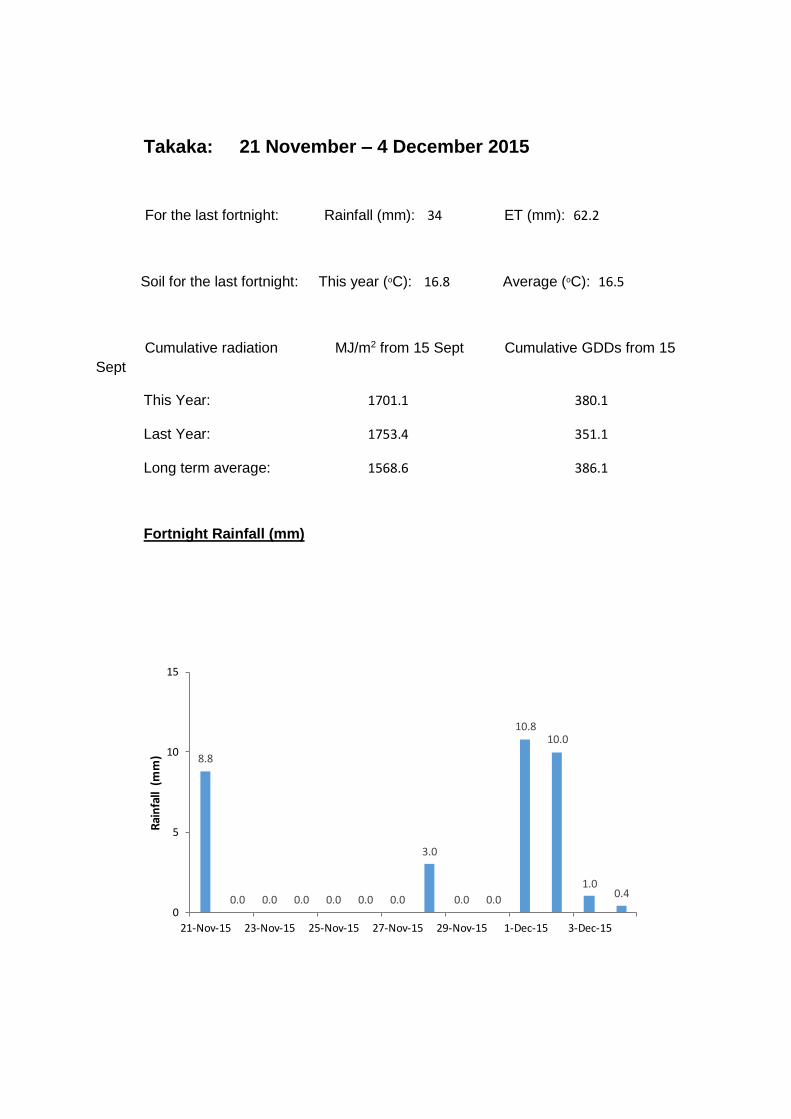
Weather summary 21 November to 4 December 2015
Note: data is missing from the Wanganui, Rangiora and Matamata weather stations – some long term
data has been substituted.
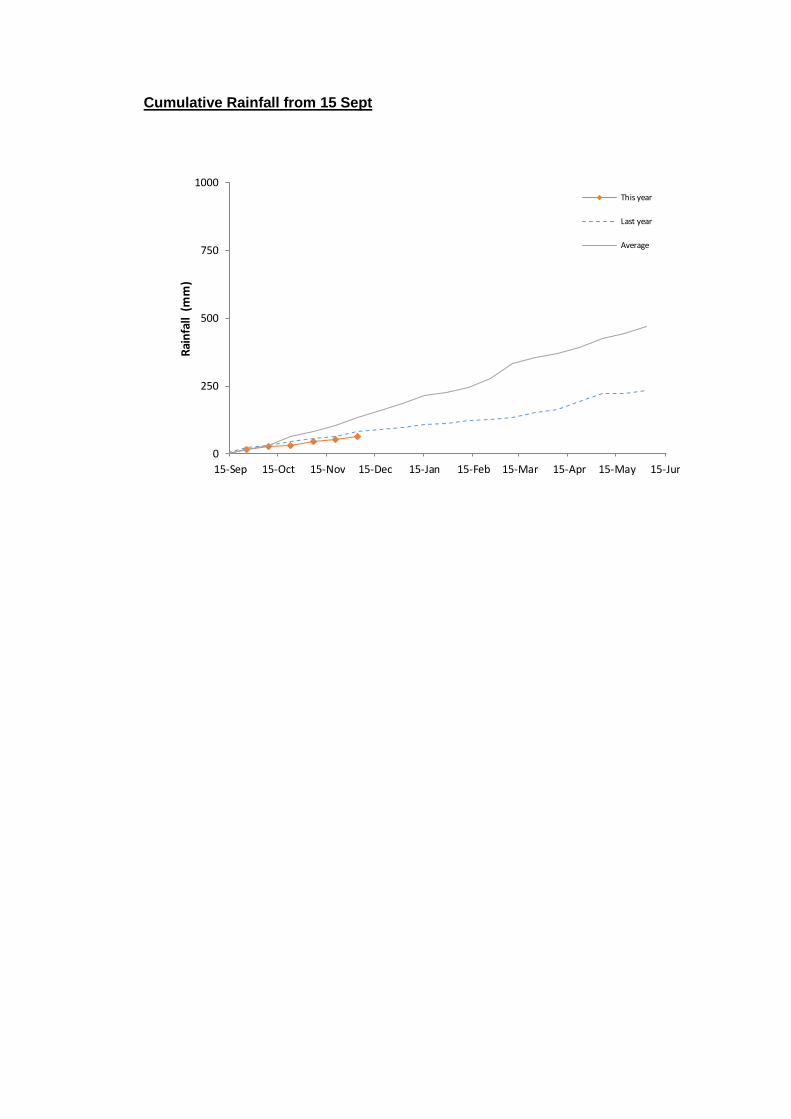
Cumulative Radiation (from 15 Sept): Radiation drives the photosynthetic process and hence has a
strong linkage to yield. Temperature, on the other hand, drives the development stages of maize (see
below on GDDs). Leaf area development is important for radiation interception, while temperature
has less influence on yield. Hence a cooler season with high radiation provides a longer growing period
for photosynthesis to occur and higher yield potential, than a very hot shorter season. This is why New
Zealand maize yields, grown in our temperate climate, are normally higher than those in the USA,
where the growing season is hotter, but shorter.
Most areas are recording above their long term averages. However Hamilton, Hastings, New
Plymouth, Palmerston North, and Masterton are all below their long term average.
Cumulative Growing Degree Days (GDDs) from 15 Sept 2015: Growing degree days are the average
of the daily maximum plus minimum temperatures less a base temperature of 8oC. Crop emergence
takes about 125GDDs and from emergence to V10 each leaf collar requires 85GDDs. From V10 to tassel
each leaf collar requires 50GDDs.
The cooler and generally windy weather of the last fortnight has seen GDDs remain below the long
term average in Morrinsville, Bay of Plenty, New Plymouth, Wanganui, Palmerston North, Masterton
and Takaka. All other areas are now recording above their long term averages.
Soil temperature (10 cm) averages for the fortnight: Soil temperatures are mostly slightly (0.2 to 2OC)
above average, except in Morrinsville, Hastings and Rangiora (all below average).
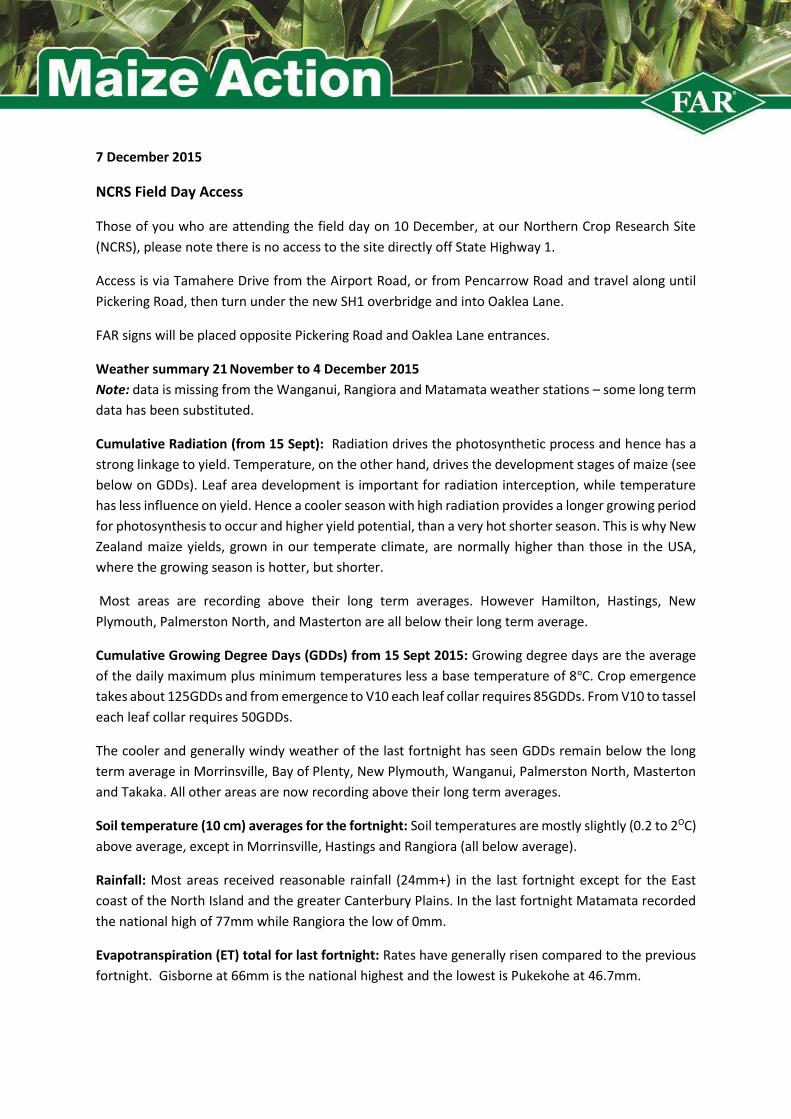
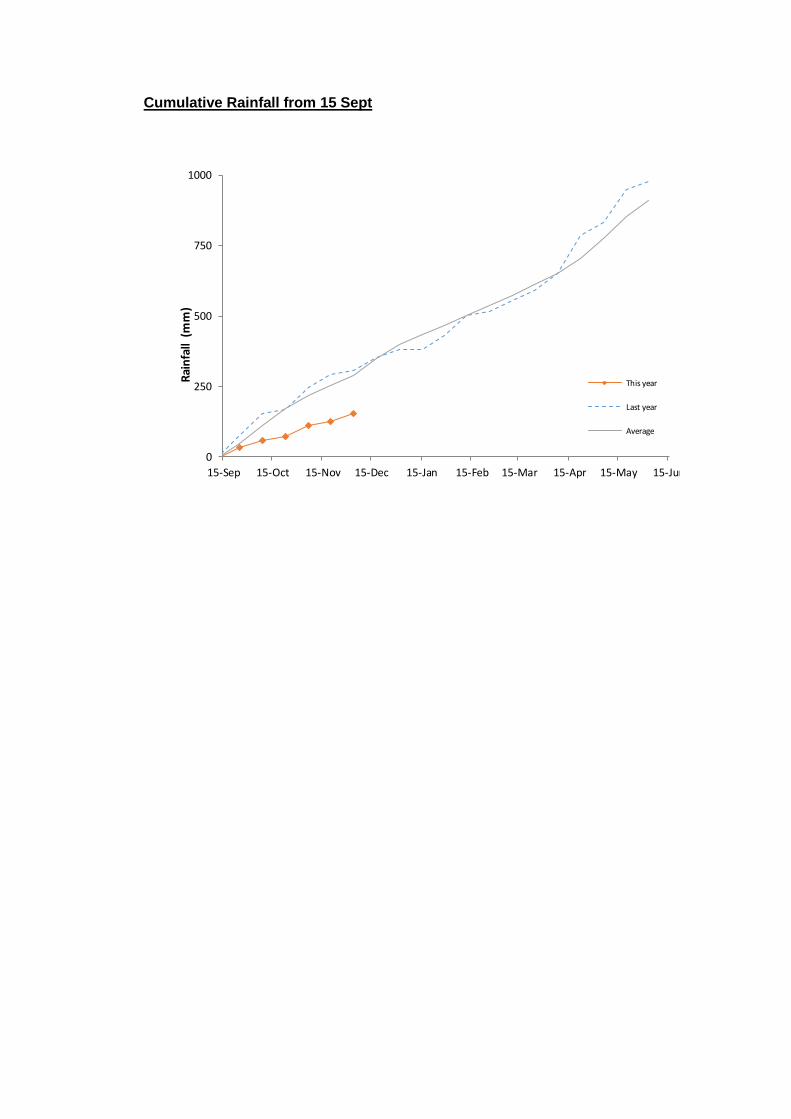
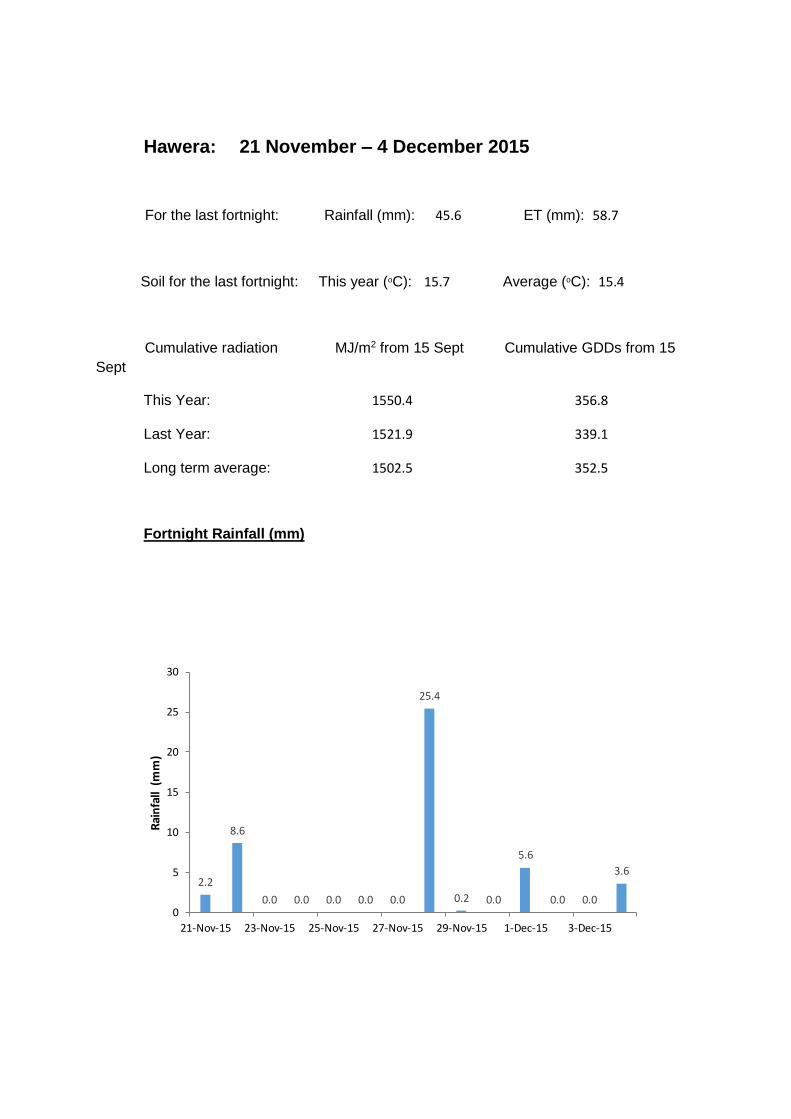
Rainfall: Most areas received reasonable rainfall (24mm+) in the last fortnight except for the East
coast of the North Island and the greater Canterbury Plains. In the last fortnight Matamata recorded
the national high of 77mm while Rangiora the low of 0mm.
Evapotranspiration (ET) total for last fortnight: Rates have generally risen compared to the previous
fortnight. Gisborne at 66mm is the national highest and the lowest is Pukekohe at 46.7mm.
Field report
Northland: Maize crops are looking promising following good rainfall and better warmth, although
the Whangarei side is drier than Dargaville. Side dressing N onto early crops is almost completed and
post emergence herbicide applications are being made as further flushes of weeds have occurred.
There are no reports of any significant black beetle, greasy cutworm or ASW damage.
Waikato: Although it has been windy, a few calm warm days and nights have seen maize crops double
in size in the last week and the early planted crops are already close to fence post height. Side dressing
N is well under way, as is post emergence herbicide applications where they are required. There are
still crops being attacked (pulled) by birds, and some greasy cutworm damage is being noticed.
Common rust has not as yet been seen but usually appears around 10 December, depending on rainfall
and warmth. Crops generally look promising at this stage.
See below for the 10 December field day at our Northern Crop Research Site.
Bay of Plenty: The late frost of several weeks ago checked some plantings, but most have now
recovered. Weed control however, has generally been very poor this season, largely due to the dry
conditions not allowing sufficient activation of pre-emergence herbicides. Grass weeds (including
purple sedge nutgrass), and broad leaf weeds are prevalent, and currently side dressing and post
emergence herbicide applications are still underway. Apart from the frosted crops, most are looking
promising although further rainfall would be beneficial.
Gisborne: Planting is now completed and most crops, apart from those that were earlier swamped
by rainfall, are looking very good. A little cutworm damage is still being observed. Due to the wet
season a lot of crop margins have significant weed growth and post emergence herbicide applications
are being made, as are N side dressing applications. 10mls of welcome rain in the weekend and further
heat will help crops in the region.
Hawke’s Bay: While it is windy and getting dry, apart from weed control and some earlier frost
damage, crops are still looking promising. Post emergence herbicide applications and side dressing of
N is about 50% completed. There are no significant reports of pest damage apart from principally
pukeko bird damage.
Taranaki: Apart from a little slug and greasy cutworm damage, crops are responding to a few calmer
warm days and are now starting to develop better. Side dressing and post emergence herbicide
applications are now about 25% completed.
Manawatu: Conditions have continued to be cooler and very windy, and maize growth has been slow.
The wind has made herbicide applications difficult. Side dressing N continues.
Wairarapa: Frequent strong NW winds have continued, drying out the soil, and the cooler conditions
have not been conducive to growth for maize or pasture. These winds have made it difficult to spray
post emergence herbicides. Side dressing N has commenced.
Canterbury: Temperatures have been very changeable and maize growth has been slow, but is now
starting to respond with more rapid growth. Post emergence herbicide applications and side dressing
N are now happening. Maize crops generally look good.
Important agrichemical notification
MPI recently reassessed five insecticides to examine the acceptability of the crops listed on the labels from a dietary intake exposure perspective. MPI have now released their final decision for these compounds. As a result three compounds (diazinon, fenamiphos and methamidophos) cannot be used off label – which is in force now. This means that growers must only use these compounds strictly according to the label and must observe all ACVM & EPA controls. This includes following exact use pattern directions i.e. rate, timing, WHPs and target insect/s etc. Compounds that cannot be used off label:
Maldison (trade names Malathion 50EC, Malathion 95) can be used off label – but all EPA
controls must be complied with.
Acephate (trade names Lancer and Orthene) cannot be used off label from 01 July 2016.
Maldison (trade names Malathion 50EC, Malathion 95) can be used off label – but all EPA
controls must be complied with.
Active Ingredient Trade names (examples)
Diazinon
Diazol, Basudin, Dew 600, Diazate, Diazinon 800
EC, Diazonyl 60 EC, Digrub, Gesapon
Fenamiphos Nemacur, Nematak 400EC, Fenafos, Canyon
Methamidophos Metafort 60 SL, Methafos 600
There are also revised maximum residue limits (MRLs) and WHPs for some crops. The MRLs will be
promulgated in July 2016. This is to allow labels in the marketplace to be replaced and reduce
unintentional MRL non-compliance. The new use patterns are available on product labels approved
after July 2015. A further update will be made at a later stage.
FAR Field Day: Northern Crop Research Site, Tamahere, Waikato
Thursday 10 December 2015
We hope to see you all this Thursday at FAR's major one day event at the Northern Crop Research Site
in the Waikato. This event will feature 12 speakers from a range of research organisations covering
weed, pest and disease control, crops options and agronomy, environmental issues and more. This
event is aimed at growers from throughout the North Island.
December Field Walks and Discussions
2.00 – 4.00 pm, Wednesday 16 December
3588 South Head Road, Helensville, courtesy of Neil Waller
Weed control in maize and a look at new chemistry for grass weed control.
10.00am – 12.00 noon, Thursday 17 December
1217 Poutu Road, Dargaville, courtesy of David and Adrienne Wordsworth
Observe plant establishment with David’s new direct drill planter and discuss some of FAR’s latest
Maize research findings.
Contact Us
Mike Parker
Diana Mathers
Allister Holmes
021 960 078
027 544 2236
027 833 1155
Sam McDougall 027 468 8803 [email protected]
Disclaimer
This FAR Maize Action Report was prepared with current information at the time of publication. Neither
FAR or its staff may be held liable for any crop damage or loss from interpretation of the information.
Information contained in this Maize Action is intended as a guide only.
Please note if you no longer wish to receive the FAR INFORMATION electronically through this email
list, reply to this email with REMOVE ME in the subject line. You will still receive hard copy mail if you
are a FAR grower. Please advise if you change your email address
Whangarei: 21 November – 4 December 2015
For the last fortnight: Rainfall (mm): 27.6 ET (mm): 54.4
Soil for the last fortnight: This year (oC): X Average (oC): X
Cumulative radiation MJ/m2 from 15 Sept Cumulative GDDs from 15
Sept
This Year: 1467.5 615.7
Last Year: 1585.9 604.1
Long term average: 1466.7 613.0
Fortnight Rainfall (mm)
0.4
3.6
0.0 0.01.6
0.4 0.0 0.0
20.6
0.2 0.0 0.2 0.0 0.6
0
10
20
30
21-Nov-15 23-Nov-15 25-Nov-15 27-Nov-15 29-Nov-15 1-Dec-15 3-Dec-15
Rai
nfa
ll (m
m)
Cumulative Rainfall from 15 Sept
0
250
500
750
15-Sep 15-Oct 15-Nov 15-Dec 15-Jan 15-Feb 15-Mar 15-Apr 15-May 15-Jun
Rai
nfa
ll (m
m)
This Year
Last Year
Average
Dargaville: 21 November – 4 December 2015
For the last fortnight: Rainfall (mm): 28.2 ET (mm): 59.5
Soil for the last fortnight: This year (oC): 18.6 Average (oC): 17.7
Cumulative radiation MJ/m2 from 15 Sept Cumulative GDDs from 15
Sept
This Year: 1631.8 558.2
Last Year: 1711.8 499.9
Long term average: 1498.9 556.4
Fortnight Rainfall (mm)
1.2
9.0
0.0 0.0 0.2 0.0 0.0
9.4
2.02.4
4.0
0.0 0.0 0.00
5
10
21-Nov-15 23-Nov-15 25-Nov-15 27-Nov-15 29-Nov-15 1-Dec-15 3-Dec-15
Rai
nfa
ll (m
m)
Cumulative Rainfall from 15 Sept
0
250
500
750
15-Sep 15-Oct 15-Nov 15-Dec 15-Jan 15-Feb 15-Mar 15-Apr 15-May 15-Jun
Rai
nfa
ll (m
m)
This year
Last year
Average
Pukekohe: 21 November – 4 December 2015
For the last fortnight: Rainfall (mm): 68 ET (mm): 46.7
Soil for the last fortnight: This year (oC): 17.7 Average (oC): 17.2
Cumulative radiation MJ/m2 from 15 Sept Cumulative GDDs from 15
Sept
This Year: 1429.6 492.2
Last Year: 1426.2 455.6
Long term average: 1422.8 489.9
Fortnight Rainfall (mm)
7.8
31.8
0.0 0.0 0.0 0.0 0.0
25.4
2.6
0.0 0.2 0.2 0.0 0.00
5
10
15
20
25
30
35
21-Nov-15 23-Nov-15 25-Nov-15 27-Nov-15 29-Nov-15 1-Dec-15 3-Dec-15
Rai
nfa
ll (m
m)
Cumulative Rainfall from 15 Sept
0
250
500
750
1000
15-Sep 15-Oct 15-Nov 15-Dec 15-Jan 15-Feb 15-Mar 15-Apr 15-May 15-Jun
Rai
nfa
ll (m
m)
This year
Last year
Average
Hamilton: 21 November – 4 December 2015
For the last fortnight: Rainfall (mm): 64.4 ET (mm): 50.4
Soil for the last fortnight: This year (oC): 18.5 Average (oC): 17.5
Cumulative radiation MJ/m2 from 15 Sept Cumulative GDDs from 15
Sept
This Year: 1501.7 505.5
Last Year: 1484.4 458.1
Long term average: 1509.2 458.1
Fortnight Rainfall (mm)
9.0
26.4
1.20.0 0.0 0.0 0.0
25.4
0.6 0.01.8
0.0 0.0 0.00
5
10
15
20
25
30
21-Nov-15 23-Nov-15 25-Nov-15 27-Nov-15 29-Nov-15 1-Dec-15 3-Dec-15
Rai
nfa
ll (m
m)
Cumulative Rainfall from 15 Sept
0
250
500
750
1000
15-Sep 15-Oct 15-Nov 15-Dec 15-Jan 15-Feb 15-Mar 15-Apr 15-May 15-Jun
Rai
nfa
ll (m
m)
This year
Last year
Average
Morrinsville: 21 November – 4 December 2015
For the last fortnight: Rainfall (mm): 10.2 ET (mm): 54.7
Soil for the last fortnight: This year (oC): 14.4 Average (oC): 15.4
Cumulative radiation MJ/m2 from 15 Sept Cumulative GDDs from 15
Sept
This Year: 1528.8 482.7
Last Year: 1537.1 439.2
Long term average: 1499.3 485.5
Fortnight Rainfall (mm)
0.8
4.2
0.0 0.0 0.0 0.0 0.0
5.2
0.0 0.0 0.0 0.0 0.0 0.00
5
10
21-Nov-15 23-Nov-15 25-Nov-15 27-Nov-15 29-Nov-15 1-Dec-15 3-Dec-15
Rai
nfa
ll (m
m)
Cumulative Rainfall from 15 Sept
0
250
500
750
1000
15-Sep 15-Oct 15-Nov 15-Dec 15-Jan 15-Feb 15-Mar 15-Apr 15-May 15-Jun
Rai
nfa
ll (m
m)
This year
Last year
Average
Matamata: 21 November – 4 December 2015
For the last fortnight: Rainfall (mm): 77 ET (mm): X
Soil for the last fortnight: This year (oC): 18.4 Average (oC): 16.4
Cumulative radiation MJ/m2 from 15 Sept Cumulative GDDs from 15
Sept
This Year: X 430.3
Last Year: X 371.9
Long term average: X 419.1
Fortnight Rainfall (mm)
4.2
34.8
0.0 0.0 0.0 0.0 0.0
30.4
7.6
0.0 0.0 0.0 0.0 0.00
5
10
15
20
25
30
35
40
21-Nov-15 23-Nov-15 25-Nov-15 27-Nov-15 29-Nov-15 1-Dec-15 3-Dec-15
Rai
nfa
ll (m
m)
Cumulative Rainfall from 15 Sept
0
250
500
750
1000
15-Sep 15-Oct 15-Nov 15-Dec 15-Jan 15-Feb 15-Mar 15-Apr 15-May 15-Jun
Rai
nfa
ll (m
m)
This year
Last year
Average
Te Puke: 21 November – 4 December 2015
For the last fortnight: Rainfall (mm): 49 ET (mm): 54.3
Soil for the last fortnight: This year (oC): 17.9 Average (oC): 17.2
Cumulative radiation MJ/m2 from 15 Sept Cumulative GDDs from 15
Sept
This Year: 1537.4 496.7
Last Year: 1484.1 541.6
Long term average: 1504.8 500.1
Fortnight Rainfall (mm)
3.8
25.6
0.0 0.0 0.0 0.0 0.0
16.2
3.4
0.0 0.0 0.0 0.0 0.00
5
10
15
20
25
30
21-Nov-15 23-Nov-15 25-Nov-15 27-Nov-15 29-Nov-15 1-Dec-15 3-Dec-15
Rai
nfa
ll (m
m)
Cumulative Rainfall from 15 Sept
0
250
500
750
1000
1250
15-Sep 15-Oct 15-Nov 15-Dec 15-Jan 15-Feb 15-Mar 15-Apr 15-May 15-Jun
Rai
nfa
ll (m
m)
This year
Last year
Average
Whakatane: 21 November – 4 December 2015
For the last fortnight: Rainfall (mm): 24.8 ET (mm): 59.2
Soil for the last fortnight: This year (oC): X Average (oC): X
Cumulative radiation MJ/m2 from 15 Sept Cumulative GDDs from 15
Sept
This Year: 1700.0 497.3
Last Year: 1632.4 466.3
Long term average: 1641.4 513.8
Fortnight Rainfall (mm)
4.6
12.0
0.0 0.0 0.2 0.0 0.0
4.0 4.0
0.0 0.0 0.0 0.0 0.00
5
10
15
21-Nov-15 23-Nov-15 25-Nov-15 27-Nov-15 29-Nov-15 1-Dec-15 3-Dec-15
Rai
nfa
ll (m
m)
Cumulative Rainfall from 15 Sept
0
250
500
750
1000
15-Sep 15-Oct 15-Nov 15-Dec 15-Jan 15-Feb 15-Mar 15-Apr 15-May 15-Jun
Rai
nfa
ll (m
m)
This year
Last year
Average
Gisborne: 21 November – 4 December 2015
For the last fortnight: Rainfall (mm): 4.8 ET (mm): 66.1
Soil for the last fortnight: This year (oC): X Average (oC): X
Cumulative radiation MJ/m2 from 15 Sept Cumulative GDDs from 15
Sept
This Year: 1644.6 540.3
Last Year: 1682.2 500.3
Long term average: 1639.0 530.4
Fortnight Rainfall (mm)
0.0
4.2
0.0 0.0 0.0 0.0 0.0 0.0 0.0 0.0
0.6
0.0 0.0 0.00
5
21-Nov-15 23-Nov-15 25-Nov-15 27-Nov-15 29-Nov-15 1-Dec-15 3-Dec-15
Rai
nfa
ll (m
m)
Cumulative Rainfall from 15 Sept
0
250
500
750
1000
15-Sep 15-Oct 15-Nov 15-Dec 15-Jan 15-Feb 15-Mar 15-Apr 15-May 15-Jun
Rai
nfa
ll (m
m)
This year
Last year
Average
Hastings: 21 November – 4 December 2015
For the last fortnight: Rainfall (mm): 3.6 ET (mm): 62.4
Soil for the last fortnight: This year (oC): 17.9 Average (oC): 18.6
Cumulative radiation MJ/m2 from 15 Sept Cumulative GDDs from 15
Sept
This Year: 1601.4 415.6
Last Year: 1719.3 316.3
Long term average: 1609.4 410.5
Fortnight Rainfall (mm)
0.0
0.4
0.0 0.0 0.0 0.0 0.0 0.0 0.0 0.0
2.8
0.20.0
0.2
0
5
21-Nov-15 23-Nov-15 25-Nov-15 27-Nov-15 29-Nov-15 1-Dec-15 3-Dec-15
Rai
nfa
ll (m
m)
Cumulative Rainfall from 15 Sept
0
100
200
300
400
500
15-Sep 15-Oct 15-Nov 15-Dec 15-Jan 15-Feb 15-Mar 15-Apr 15-May 15-Jun
Rai
nfa
ll (m
m)
This year
Last year
Average
New Plymouth: 21 November – 4 December 2015
For the last fortnight: Rainfall (mm): 26.6 ET (mm): 53.8
Soil for the last fortnight: This year (oC): X Average (oC): X
Cumulative radiation MJ/m2 from 15 Sept Cumulative GDDs from 15
Sept
This Year: 1546.4 408.9
Last Year: 1529.3 377.9
Long term average: 1605.5 419.4
Fortnight Rainfall (mm)
8.8
11.8
0.0 0.0 0.0 0.0 0.2
2.4
0.0 0.0
3.0
0.0 0.00.4
0
5
10
15
21-Nov-15 23-Nov-15 25-Nov-15 27-Nov-15 29-Nov-15 1-Dec-15 3-Dec-15
Rai
nfa
ll (m
m)
Cumulative Rainfall from 15 Sept
0
250
500
750
1000
15-Sep 15-Oct 15-Nov 15-Dec 15-Jan 15-Feb 15-Mar 15-Apr 15-May 15-Jun
Rai
nfa
ll (m
m)
This year
Last year
Average
Hawera: 21 November – 4 December 2015
For the last fortnight: Rainfall (mm): 45.6 ET (mm): 58.7
Soil for the last fortnight: This year (oC): 15.7 Average (oC): 15.4
Cumulative radiation MJ/m2 from 15 Sept Cumulative GDDs from 15
Sept
This Year: 1550.4 356.8
Last Year: 1521.9 339.1
Long term average: 1502.5 352.5
Fortnight Rainfall (mm)
2.2
8.6
0.0 0.0 0.0 0.0 0.0
25.4
0.2 0.0
5.6
0.0 0.0
3.6
0
5
10
15
20
25
30
21-Nov-15 23-Nov-15 25-Nov-15 27-Nov-15 29-Nov-15 1-Dec-15 3-Dec-15
Rai
nfa
ll (m
m)
Cumulative Rainfall from 15 Sept
0
250
500
750
1000
15-Sep 15-Oct 15-Nov 15-Dec 15-Jan 15-Feb 15-Mar 15-Apr 15-May 15-Jun
Rai
nfa
ll (m
m)
This year
Last year
Average
Wanganui: 21 November – 4 December 2015
For the last fortnight: Rainfall (mm): 18.6 ET (mm): X
Soil for the last fortnight: This year (oC): 17.3 Average (oC): 17.1
Cumulative radiation MJ/m2 from 15 Sept Cumulative GDDs from 15
Sept
This Year: 1501.0 477.7
Last Year: 1587.5 460.6
Long term average: 1490.9 479.2
Fortnight Rainfall (mm)
0.8
2.4
0.0 0.0 0.0 0.0 0.2
7.4
4.4
0.0
2.4
0.0 0.0
1.0
0
5
10
21-Nov-15 23-Nov-15 25-Nov-15 27-Nov-15 29-Nov-15 1-Dec-15 3-Dec-15
Rai
nfa
ll (m
m)
Cumulative Rainfall from 15 Sept
0
250
500
750
1000
15-Sep 15-Oct 15-Nov 15-Dec 15-Jan 15-Feb 15-Mar 15-Apr 15-May 15-Jun
Rai
nfa
ll (m
m)
This year
Last year
Average
Palmerston North: 21 November – 4 December 2015
For the last fortnight: Rainfall (mm): 72 ET (mm): 47.4
Soil for the last fortnight: This year (oC): 16.0 Average (oC): 15.7
Cumulative radiation MJ/m2 from 15 Sept Cumulative GDDs from 15
Sept
This Year: 1362.7 386.0
Last Year: 1363.4 401.4
Long term average: 1396.1 397.7
Fortnight Rainfall (mm)
2.8
8.4
0.0 0.0 0.0
2.0
0.0
25.6
4.2
0.0
13.612.6
0.0
2.8
0
5
10
15
20
25
30
21-Nov-15 23-Nov-15 25-Nov-15 27-Nov-15 29-Nov-15 1-Dec-15 3-Dec-15
Rai
nfa
ll (m
m)
Cumulative Rainfall from 15 Sept
0
250
500
750
1000
15-Sep 15-Oct 15-Nov 15-Dec 15-Jan 15-Feb 15-Mar 15-Apr 15-May 15-Jun
Rai
nfa
ll (m
m)
This year
Last year
Average
Masterton: 21 November – 4 December 2015
For the last fortnight: Rainfall (mm): 10 ET (mm): 49.6
Soil for the last fortnight: This year (oC): X Average (oC): X
Cumulative radiation MJ/m2 from 15 Sept Cumulative GDDs from 15
Sept
This Year: 1526.6 357.6
Last Year: 1707.7 352.8
Long term average: 1609.0 364.5
Fortnight Rainfall (mm)
1.0
0.0 0.0 0.0 0.0 0.0 0.0
7.6
0.2 0.00.4
0.8
0.0 0.00.0
5.0
10.0
21-Nov-15 23-Nov-15 25-Nov-15 27-Nov-15 29-Nov-15 1-Dec-15 3-Dec-15
Rai
nfa
ll (m
m)
Cumulative Rainfall from 15 Sept
0
250
500
750
1000
15-Sep 15-Oct 15-Nov 15-Dec 15-Jan 15-Feb 15-Mar 15-Apr 15-May 15-Jun
Rai
nfa
ll (m
m)
This year
Last year
Average
Takaka: 21 November – 4 December 2015
For the last fortnight: Rainfall (mm): 34 ET (mm): 62.2
Soil for the last fortnight: This year (oC): 16.8 Average (oC): 16.5
Cumulative radiation MJ/m2 from 15 Sept Cumulative GDDs from 15
Sept
This Year: 1701.1 380.1
Last Year: 1753.4 351.1
Long term average: 1568.6 386.1
Fortnight Rainfall (mm)
8.8
0.0 0.0 0.0 0.0 0.0 0.0
3.0
0.0 0.0
10.810.0
1.00.4
0
5
10
15
21-Nov-15 23-Nov-15 25-Nov-15 27-Nov-15 29-Nov-15 1-Dec-15 3-Dec-15
Rai
nfa
ll (m
m)
Cumulative Rainfall from 15 Sept
0
250
500
750
1000
1250
1500
15-Sep 15-Oct 15-Nov 15-Dec 15-Jan 15-Feb 15-Mar 15-Apr 15-May 15-Jun
Rai
nfa
ll (m
m)
This year
Last year
Average
Rangiora: 21 November – 4 December 2015
For the last fortnight: Rainfall (mm): 0 ET (mm): 58.4
Soil for the last fortnight: This year (oC): 14.8 Average (oC): 15.1
Cumulative radiation MJ/m2 from 15 Sept Cumulative GDDs from 15
Sept
This Year: X 329.7
Last Year: X 308.7
Long term average: 1309.6 304.5
Fortnight Rainfall (mm)
0.0 0.0 0.0 0.0 0.0 0.0 0.0 0.0 0.0 0.0 0.0 0.0 0.0 0.00
5
21-Nov-15 23-Nov-15 25-Nov-15 27-Nov-15 29-Nov-15 1-Dec-15 3-Dec-15
Rai
nfa
ll (m
m)
Cumulative Rainfall from 15 Sept
0
250
500
750
1000
15-Sep 15-Oct 15-Nov 15-Dec 15-Jan 15-Feb 15-Mar 15-Apr 15-May 15-Jun
Rai
nfa
ll (m
m)
This year
Series1
Average
Ashburton: 21 November – 4 December 2015
For the last fortnight: Rainfall (mm): 6.2 ET (mm): 58.7
Soil for the last fortnight: This year (oC): 15.9 Average (oC): 14.3
Cumulative radiation MJ/m2 from 15 Sept Cumulative GDDs from 15
Sept
This Year: 1526.9 315.6
Last Year: 1569.9 252.5
Long term average: 1491.8 280.1
Fortnight Rainfall (mm)
0.0 0.0 0.0 0.0 0.0 0.0 0.0
3.0
0.0 0.0 0.0 0.0 0.0
3.2
0
5
21-Nov-15 23-Nov-15 25-Nov-15 27-Nov-15 29-Nov-15 1-Dec-15 3-Dec-15
Rai
nfa
ll (m
m)
Cumulative Rainfall from 15 Sept
0
250
500
750
1000
15-Sep 15-Oct 15-Nov 15-Dec 15-Jan 15-Feb 15-Mar 15-Apr 15-May 15-Jun
Rai
nfa
ll (m
m)
This year
Last year
Average
Timaru: 21 November – 4 December 2015
For the last fortnight: Rainfall (mm): 10.2 ET (mm): 57.8
Soil for the last fortnight: This year (oC): X Average (oC): X
Cumulative radiation MJ/m2 from 15 Sept Cumulative GDDs from 15
Sept
This Year: 1590.6 319.1
Last Year: 1532.4 231.4
Long term average: 1455.5 246.3
Fortnight Rainfall (mm)
0.60.2 0.0 0.0 0.0 0.0 0.2
6.4
0.0 0.0 0.0 0.0 0.0
2.8
0
5
10
21-Nov-15 23-Nov-15 25-Nov-15 27-Nov-15 29-Nov-15 1-Dec-15 3-Dec-15
Rai
nfa
ll (m
m)