FIT-Asia/2−IP/07 28 – 29 March 2013 International Civil Aviation Organization The 2 nd Meeting of the Future Air Navigation Systems Interoperability Team-Asia (FIT-Asia/2) Bangkok, Thailand, 28 – 29 March 2013 Agenda Item 4: Data Link Guidance Material GOLD Appendix D – Proposed Changes (Presented by Airways New Zealand) SUMMARY This paper presents the proposed changes to guidance material on post-implementation monitoring in Appendix D of the Global Operational Datalink Document. This paper relates to – Strategic Objectives: A: Safety – Enhance global civil aviation safety Global Plan Initiatives: GPI-17 Data link applications GPI-22 Communication infrastructure 1. INTRODUCTION 1.1 The guidance material in GOLD Appendix D “Post Implementation Monitoring” was written in 2009 during the early development of RCP/RSP based post implementation monitoring. The guidance material has been updated and provides additional guidance in a number of areas. These changes reflect the on-going development of RCP/RSP based post-implementation monitoring. 1.2 The revisions also include incorporation of European ATN Baseline 1 CPDLC material. 1.3 The draft Appendix D attached in Attachment 1 of this paper is the GOLD v1.4.5 review version that was distributed for final review and comment by stakeholders. 2. DISCUSSION 2.1 Paragraph D-1 ANSP Data Collections and Analysis and Paragraph D.1.3 Guidance on frequency of monitoring by ANSP: “ANSP that are currently monitoring data link performance have found that a monthly monitoring interval usually provides enough data points to detect any performance variation and is adequate for post implementation monitoring.” “To enable adequate system performance monitoring ANSP should at minimum perform a monthly analysis of CPDLC RCP and ADS-C performance data.”
Transcript
FIT-Asia/2−IP/07
28 – 29 March 2013
International Civil Aviation Organization
The 2nd
Meeting of the Future Air Navigation Systems Interoperability
Team-Asia (FIT-Asia/2)
Bangkok, Thailand, 28 – 29 March 2013
Agenda Item 4: Data Link Guidance Material
GOLD Appendix D – Proposed Changes
(Presented by Airways New Zealand)
SUMMARY
This paper presents the proposed changes to guidance material on post-implementation
monitoring in Appendix D of the Global Operational Datalink Document.
This paper relates to –
Strategic Objectives:
A: Safety – Enhance global civil aviation safety
Global Plan Initiatives: GPI-17 Data link applications
GPI-22 Communication infrastructure
1. INTRODUCTION
1.1 The guidance material in GOLD Appendix D “Post Implementation Monitoring” was
written in 2009 during the early development of RCP/RSP based post implementation monitoring.
The guidance material has been updated and provides additional guidance in a number of areas. These
changes reflect the on-going development of RCP/RSP based post-implementation monitoring.
1.2 The revisions also include incorporation of European ATN Baseline 1 CPDLC material.
1.3 The draft Appendix D attached in Attachment 1 of this paper is the GOLD v1.4.5
review version that was distributed for final review and comment by stakeholders.
2. DISCUSSION
2.1 Paragraph D-1 ANSP Data Collections and Analysis and Paragraph D.1.3 Guidance on
frequency of monitoring by ANSP:
“ANSP that are currently monitoring data link performance have found that a
monthly monitoring interval usually provides enough data points to detect any
performance variation and is adequate for post implementation monitoring.”
“To enable adequate system performance monitoring ANSP should at minimum
perform a monthly analysis of CPDLC RCP and ADS-C performance data.”
FIT-Asia/2−IP07
2
2.2 Paragraph D.1.1.1.1 CPDLC Controller initiated transactions. Expanded guidance on
what message set to use:
“Typically all intervention messages with a W/U response attribute, except for
UM91, and UM92), contact instructions (UM117-UM123) and UM116
“RESUME NORMAL SPEED” messages are assessed. Data analysis has shown
that Pilot Operational Response Time (PORT) to these non-intervention
messages can be significantly skewed and will significantly impact measured
ACP. However, the removal of all contact instructions (UM117– UM123) will
drastically reduce the monthly data set for some smaller ANSP and make it
difficult to assess ACTP for individual fleets or aircraft on a monthly basis. For
this reason some ANSP retain these (UM117 – Um123) transactions when
assessing ACTP. ANSP should decide on a data set that provides them with the
best performance modelling for their operation.”
2.3 Paragraph D.1.1.1.1 CPDLC Controller initiated transactions. Guidance provided on
filtering zero or negative PORT transactions.
“All transactions with zero or negative crew response times should be filtered from data
prior to analysis. The time sequence diagram below in Figure D- 2 illustrates the issue.
Errors can also arise if there are delays between the ANSP and the CSP on the uplink
path. These delays will result in excessive calculated PORT and skewed ACP.”
2.4 Paragraph D1.1.3 Data record for each CPDLC transaction and.D. 3.1 Periodic
Reporting. Provides guidance on what should be provided to regional CRA for analysis.
“Because different ANSPs may use different data sets for analysis within their
area of interest the data sent to a regional state monitoring agency should at
minimum contain all transactions that contain a WILCO response. The regional
monitoring agency will filter transactions as agreed by their regional forum.”
“It is recommended that regions implement monthly performance reporting to
obtain system performance metrics. These reports will provide data on observed
availability, CPDLC transaction time and ADS-C surveillance data transit time
as described herein.”
2.5 D.1.3.3.CPDLC Performance Analysis. Section provides guidance on other types of
graphs and tabular analysis that can be used. Refer Figure D-5 through D-10 and associated text.
2.6 D.1.3.6 Assessing periodic monitoring results. This is a new section containing guidance
on assessing monitoring results. A case study is described in D.1.3.6.4:
“The 95% and 99.9% criteria are provided as operationally significant
benchmarks against which the surveillance and communication applications
supporting ATM functions can be assessed.
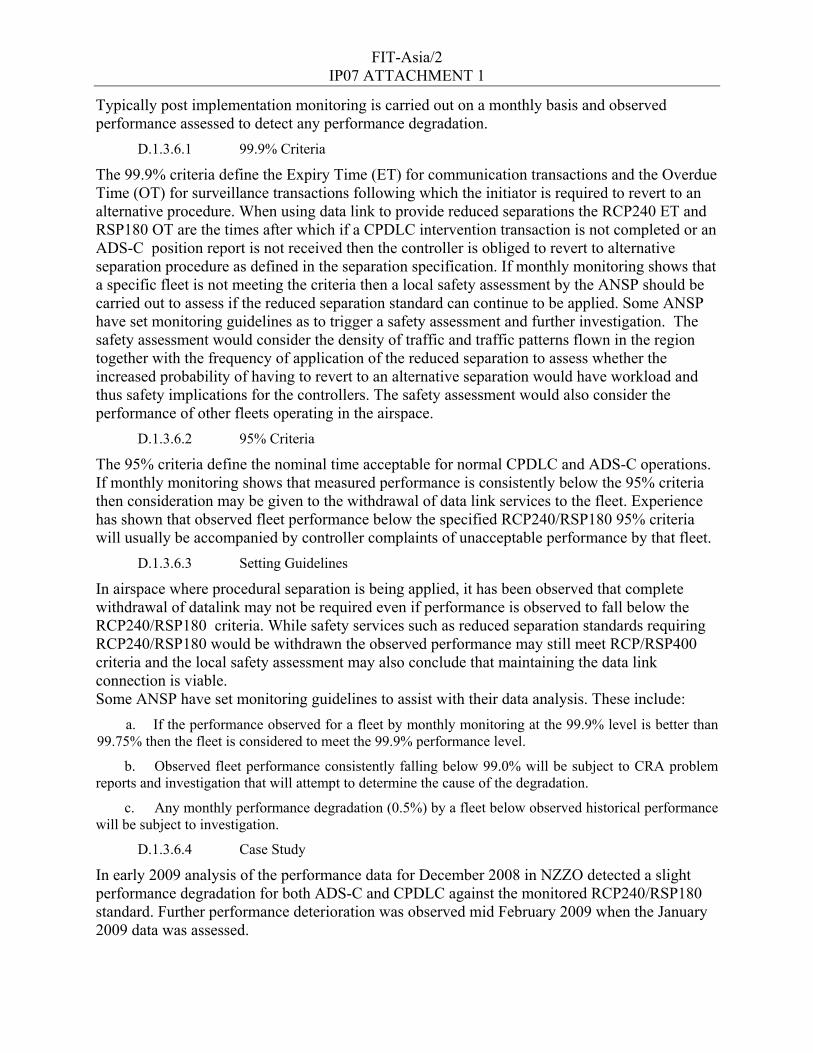
Typically post implementation monitoring is carried out on a monthly basis and
observed performance assessed to detect any performance degradation.
D.1.3.6.1 99.9% Criteria
The 99.9% criteria define the Expiry Time (ET) for communication transactions
and the Overdue Time (OT) for surveillance transactions following which the
initiator is required to revert to an alternative procedure. When using data link
FIT-Asia/2−IP07
3
to provide reduced separations the RCP240 ET and RSP180 OT are the times
after which if a CPDLC intervention transaction is not completed or an ADS-C
position report is not received then the controller is obliged to revert to
alternative separation procedure as defined in the separation specification. If
monthly monitoring shows that a specific fleet is not meeting the criteria then a
local safety assessment by the ANSP should be carried out to assess if the
reduced separation standard can continue to be applied. Some ANSP have set
monitoring guidelines as to trigger a safety assessment and further investigation.
The safety assessment would consider the density of traffic and traffic patterns
flown in the region together with the frequency of application of the reduced
separation to assess whether the increased probability of having to revert to an
alternative separation would have workload and thus safety implications for the
controllers. The safety assessment would also consider the performance of other
fleets operating in the airspace.
D.1.3.6.1 95% Criteria
The 95% criteria define the nominal time acceptable for normal CPDLC and
ADS-C operations. If monthly monitoring shows that measured performance is
consistently below the 95% criteria then consideration may be given to the
withdrawal of data link services to the fleet. Experience has shown that observed
fleet performance below the specified RCP240/RSP180 95% criteria will usually
be accompanied by controller complaints of unacceptable performance by that
fleet.
D.1.3.6.2 Setting Guidelines
In airspace where procedural separation is being applied, it has been observed
that complete withdrawal of datalink may not be required even if performance is
observed to fall below the RCP240/RSP180 criteria. While safety services such
as reduced separation standards requiring RCP240/RSP180 would be
withdrawn the observed performance may still meet RCP/RSP400 criteria and
the local safety assessment may also conclude that maintaining the data link
connection is viable.
Some ANSP have set monitoring guidelines to assist with their data analysis.
These include:
3. If the performance observed for a fleet by monthly monitoring at the 99.9% level is
better than 99.75% then the fleet is considered to meet the 99.9% performance level.
4. Observed fleet performance consistently falling below 99.0% will be subject to CRA
problem reports and investigation that will attempt to determine the cause of the
degradation.
5. Any monthly performance degradation (0.5%) by a fleet below observed historical
performance will be subject to investigation.”
2.8 D.3.1.1 Reporting on availability. Provided guidance on providing a graphical
representation of availability in Figure D-21 and D-22.
FIT-Asia/2−IP07
4
3. ACTION BY THE MEETING
3.1 The meeting is invited to:
a) note the information contained in this paper; and
b) discuss any relevant matters as appropriate.
……………
FIT-Asia/2 IP07 ATTACHMENT 1
DRAFT GOLD v1.4.5 Appendix D Post-implementation monitoring and corrective action
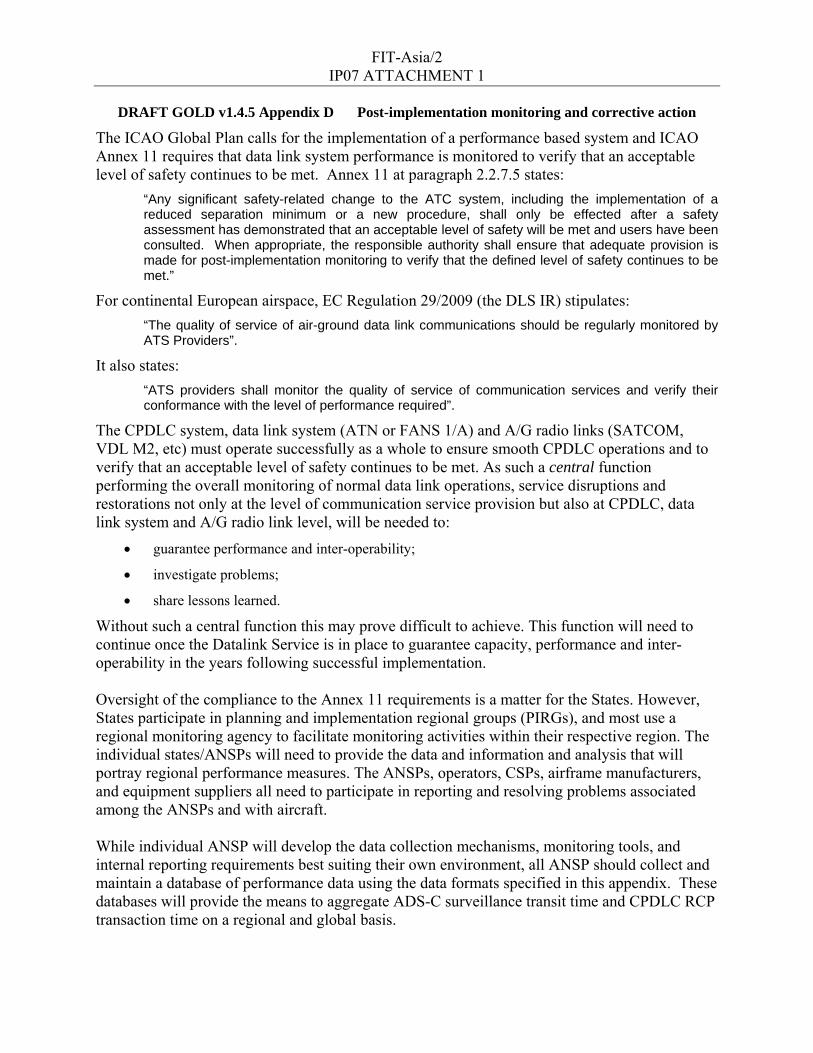
The ICAO Global Plan calls for the implementation of a performance based system and ICAO Annex 11 requires that data link system performance is monitored to verify that an acceptable level of safety continues to be met. Annex 11 at paragraph 2.2.7.5 states:
“Any significant safety-related change to the ATC system, including the implementation of a reduced separation minimum or a new procedure, shall only be effected after a safety assessment has demonstrated that an acceptable level of safety will be met and users have been consulted. When appropriate, the responsible authority shall ensure that adequate provision is made for post-implementation monitoring to verify that the defined level of safety continues to be met.”
For continental European airspace, EC Regulation 29/2009 (the DLS IR) stipulates: “The quality of service of air-ground data link communications should be regularly monitored by ATS Providers”.
It also states: “ATS providers shall monitor the quality of service of communication services and verify their conformance with the level of performance required”.
The CPDLC system, data link system (ATN or FANS 1/A) and A/G radio links (SATCOM, VDL M2, etc) must operate successfully as a whole to ensure smooth CPDLC operations and to verify that an acceptable level of safety continues to be met. As such a central function performing the overall monitoring of normal data link operations, service disruptions and restorations not only at the level of communication service provision but also at CPDLC, data link system and A/G radio link level, will be needed to:
• guarantee performance and inter-operability;
• investigate problems;
• share lessons learned.
Without such a central function this may prove difficult to achieve. This function will need to continue once the Datalink Service is in place to guarantee capacity, performance and inter-operability in the years following successful implementation. Oversight of the compliance to the Annex 11 requirements is a matter for the States. However, States participate in planning and implementation regional groups (PIRGs), and most use a regional monitoring agency to facilitate monitoring activities within their respective region. The individual states/ANSPs will need to provide the data and information and analysis that will portray regional performance measures. The ANSPs, operators, CSPs, airframe manufacturers, and equipment suppliers all need to participate in reporting and resolving problems associated among the ANSPs and with aircraft. While individual ANSP will develop the data collection mechanisms, monitoring tools, and internal reporting requirements best suiting their own environment, all ANSP should collect and maintain a database of performance data using the data formats specified in this appendix. These databases will provide the means to aggregate ADS-C surveillance transit time and CPDLC RCP transaction time on a regional and global basis.
FIT-Asia/2 IP07 ATTACHMENT 1
Note.— Unlike DO290/ED120 states. The EUR region did not specify an RCP type, but has used TRN as basis for end-to-end performance and allocation determination. Certification and approval, and post-implementation monitoring are based on these parameters.
Monitoring of data communications performance in terms of RCP and RSP is an important part of the performance based system described in the ICAO global plan. To successfully achieve this performance monitoring on a global scale will require the use of a common data set. It is only through this common data set that RCP and RSP data can be aggregated from an ANSP level through to a regional monitoring agency level and then to global level. This aggregation of performance data is in accordance with the guidelines provided in ICAO Doc 9883 Manual on Global Performance of the Air Navigation System. In addition to monitoring data communications performance future development of data link communications applications would be assisted if existing message use statistics were available. ANSP should maintain message use statistics. This appendix contains the following guidance material:
a. ANSP data collection and analysis - This section defines a common data reporting format. Guidance material is included on how to obtain the required data points from the FANS 1/A ACARS and ATN B1 messages and on the calculation of actual communication performance (ACP), actual communication technical performance (ACTP), pilot operational response time (PORT), actual surveillance performance (ASP), and how they are calculated. Examples of the type of analysis that can be carried out at an ANSP level are also included. Issues regarding data filtering are discussed including guidance on how to manage this.
b. Problem reporting and resolution – This section provides guidance on the problem identification and resolution process
c. Regional performance monitoring – This section provides guidance on the monitoring of ADS-C actual surveillance performance and CPDLC actual communication performance at a regional level.
D.1 ANSP data collection and analysis
Data link performance requirements for the application of reduced separation standards, as defined in ICAO Doc 4444, are contained in the following documents:
a. RTCA DO-306/EUROCAE ED 122 – Oceanic SPR standard. These requirements are specified in terms of RCP and RSP.
b. RTCA DO 290/EUROCAE ED 120 – Continental SPR standard. The EUR instantiation of DO290/ED120 comprises the performance requirements for DLIC (Logon and Contact) and CPDLC (ACM, ACL).
ANSP that are currently monitoring data link performance have found that a monthly monitoring interval usually provides enough data points to detect any performance variation and is adequate for post implementation monitoring.
FIT-Asia/2 IP07 ATTACHMENT 1
D.1.1 ANSP data collection for CPDLC application
This section provides guidance on data collection and performance measurement for the CPDLC application. For Procedural airspace, the measurements are taken from CPDLC ground-initiated transactions. For EUR Continental airspace, the following measurements are taken:
a. DLIC-contact transactions;
b. CPDLC ground-initiated and air-initiated transactions.
Note.— Air-initiated and ground initiated transactions will be analysed separately since they have different performance requirements (refer to Error! Reference source not found.).
D.1.1.1 Measuring CPDLC communication performance
CPDLC analysis is based on the calculation of actual communication performance (ACP) used to monitor RCP time allocation for communication transaction (TRN), actual communications technical performance (ACTP) used to monitor required communication technical performance (RCTP) time allocation, and pilot operational response time (PORT) used to monitor the responder performance criteria of the transaction.
Note.— For EUR Region, ANSPs that accommodate FANS 1/A aircraft, monitor the performance of ATN aircraft separately from FANS1/A aircraft. As the underlying technology is different.
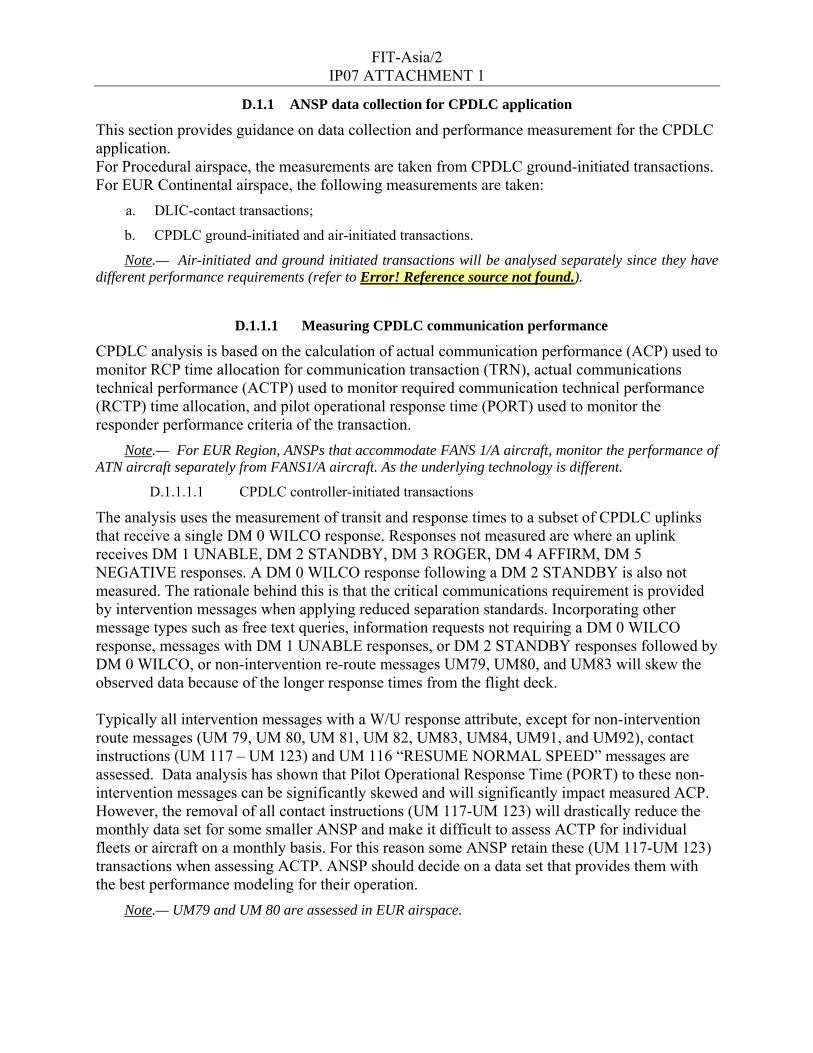
D.1.1.1.1 CPDLC controller-initiated transactions
The analysis uses the measurement of transit and response times to a subset of CPDLC uplinks that receive a single DM 0 WILCO response. Responses not measured are where an uplink receives DM 1 UNABLE, DM 2 STANDBY, DM 3 ROGER, DM 4 AFFIRM, DM 5 NEGATIVE responses. A DM 0 WILCO response following a DM 2 STANDBY is also not measured. The rationale behind this is that the critical communications requirement is provided by intervention messages when applying reduced separation standards. Incorporating other message types such as free text queries, information requests not requiring a DM 0 WILCO response, messages with DM 1 UNABLE responses, or DM 2 STANDBY responses followed by DM 0 WILCO, or non-intervention re-route messages UM79, UM80, and UM83 will skew the observed data because of the longer response times from the flight deck. Typically all intervention messages with a W/U response attribute, except for non-intervention route messages (UM 79, UM 80, UM 81, UM 82, UM83, UM84, UM91, and UM92), contact instructions (UM 117 – UM 123) and UM 116 “RESUME NORMAL SPEED” messages are assessed. Data analysis has shown that Pilot Operational Response Time (PORT) to these non-intervention messages can be significantly skewed and will significantly impact measured ACP. However, the removal of all contact instructions (UM 117-UM 123) will drastically reduce the monthly data set for some smaller ANSP and make it difficult to assess ACTP for individual fleets or aircraft on a monthly basis. For this reason some ANSP retain these (UM 117-UM 123) transactions when assessing ACTP. ANSP should decide on a data set that provides them with the best performance modeling for their operation.
Note.— UM79 and UM 80 are assessed in EUR airspace.
FIT-Asia/2 IP07 ATTACHMENT 1
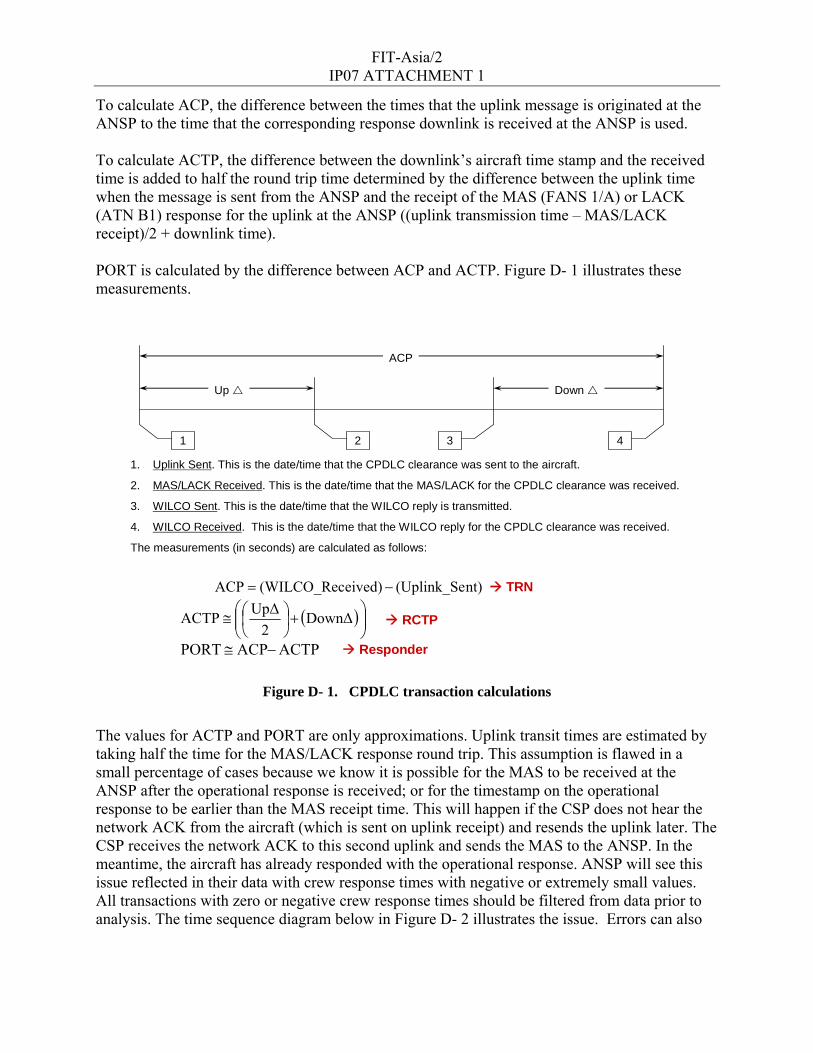
To calculate ACP, the difference between the times that the uplink message is originated at the ANSP to the time that the corresponding response downlink is received at the ANSP is used. To calculate ACTP, the difference between the downlink’s aircraft time stamp and the received time is added to half the round trip time determined by the difference between the uplink time when the message is sent from the ANSP and the receipt of the MAS (FANS 1/A) or LACK (ATN B1) response for the uplink at the ANSP ((uplink transmission time – MAS/LACK receipt)/2 + downlink time). PORT is calculated by the difference between ACP and ACTP. Figure D- 1 illustrates these measurements.
Figure D- 1. CPDLC transaction calculations
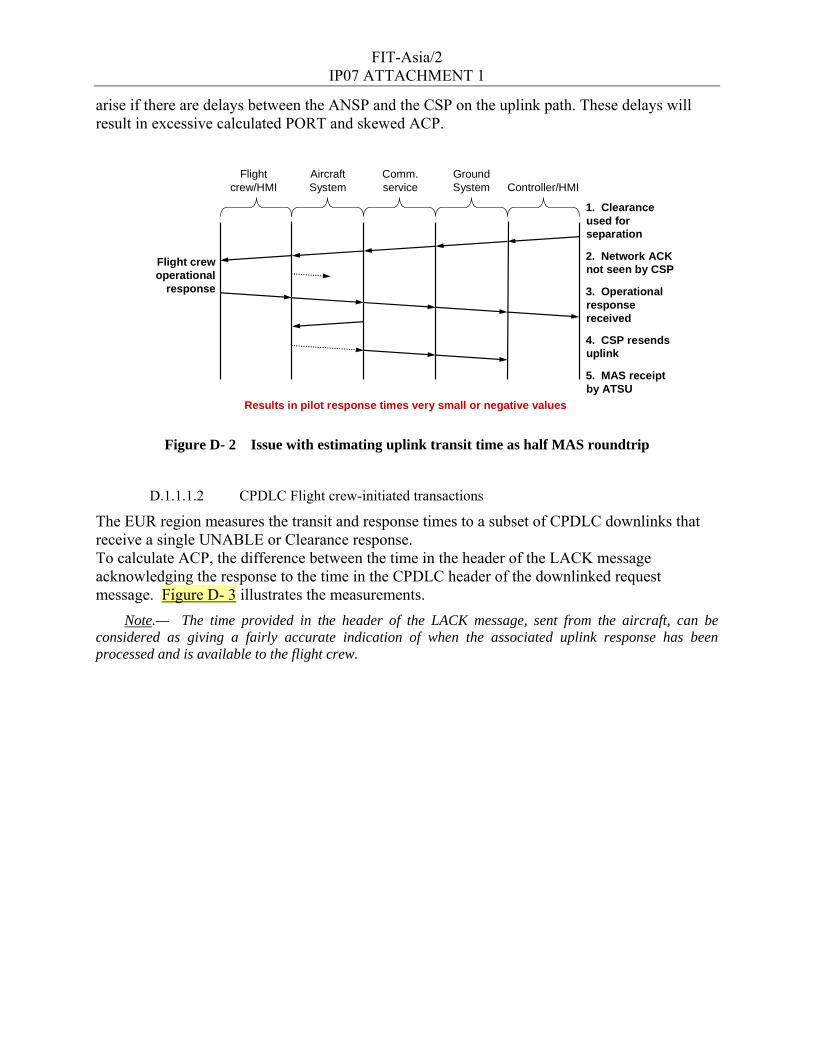
The values for ACTP and PORT are only approximations. Uplink transit times are estimated by taking half the time for the MAS/LACK response round trip. This assumption is flawed in a small percentage of cases because we know it is possible for the MAS to be received at the ANSP after the operational response is received; or for the timestamp on the operational response to be earlier than the MAS receipt time. This will happen if the CSP does not hear the network ACK from the aircraft (which is sent on uplink receipt) and resends the uplink later. The CSP receives the network ACK to this second uplink and sends the MAS to the ANSP. In the meantime, the aircraft has already responded with the operational response. ANSP will see this issue reflected in their data with crew response times with negative or extremely small values. All transactions with zero or negative crew response times should be filtered from data prior to analysis. The time sequence diagram below in Figure D- 2 illustrates the issue. Errors can also
1 42 3
ACP
Up Down
nt)(Uplink_Seeived)(WILCO_RecACP −=
( )⎟⎟⎠
⎞⎜⎜⎝
⎛+⎟
⎠⎞
⎜⎝⎛≅ DownΔ
2UpΔACTP
ACTPACPPORT −≅
1. Uplink Sent. This is the date/time that the CPDLC clearance was sent to the aircraft.
2. MAS/LACK Received. This is the date/time that the MAS/LACK for the CPDLC clearance was received.
3. WILCO Sent. This is the date/time that the WILCO reply is transmitted.
4. WILCO Received. This is the date/time that the WILCO reply for the CPDLC clearance was received.
The measurements (in seconds) are calculated as follows:
TRN
RCTP
Responder
FIT-Asia/2 IP07 ATTACHMENT 1
arise if there are delays between the ANSP and the CSP on the uplink path. These delays will result in excessive calculated PORT and skewed ACP.
Figure D- 2 Issue with estimating uplink transit time as half MAS roundtrip
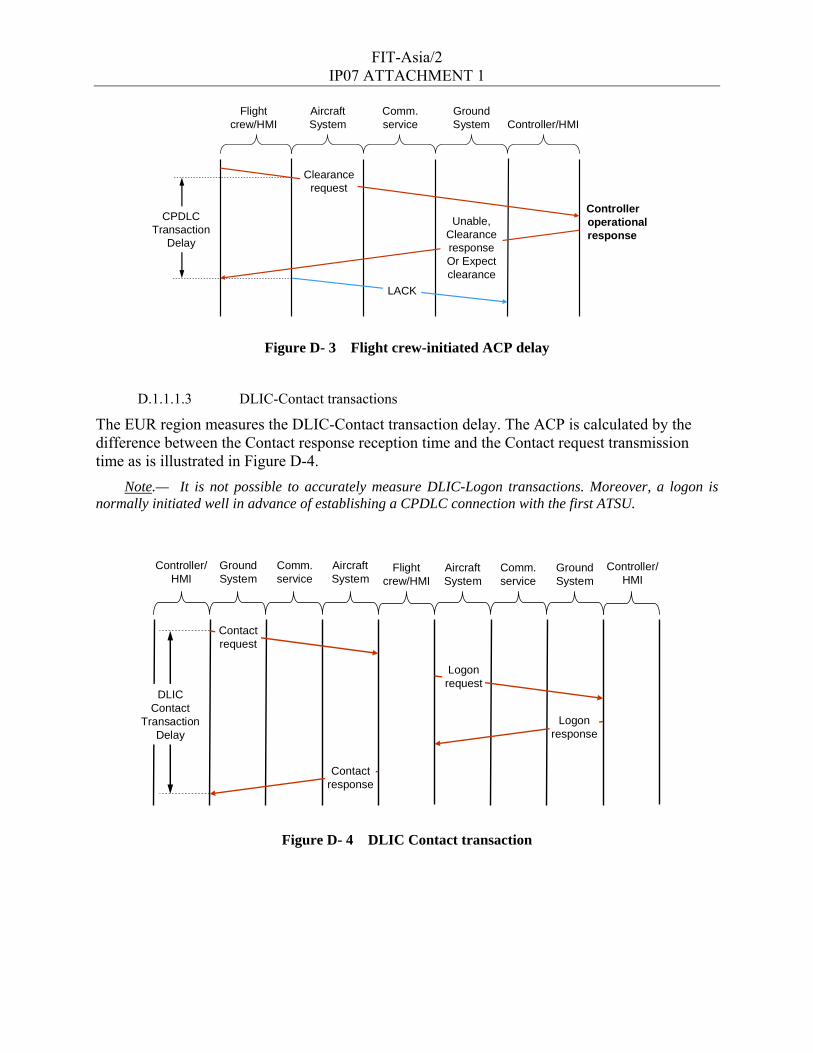
The EUR region measures the transit and response times to a subset of CPDLC downlinks that receive a single UNABLE or Clearance response. To calculate ACP, the difference between the time in the header of the LACK message acknowledging the response to the time in the CPDLC header of the downlinked request message. Figure D- 3 illustrates the measurements.
Note.— The time provided in the header of the LACK message, sent from the aircraft, can be considered as giving a fairly accurate indication of when the associated uplink response has been processed and is available to the flight crew.
Aircraft System
Flight crew/HMI
Comm. service Controller/HMI
Ground System
Flight crew operational
response
1. Clearance used for separation
5. MAS receipt by ATSU
2. Network ACK not seen by CSP
3. Operational response received
4. CSP resends uplink
Results in pilot response times very small or negative values
FIT-Asia/2 IP07 ATTACHMENT 1
Figure D- 3 Flight crew-initiated ACP delay
D.1.1.1.3 DLIC-Contact transactions
The EUR region measures the DLIC-Contact transaction delay. The ACP is calculated by the difference between the Contact response reception time and the Contact request transmission time as is illustrated in Figure D-4.
Note.— It is not possible to accurately measure DLIC-Logon transactions. Moreover, a logon is normally initiated well in advance of establishing a CPDLC connection with the first ATSU.
Figure D- 4 DLIC Contact transaction
Aircraft System
Flight crew/HMI
Comm. service Controller/HMI
Ground System
Clearance request
CPDLC Transaction
Delay
LACK
Unable, Clearance responseOr Expect clearance
Controller operational response
Aircraft System
Flight crew/HMI
Comm. service
Controller/HMI
Ground System
Aircraft System
Comm. service
Ground System
Controller/HMI
Contact request
Contact response
Logonrequest
Logonresponse
DLIC Contact
TransactionDelay
FIT-Asia/2 IP07 ATTACHMENT 1
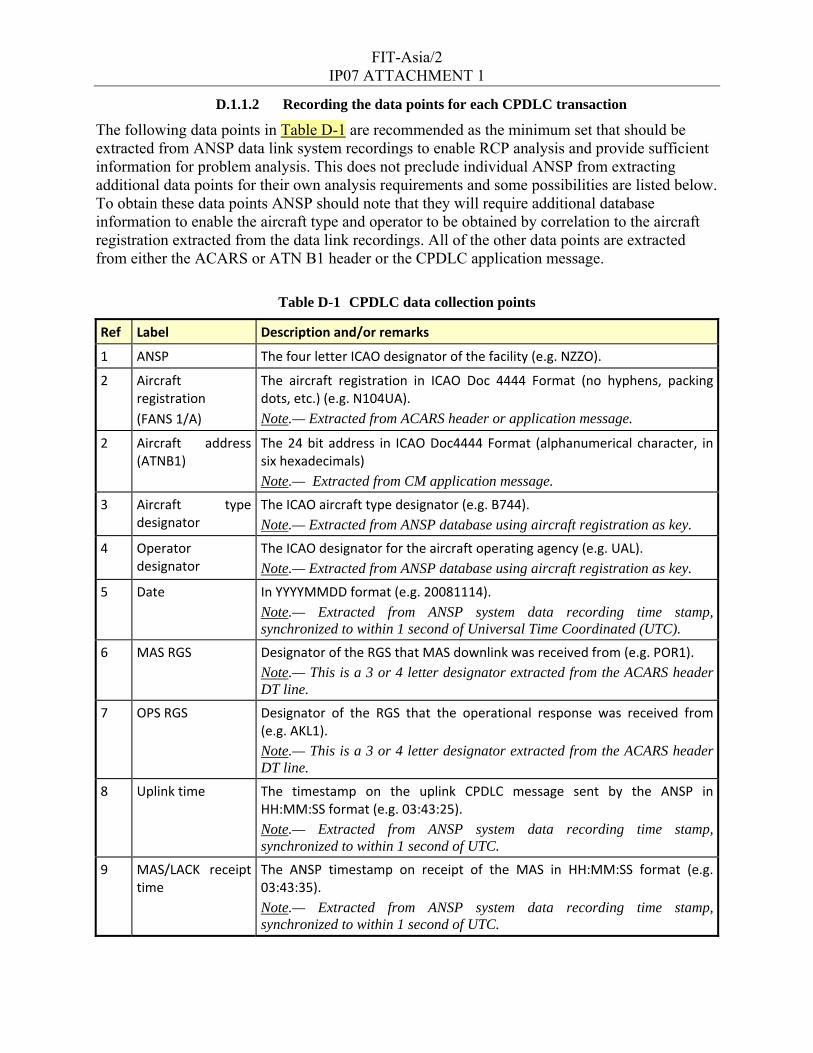
D.1.1.2 Recording the data points for each CPDLC transaction
The following data points in Table D-1 are recommended as the minimum set that should be extracted from ANSP data link system recordings to enable RCP analysis and provide sufficient information for problem analysis. This does not preclude individual ANSP from extracting additional data points for their own analysis requirements and some possibilities are listed below. To obtain these data points ANSP should note that they will require additional database information to enable the aircraft type and operator to be obtained by correlation to the aircraft registration extracted from the data link recordings. All of the other data points are extracted from either the ACARS or ATN B1 header or the CPDLC application message.
Table D-1 CPDLC data collection points
Ref Label Description and/or remarks
1 ANSP The four letter ICAO designator of the facility (e.g. NZZO).
2 Aircraft registration (FANS 1/A)
The aircraft registration in ICAO Doc 4444 Format (no hyphens, packing dots, etc.) (e.g. N104UA). Note.— Extracted from ACARS header or application message.
2 Aircraft address (ATNB1)
The 24 bit address in ICAO Doc4444 Format (alphanumerical character, in six hexadecimals) Note.— Extracted from CM application message.
3 Aircraft type designator
The ICAO aircraft type designator (e.g. B744). Note.— Extracted from ANSP database using aircraft registration as key.
4 Operator designator
The ICAO designator for the aircraft operating agency (e.g. UAL). Note.— Extracted from ANSP database using aircraft registration as key.
5 Date In YYYYMMDD format (e.g. 20081114). Note.— Extracted from ANSP system data recording time stamp, synchronized to within 1 second of Universal Time Coordinated (UTC).
6 MAS RGS Designator of the RGS that MAS downlink was received from (e.g. POR1). Note.— This is a 3 or 4 letter designator extracted from the ACARS header DT line.
7 OPS RGS Designator of the RGS that the operational response was received from (e.g. AKL1). Note.— This is a 3 or 4 letter designator extracted from the ACARS header DT line.
8 Uplink time The timestamp on the uplink CPDLC message sent by the ANSP in HH:MM:SS format (e.g. 03:43:25). Note.— Extracted from ANSP system data recording time stamp, synchronized to within 1 second of UTC.
9 MAS/LACK receipt time
The ANSP timestamp on receipt of the MAS in HH:MM:SS format (e.g. 03:43:35). Note.— Extracted from ANSP system data recording time stamp, synchronized to within 1 second of UTC.
FIT-Asia/2 IP07 ATTACHMENT 1
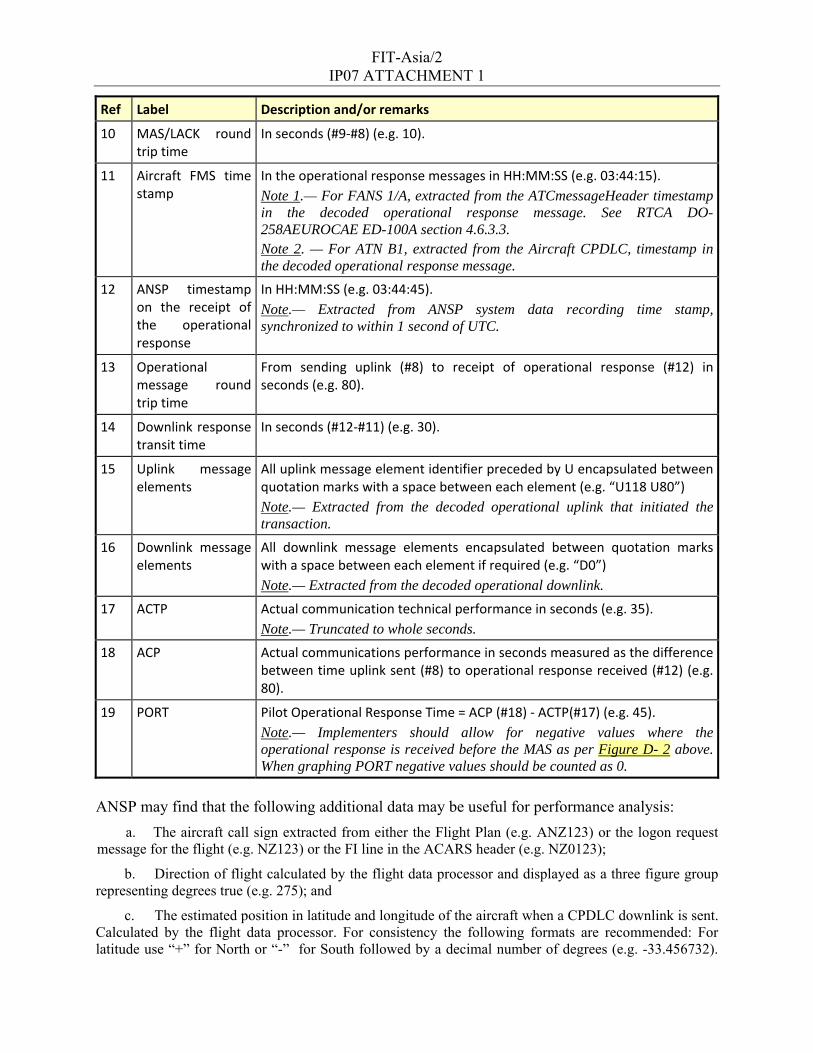
Ref Label Description and/or remarks
10 MAS/LACK round trip time
In seconds (#9‐#8) (e.g. 10).
11 Aircraft FMS time stamp
In the operational response messages in HH:MM:SS (e.g. 03:44:15). Note 1.— For FANS 1/A, extracted from the ATCmessageHeader timestamp in the decoded operational response message. See RTCA DO-258AEUROCAE ED-100A section 4.6.3.3. Note 2. — For ATN B1, extracted from the Aircraft CPDLC, timestamp in the decoded operational response message.
12 ANSP timestamp on the receipt of the operational response
In HH:MM:SS (e.g. 03:44:45). Note.— Extracted from ANSP system data recording time stamp, synchronized to within 1 second of UTC.
13 Operational message round trip time
From sending uplink (#8) to receipt of operational response (#12) in seconds (e.g. 80).
14 Downlink response transit time
In seconds (#12‐#11) (e.g. 30).
15 Uplink message elements
All uplink message element identifier preceded by U encapsulated between quotation marks with a space between each element (e.g. “U118 U80”) Note.— Extracted from the decoded operational uplink that initiated the transaction.
16 Downlink message elements
All downlink message elements encapsulated between quotation marks with a space between each element if required (e.g. “D0”) Note.— Extracted from the decoded operational downlink.
17 ACTP Actual communication technical performance in seconds (e.g. 35). Note.— Truncated to whole seconds.
18 ACP Actual communications performance in seconds measured as the difference between time uplink sent (#8) to operational response received (#12) (e.g. 80).
19 PORT Pilot Operational Response Time = ACP (#18) ‐ ACTP(#17) (e.g. 45). Note.— Implementers should allow for negative values where the operational response is received before the MAS as per Figure D- 2 above. When graphing PORT negative values should be counted as 0.
ANSP may find that the following additional data may be useful for performance analysis:
a. The aircraft call sign extracted from either the Flight Plan (e.g. ANZ123) or the logon request message for the flight (e.g. NZ123) or the FI line in the ACARS header (e.g. NZ0123);
b. Direction of flight calculated by the flight data processor and displayed as a three figure group representing degrees true (e.g. 275); and
c. The estimated position in latitude and longitude of the aircraft when a CPDLC downlink is sent. Calculated by the flight data processor. For consistency the following formats are recommended: For latitude use “+” for North or “-” for South followed by a decimal number of degrees (e.g. -33.456732).
FIT-Asia/2 IP07 ATTACHMENT 1
For longitude use “+” for East or “-” for West followed by a decimal number of degrees (e.g. +173.276554).
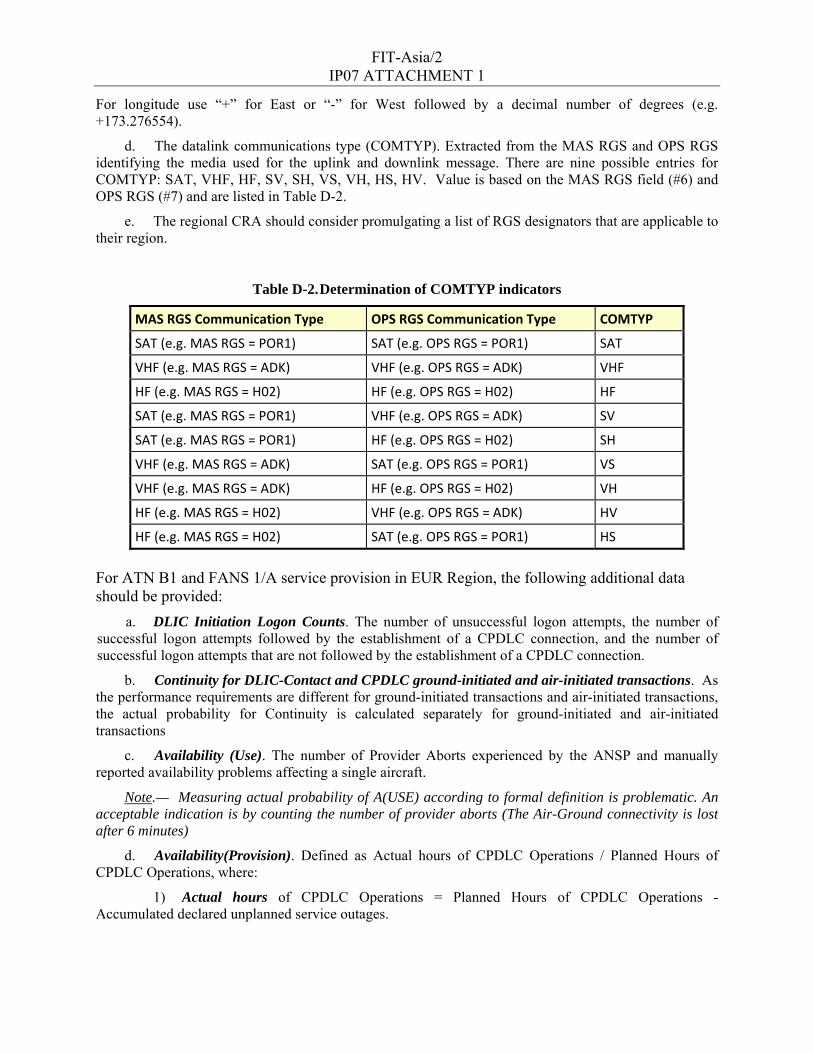
d. The datalink communications type (COMTYP). Extracted from the MAS RGS and OPS RGS identifying the media used for the uplink and downlink message. There are nine possible entries for COMTYP: SAT, VHF, HF, SV, SH, VS, VH, HS, HV. Value is based on the MAS RGS field (#6) and OPS RGS (#7) and are listed in Table D-2.
e. The regional CRA should consider promulgating a list of RGS designators that are applicable to their region.
Table D-2. Determination of COMTYP indicators
MAS RGS Communication Type OPS RGS Communication Type COMTYP
SAT (e.g. MAS RGS = POR1) SAT (e.g. OPS RGS = POR1) SAT
HF (e.g. MAS RGS = H02) SAT (e.g. OPS RGS = POR1) HS
For ATN B1 and FANS 1/A service provision in EUR Region, the following additional data should be provided:
a. DLIC Initiation Logon Counts. The number of unsuccessful logon attempts, the number of successful logon attempts followed by the establishment of a CPDLC connection, and the number of successful logon attempts that are not followed by the establishment of a CPDLC connection.
b. Continuity for DLIC-Contact and CPDLC ground-initiated and air-initiated transactions. As the performance requirements are different for ground-initiated transactions and air-initiated transactions, the actual probability for Continuity is calculated separately for ground-initiated and air-initiated transactions
c. Availability (Use). The number of Provider Aborts experienced by the ANSP and manually reported availability problems affecting a single aircraft.
Note.— Measuring actual probability of A(USE) according to formal definition is problematic. An acceptable indication is by counting the number of provider aborts (The Air-Ground connectivity is lost after 6 minutes)
d. Availability(Provision). Defined as Actual hours of CPDLC Operations / Planned Hours of CPDLC Operations, where:
1) Actual hours of CPDLC Operations = Planned Hours of CPDLC Operations - Accumulated declared unplanned service outages.
FIT-Asia/2 IP07 ATTACHMENT 1
2) Planned Hours of CPDLC Operations = 24x7 operations over a certain period – planned service outages
3) Accumulated declared unplanned service outages = sum of all partial failures (affecting multiple aircraft) or total failure (affecting all aircraft) over a certain period.
4) Unplanned service outages affecting more than one aircraft are due to problems, originated from e.g. FDP, ACSP, VDL GS, router
e. Deployment indicators using:
1) Fleet Equipage. The percentage of the aircraft fleet equipped to use CPDLC.
2) Fleet Usage. The percentage of the aircraft fleet equipped to use CPDLC that are actually using CPDLC operationally.
f. System health indicators, using:
1) User Aborts. The number of user aborts.
2) Error messages. The number of different types of error message.
3) Message Usage. The number of different ACL and ACM messages sent.
4) Transport level (TP4) retries (ATN B1). The number of uplink retries per ground end-system identifying which aircraft were involved, along with the ratio of the number of uplink TP4 retransmissions to the number of successfully transmitted Data TPDUs per ground end- system. Monitoring the rate of TP4 retries for each system on the ground and identifying which aircraft are involved will allow the identification of problems occurring within the network/ground system or with a particular aircraft.
Note.— A TP4 retry could occur as the result of i) temporary delays , ii) unavailability of a component of the network, iii) a dysfunctional VDL handoff or iv) a problem in an end- system (ATSU or avionics).
5) Failed transport connection attempts (ATN B1). The number of failed transport connection attempts measured per ground end-system identifying which aircraft were involved. Monitoring the number of failed attempts to establish a transport level connection will give an indication of problems with the slightly longer term availability of one of the end-systems or the underlying network.
6) TP4 Round Trip Delay (ATN B1). The time taken from the transmission of a Data TPDU to its acknowledgement.
g. Inconsistency in flight plan and log on association. The number of inconsistencies found in flight plan - logon association criteria (i.e Flight Id/ICAO Code,datalink equipment&capability in item 10a).
ANSP may find that the following additional data may be useful for performance analysis: h. Air-ground VDLM2 data. CSP sends VDLM2 data to the CRO, which may be supplemented
with VDLM2 data from ANSPs for VDLM2 frequency capacity planning and problem investigation.
D.1.1.3 Data record for each CPDLC transaction
If required for regional monitoring agency analysis CPDLC transaction data as described above may be sent to the regional/State monitoring agency at as a comma delimited text file. The format for each record will at minimum contain the 20 data points specified in table D-1. Using
FIT-Asia/2 IP07 ATTACHMENT 1
the example in the previous paragraph the data record for the transaction described above in comma delimited format is:
Guidance on the type of analysis carried out at an ANSP or regional level is provided later in paragraphs 0 and 0. Because different ANSPs may use different data sets for analysis within their area of interest the data sent to a regional state monitoring agency should at minimum contain all transactions that contain a WILCO response. The regional monitoring agency will filter transactions as agreed by their regional forum.
D.1.2 ANSP data collection for ADS-C application
This section provides guidance on data collection and performance measurement for the ADS-C application.
D.1.2.1 Measuring actual surveillance performance (ASP)
The analysis of actual communication performance (ASP) is based on the measurement of the transit times of the ADS-C periodic and event reports between the aircraft and the ANSP ground system. This is measured as the difference between the time extracted from the decoded ADS-C basic group timestamp when the message originated from the FMS and the time the message is received at the ANSP.
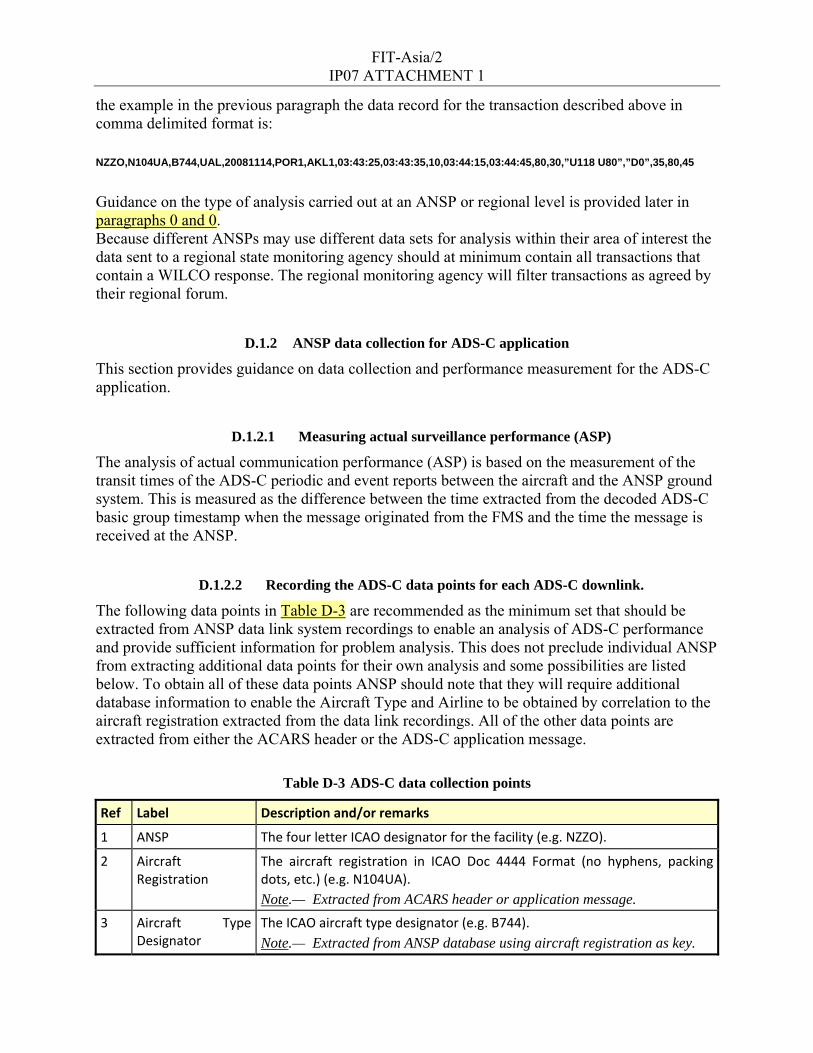
D.1.2.2 Recording the ADS-C data points for each ADS-C downlink.
The following data points in Table D-3 are recommended as the minimum set that should be extracted from ANSP data link system recordings to enable an analysis of ADS-C performance and provide sufficient information for problem analysis. This does not preclude individual ANSP from extracting additional data points for their own analysis and some possibilities are listed below. To obtain all of these data points ANSP should note that they will require additional database information to enable the Aircraft Type and Airline to be obtained by correlation to the aircraft registration extracted from the data link recordings. All of the other data points are extracted from either the ACARS header or the ADS-C application message.
Table D-3 ADS-C data collection points
Ref Label Description and/or remarks
1 ANSP The four letter ICAO designator for the facility (e.g. NZZO).
2 Aircraft Registration
The aircraft registration in ICAO Doc 4444 Format (no hyphens, packing dots, etc.) (e.g. N104UA). Note.— Extracted from ACARS header or application message.
3 Aircraft Type Designator
The ICAO aircraft type designator (e.g. B744). Note.— Extracted from ANSP database using aircraft registration as key.
FIT-Asia/2 IP07 ATTACHMENT 1
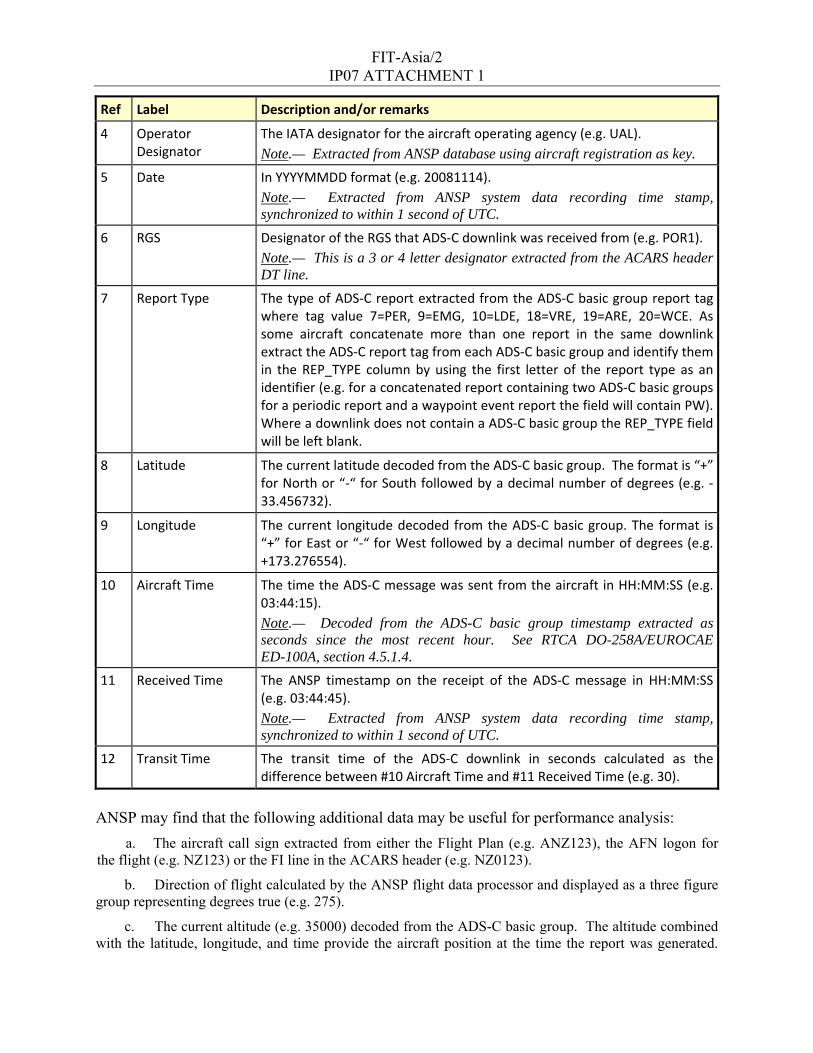
Ref Label Description and/or remarks
4 Operator Designator
The IATA designator for the aircraft operating agency (e.g. UAL). Note.— Extracted from ANSP database using aircraft registration as key.
5 Date In YYYYMMDD format (e.g. 20081114). Note.— Extracted from ANSP system data recording time stamp, synchronized to within 1 second of UTC.
6 RGS Designator of the RGS that ADS‐C downlink was received from (e.g. POR1). Note.— This is a 3 or 4 letter designator extracted from the ACARS header DT line.
7 Report Type The type of ADS‐C report extracted from the ADS‐C basic group report tag where tag value 7=PER, 9=EMG, 10=LDE, 18=VRE, 19=ARE, 20=WCE. As some aircraft concatenate more than one report in the same downlink extract the ADS‐C report tag from each ADS‐C basic group and identify them in the REP_TYPE column by using the first letter of the report type as an identifier (e.g. for a concatenated report containing two ADS‐C basic groups for a periodic report and a waypoint event report the field will contain PW). Where a downlink does not contain a ADS‐C basic group the REP_TYPE field will be left blank.
8 Latitude The current latitude decoded from the ADS‐C basic group. The format is “+” for North or “‐“ for South followed by a decimal number of degrees (e.g. ‐33.456732).
9 Longitude The current longitude decoded from the ADS‐C basic group. The format is “+” for East or “‐“ for West followed by a decimal number of degrees (e.g. +173.276554).
10 Aircraft Time The time the ADS‐C message was sent from the aircraft in HH:MM:SS (e.g. 03:44:15). Note.— Decoded from the ADS-C basic group timestamp extracted as seconds since the most recent hour. See RTCA DO-258A/EUROCAE ED-100A, section 4.5.1.4.
11 Received Time The ANSP timestamp on the receipt of the ADS‐C message in HH:MM:SS (e.g. 03:44:45). Note.— Extracted from ANSP system data recording time stamp, synchronized to within 1 second of UTC.
12 Transit Time The transit time of the ADS‐C downlink in seconds calculated as the difference between #10 Aircraft Time and #11 Received Time (e.g. 30).
ANSP may find that the following additional data may be useful for performance analysis:
a. The aircraft call sign extracted from either the Flight Plan (e.g. ANZ123), the AFN logon for the flight (e.g. NZ123) or the FI line in the ACARS header (e.g. NZ0123).
b. Direction of flight calculated by the ANSP flight data processor and displayed as a three figure group representing degrees true (e.g. 275).
c. The current altitude (e.g. 35000) decoded from the ADS-C basic group. The altitude combined with the latitude, longitude, and time provide the aircraft position at the time the report was generated.
FIT-Asia/2 IP07 ATTACHMENT 1
Aircraft movement data is needed in airspace safety assessments and/or airspace safety monitoring analyses. Inclusion of altitude in the GOLD data sample would allows for the GOLD data to be used for both data link performance monitoring and airspace safety monitoring analyses,
d. ADS-C predicted position latitude and longitude and time when available. (Note: time decoded from the ADS-C predicted group where timestamp is extracted as seconds since the most recent hour. (See RTCA DO-258A section 4.5.1.4)) For consistency the following formats are recommended: For latitude use “+” for North or “-” for South followed by a decimal number of degrees (e.g. -33.456732). For longitude use “+” for East or “-” for West followed by a decimal number of degrees (e.g. +173.276554).
e. The data link communications type (COMTYP) based on the RGS field (#6). Satellite (SAT), Very High Frequency (VHF), High Frequency (HF). Refer to Table D-2.
D.1.2.3 Data record for each ADS-C downlink
If required for regional/State monitoring agency analysis ADS-C transaction data as described above may be sent to the regional regional/State monitoring agency as a comma delimited text file. The format for each record will at minimum contain the 12 data points specified in table D-2. Using the example in the previous paragraph the data record for the transaction described above in comma delimited format is:
Guidance on the type of analysis carried out at an ANSP or regional level is provided later in paragraphs D.1.3 and D.2.1.
D.1.3 ANSP data analysis
To enable adequate system performance monitoring ANSP should at minimum perform a monthly analysis of CPDLC RCP and ADS-C performance data. This monitoring will verify system performance and also enable continuous performance improvement by detecting where specific aircraft or fleets are not meeting the performance standards. While this analysis could be carried out by a regional monitoring agency, it is thought the analysis will be more efficient if done by the ANSP. It is the ANSP that will usually have the operational expertise and local area knowledge that is important when identifying problems from any data analysis. At least one region has had considerable success by using some of the regional ANSP to complete a monthly data analysis and reporting the identified problems to the regional monitoring agency for resolution. A regional monitoring agency is best suited to manage problems reported from the ANSP analysis, and to develop actual regional performance figures from information supplied by the ANSP. Analysis by the individual ANSP will also avoid the regional monitoring agency having to manage a large quantum of data that the ANSP already holds.
FIT-Asia/2 IP07 ATTACHMENT 1
D1.3.1 Graphical analysis
It is recommended that ANSP perform a graphical analysis of the performance data gathered. This graphical analysis is useful for depicting in a readily assimilated fashion actual performance, and has proved extremely useful when identifying performance problems. Monitoring can be completed at a number of levels and similar levels can be used for both CPDLC and ADS-C performance monitoring. The following structure is recommended:
a. Monitoring Communication Media Performance. An analysis of:
1) Data from all aircraft via all Remote Ground Station (RGS) types.
2) Data from all aircraft via SATCOM RGS
3) Data from all aircraft via VHF RGS
4) Data from all aircraft via HF RGS
5) Data from all aircraft via HF and SATCOM RGS
Note.— The monitoring of combined HF and SATCOM data is to allow verification that the performance obtained from those aircraft using HFDL for downlinks only when SATCOM is not available does not degrade performance by an unacceptable level.
b. Monitoring Airline Fleet Performance. An analysis of:
1) The observed performance of each type of aircraft operated by an operator:
i) Via SATCOM
ii) Via SATCOM + HF
iii) Via HF
iv) Via VHF
v) Via All RGS
2) Comparative analysis of the observed performance from the same type of aircraft from different operators.
Note.— When measuring CPDLC performance for a specific media type(s) then only those transactions where both the RGS for the MAS and the RGS of the operational response are from that media type would be measured. Mixed media transactions such as where the MAS is received via a VHF RGS and the operational response is via a SATCOM RGS would be excluded from a SATCOM analysis. Mixed media transactions would be counted in the SATCOM + HF, and All RGS analysis above.
D.1.3.2 Data filtering
It is important that consistent data filtering is employed to ensure that all ANSP measure against the same baseline. Raw data obtained from the ANSP recordings will include delayed transactions measured during periods of system outage and these should not be used when assessing CPDLC transaction time or surveillance data transit time. The data may also include duplicated messages which will also skew the measurements if not removed. This data should be filtered from the raw data before any performance assessment is made.
D.1.3.2.1 System Outages
FIT-Asia/2 IP07 ATTACHMENT 1
In accordance with the provisions of paragraph 3.1.3Error! Reference source not found., the ANSP should ensure that the service level agreement with their CSP includes a requirement for the reporting of all system outages that will affect the delivery of traffic to and from the ANSP. CSP reporting should include for each outage:
a. Type of outage and the media affected;
b. Outage start time;
c. Outage end time; and
d. Duration of Outage.
The raw data should be checked for any delayed transactions observed during system outages. These delays are easily identified during outages that have been notified by the CSP, but the data should be carefully reviewed for outages that have not been notified. Delays observed from multiple aircraft where the downlinks completing the transactions are received at similar times indicate a system outage. CPDLC transactions and surveillance data delivery measurements during these outage periods should be removed. A typical outage not notified by any DSP is illustrated in Table D- 4 showing ADS-C downlink delays from 3 aircraft between 1120 and 1213.
Table D- 4. ADS-C outages not notified
Aircraft registration Aircraft time ANSP system time Downlink time (Seconds)
ZK‐SUI 11:55:38 12:12:52 1034
ZK‐SUI 11:44:42 12:12:19 1657
ZK‐SUJ 11:41:54 12:12:01 1807
ZK‐SUJ 11:26:18 12:09:42 2604
ZK‐SUI 11:23:21 12:08:32 2711
ZK‐SUJ 11:20:34 12:07:39 2825
ZK‐OKG 11:53:52 12:12:51 1139
D.1.3.2.2 Duplicated ADS-C reports
Numerous instances of duplicate ADS-C reports are observed in FANS-1/A data records. A particular report is often duplicated with the second and sometimes third record duplicated at some later time as illustrated in Table D- 5. These duplicate records will skew ADS-C surveillance data delivery measurements and should be removed.
Table D- 5. ADS-C duplicate reports
LAT_LON Aircraft time ANSP system time Downlink time (Seconds)
350225S1694139E 22:29:45 22:31:04 79
350225S1694139E 22:29:45 22:34:56 311
350225S1694139E 22:29:45 22:40:05 620
FIT-Asia/2 IP07 ATTACHMENT 1
D.1.3.3 CPDLC performance analysis
Monitoring of CPDLC performance involves an assessment of ACP, ACTP, and PORT by a graphical analysis of data using the structure outline in paragraph D.1.3.1.
D.1.3.3.1 Monitoring communications media performance
Graphs illustrating ACP and ACTP are used to assess CPDLC transaction performance through the various communications media. Since PORT is independent of media this would normally only be assessed over one media. The graphs depict measured performance against the TRN and RCTP requirements at the 95% and 99.9% level and would be completed for the performance specifications in use (e.g. RCP 240, RCP 400). An analysis is completed for:
a. Data from all aircraft via all remote ground station (RGS) types.
b. Data from all aircraft via SATCOM RGS
c. Data from all aircraft via VHF RGS
d. Data from all aircraft via HF RGS
e. Data from all aircraft via HF and SATCOM RGS
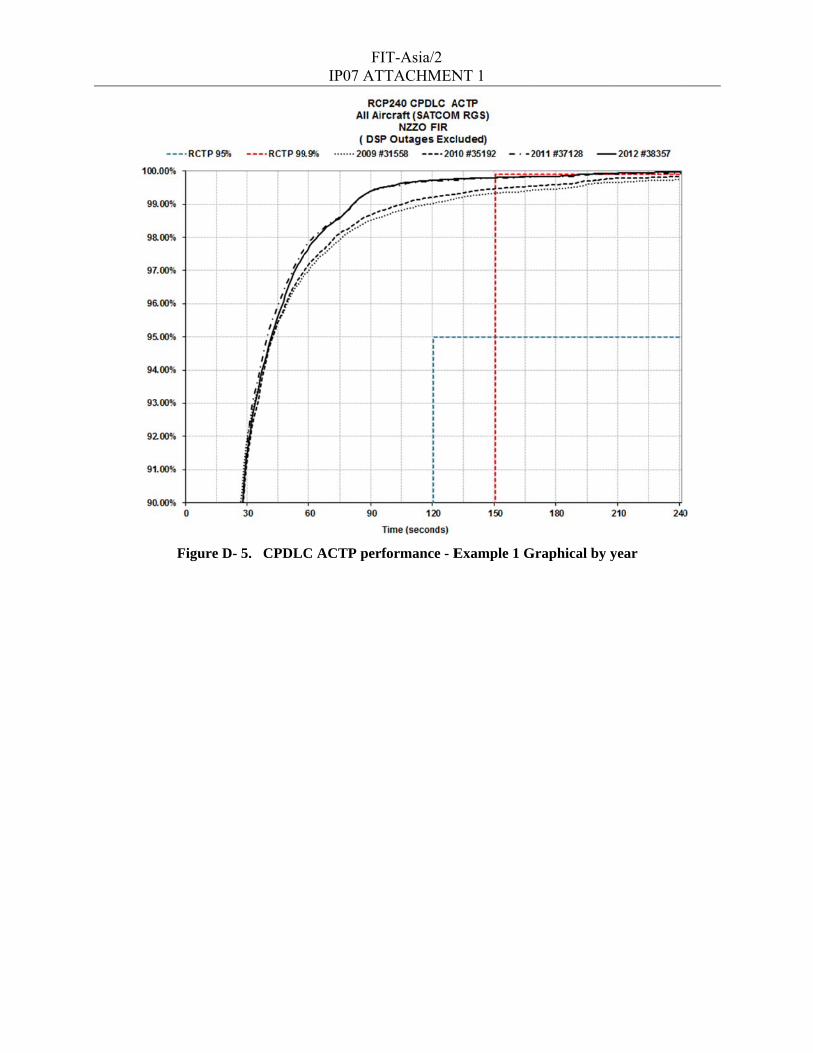
A typical graph illustrating SATCOM ACTP performance constructed using a spreadsheet application is illustrated in Figure D- 5. Similar graphs are used to assess ACTP and ACP for other communications media. Figure D- 5 graphs ACTP against the 95% 120” and 99.9% 150” requirements of the RCP240 specification for the years 2009-2012 as observed in the NZZO FIR. Figure D- 6 and Figure D- 7 illustrate other methods of reporting performance. Data transactions used for the measurement of SATCOM, VHF, and HF ACTP and ACP are where both the MAS and operational response are received via the media being assessed. The exception to this is the assessment of combined HF and SATCOM performance where any transaction involving HF or SATCOM is used. Similar graphs are used to assess ACTP and ACP for other communications media.
Figure DD- 5. CPDLC
FIP07 AT
C ACTP per
IT-Asia/2 TTACHMEN
rformance - E
NT 1
Example 1 GGraphical by year
Fi
igure D- 6 CCPDLC ACT
FIP07 AT
TP performa
IT-Asia/2 TTACHMEN
ance – Examp
NT 1
ple 2 Graphiical Analysiss by Month
Fi
D.
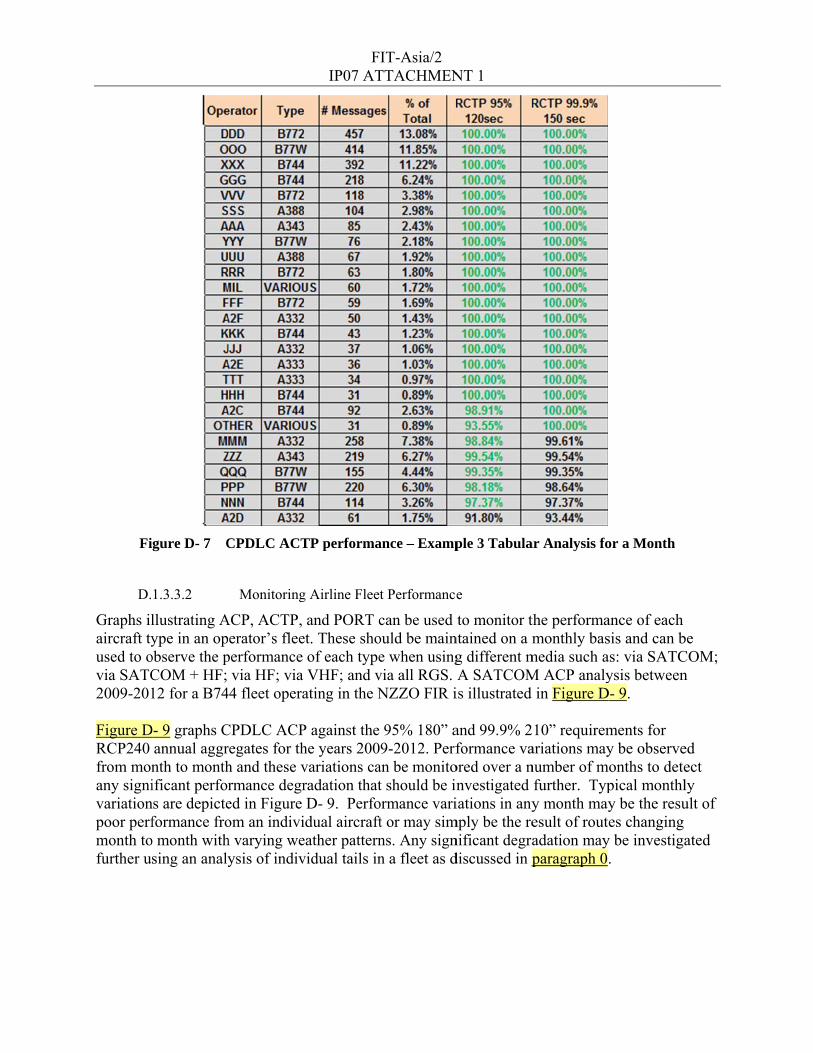
Graphs ilaircraft tyused to ovia SATC2009-201 Figure DRCP240 from monany signivariationpoor perfmonth tofurther u
gure D- 7 C
1.3.3.2
llustrating Aype in an op
observe the pCOM + HF; 12 for a B74
D- 9 graphs Cannual aggrnth to monthificant perfor
ns are depicteformance fro
o month withsing an analy
CPDLC ACT
Monitoring
ACP, ACTP, erator’s flee
performance via HF; via
44 fleet opera
CPDLC ACPregates for thh and these vrmance degred in Figure om an indivih varying weysis of indiv
FIP07 AT
TP performa
g Airline Fleet
and PORT cet. These sho
of each typeVHF; and v
ating in the N
P against the he years 200variations caradation thatD- 9. Perfo
idual aircrafteather patternvidual tails in
IT-Asia/2 TTACHMEN
ance – Examp
t Performance
can be used ould be maine when usingvia all RGS. NZZO FIR i
95% 180” a9-2012. Perf
an be monitot should be in
ormance varit or may simns. Any signn a fleet as d
NT 1
ple 3 Tabula
e
to monitor tntained on a mg different mA SATCOM
is illustrated
and 99.9% 2formance va
ored over a nnvestigated iations in any
mply be the renificant degradiscussed in p
ar Analysis fo
the performamonthly bas
media such aM ACP analy
in Figure D
10” requiremariations maynumber of mfurther. Typy month mayesult of routadation mayparagraph 0
or a Month
ance of each sis and can bas: via SATCysis between
D- 9.
ments for y be observe
months to detepical monthly be the resues changing
y be investiga.
be COM; n
ed ect ly ult of
ated
Figure D- 8
FIP07 AT
CPDLC A
IT-Asia/2 TTACHMEN
CP Airline X
NT 1
XXX B744 20009-2012
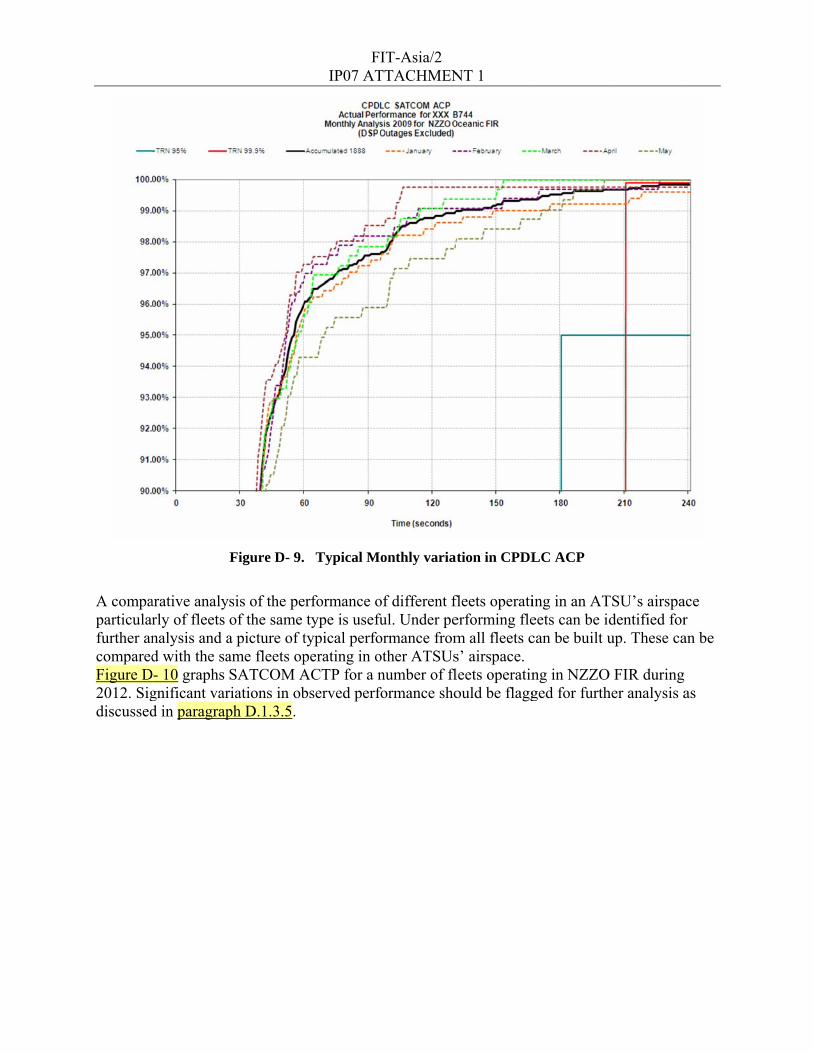
A compaparticularfurther ancomparedFigure D2012. Sigdiscussed
arative analyrly of fleets nalysis and ad with the sa
D- 10 graphs gnificant vard in paragrap
Figure D- 9.
ysis of the peof the same a picture of tame fleets opSATCOM A
riations in obph D.1.3.5.
FIP07 AT
Typical M
erformance otype is usefu
typical perfoperating in oACTP for a nbserved perf
IT-Asia/2 TTACHMEN
onthly varia
of different fful. Under peormance fromother ATSUsnumber of flformance sho
NT 1
ation in CPDL
fleets operatierforming flem all fleets cs’ airspace. leets operatinould be flagg
LC ACP
ing in an ATeets can be ican be built u
ng in NZZOged for furth
TSU’s airspadentified forup. These ca
O FIR duringher analysis a
ace r an be
as
Monitorifrom a gr
D.
Graphs ilthe variosurveillan
a.
b.
c.
d.
e.
A typicalconstructto assess
Figure
ing of ADS-Craphical anal1.3.4.1
llustrating Aus communince requiremData from all
Data from al
Data from al
Data from al
Data from al
l graph illustted using a sdelay throug
e D- 10. CPD
D.1.3.4
C surveillanlysis of data
Monitoring
ADS-C surveications medments at the 9l aircraft via a
l aircraft via S
l aircraft via V
l aircraft via H
l aircraft via c
trating ADSspreadsheet agh individua
FIP07 AT
DLC ACTP co
ADS-C sur
nce data transa using the stg communicat
eillance data dia. The grap95% and 99all remote gro
SATCOM RG
VHF RGS
HF RGS
combined HF
-C surveillanapplication ial communic
IT-Asia/2 TTACHMEN
omparative o
rveillance dat
sit time invotructure outlitions media p
transit time phs depict m.9% level. Aound station (
GS
F and SATCO
nce data trans illustrated
cations medi
NT 1
operator typ
ta transit tim
olves an asseined in parag
performance
are used to measured perfAn analysis is(RGS) types.
OM RGS
nsit time obsin Figure D
ia.
pe performan
me analysis
essment of obgraph 0.
assess perfoformance ags completed
served from - 11. Similar
nce
bserved dela
ormance throgainst the
for:
SATCOM ar graphs are
ay
ough
and used
Figure D180-secothe ADS-
D.
Graphs ilof each acan be usSATCOMSATCOMFigure D Figure D180-secoduring thmonth onperformawith varytails in a
D- 11 graphs ond requirem-C transactio
F
1.3.4.2
llustrating Aaircraft type sed to observM; via SATCM delay anal
D- 12.
D- 12 graphs ond requiremhe period Jann some fleetsance from anying weatherfleet as disc
ADS-C survments for the ons recorded
Figure D- 11.
Monitoring
ADS-C survein an operatove the perforCOM + HF; lysis of the A
ADS-C survments for RSPnuary-May 2s and signifi
n individual ar patterns. Thcussed in D1
FIP07 AT
veillance datRSP specifi
d during the p
ADS-C via S
g operator flee
eillance data or’s fleet. Thrmance of eavia HF; via
A343 fleet fo
veillance datP 180D usin
2009. Considcant degradaaircraft or mhese may be.3.5 below. T
IT-Asia/2 TTACHMEN
ta transit timication proviperiod 2009
SATCOM NZ
et performanc
transit time hese should ach type wheVHF; and v
or an operato
ta transit timng the 3195 Aderable perfoation in any
may be the ree investigatedThe fleet illu
NT 1
me against theided in Appe
9 -2012 in the
ZZO FIR 20
ce
can be usedbe maintainen using diff
via all RGS. or in the NZ
me against theADS-C dowormance varimonth may
esult of routed further usiustrated show
e 95% 90-seendix C, pare NZZO FIR
009 – 2012
d to monitor ed on a monferent mediaThe January
ZZO FIR is il
e 95% 90-sewnlinks recor
iation may bbe the result
es changing ming an analyws little vari
econd and 99agraph C.2 u
R.
the performanthly basis ana such as: viay to May 200llustrated in
econd and 99rded for the fbe seen montt of poor month to mosis of individiation betwe
9.9% using
ance nd a 09
9.9% fleet th to
onth dual
een
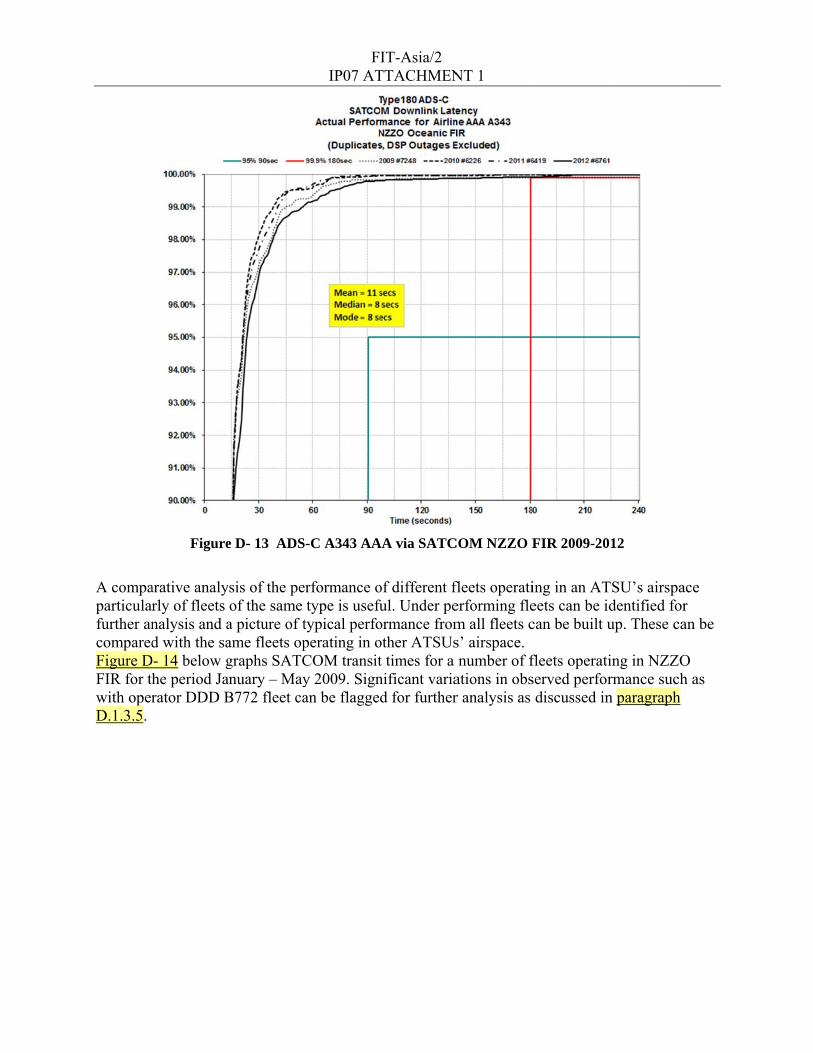
the montrepresentdetectingfor the sa
hs and for cltative pictureg any performame fleet fro
Figure D
larity only the of the expemance degraom 2009-201
- 12. ADS-C
FIP07 AT
he high and lected performadation. Figu12.
A343 AAA v
IT-Asia/2 TTACHMEN
low months mance for a ure D- 13 ill
via SATCOM
NT 1
are depictedfleet will em
lustrates obs
M NZZO FIR
d. Over a numerge. This aerved yearly
R Jan – May
umber of yeaassists in y performanc
y 2009
ars a
ce
A compaparticularfurther ancomparedFigure DFIR for thwith operD.1.3.5.
Figure
arative analyrly of fleets nalysis and ad with the sa
D- 14 below ghe period Jarator DDD B
e D- 13 ADS
ysis of the peof the same a picture of tame fleets opgraphs SATCanuary – MayB772 fleet ca
FIP07 AT
S-C A343 AA
erformance otype is usefu
typical perfoperating in oCOM transity 2009. Signan be flagged
IT-Asia/2 TTACHMEN
AA via SATC
of different fful. Under peormance fromother ATSUst times for a nificant variad for further
NT 1
COM NZZO F
fleets operatierforming flem all fleets cs’ airspace. number of f
ations in obsr analysis as
FIR 2009-20
ing in an ATeets can be ican be built u
fleets operatiserved perfordiscussed in
012
TSU’s airspadentified forup. These ca
ing in NZZOrmance suchn paragraph
ace r an be
O h as
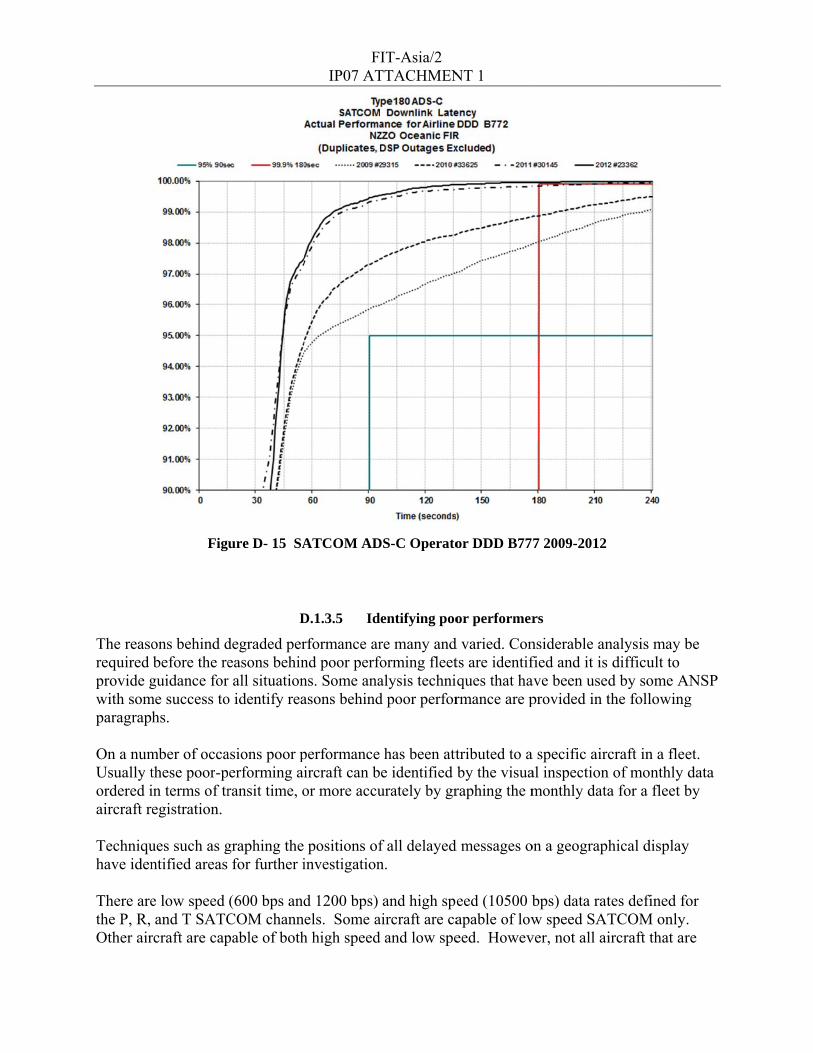
The issueas an aircupgrade. implemenFigure D
Figur
e affecting ocraft issue thANSP shounted by all a
D- 15.
e D- 14. Com
operator DDDhat affected auld note that airlines. The
FIP07 AT
mparative SA
D B772 fleetall B777 aircsoftware upcurrent perf
IT-Asia/2 TTACHMEN
ATCOM ADS
t in Figure Dcraft. This wgrades to air
formance of
NT 1
S-C for differ
D- 14 was idwas eventuall
rcraft may taoperator DD
rent operato
dentified by tly resolved bake some timDD B772 fle
ors
the regional by a softwareme to be eet is depicte
CRA e
ed in
The reasorequired provide gwith somparagraph On a numUsually tordered iaircraft re Techniquhave iden There arethe P, R, Other air
Fig
ons behind dbefore the re
guidance forme success to
hs.
mber of occathese poor-pin terms of tregistration.
ues such as gntified areas
e low speed and T SATC
rcraft are cap
ure D- 15 SA
D
degraded pereasons behinr all situationo identify rea
asions poor performing airansit time, o
graphing the for further i
(600 bps andCOM channpable of both
FIP07 AT
ATCOM AD
D.1.3.5 Id
rformance arnd poor perfons. Some anaasons behind
performance ircraft can bor more accu
positions ofinvestigation
d 1200 bps) els. Some a
h high speed
IT-Asia/2 TTACHMEN
DS-C Operato
entifying poo
re many andforming fleetalysis technid poor perfor
has been atte identified urately by gr
f all delayedn.
and high spaircraft are cad and low spe
NT 1
or DDD B77
or performer
d varied. Conts are identifques that harmance are p
tributed to aby the visuaraphing the m
d messages o
eed (10500 bapable of loweed. Howev
7 2009-2012
rs
nsiderable anfied and it is ave been usedprovided in t
a specific aircal inspectionmonthly data
on a geograph
bps) data ratw speed SAT
ver, not all ai
nalysis may bdifficult to
d by some Athe following
craft in a flen of monthly a for a fleet b
hical display
tes defined fTCOM onlyircraft that ar
be
ANSP g
et. data by
y
for y. re
capable ooperate inchange toby an indSignificathe figure
Fig
An ANSPADS-C rsmall pervery fewANSP shwork wit
The 95%the surve
of high speedn low speed o the high spdividual operant performae D-10 below
gure D- 16. E
P can assessreports via Srcentage of rreports less
hould identifth those oper
% and 99.9% eillance and c
d operation honly. It is r
peed channelrator in the ance benefitsw.
Effect of ACA
s ACARS chATCOM. Foreports in the than 10 sec
fy those operrators to ach
D.1.3
criteria are pcommunicat
FIP07 AT
have enabledrecommendels where posaircraft opera accrue with
ARS channel
hannel speed or users of he 6-8 secondonds. rators using
hieve an upgr
.6 Assessi
provided as tion applicat
IT-Asia/2 TTACHMEN
d the use of hed an operatossible. Low oational requi
h the use of t
l speed on AD
use by evaluhigh speed chd time bands
the low speerade to the h
ing periodic
operationalltions support
NT 1
high speed Sor using lowor high speeirements tabthe high spee
DS-C surveil
uating the mhannels ANS. Low speed
ed channels high speed ch
monitoring r
ly significantting ATM fu
SATCOM anw speed SAT
d channel usble (ORT). ed channels
llance data t
monthly dowSP will consd channels us
and stakehohannels.
results
t benchmarkunctions can
nd, instead COM channse is selectab
as illustrated
transit time
wnlink times sistently see sers usually
lders should
ks against whn be assessed
nels ble
d in
for a have
d
hich d.
FIT-Asia/2 IP07 ATTACHMENT 1
Typically post implementation monitoring is carried out on a monthly basis and observed performance assessed to detect any performance degradation.
D.1.3.6.1 99.9% Criteria
The 99.9% criteria define the Expiry Time (ET) for communication transactions and the Overdue Time (OT) for surveillance transactions following which the initiator is required to revert to an alternative procedure. When using data link to provide reduced separations the RCP240 ET and RSP180 OT are the times after which if a CPDLC intervention transaction is not completed or an ADS-C position report is not received then the controller is obliged to revert to alternative separation procedure as defined in the separation specification. If monthly monitoring shows that a specific fleet is not meeting the criteria then a local safety assessment by the ANSP should be carried out to assess if the reduced separation standard can continue to be applied. Some ANSP have set monitoring guidelines as to trigger a safety assessment and further investigation. The safety assessment would consider the density of traffic and traffic patterns flown in the region together with the frequency of application of the reduced separation to assess whether the increased probability of having to revert to an alternative separation would have workload and thus safety implications for the controllers. The safety assessment would also consider the performance of other fleets operating in the airspace.
D.1.3.6.2 95% Criteria
The 95% criteria define the nominal time acceptable for normal CPDLC and ADS-C operations. If monthly monitoring shows that measured performance is consistently below the 95% criteria then consideration may be given to the withdrawal of data link services to the fleet. Experience has shown that observed fleet performance below the specified RCP240/RSP180 95% criteria will usually be accompanied by controller complaints of unacceptable performance by that fleet.
D.1.3.6.3 Setting Guidelines
In airspace where procedural separation is being applied, it has been observed that complete withdrawal of datalink may not be required even if performance is observed to fall below the RCP240/RSP180 criteria. While safety services such as reduced separation standards requiring RCP240/RSP180 would be withdrawn the observed performance may still meet RCP/RSP400 criteria and the local safety assessment may also conclude that maintaining the data link connection is viable. Some ANSP have set monitoring guidelines to assist with their data analysis. These include:
a. If the performance observed for a fleet by monthly monitoring at the 99.9% level is better than 99.75% then the fleet is considered to meet the 99.9% performance level.
b. Observed fleet performance consistently falling below 99.0% will be subject to CRA problem reports and investigation that will attempt to determine the cause of the degradation.
c. Any monthly performance degradation (0.5%) by a fleet below observed historical performance will be subject to investigation.
D.1.3.6.4 Case Study
In early 2009 analysis of the performance data for December 2008 in NZZO detected a slight performance degradation for both ADS-C and CPDLC against the monitored RCP240/RSP180 standard. Further performance deterioration was observed mid February 2009 when the January 2009 data was assessed.
During thhad beendeteriora ADS-C pillustrateperforma
A safety would be The causcaused byon the fledegradati A softwareturning
his period fun raised and aation in perfo
performanced in Figure D
ance standard
F
assessment e withdrawn
se of the proby the implemeet from lateion through
are fix was reg to normal i
urther local aa full investiormance was
for the fleetD-17 and CPd is illustrate
igure D- 17
in early 200although CP
blem was idementation of e 2008 until tthis period.
eleased in eammediately
FIP07 AT
analysis was igation was us noted in the
t as measurePDLC perfored in Figure
Example of A
9 concludedPDLC and A
entified in mf new cabin sthe middle o
arly 2010 wiand meeting
IT-Asia/2 TTACHMEN
initiated andunderway bye following
ed against thermance as mD-18.
ADS-C perfo
d that reduceADS-C woul
mid 2009 as aservices on tof 2009. This
ith observed g the RSP18
NT 1
d by March y the CRA amonths thro
e RSP180 pemeasured aga
ormance det
d separationld continue t
a system levthe aircraft ths explained t
performanc80/RCP240 s
2009 a CRAand the CSP’ough to Octo
erformance sainst the RCP
terioration
n standards uto be used.
vel GES issuhat were grathe continuin
ce levels for tstandard.
A problem re’s. Further
ober 2009.
standard is P240
using datalin
e. This was adually instang performa
the fleet
eport
nk
lled ance
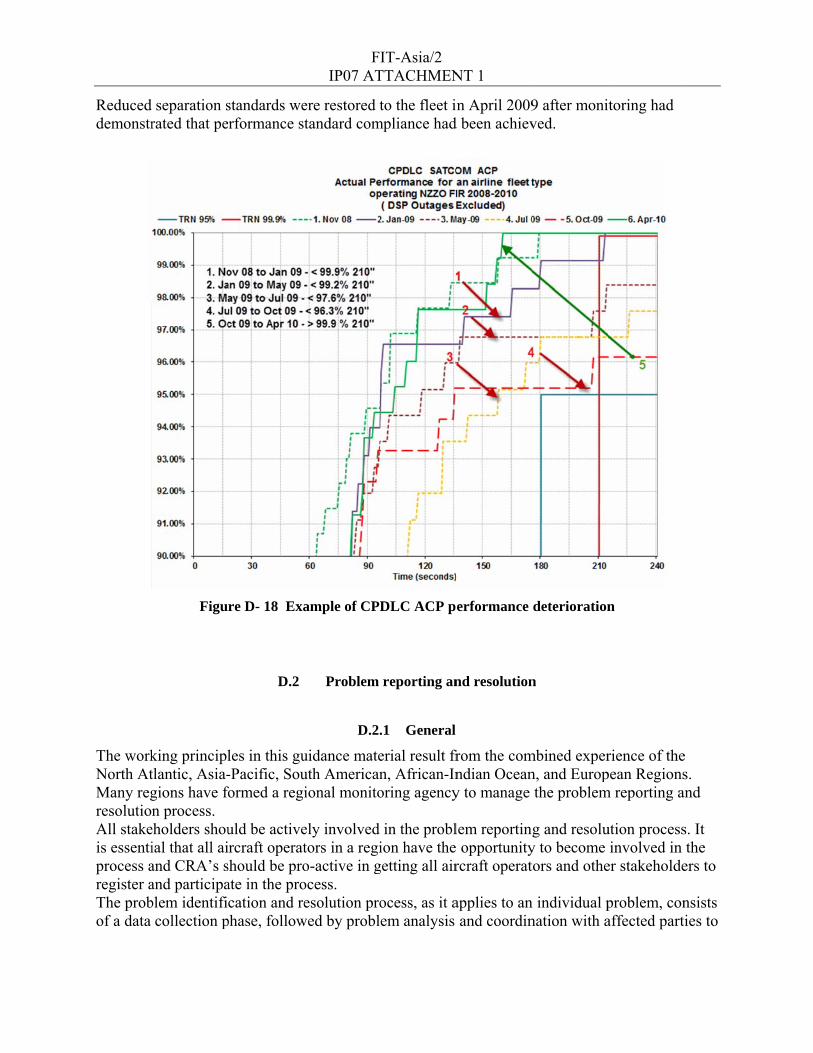
Reduced demonstr
The workNorth AtMany regresolutionAll stakeis essentiprocess aregister aThe probof a data
separation srated that pe
Figu
king principltlantic, Asia-gions have fon process.
eholders shouial that all aiand CRA’s sand participablem identifi
collection p
standards werformance s
re D- 18 Exa
D.2
les in this gu-Pacific, Souformed a regi
uld be activeircraft operatshould be proate in the procation and re
phase, follow
FIP07 AT
ere restored ttandard com
ample of CPD
Problem
D.2.
uidance mateuth Americanional monito
ely involved tors in a regio-active in gocess. esolution pro
wed by probl
IT-Asia/2 TTACHMEN
to the fleet impliance had
DLC ACP p
reporting an
.1 General
erial result frn, African-Inoring agency
in the problion have the
getting all air
ocess, as it aem analysis
NT 1
n April 2009d been achiev
erformance
nd resolution
from the comndian Oceany to manage
lem reporting opportunityrcraft operat
applies to anand coordin
9 after monived.
deterioration
n
mbined expern, and Europthe problem
g and resoluy to become tors and othe
n individual pnation with a
toring had
n
rience of thepean Regionsm reporting a
ution processinvolved in
er stakeholde
problem, conaffected part
e s.
and
s. It the
ers to
nsists ies to
secure a rinstances
The probusually areportingreceive aAs an ex(http://wwand trackEUROCOneeds to An examNAT, anfollows:
a.
resolution, as. This is sho
blem identifian operator, Ag forms shouand store proample, the Eww.eurocon
king applicatONTROL. Pbe handled t
mple of an ond Asia Pacif
Originator’s
and recommeown in the F
Figure D- 1
cation task bANSP or CS
uld be develooblem reportsEUR region untrol.int/link2tion, which iProblems shoto promote k
nline problemfic regions is
Reference Nu
FIP07 AT
endation of iFigure D- 19
9. Problem r
D.2.2 Pr
begins with rSP but may ioped and regs. uses JIRA 2000/wiki/inis managed bould be repoknowledge shm reporting fs shown in F
umber: Origin
IT-Asia/2 TTACHMEN
interim proc.
reporting and
oblem repor
receipt of a pnclude aircr
gions should
ndex.php/), aby the LINKrted, regardlharing acrosform current
Figure D- 20.
nators problem
NT 1
cedures to m
d resolution
rt form
problem repraft or avioni
investigate
a secured weK2000+/Centless whetherss the data lintly used on-l. The fields u
m report refer
itigate the pr
process
ort from a stics manufactthe use of a
eb-based protral Reportinr it can be renk communiline by regioused in the f
rence (e.g. AN
roblem in so
takeholder, turers. Stanwebsite to
oblem reporting Office of solved locality.
onal CRA in form are as
NZ_2009-23)
ome
dard
ing
lly or
the
);
FIT-Asia/2 IP07 ATTACHMENT 1
b. Title: A short title which conveys the main issue of the reported problem (e.g. CPDLC transfer failure);
c. Date UTC: Date in YYYYMMDD format (e.g. 20090705);
d. Time UTC: Time in HHMM (e.g. 2345);
e. Aircraft registration: ICAO flight plan aircraft registration (e.g. ZKADR);
f. Aircraft identification: ICAO flight plan call sign if applicable (e.g. NZA456);
g. Flight Sector: If applicable the departure and destination airfield of the flight (e.g. NZAA-RJBB);
h. Organization: Name of the originators organization (e.g. Airways NZ);
i. Active Center: Controlling Centre at time of occurrence if applicable (e.g. NZZO);
j. Next Center: Next controlling centre at time of occurrence if applicable (e.g. NFFF);
k. Position: Position of occurrence (e.g. 3022S16345E);
l. Problem Description: Detailed description of problem;
m. Attach File: Area of web page where originator and assigned stakeholders can attach data files or other detailed information such as geographic overlays; and
n. Additional Data: Area set aside for feedback from stakeholders assigned by the regional/State monitoring agency. This will includes the results of the investigation and the agreed action plan.
Note.— A number of regional monitoring agencies are developing websites to manage the problem reporting process. Website addresses and the regional monitoring agency to which they are applicable are listed in Appendix E.
Figure D- 2
FIP07 AT
20, Example
IT-Asia/2 TTACHMEN
on-line prob
NT 1
blem reportinng form
FIT-Asia/2 IP07 ATTACHMENT 1
D.2.2 Problem assessment
D.2.2.1 Data collection
D.2.2.1.1 The data collection phase consists of obtaining message logs from the appropriate parties (which will depend on which ANSPs and CSPs were being used and operator service contracts). Today, this usually means obtaining logs for the appropriate period of time from the CSPs involved. Usually, a log for a few hours before and after the event that was reported will suffice, but once the analysis has begun, it is sometimes necessary to request additional data, (perhaps for several days prior to the event if the problem appears to be an on-going one).
D.2.2.1.2 Additionally, some aircraft-specific recordings may be available that may assist in the data analysis task. These are not always requested initially as doing so would be an unacceptable imposition on the operators, but may occur when the nature of the problem has been clarified enough to indicate the line of investigation that needs to be pursued. These additional records include:
a. Aircraft maintenance system logs.
b. Built-In Test Equipment data dumps for some aircraft systems.
c. SATCOM activity logs.
d. Logs and printouts from the flight crew and recordings/logs from the ANSPs involved in the problem may also be necessary. It is important that the organization collecting data for the analysis task requests all this data in a timely manner, as much of it is subject to limited retention.
D.2.2.2 Data analysis
D.2.2.2.1 Once the data has been collected, the analysis can begin. For this, it is necessary to be able to decode all the messages involved, and a tool that can decode every ATS data link message type used in the region is essential. These messages include:
a. AFN (ARINC 622), ADS-C and CPDLC (RTCA DO-258/EUROCAE ED-100) in a region operating FANS-1/A.
b. Context Management, ADS-C and CPDLC applications (ICAO Doc 9705 and RTCA DO-280B/ED-110B) in a region using ATN B1.
c. ARINC 623 messages used in the region.
D.2.2.2.2 The analysis of the decoded messages requires a thorough understanding of the complete message traffic, including:
a. Media management messages.
b. Relationship of ground-ground and air-ground traffic.
c. Message envelope schemes used by the particular data link technology (ACARS, ATN, etc).
D.2.2.2.3 The analyst must also have a good understanding of how the aircraft systems operate and interact to provide the ATS data link functions, as many of the reported problems are aircraft system problems.
D.2.2.2.4 This information will enable the analyst to determine a probable cause by working back from the area where the problem was noticed to where it began. In some cases, this may entail manual decoding of parts of messages based on the appropriate standard to identify particular encoding errors. It
FIT-Asia/2 IP07 ATTACHMENT 1
may also require lab testing using the airborne equipment (and sometimes the ground networks) to reliably assign the problem to a particular cause.
D.2.2.2.5 Once the problem has been identified, then the task of coordination with affected parties begins. The stakeholder who is assigned responsibility for fixing the problem must be contacted and a corrective action plan agreed. The stakeholder who initiated the problem report shall be provided with regular updates on the progress and resolution of the problem
D.2.2.2.6 This information (the problem description, the results of the analysis and the plan for corrective action) is then entered into a database covering data link problems, both in a complete form to allow continued analysis and monitoring of the corrective action and in a de-identified form for the information of other stakeholders. These de-identified summaries are reported at the appropriate regional management forum and made available to other regional central reporting/monitoring agencies on request.
D.2.3 Mitigating procedures – problem resolution
The regional monitoring agency’s responsibility does not end with determining the cause of the problem and identifying a fix. As part of that activity, and because a considerable period may elapse while software updates are applied to all aircraft in a fleet, procedural methods to mitigate the problem may have to be developed while the solution is being coordinated. The regional monitoring agency should identify the need for such procedures and develop recommendations for implementation by the ANSPs, CSPs and operators involved.
D.3 Regional performance monitoring
This section provides guidance on periodic reporting by individual ANSP of observed system performance in their airspace that will enable regional performance metrics to be developed for the availability, CPDLC transaction time and ADS-C surveillance data transit time requirements specified in Appendix B and Appendix C. These regional performance metrics should be made available to all interested stakeholders. The use of regional websites to enhance the distribution of these metrics should be considered. An example of such a website can be viewed at http://www.ispacg-cra.com/.
D.3.1 Periodic reporting
It is recommended that regions implement monthly performance reporting to obtain system performance metrics. These reports will provide data on observed availability, CPDLC transaction time and ADS-C surveillance data transit time as described herein.
D.3.1.1 Reporting on availability
ANSP should report on CSP notified system outages and on detected outages that have not been notified as described in paragraph D.1.3.2.1. This is used to calculate the actual availability of service provision. For each outage the following information should be reported:
a. Tnotif
b. C
c. T
d. O
e. O
f. D
As per Ashown in For EURreported acceptabANSP ca22.
Time of CSP ofication receiv
CSP Name: Na
Type of outage
Outage start tim
Outage end tim
Duration of Ou
Appendix B on Figure D- 2
R region, the availability le indication
an use graph
outage notificved.
ame of CSP p
e: Report med
me: In YYYY
me: In YYYY
utage: In minu
only outages23.
number of Pproblems af
n of the actuaical analysis
Figure D
FIP07 AT
cation: In YY
providing outa
dia affected S
YMMDDHHM
YMMDDHHM
utes.
greater than
Provider Aboffecting a sinal Availabilis to track ava
D- 21 Examp
IT-Asia/2 TTACHMEN
YYYMMDDH
age notificati
SATCOM, VH
MM format
MM format
n 10 minutes
orts experienngle aircraft ity of Use. ailability as i
ple System Av
NT 1
HHMM form
on if applicab
HF, HF, ALL
s are reported
nced by the Ashould be re
illustrated in
vailability G
mat or “Not N
ble.
L.
d. An examp
ANSP and meported. This
n Figure D- 2
Graph
Notified” if no
ple form is
manually s provides an
21 and Figur
o CSP
n
re D-
ANSP shpaths usipaths to r
a.
b.
c.
d.
e.
A tabular99.9% R As PORTexample ANSPs wand ATNXML-forimportingof EATM
D.3.
hould report ng all transareport are: From all airc
From all airc
From all airc
From all airc
From all airc
r reporting foCP240/400 t
T is independform is show
within the EUN B1 transpormat as descg into PRISM
M). PRISME
Figure
1.2 Repor
observed ACactions invol
raft via all rem
craft where bo
craft where bo
craft where bo
craft where eit
format can betimes.
dent of mediwn in Figure
UR region reort level log fcribed in paraME (Pan-Eu
E is an integr
FIP07 AT
D- 22 Exam
rting on CPD
CP and ACTlving a WILC
mote ground
oth uplink and
oth uplink and
oth uplink and
ther uplink an
e used to cap
ia path, this e D- 23.
ecord the DLfiles, deployagraph D.1.1
uropean Repoated ATM d
IT-Asia/2 TTACHMEN
mple Network
DLC actual c
TP for RCP2CO response
station (RGS
d downlink ar
d downlink ar
d downlink ar
nd downlink a
pture the obs
need only b
LIC-Contact/yment and sy1.2. All ANSository of In
data ware hou
NT 1
k Outage Gra
communicati
240 and RCPe as describe
S) types.
re via SATCO
re via VHF R
re via HF RG
are via HF or
served perfo
e reported fo
t/CPDLC logystem health SPs send thenformation Suse for creat