Petrophysics and Pore Pressure: Pitfalls and Perfection*
Andrew Buffin1
Search and Discovery Article #40654 (2010) Posted December 6, 2010
*Adapted from oral presentation at AAPG Geoscience Technology Workshop, Singapore, October 28-29, 2010 1Principal petrophysicist, Senergy Group, Perth, Australia (Andrew.Buffin.senergyworld.com)
Conclusion
The world of petrophysics is fraught with danger. A simple awareness of the pitfalls that can occur have been highlighted. Do not use wireline logs in isolation. Ensure that all petrophysical logs are fully reviewed and prepared before use. Undertake a fully integrated pore pressure evaluation, calibrated to operational events; pressure measurements should be robust and
defensible. The software allows the collation and display of these data types, along with the wireline logs, captured within a simple-to-follow
workflow. The impact of using poorly prepared and/or reviewed petrophysical data will result in a potential environmental calamity.
Selected References Barker, J.W., and T.D. Wood, 1997, Estimating shallow below mudline deepwater Gulf of Mexico fracture gradients: Proceedings of the AADE Houston Chapter Annual Technical Meeting. Bellotti, P., and R.E. Gerard, 1976, Instantaneous log indicates porosity and pore pressure: World Oil, (10/1976), p. 90-94. Bellotti, P., and D. Giacca, 1978, Seismic data can detect overpressures in deep drilling: Oil & Gas Journal, v. 76, (8/21/1978), p. 47-52. Bellotti, P., and D. Giacca, 1978, Pressure evaluation improves drilling programs: Oil & Gas Journal, v. 76, (9/11/1978), p. 76-78, 83-85.
Bellotti, P., D. Raffaele, and G. Diego, 1979. Deep drilling in Po Valley: Planning criteria and field results: Society of Petroleum Engineers of AIME (4/1979), 15 p. Daines, Stephen R., 1980, The prediction of fracture pressures for wildcat wells: Society of Petroleum Engineers of AIME (9/1980), 11p. Eaton, B.A., 1969, Fracture gradient prediction and its applications in oilfield operations: Journal of Petroleum Technology, p. 1353–1360. Eaton, B.A., 1997, Fracture gradient prediction for the new generation: World Oil, (October 1997), p. 93–100). Gardner, G.H.F., L.W. Gardner, and A.R. Gregory, 1974, Formation velocity and density—the diagnostic basics for stratigraphic traps: Geophysics, v. 39, p. 770–780. Greenberg, M.L., and J.P. Castagna, 1992, Shear-wave velocity estimation in porous rocks: Theoretical formulation, preliminary verification and applications: Geophysical Prospecting, v. 40, p. 195-209. Lindseth, R.O., 1979, Synthetic sonic logs – A process for stratigraphic interpretation: Geophysics, v. 44, p. 3-26. Matthews, W.R., 1984, How to calculate pore pressures, gradients from well logs for the U.S. West Coast: Oil & Gas Journal, v. 82, (10/1/1984), p. 132, 133, 136-137. Matthews, W.R., and John Kelly, 1967, How to predict formation pressure and fracture gradient: Oil& Gas Journal, Reprint (2/20/1967), 7 p. Matthews, W.R., R.T. McClendon, and C.R, Soucek, 1972, How to predict formation pressures of Cretaceous - Jurassic age sediments – Mississippi: Society of Petroleum Engineers of AIME, SPE Paper 3895, p. 137-144. Raymer, L.L., Hunt, E.R., and Gardner, J.S., 1980, An improved sonic transit time-to-porosity transform: SPWLA Twenty-First Annual Logging Symposium Transactions, Lafayette, Louisiana, p. 1-12.
www.senergyworld.com
Petrophysics and Pore Pressure:
Pitfalls and Perfection
Andrew Buffin: Principal Petrophysicist
Senergy
AAPG Geoscience Technology Workshop
Singapore
28 -29 October 2010
Objective
• Often the petrophysical data we use can be uncalibrated and poorly
QC’ed.
• There can be an impact drilling a well using poorly constrained data
when calculating pore pressures?
Objective
• This presentation will:
• Demonstrate common petrophysical pitfalls
• Present a workflow that results in a creditable (‘perfect’) pore
pressure prediction.
Pore Pressure Prediction
• A good prediction of pore pressure requires integrated
data from:
• Geophysics
• Geology
• Petrophysics
• Drilling
Log Quality Control Log Header Information
• A comprehensive log header should document:
• Logs run
• Mud type and properties in the well
• Bottom hole temperatures
• Casing shoe depths
• Environmental corrections applied.
• Digital databases are frequently presented without adequate log acquisition information and potential interpretation errors may result
Log Header
Information
Purpose
Tool Types Environmental
Corrections.
Casing points Identify potential gaps,
poor data.
Drill and Log TD Identify depth
discrepancies.
Bottom Hole Temperature
(BHT)
Environmental
Corrections & estimation
of formation temperature.
Mud Type Environmental
Corrections & expected
log types, Potassium in
mud.
Mud Weight Environmental
Corrections.
Mud resistivities Environmental
corrections, Rw from SP.
List of Logs acquired Identification of available
curves.
Engineers remarks Warning of problems
acquiring logs.
Log Quality Control Depth Control
• Depth is the most important measurement made in logging; however logs can be off-depth for several reasons:
• Incorrect log offset adjustments can be applied by logging
engineer
• Successive runs in a well may not be correctly depth matched
• Tool sticking can cause apparent tool movement due to cable
stretch – see tension logs.
• Problems are often restricted to pad tools, for example Density
and Neutron logs.
• Hence GR for first run non-pad tool usually used as reference log.
Environmental Corrections
• All logging companies publish chart-books of log environmental
corrections
• Logging tools are calibrated to work in a particular environment
• The further you get away from this environment the greater the need
to apply an environmental correction to the resultant log curves
• Sometimes environmental corrections are applied at the well site,
computer centre post processed before delivery to the client or done
by the client/consultant sometime later
• Understanding what has or has not been corrected for can often be a
challenge, especially on older data where all curve history has been
lost
• In such circumstances it's better not to correct than over-correct.
Unless a correction is obviously required
• A main motive for environmental correcting data is to try and
standardise curves and then perhaps your interpretation parameters.
Wireline data – Mineralogy & Lithology
• Mica
• Affects Gamma Ray
• Plugs Formation Tester tool
• Coal
• Affects Resistivity & Sonic tools
• Can cause shoulder bed effects
on thin sands
• Carbonaceous material
• Affects the density tools
• Volcanics
• Affects neutron tools & imaging
tools (magnetometer)
• May look like clay
• May look like sand
• Pyrite
• Affects resistivity tools (highly
conductive)• Affects density – small
percentage has a large effect
leading to incorrect porosity
• Siderite
• Affects the density tool leading
to incorrect porosity
• Carbonate cemented sandstone
• Affects the density tool leading
to incorrect porosity
• Thin bed effects
• Sandstone - shale sequence on
GR can appear as
“homogeneous” siltstone
Wireline – Formation Tester
• The purpose of the tool is to
obtain formation pressures and
to sample formation fluids:
• A retractable probe is sealed,
using a rubber packer, against
the borehole wall.
• A pressure draw-down is
applied at the probe and
formation fluid flows through
probe into the tool.
• The pressure measured by
the tool will equilibrate to
formation pressure if the
formation is sufficiently
permeable and the wait time
long enough.
Piston
Pressure
Gauge
Fluid
Sample
Chambers
(5-20 litres)
Borehole
Mud cake
Pre-test
Chambers
(10cc
each)
Probe
Packer
Tool Probe
Equalising
Valve
x
MDT
Wireline – Formation Tester
• Important Considerations Formation Pressure Tester
• If the pressure returns to the higher ‘mud’ pressure it is likely the packer is not sealing against the formation.
• In tight formation (low permeability) the pressure of the mud filtrate may not be dissipated within the formation, leading to pressure readings intermediate between mud and formation pressures. This effect is ‘supercharging’.
• Pressure / sampling points should be selected from in-gauge hole, avoiding washouts
ensure a bad hole flag is run prior to picking pressure points
• Measurements should be taken going from shallow to deep to avoid gauge hysteresis
• Depth control on the Formation Pressure Tester measurements is important:
• Always run a Gamma ray log for correlation and depth control
• Use of Image data to pick points in thin heterogeneous sand
• Ensure that the Formation Pressure Tester includes a header that includes:
• All pressures
• Times and duration of tests
• Set pressure
• Basic observations such as:• Tight
• Poor seal
• Seal failed
• Tool failed
Preparation for Interpretation
• Talk to the rest of the team• Stratigraphy – Tops: Geologist /
• Has a thorough quality control and quality assurance been undertaken of all the log data (depth, splicing, formation pressure data, drilling data)
• Have the appropriate environmental corrections been made?
• Has all the header information been collated and utilised effectively?
• Have adverse hole conditions been identified and accounted for:
• Has all off-set data been incorporated into the model?
• Are there ‘exotic’ minerals / lithologies present in the well bore and have these mineral properties been adopted in the analysis
Pre Processing Data
When data compilation is
complete, the following
'Preparation workflow‘
(Refer to right)
should be followed before
proceeding to the
Pore Pressure evaluation
modules
The Pore Pressure Work Flow
• Pore Pressure Calculation
modules comprise the following
three tools:
1. Density Estimation
2. Overburden Gradient
Calculation
3. Calculate:
• Pore Pressure Gradient
• Fracture Pressure Gradient
• These tools can be used to
evaluate the subsurface
pressures encountered within a
well.
• Based on conventional log
curves, drilling information and
seismic data input. They enable
the user to model:
• Overburden (OB)
• Pore Pressure (PP)
• Fracture Pressure (FP)
• It can be used as a pre-drill
(predictive) and while-drilling
(real-time) tool, as well as for
post-drilling analysis to update
and refine OB, PP and FP
models.
1. Density Estimation
• First Module Provides the user with a means to generate a density curve
from sonic log data
• When density log information is not available it is often estimated from P-
wave velocity (Vp) using an empirical relationship.
• A number of authors have published density-sonic transit time algorithms
e.g. Gardner, Bellotti et al or Lindseth
• Density
• The Density Log should track the
Sonic or Neutron log in sands and
limestone.
• Affected in washed out or rugose
holes due to lack of pad contact.
• Check the Caliper and density
correction (∆ρb) curves. ∆ρb should
be less than 0.05 gm/cc; if larger the
density log is likely to be unusable.
• Sonic • Compressional Sonic log should track
the other porosity logs
• Cycle skipping is a common problem; slower velocity can occur in washed out hole.
• Shear Sonic• Shear logs have a slower velocity
than the compressional sonic but the two logs normally track each
• A quality control check can be made by using a Vs v Vp plot with reference to a Greenberg-Castagna sand and mud line overlay.
2. Overburden Gradient Calculation
• The second module within the Pore Pressure Calculation suite calculates :
• Instantaneous average Overburden Gradient (OBG) &
• Overburden Pressure (OBP) curves
• These are calculated relative to the 'reference depth' datum :
• KB (TVD KB) ,
• Mean Sea Level (TVDSS)
• TVD Sea Bed.
Header Information
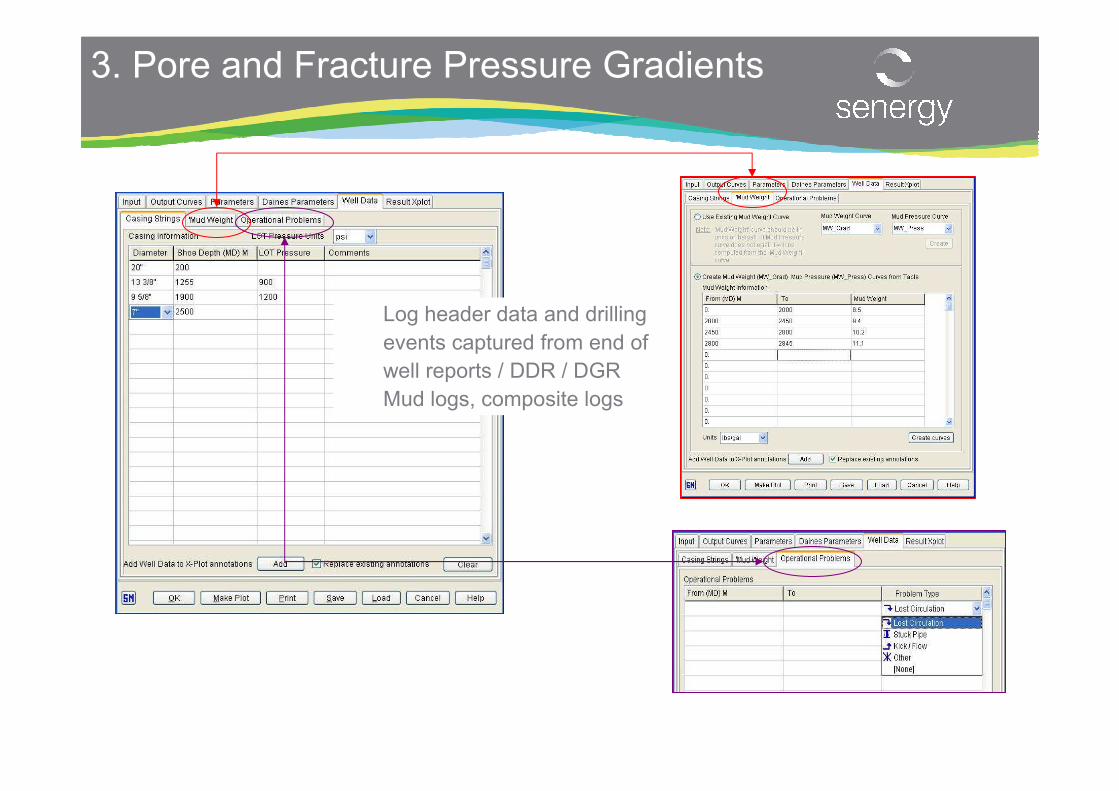
3. Pore and Fracture Pressure Gradients
• The final module provides the user with the methodologies to generate Pore Pressure and Fracture Pressure gradient models for the study well, based on the analysis of input log curves and additional drilling information
• Five Fracture Gradient models are implemented in IP. These are:
• Eaton
• Matthews & Kelly
• Modified Eaton
• Barker & Wood
• Daines
Shale Discriminator Curve
• Using Gamma Ray
• In a sand / shale sequence the GR log normally responds to
lithology change; however An elevated Gamma Ray can result
from a number of situations:
• Uranium enriched mineral sands
• Volcanic ash
• Phosphates – fossil shell fragments.
• Note GR readings decrease in large diameter hole or if run through
casing.
• When calculating Vsh ensure:
• All log data is reviewed including the density – neutron logs
• Mud log cutting descriptions are integrated
• Core and / or sidewall core data are included in the review
Resistivity Curve
• Pore Pressure from Resistivity has a number of limitations which must be considered during an evaluation:
• Variations in Cation Exchange Capacity (CEC) affect the normal shale compaction trend line
• Formation temperature and fluid salinity effects are significant, especially at shallow depths
• The methodology becomes less accurate at deep burial depths where porosity is low
• Induction Resistivity• There are induction limitations when run in saline mud and resistive
formations and works best in low resistivity formations
• Laterolog Resistivity• Problems with the Deep Laterolog can occur below thick resistive beds