Page 1
Nd:YAG laser surface hardening of AISI 431 stainless steel;
mechanical and metallurgical
investigation Khorram, A., Davoodi Jamaloei, A., Jafari, A. & Moradi, M. Author post-print (accepted) deposited by Coventry University’s Repository Original citation & hyperlink:
Khorram, A, Davoodi Jamaloei, A, Jafari, A & Moradi, M 2019, 'Nd:YAG laser surface hardening of AISI 431 stainless steel; mechanical and metallurgical investigation', Optics and Laser Technology, vol. 119, 105617. https://dx.doi.org/10.1016/j.optlastec.2019.105617
DOI 10.1016/j.optlastec.2019.105617 ISSN 0030-3992 Publisher: Elsevier NOTICE: this is the author’s version of a work that was accepted for publication in Optics and Laser Technology. Changes resulting from the publishing process, such as peer review, editing, corrections, structural formatting, and other quality control mechanisms may not be reflected in this document. Changes may have been made to this work since it was submitted for publication. A definitive version was subsequently published in Optics and Laser Technology, 119 (2019) DOI: 10.1016/j.optlastec.2019.105617 © 2019, Elsevier. Licensed under the Creative Commons Attribution-NonCommercial-NoDerivatives 4.0 International http://creativecommons.org/licenses/by-nc-nd/4.0/ Copyright © and Moral Rights are retained by the author(s) and/ or other copyright owners. A copy can be downloaded for personal non-commercial research or study, without prior permission or charge. This item cannot be reproduced or quoted extensively from without first obtaining permission in writing from the copyright holder(s). The content must not be changed in any way or sold commercially in any format or medium without the formal permission of the copyright holders. This document is the author’s post-print version, incorporating any revisions agreed during the peer-review process. Some differences between the published version and this version may remain and you are advised to consult the published version if you wish to cite from it.
Page 2
1
Nd:YAG Laser Surface Hardening of AISI 431 Stainless
Steel; Mechanical and Metallurgical Investigation
Ali Khorram1*, Akbar Davoodi Jamaloei2, Abed Jafari3, Mahmoud Moradi4, 5
1- Department of Mechanical Engineering, K. N. Toosi University of Technology, Tehran,
Iran
2- Department of Material Science and Engineering, Isfahan University of Technology,
Esfahan, Iran
3- Department of Material and Metallurgy Engineering, Iran University of Industries and
Mines (IUIM), Tehran, Iran
4- Department of Mechanical Engineering, Faculty of Engineering, Malayer University,
Malayer, Iran
5- Laser Materials Processing Research Center, Malayer University, Malayer, Iran
[email protected]
Abstract
In the present study, Nd:YAG laser surface hardening of AISI 431 stainless steel was
performed. The effect of process parameters was investigated on the geometrical dimensions
of the hardened zone, micr ohardness distribution, and microstructure of AISI 431 stainless
steel. The results reveal that increasing the laser frequency and the pulse width causes more
heat input. Therefore, the geometrical dimensions of the hardened zone rise. On the other hand,
more heat input causes to increase the prior austenite grain size which contains the martensitic
phase. So, the hardness value of laser treated region decreases. When the scanning speed and
the focal plane position increase, the heat input decreases. Hence, the geometrical dimensions
of the hardened zone reduce. The average hardness value increases by reducing the scanning
speed due to the increase of the martensitic phase and the decrease of retained austenitic phase
in the microstructure. Also, decreasing the heat input induced by increasing the focal plane
position causes the grain size reduces and the hardness value increases. The structure consists
of three regions (hardened zone, heat affected zone, and base metal). The microstructure of the
hardened region consists of delta ferritic phase, martensitic phase and a small amount of
retained austenitic phase. The best laser hardening condition is at the laser frequency of 17 Hz,
Page 3
2
the pulse width of 18ms, the scanning speed of 20 mm/min, and the focal plane position of 7.5
mm. The hardness, the depth and the width of the hardened layer for the optimum sample are
650 Hv, 330 µm and 2020 µm, respectively.
Keywords:
Laser surface hardening; Nd:YAG pulsed laser; AISI 431 stainless steel; Microhardness;
Microstructure.
Page 4
3
1. Introduction
Nowadays, surface operations play a significant role in increasing the life of components
and controlling the degradation of sensitive alloys. The laser transformation hardening process
is an appropriate method that has higher accuracy and speed than traditional processes such as
flame hardening [1]. In this process, the interaction of the laser beam with the surface of work
piece causes to generate heat on the surface of the sample. Part of this heat is transferred to the
work piece and leads to an increase in its surface temperature. Rapid heating and cooling rates
can cause the surface hardening of alloy by phase transformation [2, 3].
The basis of laser hardening in steels includes two transformations: (1) reaching to the
austenitic phase due to heating and (2) achieving the martensitic phase due to rapid cooling [4].
Enough time is needed to homogenize the austenitic phase. Due to the short time of the laser
process, there is not enough time for carbon penetration, and austenitic homogenization does
not occur completely. As a result, the amount of carbon, as well as, its distribution in the
microstructure has a significant role in the final microstructure and the distribution of hardness
in the hardened region [1]. This matter shows the role of laser process parameters, including
the heat input, the laser scanning speed and the focal plane position in the phase transformations
during the process.
One of the most important groups of iron-based alloys is stainless steel that is used in a
wide range of equipment in various industries. AISI 431 martensitic stainless steel is one of the
most widely used steels in various industries such as power industry, chemical industry, and
aerospace industry [5, 6]. Therefore, investigation of the surface hardening process of AISI 431
stainless steel is important.
Mahmudi et al. [7] investigated the effect of laser process parameters, including pulse width
and laser speed, on the hardness variations of AISI 420 alloy. They reported that, in optimal
conditions, the hardness value increases by up to 90%. Hirogaki et al. [8] illustrated that the
Page 5
4
hardness value of steel for the laser hardening process and the traditional treatment process was
approximately 900 Hv and 850 Hv, respectively. Also, they reported that the laser hardening
process has more advantages compared to the traditional heat treatment process [8, 9]. Lo et
al. [10] investigated the effect of Nd: YAG laser parameters on the hardened region of 440c
martensitic stainless steel. They reported that the hardened area consists of martensitic phase,
retained austenitic phase and carbide. The hardness value varied from 600 to 800 Hv depending
on the parameters of the laser process. Ameri et al. [11] studied laser hardening of ICD-5 steel
and reported an increase in hardness value up to 100 Hv. Increasing the laser power and
decreasing the speed cause to homogenize the austenitic phase and increase the hardness value.
Surface hardening of EN-SJS-1000-5 and EN-SJS 800-8 steels by using a laser with a
maximum power of 2.2 kV was studied by Soriano et al. [12]. The results showed that the
martensitic phase and residual austenitic phase exist in the microstructure. The hardened depth
and the hardness value varied between 600-1000 µm and 650-800 Hv, respectively. Tani et al.
[13] investigated the laser surface hardening of AISI 420B martensitic stainless steel. The
results indicated that by raising laser scanning speed, both the maximum hardened depth and
the hardness value decreased. Babu et al. [14] reported that changes in laser power and laser
scanning speeds have the most influence on the hardened area. So that increasing the laser
power causes to increase the depth and the width of hardened area, while reducing the laser
speed causes to increase the depth and the width of the hardened area. Zirehpour et al. [15]
reported that martensitic phases, residual austenitic phases, and carbide are formed in the laser
hardened area of AISI 420 alloy. Cordovilla et al. [16] increased the hardness of AISI 440
stainless steel from 300 Hv to about 750 Hv by optimization of the process. Telasang et al. [17]
increased the hardness of H13 steel up to 800 Hv by the laser transformation hardening process.
An overview of previous studies shows that laser surface hardening has been carried out on
various types of stainless steel, but no reports about laser surface hardening of AISI 431
Page 6
5
stainless steel have been presented. Since the development of control methods of laser
parameters has a direct effect on the balance between heating and cooling in the heated area,
in this study the effect of laser process parameters such as laser frequency, pulse width,
scanning speed, and focal plane position was investigated on the geometrical dimensions of
hardened zone (Width, depth, entry angle), microhardness distribution, and microstructure of
431 stainless steel.
2. Experimental Work
2.1 Material and Experimental Set-up
Round bar AISI 431 martensitic stainless steel with the chemical composition mentioned in
Table 1 was used in this study. Samples were cut as discs with 10 mm thickness, and then the
surface of samples was ground to obtain a smooth surface.
Table 1. Chemical composition of AISI 431 stainless steel (Wt. %).
Fe S P Si Mn Cr Ni C Element
base 0.005 0.01 0.14 0.42 16.90 1.52 0.12 Weight
percent
The experiments were performed by a pulsed Nd: YAG laser (Model IQL-10) with 400W
average laser power. The available range for the pulse duration, the laser frequency, and the
pulse energy are 0.2–20 ms, 1–1000 Hz, and 0–40 J, respectively.
The Nd:YAG laser used in this study has a Gaussian distribution in which the heat input in
the center of the laser beam is more than the corners of it and by moving from the center toward
the corners, the energy intensity of laser decreases. Also, by increasing distance from the focal
plane position of the laser, the energy intensity decreases and the divergence of laser beam
increases.
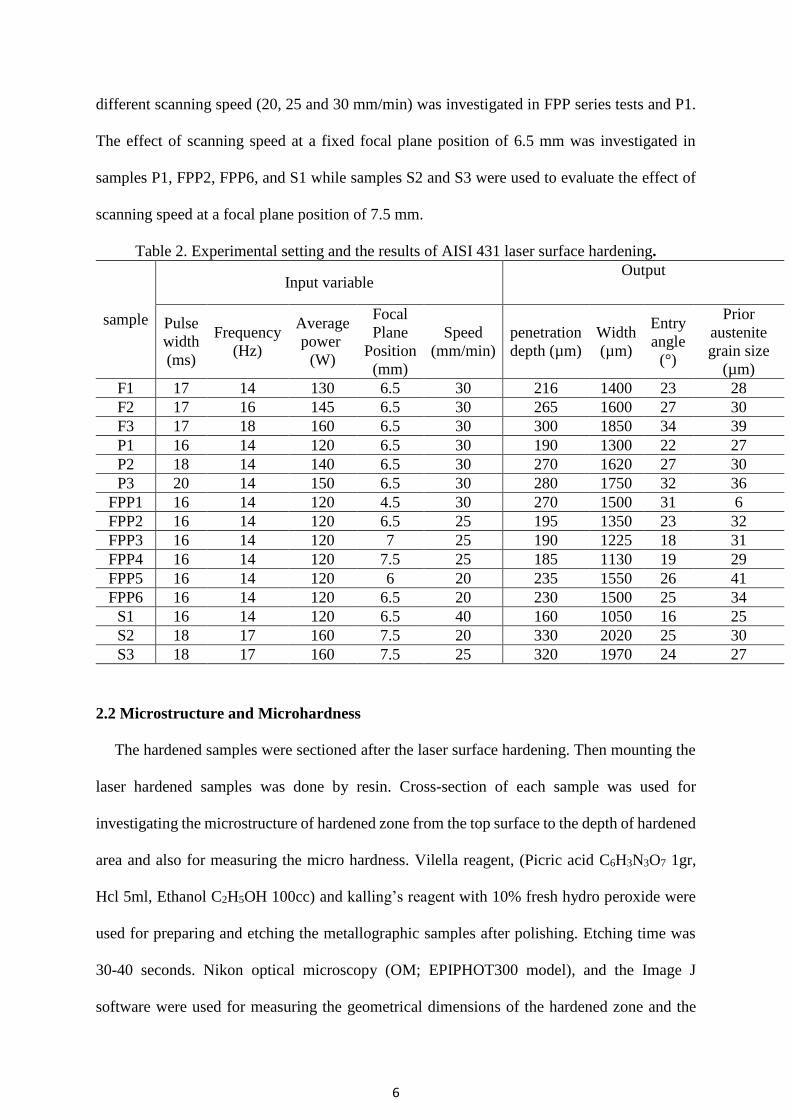
Experimental settings and the results of laser hardening process are shown in Table 2. As
shown, the effect of laser frequency was investigated in F series tests. Also, the effect of pulse
width was studied in P series tests and F1. The effect of focal plane position (FPP) in three
Page 7
6
different scanning speed (20, 25 and 30 mm/min) was investigated in FPP series tests and P1.
The effect of scanning speed at a fixed focal plane position of 6.5 mm was investigated in
samples P1, FPP2, FPP6, and S1 while samples S2 and S3 were used to evaluate the effect of
scanning speed at a focal plane position of 7.5 mm.
Table 2. Experimental setting and the results of AISI 431 laser surface hardening.
Output Input variable
sample Prior
austenite
grain size
(µm)
Entry
angle
(°)
Width
(µm)
penetration
depth (µm)
Speed
(mm/min)
Focal
Plane
Position
(mm)
Average
power
(W)
Frequency
(Hz)
Pulse
width
(ms)
28 23 1400 216 30 6.5 130 14 17 F1
30 27 1600 265 30 6.5 145 16 17 F2
39 34 1850 300 30 6.5 160 18 17 F3
27 22 1300 190 30 6.5 120 14 16 P1
30 27 1620 270 30 6.5 140 14 18 P2
36 32 1750 280 30 6.5 150 14 20 P3
6 31 1500 270 30 4.5 120 14 16 FPP1
32 23 1350 195 25 6.5 120 14 16 FPP2
31 18 1225 190 25 7 120 14 16 FPP3
29 19 1130 185 25 7.5 120 14 16 FPP4
41 26 1550 235 20 6 120 14 16 FPP5
34 25 1500 230 20 6.5 120 14 16 FPP6
25 16 1050 160 40 6.5 120 14 16 S1
30 25 2020 330 20 7.5 160 17 18 S2
27 24 1970 320 25 7.5 160 17 18 S3
2.2 Microstructure and Microhardness
The hardened samples were sectioned after the laser surface hardening. Then mounting the
laser hardened samples was done by resin. Cross-section of each sample was used for
investigating the microstructure of hardened zone from the top surface to the depth of hardened
area and also for measuring the micro hardness. Vilella reagent, (Picric acid C6H3N3O7 1gr,
Hcl 5ml, Ethanol C2H5OH 100cc) and kalling’s reagent with 10% fresh hydro peroxide were
used for preparing and etching the metallographic samples after polishing. Etching time was
30-40 seconds. Nikon optical microscopy (OM; EPIPHOT300 model), and the Image J
software were used for measuring the geometrical dimensions of the hardened zone and the
Page 8
7
grain size. The depth (H), the width (W) and the entry angle (α) of the hardened area were
measured according to Fig. 1. Philips scanning electron microscopy (SEM; XI30 model)
equipped with energy dispersive spectroscopy (EDS) was used for precise investigating the
microstructure in higher magnifications. X-ray diffraction (XRD) analysis was performed for
identifying phases that exist in the laser hardened zone and the base metal. The micro-
indentation device (Buhler Micrometer 2010) was applied for measuring the Vickers micro
hardness from the surface to the depth of samples and also in the width of samples. Maximum
load of 100 gr and a dwell time of 30 s were used to measure the micro hardness.
Fig. 1 shows a schematic diagram of the laser surface hardening process with the hardened
geometrical dimensions and the hardness measuring paths. As it is seen in Fig. 1, the hardness
was measured in two paths; one direction is along a line, 50 µm below the top surface, on the
transversal cross-section of the hardened zone and the other direction is along the vertical line
from the top surface to the base metal.
Fig. 1. Scheme of laser surface hardening process with the hardened geometrical dimensions
and the hardness measuring paths.
Page 9
8
3. Results and discussion
3.1 Effect of laser parameters on the geometrical dimensions of the hardened zone
Fig. 2 shows the cross section of some laser surface hardened samples in different input
parameters. As can be seen, the variation of input parameters has a significant effect on the
geometry of the hardened zone (Table 2 and Fig. 2).
Fig. 2. Cross section of some laser hardened samples in different input parameters.
Interaction time [18] and density of laser beam [19] are calculated by Eqs. 1 and 2,
respectively. Heat input and pulse energy [19] can be represented by Eqs. 3 and 4, respectively.
The relation between the focal plane positions, the incident beam area, the interaction time and
the beam density is given in Table 3.
T =D Beam
S (1)
where T is the interaction time, DBeam is the incident beam diameter, and S is the scanning speed.
BDensity =Pave
ABeam (2)
Here, BDensity is the density of laser beam, Pave is the average laser power, and ABeam is the
incident beam area.
H =Pave
S (3)
where H is the heat input, Pave is the average laser power and S refers the scanning speed.
Page 10
9
E =Pave
F (4)
Here, E is the pulse energy, Pave is the average laser power, and F is the laser frequency.
Table 3. The relationship between the focal plane positions, the incident beam area, the
interaction time and the beam density.
Pulse
energy
(J)
Heat
input
(J/mm)
Interaction
time ×
beam
density
(J/mm2)
Beam
density
(W/mm2)
Interaction
time (S)
Incident
Beam
Area
(mm2)
Incident
Beam
Diameter
(mm)
Focal
Plane
Position
(mm)
Sample
9.28 260 124.48 23.40 5.32 5.55 2.66 6.5 F1
9.06 290 138.88 26.10 5.32 5.55 2.66 6.5 F2
8.88 320 153.24 28.80 5.32 5.55 2.66 6.5 F3
8.57 240 114.93 21.60 5.32 5.55 2.66 6.5 P1
10 280 134.093 25.20 5.32 5.55 2.66 6.5 P2
10.71 300 143.671 27.00 5.32 5.55 2.66 6.5 P3
8.57 240 122.29 24.45 5 4.90 2.5 4.5 FPP1
8.57 288 137.92 21.60 6.38 5.55 2.66 6.5 FPP2
8.57 288 126.51 18.17 6.96 6.60 2.9 7 FPP3
8.57 288 120.63 16.54 7.29 7.25 3.04 7.5 FPP4
8.57 360 175.03 22.26 7.86 5.38 2.62 6 FPP5
8.57 360 172.40 21.60 7.98 5.55 2.66 6.5 FPP6
8.57 180 86.20 21.60 3.99 5.55 2.66 6.5 S1
9.41 480 201.13 22.05 9.12 7.25 3.04 7.5 S2
9.41 384 160.91 22.05 7.29 7.25 3.04 7.5 S3
3.1.1 Effect of Laser Frequency
Fig. 3 presents variations of geometrical dimensions of the hardened zone (depth, width,
and entry angle) versus the laser frequency for samples F1, F2, and F3. By increasing the laser
frequency from 14 Hz to 18 Hz, the depth of the hardened zone increases from 216 µm to 300
µm. In addition, the width of the hardened zone increases from 1400 µm to 1850 µm. Increasing
the entry angle from 23 degree to 34 degree with increasing the laser frequency exhibits more
depth of hardened zone. By increasing the laser frequency, laser pulses are generated faster and
hence, the heat input increases from 260 J/mm to 320 J/mm. So, more heat is transferred to the
surface of samples which causes to raise the hardened area.
Page 11
10
Fig. 3. Influence of the laser frequency on the geometry of the hardened zone.
3.1.2 Effect of Pulse Width
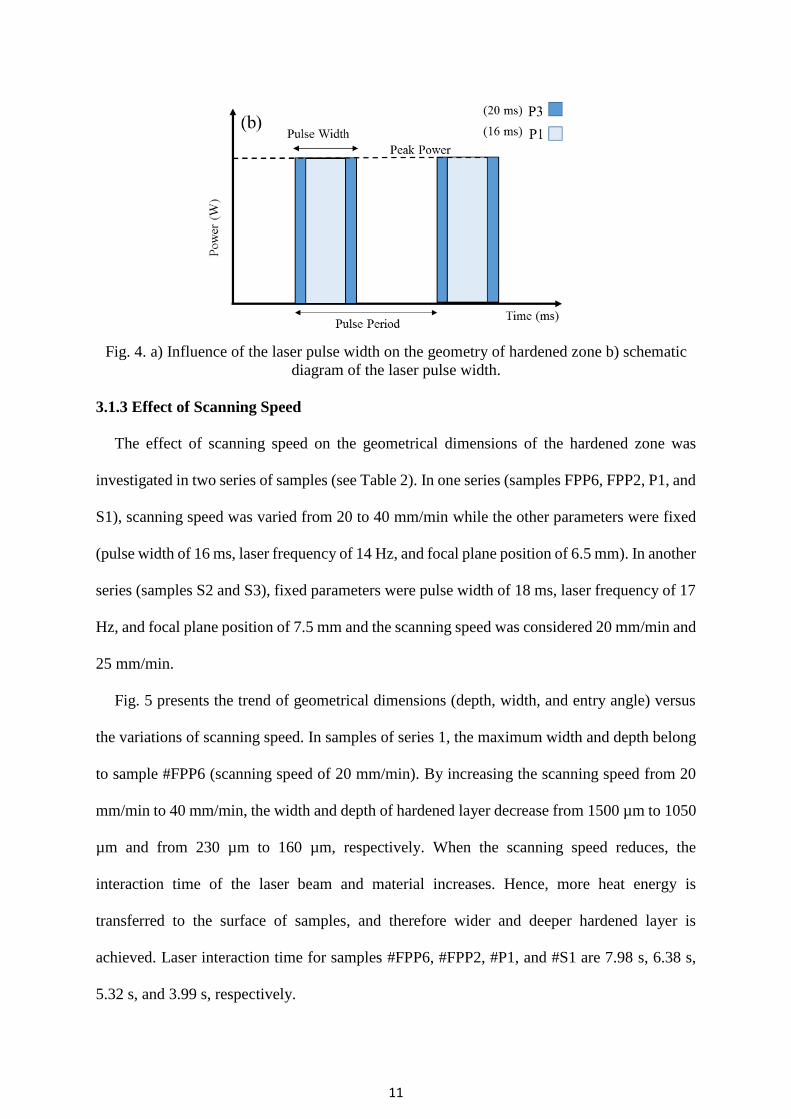
By increasing the laser pulse width, all dimensions of the hardened zone rise (Fig. 4a). The
concept of increasing the pulse width is shown in Fig. 4b. It can be seen that when higher pulse
width is used, the energy of pulse will increase (see Table 3). Higher energy causes more heat
is transferred to the work piece, and therefore the hardened zone will increase.
Page 12
11
Fig. 4. a) Influence of the laser pulse width on the geometry of hardened zone b) schematic
diagram of the laser pulse width.
3.1.3 Effect of Scanning Speed
The effect of scanning speed on the geometrical dimensions of the hardened zone was
investigated in two series of samples (see Table 2). In one series (samples FPP6, FPP2, P1, and
S1), scanning speed was varied from 20 to 40 mm/min while the other parameters were fixed
(pulse width of 16 ms, laser frequency of 14 Hz, and focal plane position of 6.5 mm). In another
series (samples S2 and S3), fixed parameters were pulse width of 18 ms, laser frequency of 17
Hz, and focal plane position of 7.5 mm and the scanning speed was considered 20 mm/min and
25 mm/min.
Fig. 5 presents the trend of geometrical dimensions (depth, width, and entry angle) versus
the variations of scanning speed. In samples of series 1, the maximum width and depth belong
to sample #FPP6 (scanning speed of 20 mm/min). By increasing the scanning speed from 20
mm/min to 40 mm/min, the width and depth of hardened layer decrease from 1500 µm to 1050
µm and from 230 µm to 160 µm, respectively. When the scanning speed reduces, the
interaction time of the laser beam and material increases. Hence, more heat energy is
transferred to the surface of samples, and therefore wider and deeper hardened layer is
achieved. Laser interaction time for samples #FPP6, #FPP2, #P1, and #S1 are 7.98 s, 6.38 s,
5.32 s, and 3.99 s, respectively.
Page 13
12
Fig. 5. Influence of the scanning speed on the geometry of hardened zone; Series 1: Pulse
width= 16 ms, Frequency= 14 Hz, FPP= 6.5 mm, Series 2: Pulse width= 18 ms, Frequency=
17 Hz, FPP= 7.5 mm.
The focal plane position in samples of series 2 is more than samples of series 1, which leads
to increase the incident beam area and decrease the energy density, but because of higher laser
frequency and higher pulse width, the geometrical dimensions increase significantly. The same
trend can be seen in samples of series 2, as by reducing the scanning speed the geometrical
dimensions of the hardened zone increase. The maximum width and depth of the hardened
layer belong to sample #S2 (scanning speed of 20 mm/min) which are 2020 µm and 330 µm,
respectively.
3.1.4 Effect of Focal Plane Position
The effect of focal plane position on the geometrical dimensions of the hardened zone was
investigated in three different scanning speed of 20, 25, 30 mm/min (samples #FPP1 to #FPP6,
and #P1). Decreasing the focal plane position leads to increase in the width and depth of the
hardened layer (Fig. 6). This phenomenon can be attributed to the beam density. In lower focal
plane position, the laser spot size and the incident beam area decrease and leads to higher laser
beam density. Therefore, the depth and the width of the hardened layer increase.
Page 14
13
As shown in Table 3, the focal plane position of samples #P1 and #FPP1 is 6.5 mm and 4.5
mm, respectively and laser beam density of these samples is 21.6 W/mm2 and 24. 45 W/mm2,
respectively. By decreasing the focal plane position from 6.5 to 4.5 mm, a considerable change
in the geometrical dimensions of the hardened zone is observed so that the hardened depth rises
from 190 to 270 µm, the hardened width rises from 1300 to 1500 µm, and the entry angle
increases from 22 to 31 degree (Fig. 6).
By increasing the focal plane position in samples #FPP2, #FPP3 and #FPP4 from 6.5 mm
to 7.5 mm, the laser beam density decreases from 21.6 W/mm2 to 16.54 W/mm2. Therefore,
the hardened depth reduces from 195 µm to 185 µm, the hardened width decreases from 1350
µm to 1130 µm and the entry angle decreases from 23 to 19 degree. When the focal plane
position increases from 6 mm (sample #FPP5) to 6.5 mm (sample #FPP6), the density of the
laser beam decreases from 22.26 W/mm2 to 21.60 W/mm2. Therefore, the depth and the width
of the hardened zone reduce (Fig.6 and Table 2).
Fig. 6. Influence of the focal plane position on the geometry of hardened zone; Series 1: Pulse
width= 16 ms, Frequency= 14 Hz, scanning speed= 30 mm/min, Series 2: Pulse width= 16
ms, Frequency= 14 Hz, scanning speed= 25 mm/min, Series 3: Pulse width= 16 ms,
Frequency= 14 Hz, scanning speed= 20 mm/min.
Page 15
14
3.2 Microstructure Analysis
3.2.1 Microstructure of Base Metal
The amount of ferritic phase in the microstructure and the type of stainless steel can be
identified by using the Schaeffler Delong diagram [20]. Equivalent chromium and nickel was
calculated for this alloy according to their equivalent relations and Table 1. Equivalent
chromium and nickel are about 17.11 Wt.% and 4.55 Wt.%, respectively. As shows in Fig. 7,
AISI 431 stainless steel contains approximately 40% ferritic phase at the room temperature.
Fig. 7. The position of stainless steel used in this study was marked with the red point in the
Schaeffler Delong diagram [20].
The microstructure of AISI 431 stainless steel is shown in Fig. 8. As can be seen, the
microstructure includes ferritic and martensitic phases. Thick and thin streaks of delta ferritic
phase were embedded in the grain boundary of prior austenite phases. The amount of ferritic
phase is between 37%-38.5%. As can be seen, here is a good agreement between the result
calculated by the Schaeffler Delong diagram and the result obtained by Image J software. Also,
the average grain size (prior austenitic phase which contains martensitic phase) was measured
in the surface of the sample (Fig. 8b). The average grain size was approximately 24 µm.
Page 16
15
Fig. 8. Microstructure of AISI 431 stainless steel a) OM and SEM images of cross section b)
OM image of the surface.
Page 17
16
XRD pattern of the base metal is shown in Fig. 9. It can be seen that all peaks are related to
the ferritic phase or Fe-Cr-Ni solid solution phase. Peaks of these phases are in the same
positions (see Fig. 9b). The tetragonality of this steel is close to 1 due to the small amount of
carbon (0.1 %). Therefore, the microstructure of this steel is cubic, and it is not observed any
pair of peaks related to martensite with BCT structure [17].
According to the results of XRD analysis (Fig. 9), there is not any significant secondary
phase in the microstructure. But by considering Fig. 8b, it seems that a small amount of carbide
exists in the microstructure (white color in the grain boundaries). XRD analysis cannot identify
these carbides because the amount of them is less than 5%.
Fig. 9. a) XRD patterns for the base metal b) the peak position of ferritic phase and Fe-Cr-Ni
solid solution phase.
Page 18
17
3.2.2. Microstructure of hardened zone
The microstructure of different zones of a typical hardened sample is shown in Fig. 10.
Three different zones including the hardened zone (martensitic microstructure), the heat
affected zone (partial martensitic microstructure), and the base metal (tempered martensitic
microstructure) are observed in this figure.
By comparing the microstructure between the base metal and the laser hardened zone, it is
found that the carbides placed in the grain boundaries of delta ferritic phase are dissolved after
laser hardening process and there are no carbides in the grain boundaries of the hardened zone
(Fig. 10b). In fact, due to the high cooling rate of laser hardening process, alloying elements in
the base metal do not have the opportunity to form the carbides. In this case, the structure has
a high internal stress, and the temperature of Ms decreases.
Page 19
18
Fig. 10. Microstructure of different zones of a typical hardened sample a) Optical
micrograph, b) SEM image of hardened zone c) SEM image of the heat affected zone d) SEM
image of base metal.
Due to radiation of the laser beam, the surface temperature rises to the austenitizing
temperature. In this case, the martensitic phase is rapidly transformed to the austenitic phase,
but the delta ferritic phase is not transformed to the austenitic phase completely due to two
reasons: 1) transformation of the delta ferritic phase to the austenitic phase is a diffusion
transformation and needs to a sufficient time, and 2) the heating and cooling rates of laser
hardening process are very rapid (non-equilibrium condition).
Page 20
19
The determinant phase in laser hardening of stainless steel is the martensitic phase which is
formed by a diffusion-less transformation [14]. Wherever the temperature is completely higher
than the austenitizing transformation temperature, the austenitic phase is transformed to the
martensitic phase during cooling (the hardened zone). In areas where the temperature is below
the austenitizing transformation temperature, the austenitic phase is not transformed to the
martensitic phase entirely (the heat affected zone).
Time and temperature are two important parameters of the diffusion phenomenon.
Generally, the effect of temperature is greater than time [21]. In laser hardening process, the
interaction time is very short; therefore, by considering the high temperature of the process, the
transformation of the ferritic phase to the austenitic phase occurs incompletely during heating.
This diffusion transformation occurs in the grain boundary between the delta ferritic phase and
the austenitic phase (transformed from prior martensitic phase). Thus, after the cooling process,
larger grains which contains martensitic phase (transformed from the austenitic phase) are
formed compared to the prior grains. Table 2 and Fig. 11 show the grain size in the surface of
samples. As seen, the grain size in all samples (except sample #FPP1) is larger than the prior
grain size.
According to CCT diagram of AISI 431 stainless steel, the formation of the martensitic
structure is easily possible at a cooling rate of more than 10.2 °C/min. The cooling rate in the
laser hardening process is much faster than 10.2 °C/min and the martensitic structure is formed
easily. Similar martensitic microstructure has been reported by other researchers [22, 23]. It
should be noted that by dissolution of alloying elements in the microstructure, the temperature
of Ms decreases, according to Eq. 5 [24]:
Ms (ºC) = 500-333C-34Mn-35V-20Cr-17Ni-11Mo-10Cu-5W-15Co+30Al (5)
The calculation shows that the martensitic transformation starts at a temperature of 81.9 ºC
during the cooling cycle. It was reported that the temperature of Mf is about 200 °C lower than
Page 21
20
the temperature of Ms [24]. Therefore, the temperature of Mf will be lower than the room
temperature, which leads to the presence of retained austenitic phase in the microstructure. By
increasing the heat input (induced by variation of the laser parameters), the austenitizing
temperature increases. So, the martensitic transformation temperatures (Ms and Mf) decreases,
and as a result, the amount of martensitic phase reduces in the microstructure.
Fig. 11 shows the hardened surface of samples. The amount of acicular martensitic phase is
different in samples. This can be attributed to the surface temperature of specimens and cooling
rate [25]. As can be seen in Fig. 11, there are some micro cracks in the center of hardened zones
(samples F3, and P3). Samples F3, and P3 have higher beam density compared to other samples
(28.80 W/mm2 and 27.00 W/mm2, respectively). The high beam density in samples F3 and P3
and rapid cooling rate lead to contraction and expansion between the delta ferritic phases and
martensitic phases. Hence, most cracks are created at the boundaries between these two phases.
The depth of micro cracks is about 4 µm, and they can be removed by a grinding process in the
industrial application.
Page 22
21
Fig. 11. Hardened surface of samples.
XRD pattern of the hardened zone is shown in Fig. 12. According to the XRD results, a
small amount of retained austenitic phase exists in the microstructure. The amount of retained
austenitic phase is more than about 5% because the X-ray test cannot detect phases lower than
5%. Therefore, it could be concluded that there are the martensitic phase, the delta ferritic
phase, and a small amount of retained austenitic phase in the microstructure. It was reported
Page 23
22
that as the cooling rate increases, the amount of interstitial carbon atoms in the austenitic phase
reduces and the Mf line (ending temperatures of martensitic transformation) decreases [26]. So,
there is still retained austenitic phase in the microstructure, and a martensitic microstructure is
not achieved completely.
Fig. 12. a) XRD pattern for the hardened zone b) The peak position of ferritic phase, Fe-Cr-
Ni solid solution phase, and austenitic phase.
A significant difference in microstructure is observed for some samples. A good instance is
samples #FPP1 and #FPP4. SEM and OM images of samples #FPP1 and #FPP4 are shown in
Fig. 13. As can be seen in Fig. 13a and b, there are two entirely different regions in the center
and the sides of sample #FPP1. The existence of dendritic structure in the central region of the
hardened zone demonstrates the solidification of the molten zone. The dendritic structure in
Page 24
23
sample #FPP1 is marked with the black circle in Fig. 11. Previous researches [27, 28] showed
that the surface melting can occur in the hardened zone due to the diffusion of alloy elements
(such as carbon) from high concentration regions into the matrix. It seems that the central
region was melted due to low focal plan position (4.5 mm), and high heat input. According to
Fig. 13a, b, the continuity of delta ferritic phases has reduced, and these phases have fractured.
It seems that this phenomenon is occurred due to the rapid melting in a short time.
Decomposing of the delta ferritic phase is difficult, and it takes a long time. In this sample,
high heat input around the molten zone leads to a martensitic transformation.
Fig 13c, d shows cross-section and surface images of sample #FPP4. As seen, there is not
fusion zone in the hardened zone of this sample due to the low beam density (16.54 W/mm2);
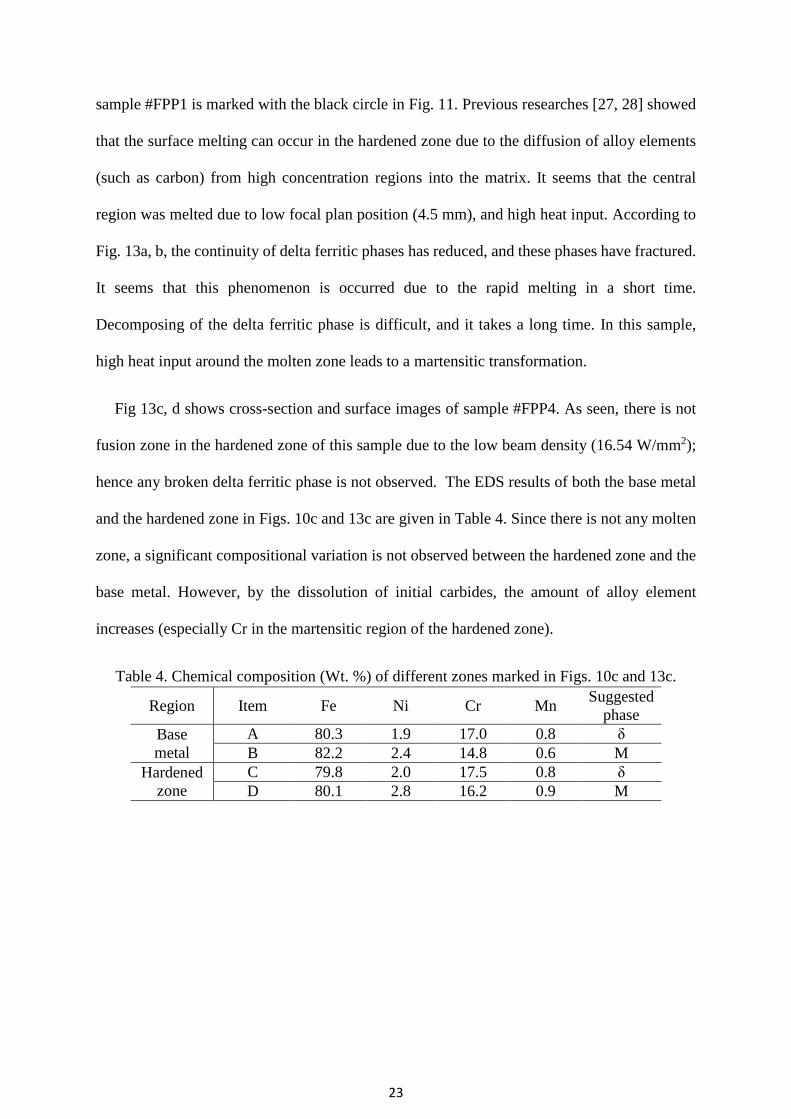
hence any broken delta ferritic phase is not observed. The EDS results of both the base metal
and the hardened zone in Figs. 10c and 13c are given in Table 4. Since there is not any molten
zone, a significant compositional variation is not observed between the hardened zone and the
base metal. However, by the dissolution of initial carbides, the amount of alloy element
increases (especially Cr in the martensitic region of the hardened zone).
Table 4. Chemical composition (Wt. %) of different zones marked in Figs. 10c and 13c.
Region Item Fe Ni Cr Mn Suggested
phase
Base
metal
A 80.3 1.9 17.0 0.8 δ
B 82.2 2.4 14.8 0.6 M
Hardened
zone
C 79.8 2.0 17.5 0.8 δ
D 80.1 2.8 16.2 0.9 M
Page 25
24
Fig. 13. SEM and OM Images a) Cross section of sample #FPP1, b) Surface of sample
#FPP1, c) Cross section of sample #FPP4, d) Surface of sample #FPP4.
3.3 Micro hardness Distribution
Fig. 14a displays two indenter points on the delta ferritic phase and the martensitic phase in
the hardened zone. Measurements show that the hardness of the ferritic phase is about 375 Hv
while the hardness of the martensitic phase is about 780 Hv. The stretched delta ferritic phases
along the depth direction lead to a high measurement error in this section (Fig. 14b). Therefore,
micro hardness measurement was performed along the width direction of the hardened zone
because the ferritic and martensitic phases were distributed on this section homogeneously.
Page 26
25
Fig. 14. a) Effect of indenter on the ferritic phase and the martensitic phase in the hardened
zone b) Micro hardness distribution along the depth direction of the hardened zone.
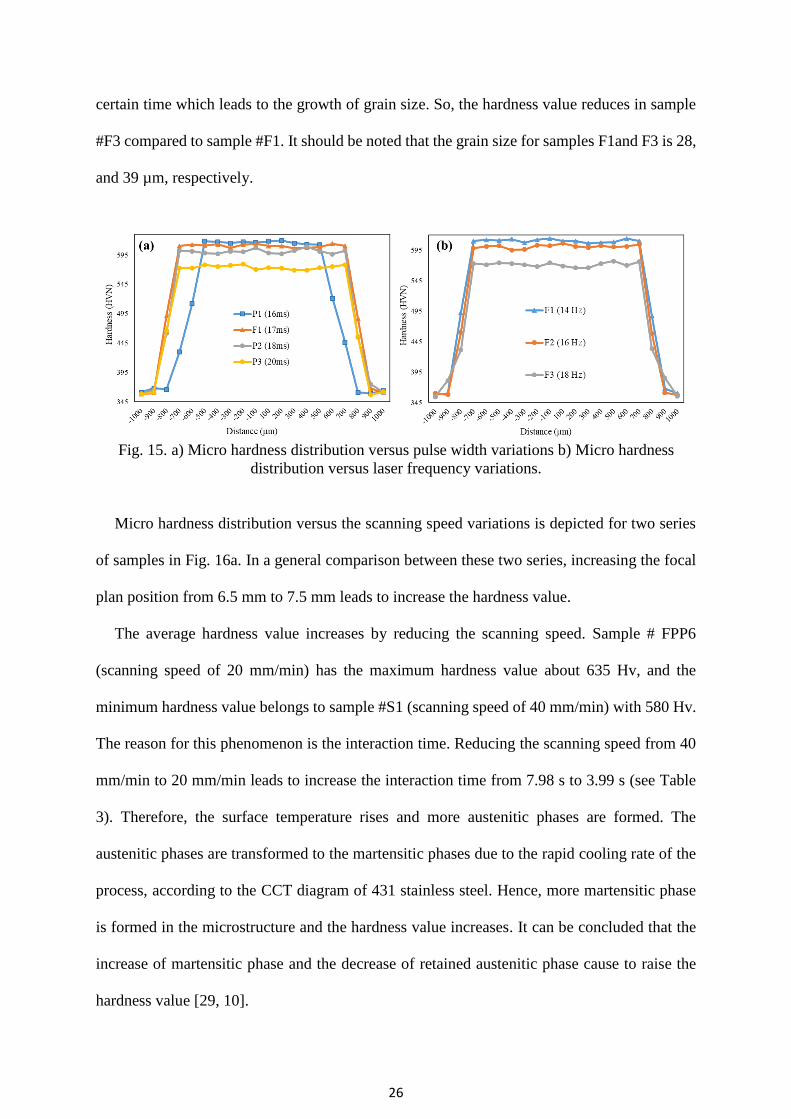
Fig. 15a and b depicts the micro hardness distribution versus the pulse width variations and
the laser frequency variations, respectively. As can be seen in Fig. 15a, sample #P1 (pulse
width= 16 ms) has the maximum hardness value about 615 Hv, and the minimum hardness
value belongs to sample #P3 (Pulse width= 20 ms) with 575 Hv. By increasing the pulse width,
the laser energy increases and more heat input is transferred to the material. So the temperature
of samples rises. Increasing the temperature causes to raise the austenite grain size. As a result,
larger grains are formed and, the hardness value decreases. Reducing the hardness value in
sample #P3 compared to sample #P1 can be attributed to increase of the grain size. The prior
austenite grain size which contains martensitic phase for samples P1, F1, P2, and P3 is 27 µm,
28 µm, 30 µm, and 36 µm, respectively.
As shown in Fig. 15b, Sample #F3 (laser frequency= 18 Hz) has the minimum hardness
value about 570 Hv and the maximum hardness value belongs to sample #F1 (laser frequency=
14 Hz) with 610 Hv. The interaction time and the beam density for sample #F3 are 5.32 s and
28.8 W/mm2, respectively. These values for sample #F1 are 5.32 s and 23.4 W/mm2,
respectively. Multiplying the interaction time by the beam density indicates the energy per area.
This value is 124.48 J/mm2 for sample #F1 and 153.24 J/mm2 for sample #F3. A comparison
between samples #F1 and #F3 shows that more energy per area transfers to sample #F3 in a
Page 27
26
certain time which leads to the growth of grain size. So, the hardness value reduces in sample
#F3 compared to sample #F1. It should be noted that the grain size for samples F1and F3 is 28,
and 39 µm, respectively.
Fig. 15. a) Micro hardness distribution versus pulse width variations b) Micro hardness
distribution versus laser frequency variations.
Micro hardness distribution versus the scanning speed variations is depicted for two series
of samples in Fig. 16a. In a general comparison between these two series, increasing the focal
plan position from 6.5 mm to 7.5 mm leads to increase the hardness value.
The average hardness value increases by reducing the scanning speed. Sample # FPP6
(scanning speed of 20 mm/min) has the maximum hardness value about 635 Hv, and the
minimum hardness value belongs to sample #S1 (scanning speed of 40 mm/min) with 580 Hv.
The reason for this phenomenon is the interaction time. Reducing the scanning speed from 40
mm/min to 20 mm/min leads to increase the interaction time from 7.98 s to 3.99 s (see Table
3). Therefore, the surface temperature rises and more austenitic phases are formed. The
austenitic phases are transformed to the martensitic phases due to the rapid cooling rate of the
process, according to the CCT diagram of 431 stainless steel. Hence, more martensitic phase
is formed in the microstructure and the hardness value increases. It can be concluded that the
increase of martensitic phase and the decrease of retained austenitic phase cause to raise the
hardness value [29, 10].
Page 28
27
The average hardness value of samples #S2 and #S3 with scanning speed of 20 mm/min and
25 mm/min is 650 Hv and 620 Hv, respectively. By increasing the scanning speed from 20 to
25 mm/min, the laser interaction time decreases from 9.12 s to 7.29 s. Therefore, there is not
sufficient time to form a fully austenitic phase in sample #S3 compared to sample #S2. As a
result, lower martensitic phase is formed in the microstructure, and the hardness value
decreases. As can be seen, The focal plan position of 7.5 mm in these samples provides better
conditions compared to samples with the focal plan position of 6.5 mm.
In Fig. 16b, micro hardness distribution versus the focal plane position variations is depicted
for different scanning speeds. The focal plane position has a direct relationship with the beam
density and the heat input. By increasing the focal plane position, the laser spot size rises.
Increasing the laser spot size causes the laser beam intensity and the heat input decrease (Table
3). So, the grain size reduces and the hardness value increases. Therefore, increasing the
hardness value is occurred by increasing the focal plane position. The maximum hardness value
belongs to samples #FPP4 (focal plane position of 7.5 mm) and #FPP6 (focal plane position of
6.5). It should be noted that sample #FPP1 with smaller grain size (6 µm) has a lower hardness
value compared to the other samples. The reason for this phenomenon is the presence of small
prior austenite grains in the matrix which contains the ferritic phase (Fig. 13a). Since the ferritic
phase is too soft (the hardness value is about 375 Hv), the hardness value of this sample
decreases (about 570 Hv).
Page 29
28
Fig. 16. a) microhardness distribution versus scanning speed variations b) microhardness
distribution versus focal plane position variations.
Regarding the geometrical dimensions of the hardened zone, the hardness value, and free of
any defects, sample #S2 can be selected as the desired sample which has the highest hardness
value (approximately 650 Hv) among all samples (see Fig. 16). The depth and the width of the
hardened layer for this sample are 330 µm and 2020 µm, respectively.
4. Conclusion
In this research, the effect of Nd:YAG laser hardening process parameters (i.e., laser pulse
width, laser focal plane position, scanning speed, and laser frequency) was investigated on the
geometrical dimensions of the hardened zone (depth, width, and entry angle), microhardness
distribution, and microstructure of AISI 431 stainless steel. According to experimental work,
the following results can be concluded:
1) Increasing the laser frequency and the pulse width causes more heat input. Therefore, the
geometrical dimensions of the hardened zone rise. On the other hand, more heat input
causes to increase the prior austenite grain size which contains martensitic phase. So, the
hardness value of the laser treated region decreases by the formation of larger grains.
2) When the scanning speed increases, the heat input decreases. Hence, the geometrical
dimensions of the hardened zone decrease. The average hardness value increases by
Page 30
29
reducing the scanning speed due to increase of the martensitic phase and decrease of the
retained austenitic phase in the microstructure.
3) By increasing the focal plane position, the incident beam area increases and the beam
density decreases. So, decreasing the heat input causes to reduce the geometrical
dimensions of the hardened zone. Also, decreasing the heat input induced by increasing
the focal plane position causes the prior austenite grain size reduces. Therefore, increasing
the hardness value is occurred by increasing the focal plane position.
4) The martensitic phase, the delta ferritic phase, and a small amount of retained austenite
phase are observed in the hardened zone. Due to the rapid heating rate during the laser
process, the tempered martensitic phase of the base metal is transformed to the austenitic
phase, and due to the rapid cooling rate, martensitic transformation occurs according to
CCT diagram of 431 stainless steel.
5) The best laser hardening condition is at the laser frequency of 17Hz, the pulse width of
18ms, the scanning speed of 20 mm/min, and the focal plane position of 7.5 mm. In the
optimum condition, the micro hardness value is about 650 Hv (almost 80% more than the
base metal). The depth and the width of the hardened layer for the optimum sample are
330 µm and 2020 µm, respectively.
References
[1] R. Rowshan, Process control during laser transformation hardening, Ph.D. thesis, Miskolc, Hungary,
University of Miskolc, 2007.
[2] K. Sridhar, Lasers in surface engineering, surface engineering series, ASM International, Ohio,
1998.
[3] J, Ion, Laser processing of engineering materials: principles, procedure and industrial application,
Elsevier, 2005.
[4] C, Mark, Fundamentals of light sources and lasers, John Weily, New Jersey, 2004.
[5] J.C. Lippold., D.J. Kotecki, Welding metallurgy and weldability of stainless steels, John Wiley,
New Jersey, 2005.
Page 31
30
[6] J.R. Davis, ASM specialty handbook: stainless steels, ASM International, Ohio, 1994.
[7] B, Mahmoudi, M.J. Torkamany, A.S.R. Aghdam, Sabbaghzade J. Laser surface hardening of AISI
420 stainless steel treated by pulsed Nd: YAG laser, Mater. Des. 31 (2010) 2553-2560.
https://doi.org/10.1016/j.matdes.2009.11.034
[8] T. Hirogaki, H. Nakagawa, M. Hayamizu, Y. Kita, Y. Kakino, In-situ heat treatment system for die
steels using YAG laser with a machining center, Precis. Eng. 25 (2001) 212-217.
https://doi.org/10.1016/S0141-6359(01)00072-1
[9] J. Grum, R. Sturm, Laser surface melt-hardening of gray and nodular irons, Appl. Surf. 109 (1997)
128-132. https://doi.org/10.1016/S0169-4332(96)00648-4
[10] K.H. Lo, F.T. Cheng, H.C. Man, Laser transformation hardening of AISI 440C martensitic stainless
steel for higher cavitation erosion resistance, Surf. Coat. Technol. 173 (2003) 96-104.
https://doi.org/10.1016/S0257-8972(03)00347-5
[11] M.H. Ameri, F. Malek Ghaini, M.J. Torkamany, Investigation into the efficiency of a fiber laser in
surface hardening of ICD-5 tool steel, Opt. Laser. Technol. 107 (2018) 150-157.
https://doi.org/10.1016/j.optlastec.2018.05.030
[12] C. Soriano, J. Leunda, J. Lambarri, V.G. Navas, C. Sanz, Effect of laser surface hardening on the
microstructure, hardness and residual stresses of austempered ductile iron grades, Appl. Surf. Sci. 257
(2011) 7101-7106. https://doi.org/10.1016/j.apsusc.2011.03.059
[13] G. Tani, A. Fortunato, A. Ascari, G. Campana, Laser surface hardening of martensitic stainless
steel hollow parts, CIRP annals. 59 (2010) 207-210. https://doi.org/10.1016/j.cirp.2010.03.077
[14] P.D. Babu, G. Buvanashekaran, K.R. Balasubramanian, Experimental investigation of laser
transformation hardening of low alloy steel using response surface methodology, Int. J. Adv. Manuf.
Technol. 67 (2013) 1883-1897. DOI 10.1007/s00170-012-4616-z
[15] G.H. Zirehpour, R. Shoja Razavi, E. Moayerifar, Evaluating Wear Properties of AISI 420
Martensitic Stainless Steel after Laser Transformation Hardening, IJISSI. 9 (2012) 5-8.
[16] F. Cordovilla, Á. García-Beltrán, P. Sancho, J. Domínguez, L. Ruiz-de-Lara, J.L. Ocaña,
Numerical/experimental analysis of the laser surface hardening with overlapped tracks to design the
configuration of the process for Cr-Mo steels, Mater. Des. 102 (2016) 225-237.
https://doi.org/10.1016/j.matdes.2016.04.038
[17] G. Telasang, J.D. Majumdar, G. Padmanabham, I. Manna, Wear and corrosion behavior of laser
surface engineered AISI H13 hot working tool steel, Surf. Coat. Technol. 261 (2015) 69-78.
https://doi.org/10.1016/j.surfcoat.2014.11.058
[18] M. Moradi, M. KaramiMoghadam, High power diode laser surface hardening of AISI 4130;
statistical modelling and optimization, Opt. Laser. Technol. 111 (2019) 554–570.
https://doi.org/10.1016/j.optlastec.2018.10.043
[19] A. Khorram, A. Davoodi Jamaloei, A. Jafari, Surface transformation hardening of Ti-5Al-2.5Sn
alloy by pulsed Nd:YAG laser: an experimental study, Int. J. Adv. Manuf. Technol. 100 (2019) 3085-
3099. https://doi.org/10.1007/s00170-018-2900.
[20] P. Guiraldenq, H.D. Olivier, The genesis of the Schaeffler diagram in the history of stainless steel,
Metall. Res. Technol. 114 (2017) 613-622. https://doi.org/10.1051/metal/2017059.
[21] H. Mehrer, Diffusion in solid metals and alloys, Springer-verlag, London, 1990.
[22] N.B. Dahotre, Lasers in surface engineering, ASM International, Ohio, 1998.
Page 32
31
[23] S.R. Lakhkar, C.S. Yung, J.M.K. Matthew, Predictive modeling of multi-track laser hardening of
AISI 4140 steel, Mater. Sci. Eng. A. 480 (2008) 209-217. https://doi.org/10.1016/j.msea.2007.07.054
[24] D.L. Barlow, D.T. Madeleine, Effect of austenitizing heat treatment on the microstructure and
hardness of martensitic stainless steel AISI 420, JMEP. 21.7 (2012) 1327-1336.
https://doi.org/10.1007/s11665-011-0043-9
[25] C.G. De Andres, L.F. Alvarez, Optimization of the properties obtained by quenching in martensitic
stainless steels X30-40Cr13 and X40-60CrMoV14, J. Mater. Sci. 28 (1993) 1264-1268.
https://doi.org/10.1007/BF01191962
[26] Y.J. Park, P. Yong-Soo, The effects of heat-treatment parameters on corrosion resistance and phase
transformations of 14Cr–3Mo martensitic stainless steel, Mater. Sci. Eng. A. 449 (2007) 1131-1134.
https://doi.org/10.1016/j.msea.2006.03.134
[27] A. Roy, I. Manna, Laser surface engineering to improve wear resistance of austempered ductile
iron, Mater. Sci. Eng. A. 297 (2001) 85-93. https://doi.org/10.1016/S0921-5093(00)01253-3
[28] A. Roy, I. Manna, Mathematical modeling of localized melting around graphite nodules during
laser surface hardening of austempered ductile iron, Opt. Laser. Eng. 34 (2000) 369-383.
https://doi.org/10.1016/S0143-8166(00)00094-4
[29] T. Mioković, V. Schulze, O. Vöhringer, D. Löhe, Prediction of phase transformations during laser
surface hardening of AISI 4140 including the effects of inhomogeneous austenite formation, Mater. Sci.
Eng. A. 435 (2006) 547-555. https://doi.org/10.1016/j.msea.2006.07.037
Page 33
32
Tables:
Table 1. Chemical composition of AISI 431 stainless steel (Wt. %).
Fe S P Si Mn Cr Ni C Element
base 0.005 0.01 0.14 0.42 16.90 1.52 0.12 Weight
percent
Table 2. Experimental setting and the results of AISI 431 laser surface hardening.
Output Input variable
sample Prior
austenite
grain size
(µm)
Entry
angle
(°)
Width
(µm)
penetration
depth (µm)
Speed
(mm/min)
Focal
Plane
Position
(mm)
Average
power
(W)
Frequency
(Hz)
Pulse
width
(ms)
28 23 1400 216 30 6.5 130 14 17 F1
30 27 1600 265 30 6.5 145 16 17 F2
39 34 1850 300 30 6.5 160 18 17 F3
27 22 1300 190 30 6.5 120 14 16 P1
30 27 1620 270 30 6.5 140 14 18 P2
36 32 1750 280 30 6.5 150 14 20 P3
6 31 1500 270 30 4.5 120 14 16 FPP1
32 23 1350 195 25 6.5 120 14 16 FPP2
31 18 1225 190 25 7 120 14 16 FPP3
29 19 1130 185 25 7.5 120 14 16 FPP4
41 26 1550 235 20 6 120 14 16 FPP5
34 25 1500 230 20 6.5 120 14 16 FPP6
25 16 1050 160 40 6.5 120 14 16 S1
30 25 2020 330 20 7.5 160 17 18 S2
27 24 1970 320 25 7.5 160 17 18 S3
Page 34
33
Table 3. The relationship between the focal plane positions, the incident beam area, the
interaction time and the beam density.
Pulse
energy
(J)
Heat
input
(J/mm)
Interaction
time ×
beam
density
(J/mm2)
Beam
density
(W/mm2)
Interaction
time (S)
Incident
Beam
Area
(mm2)
Incident
Beam
Diameter
(mm)
Focal
Plane
Position
(mm)
Sample
9.28 260 124.48 23.40 5.32 5.55 2.66 6.5 F1
9.06 290 138.88 26.10 5.32 5.55 2.66 6.5 F2
8.88 320 153.24 28.80 5.32 5.55 2.66 6.5 F3
8.57 240 114.93 21.60 5.32 5.55 2.66 6.5 P1
10 280 134.093 25.20 5.32 5.55 2.66 6.5 P2
10.71 300 143.671 27.00 5.32 5.55 2.66 6.5 P3
8.57 240 122.29 24.45 5 4.90 2.5 4.5 FPP1
8.57 288 137.92 21.60 6.38 5.55 2.66 6.5 FPP2
8.57 288 126.51 18.17 6.96 6.60 2.9 7 FPP3
8.57 288 120.63 16.54 7.29 7.25 3.04 7.5 FPP4
8.57 360 175.03 22.26 7.86 5.38 2.62 6 FPP5
8.57 360 172.40 21.60 7.98 5.55 2.66 6.5 FPP6
8.57 180 86.20 21.60 3.99 5.55 2.66 6.5 S1
9.41 480 201.13 22.05 9.12 7.25 3.04 7.5 S2
9.41 384 160.91 22.05 7.29 7.25 3.04 7.5 S3
Table 4. Chemical composition (Wt. %) of different zones marked in Figs. 10c and 13c.
Region Item Fe Ni Cr Mn Suggested
phase
Base
metal
A 80.3 1.9 17.0 0.8 δ
B 82.2 2.4 14.8 0.6 M
Hardened
zone
C 79.8 2.0 17.5 0.8 δ
D 80.1 2.8 16.2 0.9 M
Page 35
34
Figure Captions:
Fig. 1. Scheme of laser surface hardening process with the hardened geometrical dimensions
and the hardness measuring paths.
Fig. 2. Cross section of some laser hardened samples in different input parameters.
Fig. 3. Influence of the laser frequency on the geometry of hardened zone.
Fig. 4. a) Influence of the laser pulse width on the geometry of hardened zone b) schematic
diagram of the laser pulse width.
Fig. 5. Influence of the scanning speed on the geometry of hardened zone; Series 1: Pulse
width= 16 ms, Frequency= 14 Hz, FPP= 6.5 mm, Series 2: Pulse width= 18 ms, Frequency=
17 Hz, FPP= 7.5 mm.
Fig. 6. Influence of the focal plane position on the geometry of hardened zone; Series 1: Pulse
width= 16 ms, Frequency= 14 Hz, scanning speed= 30 mm/min, Series 2: Pulse width= 16 ms,
Frequency= 14 Hz, scanning speed= 25 mm/min, Series 3: Pulse width= 16 ms, Frequency=
14 Hz, scanning speed= 20 mm/min.
Fig. 7. The position of stainless steel used in this study was marked with the red point in the
Schaeffler Delong diagram [20].
Fig. 8. Microstructure of AISI 431 stainless steel a) OM and SEM images of cross section b)
OM image of surface.
Fig. 9. a) XRD patterns for the base metal b) the peak position of ferritic phase and Fe-Cr-Ni
solid solution phase.
Fig. 10. Microstructure of different zones of a typical hardened sample a) Optical micrograph,
b) SEM image of hardened zone c) SEM image of heat affected zone d) SEM image of base
metal.
Fig. 11. Hardened surface of samples.
Page 36
35
Fig. 12. a) XRD pattern for the hardened zone b) The peak position of ferritic phase, Fe-Cr-Ni
solid solution phase, and austenitic phase.
Fig. 13. SEM and OM Images a) Cross section of sample #FPP1, b) Surface of sample #FPP1,
c) Cross section of sample #FPP4, d) Surface of sample #FPP4.
Fig. 14. a) Effect of indenter on the ferritic phase and the martensitic phase in the hardened
zone b) Micro hardness distribution along the depth direction of hardened zone.
Fig. 15. a) Micro hardness distribution versus pulse width variations b) Micro hardness
distribution versus laser frequency variations.
Fig. 16. a) microhardness distribution versus scanning speed variations b) microhardness
distribution versus focal plane position variations.