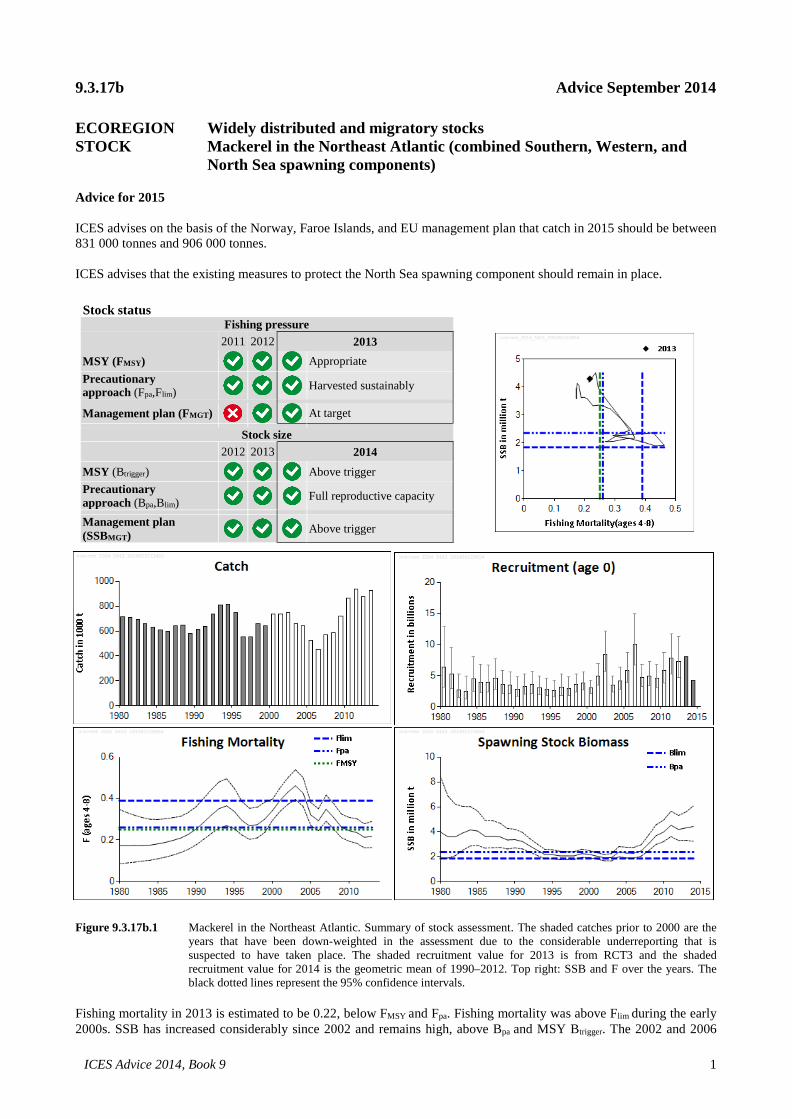
9.3.17b Advice September 2014 ECOREGION Widely distributed and migratory stocks STOCK Mackerel in the Northeast Atlantic (combined Southern, Western, and North Sea spawning components) Advice for 2015 ICES advises on the basis of the Norway, Faroe Islands, and EU management plan that catch in 2015 should be between 831 000 tonnes and 906 000 tonnes. ICES advises that the existing measures to protect the North Sea spawning component should remain in place. Stock status Fishing pressure 2011 2012 2013 MSY (FMSY) Appropriate Precautionary approach (Fpa,Flim) Harvested sustainably Management plan (FMGT) At target Stock size 2012 2013 2014 MSY (Btrigger) Above trigger Precautionary approach (Bpa,Blim) Full reproductive capacity Management plan (SSBMGT) Above trigger Figure 9.3.17b.1 Mackerel in the Northeast Atlantic. Summary of stock assessment. The shaded catches prior to 2000 are the years that have been down-weighted in the assessment due to the considerable underreporting that is suspected to have taken place. The shaded recruitment value for 2013 is from RCT3 and the shaded recruitment value for 2014 is the geometric mean of 1990–2012. Top right: SSB and F over the years. The black dotted lines represent the 95% confidence intervals. Fishing mortality in 2013 is estimated to be 0.22, below FMSY and Fpa. Fishing mortality was above Flim during the early 2000s. SSB has increased considerably since 2002 and remains high, above Bpa and MSY Btrigger. The 2002 and 2006 ICES Advice 2014, Book 9 1
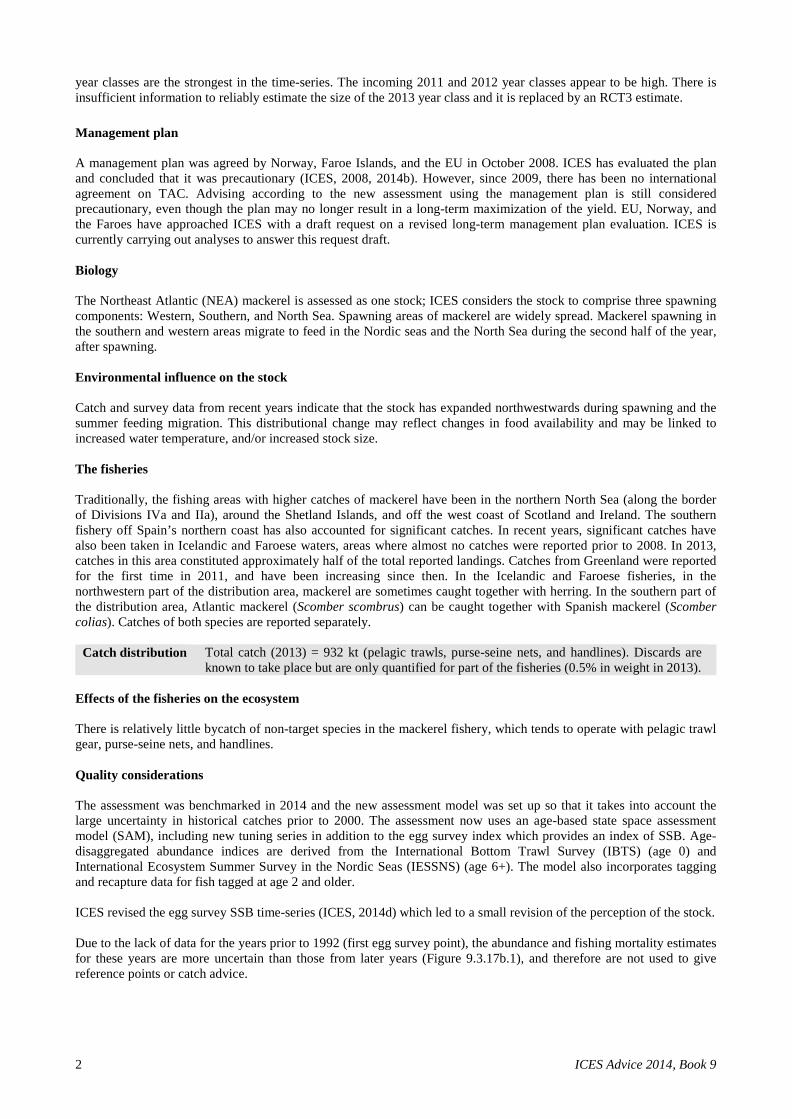
Transcript
9.3.17b Advice September 2014 ECOREGION Widely distributed and migratory stocks STOCK Mackerel in the Northeast Atlantic (combined Southern, Western, and
North Sea spawning components) Advice for 2015 ICES advises on the basis of the Norway, Faroe Islands, and EU management plan that catch in 2015 should be between 831 000 tonnes and 906 000 tonnes. ICES advises that the existing measures to protect the North Sea spawning component should remain in place.
MSY (Btrigger) Above trigger Precautionary approach (Bpa,Blim) Full reproductive capacity
Management plan (SSBMGT) Above trigger
Figure 9.3.17b.1 Mackerel in the Northeast Atlantic. Summary of stock assessment. The shaded catches prior to 2000 are the years that have been down-weighted in the assessment due to the considerable underreporting that is suspected to have taken place. The shaded recruitment value for 2013 is from RCT3 and the shaded recruitment value for 2014 is the geometric mean of 1990–2012. Top right: SSB and F over the years. The black dotted lines represent the 95% confidence intervals.
Fishing mortality in 2013 is estimated to be 0.22, below FMSY and Fpa. Fishing mortality was above Flim during the early 2000s. SSB has increased considerably since 2002 and remains high, above Bpa and MSY Btrigger. The 2002 and 2006
ICES Advice 2014, Book 9 1
year classes are the strongest in the time-series. The incoming 2011 and 2012 year classes appear to be high. There is insufficient information to reliably estimate the size of the 2013 year class and it is replaced by an RCT3 estimate. Management plan A management plan was agreed by Norway, Faroe Islands, and the EU in October 2008. ICES has evaluated the plan and concluded that it was precautionary (ICES, 2008, 2014b). However, since 2009, there has been no international agreement on TAC. Advising according to the new assessment using the management plan is still considered precautionary, even though the plan may no longer result in a long-term maximization of the yield. EU, Norway, and the Faroes have approached ICES with a draft request on a revised long-term management plan evaluation. ICES is currently carrying out analyses to answer this request draft. Biology The Northeast Atlantic (NEA) mackerel is assessed as one stock; ICES considers the stock to comprise three spawning components: Western, Southern, and North Sea. Spawning areas of mackerel are widely spread. Mackerel spawning in the southern and western areas migrate to feed in the Nordic seas and the North Sea during the second half of the year, after spawning. Environmental influence on the stock Catch and survey data from recent years indicate that the stock has expanded northwestwards during spawning and the summer feeding migration. This distributional change may reflect changes in food availability and may be linked to increased water temperature, and/or increased stock size. The fisheries Traditionally, the fishing areas with higher catches of mackerel have been in the northern North Sea (along the border of Divisions IVa and IIa), around the Shetland Islands, and off the west coast of Scotland and Ireland. The southern fishery off Spain’s northern coast has also accounted for significant catches. In recent years, significant catches have also been taken in Icelandic and Faroese waters, areas where almost no catches were reported prior to 2008. In 2013, catches in this area constituted approximately half of the total reported landings. Catches from Greenland were reported for the first time in 2011, and have been increasing since then. In the Icelandic and Faroese fisheries, in the northwestern part of the distribution area, mackerel are sometimes caught together with herring. In the southern part of the distribution area, Atlantic mackerel (Scomber scombrus) can be caught together with Spanish mackerel (Scomber colias). Catches of both species are reported separately.
Catch distribution Total catch (2013) = 932 kt (pelagic trawls, purse-seine nets, and handlines). Discards are known to take place but are only quantified for part of the fisheries (0.5% in weight in 2013).
Effects of the fisheries on the ecosystem There is relatively little bycatch of non-target species in the mackerel fishery, which tends to operate with pelagic trawl gear, purse-seine nets, and handlines. Quality considerations The assessment was benchmarked in 2014 and the new assessment model was set up so that it takes into account the large uncertainty in historical catches prior to 2000. The assessment now uses an age-based state space assessment model (SAM), including new tuning series in addition to the egg survey index which provides an index of SSB. Age-disaggregated abundance indices are derived from the International Bottom Trawl Survey (IBTS) (age 0) and International Ecosystem Summer Survey in the Nordic Seas (IESSNS) (age 6+). The model also incorporates tagging and recapture data for fish tagged at age 2 and older. ICES revised the egg survey SSB time-series (ICES, 2014d) which led to a small revision of the perception of the stock. Due to the lack of data for the years prior to 1992 (first egg survey point), the abundance and fishing mortality estimates for these years are more uncertain than those from later years (Figure 9.3.17b.1), and therefore are not used to give reference points or catch advice.
2 ICES Advice 2014, Book 9
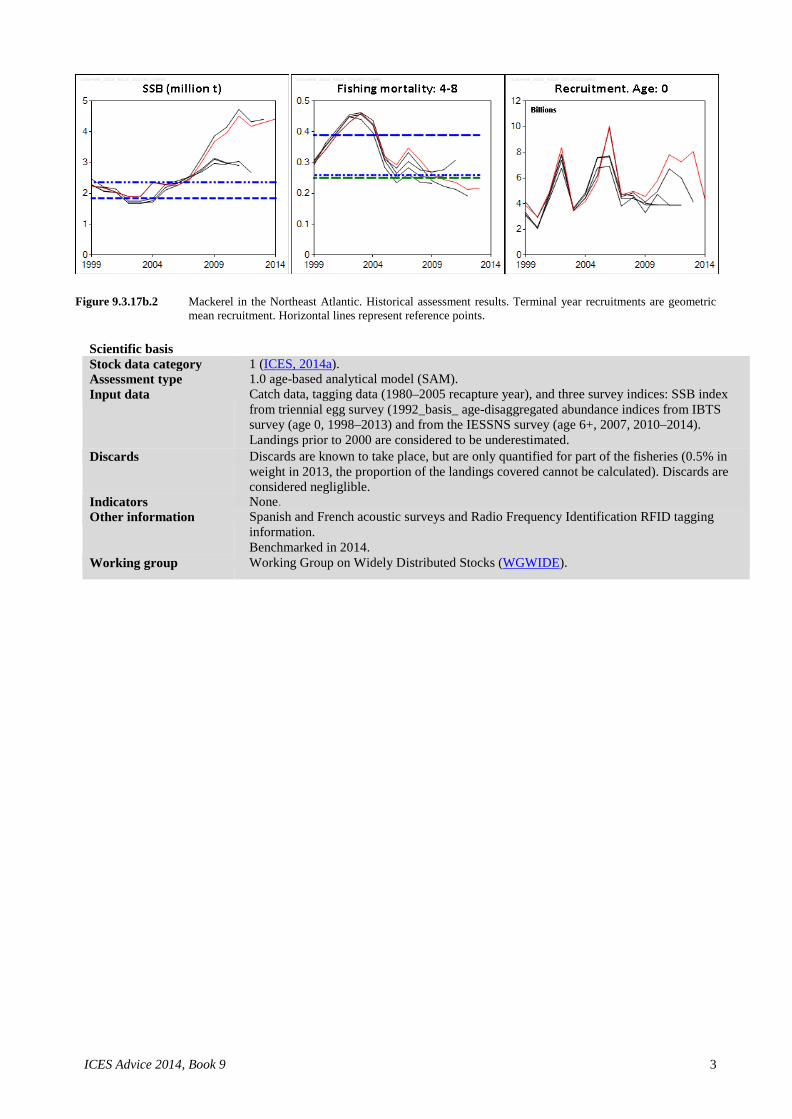
Figure 9.3.17b.2 Mackerel in the Northeast Atlantic. Historical assessment results. Terminal year recruitments are geometric
mean recruitment. Horizontal lines represent reference points.
Scientific basis Stock data category 1 (ICES, 2014a). Assessment type 1.0 age-based analytical model (SAM). Input data Catch data, tagging data (1980–2005 recapture year), and three survey indices: SSB index
from triennial egg survey (1992_basis_ age-disaggregated abundance indices from IBTS survey (age 0, 1998–2013) and from the IESSNS survey (age 6+, 2007, 2010–2014). Landings prior to 2000 are considered to be underestimated.
Discards Discards are known to take place, but are only quantified for part of the fisheries (0.5% in weight in 2013, the proportion of the landings covered cannot be calculated). Discards are considered negliglible.
Indicators None. Other information Spanish and French acoustic surveys and Radio Frequency Identification RFID tagging
information. Benchmarked in 2014.
Working group Working Group on Widely Distributed Stocks (WGWIDE).
9.3.17b Supporting information September 2014 ECOREGION Widely distributed and migratory stocks STOCK Mackerel in the Northeast Atlantic (combined Southern, Western, and
North Sea spawning components) Reference points Type Value Technical basis Management plan
SSBtrigger 2.20 million t Medium-term simulations conducted in 2008*.
Ftarget 0.20–0.22 Medium-term simulations conducted in 2008*.
MSY approach
MSY Btrigger 2.36 million t Proxy based on Bpa*.
FMSY 0.25 Stochastic simulation conducted at benchmark assessment in 2014. Precautionary approach
Blim 1.84 million t Bloss in 2002 from 2014 benchmark assessment. Bpa 2.36 million t exp(1.654 × 𝜎𝜎) × Blim, 𝜎𝜎 = 0.15. Flim 0.39 Floss, the F that on average leads to Blim. Fpa 0.26 F that on average leads to Bpa.
(Last changed in: 2014) * Evaluation ongoing following the draft request submitted for evaluation by ICES. Outlook for 2015 Basis: F (2014) = 0.32 (catch constraint); SSB (2014)1 = 4 605 kt ; R (2013) = RCT3 = 8 064 141 thousands; Catch (2014) = 1 396 kt (See Additional considerations). R (2014–2016) = GM (1990–2012) = 4 272 254 thousands.
Weights in thousand tonnes. 1) SSB at spawning time (early April). 2) SSB 2016 relative to SSB 2015. 3) TAC in 2015 relative to estimated catches in 2014. 4) There is no internationally agreed TAC for 2014. Management plan A management plan was agreed by Norway, Faroe Islands, and the EU in October 2008. ICES has evaluated the plan and concluded that it was precautionary (ICES, 2008, 2014d). The plan is currently not being implemented and the quotas being set do not correspond to the advised TAC. Advising according to the new assessment using the management plan is still considered precautionary, provided the year-on-year TAC constraint is not implemented in the first year of the readoption of the plan. Therefore, ICES has not included the percentage constraints stated in clause 4 of the management plan in calculating the TAC for 2015. The plan implies a catch between 831 000 and 906 000 tonnes in 2015. This corresponds to a catch decrease between 35% and 40% compared to the estimated catch in 2014.
4 ICES Advice 2014, Book 9
Such a TAC would lead to an estimated SSB in 2016 between 4.3 and 4.4 million tonnes. EU, Norway, and the Faroes have approached ICES with a draft request on a revised long-term management plan evaluation. ICES is currently carrying out analyses to answer this request draft. MSY approach Following the ICES MSY framework implies that fishing mortality can be increased to 0.25 (FMSY), resulting in a total catch of 1 017 000 tonnes in 2015. This would lead to an estimated SSB in 2016 of 4.2 million tonnes. Precautionary approach Following the precautionary approach (PA) implies that fishing mortality in 2015 should be no higher than Fpa (F = 0.26), corresponding to a total catch of 1 054 000 tonnes in 2015. SSB in 2015 would remain above Bpa. Additional considerations Ecosystem considerations The changes in mackerel distribution and migration have been investigated in an Ad hoc Group on the Distribution and Migration of Northeast Atlantic Mackerel (AGDMM – ICES, 2013b). There has been a substantial geographical expansion of the spawning distribution to the north and the northwest for the western component since 2007. However, spawning intensity in these new areas is quite low and the bulk of the egg production still occurs on the historical core spawning areas. There has also been an extension of the spawning season for the western and southern components, with an earlier start of the spawning activity and with maximum spawning intensity occurring one month earlier than in earlier years (April instead of May). A north- and westwards geographical expansion of the summer feeding distribution has also been reported by the summer surveys in the Nordic Seas (IESSNS). The distribution of juvenile mackerel was found to be very patchy, and the abundance to be highly variable between years. Expansion of nursery areas into northern coastal waters has been observed since the mid-2000s. Along with these distribution changes, physical changes in the environment have also been recorded, with record high summer sea surface temperatures in recent years in the Nordic seas facilitating a larger potential feeding habitat for mackerel. The question remains as to whether or not these distribution changes are permanent or temporary. In the last two years, mackerel have been caught in small numbers in summer as far north as Svalbard, and as far west as the southwest Greenlandic waters. Management considerations The stock assessment for Northeast Atlantic mackerel was benchmarked in 2014 (ICES, 2014b). This led to a revised perception of the stock compared to the last assessment of the stock in 2012. Despite the changes in the stock assessment, the current Management Plan fishing mortality target range is still considered to be precautionary, and ICES can continue to provide advice under this plan. However, it may no longer result in a long-term maximization of the yield. The Management Plan is being re-evaluated and should provide the appropriate combination of Btrigger and fishing mortality range consistent with the precautionary approach and MSY objectives.
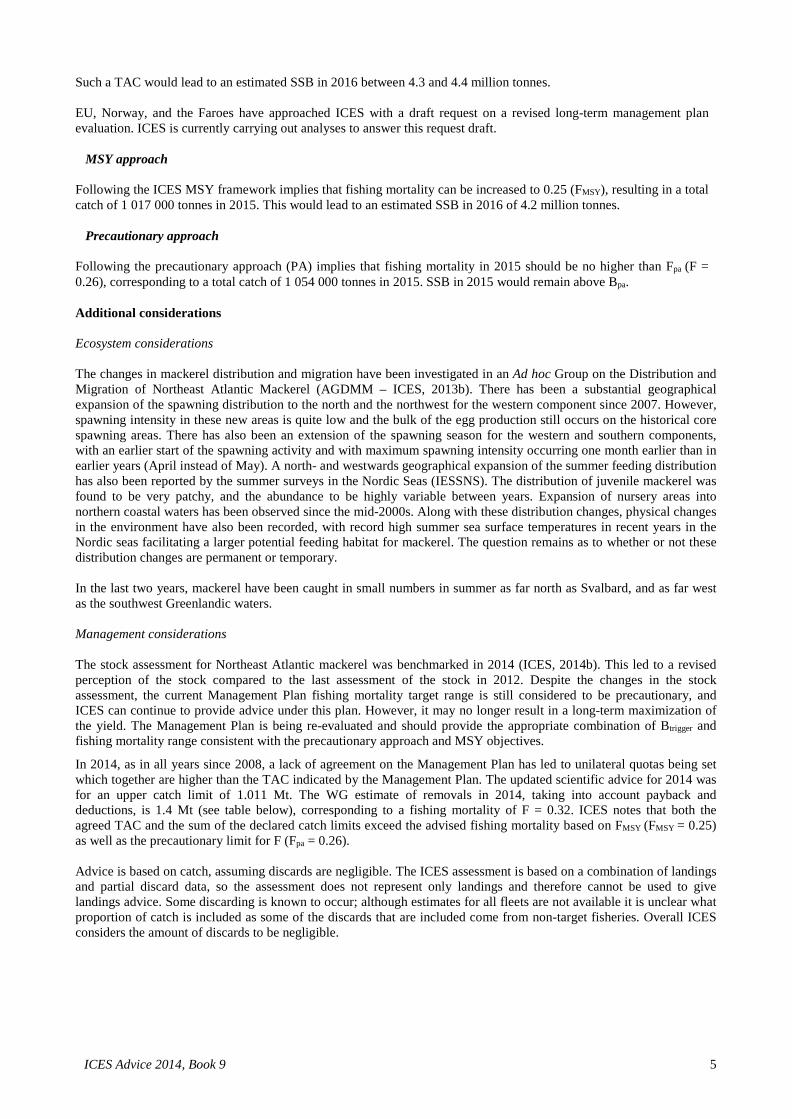
In 2014, as in all years since 2008, a lack of agreement on the Management Plan has led to unilateral quotas being set which together are higher than the TAC indicated by the Management Plan. The updated scientific advice for 2014 was for an upper catch limit of 1.011 Mt. The WG estimate of removals in 2014, taking into account payback and deductions, is 1.4 Mt (see table below), corresponding to a fishing mortality of F = 0.32. ICES notes that both the agreed TAC and the sum of the declared catch limits exceed the advised fishing mortality based on FMSY (FMSY = 0.25) as well as the precautionary limit for F (Fpa = 0.26). Advice is based on catch, assuming discards are negligible. The ICES assessment is based on a combination of landings and partial discard data, so the assessment does not represent only landings and therefore cannot be used to give landings advice. Some discarding is known to occur; although estimates for all fleets are not available it is unclear what proportion of catch is included as some of the discards that are included come from non-target fisheries. Overall ICES considers the amount of discards to be negligible.
ICES Advice 2014, Book 9 5
Estimation of 2014 catch Tonnes Reference EU quota 611 205 Coastal state agreement, 12 March 2014 Spanish payback −9 747 European Council Regulation 2011/165 EU quota deductions −6 568 EC press release, 11 August 2014 Norwegian quota 279 115 Coastal state agreement, 12 March 2014 Russian quota 116 700 Estimate from Russian WGWIDE members Discards 4 664 Previous years’ estimate Icelandic quota 147 721 Ministry of Industries and Innovation: Press release,
16 April 2014. No. 376/2014 Interannual quota transfer 2013 2014 (IS) 6 908 Fisheries Directory webpage Faroese quota 156 240 Coastal state agreement, 12 March 2014 Greenland quota
90 000 Estimate from Greenland Institute of Natural Resources
Total expected catch (incl. discards) 1 396 238
Uncertainties in the assessment and forecast Total removals are expected to be underestimated because of incomplete discards data and unquantified slippage. The period of very uncertain catches due to massive underreporting prior to 2000 is now accounted for in the new assessment, which results in a very high uncertainty on the stock size and fishing mortality estimates until the early 1990s. The new assessment model is considered to provide reliable information on the state of the stock after 1992 and provides estimates of uncertainty for all stock parameters (see Figure 9.3.17b.1). The precision on F, SSB, and R in the most recent year (2013) is 25%, 33%, and 63%, respectively. Although uncertainty in the final-year estimates of population numbers is available, the short-term forecast is deterministic, and therefore the assessment uncertainty is not accounted for in the projected values. Further sources of uncertainty in the forecast stem from the estimates of the 2014 catch, the fish weights-at-age, the proportion of mature individuals, and fishery selection-at-age for the years from 2014 to 2016 (considered average of the last three years), the numbers of 0-year-old fish in the years 2014 to 2016 (based on the geometric mean over the years 1990 to 2012), and the 1-year-old fish in 2014 (calculation based on the RCT3 estimate of the 2013 recruitment and the SAM estimate of the corresponding fishing mortality). The fishery Mackerel is mainly exploited in a directed fishery for human consumption. This fishery tends to target bigger fish and there is evidence of discarding of smaller, less marketable fish. Regulations and their effects Prior to the late 1960s, spawning biomass of North Sea mackerel was estimated to be above 3 million tonnes. Subsequently, overexploitation occurred and recruitment has failed since 1969, leading to a marked decline in the size of the North Sea component. The measures advised by ICES have been aimed at protecting the North Sea spawning component and promoting stock recovery. There was a small increase in the North Sea spawning in 2002; the SSB has remained low (the latest North Sea egg survey data available are from 2011). Existing measures to protect the North Sea spawning component are:
• There should be no fishing for mackerel in Divisions IIIa and IVb,c at any time of the year; • There should be no fishing for mackerel in Division IVa during the period 15 February–31 July; • The 30 cm minimum landing size at present in force in Subarea IV should be maintained.
In the southern area a new Spanish national regulation affecting mackerel catches of Spanish fisheries has been implemented in 2010, distributing the Spanish catch quota by gear, half-year, and area. Additionally, a stricter control on mackerel landings was enforced by the Spanish fishery administration. In 2011 the EU introduced a new regulation scheduling payback until 2015 due to overfishing of the mackerel quota allocated to Spain in 2010 (Commission Regulation (EU) No. 165/2011). A similar regulation applied to Scottish and Irish vessels expired in 2012.
6 ICES Advice 2014, Book 9
A landing obligation is due to come into force in 2015 for all EU vessels. The details of this regulation remain to be finalized at the time of writing. Other factors Stock components: ICES currently uses the term “Mackerel in the Northeast Atlantic” to define the mackerel in the area extending from ICES Division IXa in the south to Division IIa in the north and Division XIV in the west, including mackerel in the North Sea and Division IIIa. Catches cannot be allocated specifically to spawning area components on biological grounds, but by convention, catches from the Southern and Western components are separated according to the areas in which these are taken. To keep track of the development of spawning biomass in the different spawning areas, mackerel in the Northeast Atlantic stock are divided into three area components: the Western, the North Sea, and the Southern components.
Mackerel in the Northeast Atlantic Mainly distributed and fished in ICES Subareas and Divisions IIa, IIIa, IV, V, VI, VII, VIII, IXa, and XIV Component Western Southern North Sea Main spawning areas VI, VII, VIIIa,b,d,e, VIIIc, IXa IV, IIIa
The Western component is defined as mackerel spawning in the western area (ICES Divisions and Subareas VI, VII, and VIII a,b,d,e). This component currently accounts for ~75% of the entire Northeast Atlantic stock. Similarly, the Southern component (~22%) is defined as mackerel spawning in the southern area (ICES Divisions VIIIc and IXa). Although the North Sea component has been at an extremely low level since the early 1970s, ICES considers that the North Sea component still exists as a discrete unit (~3%). This component spawns in the North Sea and Skagerrak (ICES Subarea IV and Division IIIaN). Data and methods This assessment includes catch numbers-at-age for the period 1980–2013, triennial mackerel egg survey estimates of SSB from 1992 to 2013, age-disaggregated area-standardized abundance indices from the International Ecosystem Summer Survey in the Nordic Seas (IESSNS) (2007, 2010–2014), tagging–recapture time-series (recapture years 1980–2005), and a recruitment index (age 0) with time-series between 1998 and 2013. The latter is also used by RCT3 to estimate age 0 in the final year of the assessment for the short-term forecast. Information from the fishing industry Over the last six years the pelagic industry has encountered large shoals of mackerel over the entire distribution area which has expanded both south and north. Based upon this observation the industry believes the stock size has greatly increased. This increase in the stock is not confined to one area or one fleet. The industry also sees signs of good recruitment (above average) over the last number of years, particularly in 2009, 2010, 2011, and 2012. The widespread distribution of the stock over the entire area sometimes creates problems with unwanted bycatches of mackerel for fleets targeting demersal species. Stakeholders are actively seeking mechanisms that would improve data input into the survey indices and are involved in a number of pilot projects in this regard. Industry has scaled up its participation in the mackerel RFID tagging project: processing plants in Denmark, Iceland, Ireland, Faroe Islands, and Scotland are now equipped to read mackerel tags, in addition to the existing tag-reading facilities in Norway. Comparison of the basis of previous assessment and advice The basis for the assessment has not changed from the advice on Northeast Atlantic mackerel released in May (ICES, 2014d). A revision of the egg survey SSB time-series during the 2014 WGWIDE assessment led to a small revision of the perception of the stock. The basis for the advice this year is the same as for the last released advice: the Norway, Faroe Islands, and EU long-term management plan from 2008.
ICES Advice 2014, Book 9 7
Sources ICES. 2008. European Commission (EC) request on evaluation of management plan for NEA mackerel. In Report of the
ICES Advisory Committee, 2008. ICES Advice 2008, Book 9, Section 9.3.2.1. ICES. 2012. Report of the Working Group on Widely Distributed Stocks (WGWIDE). ICES CM 2012/ACOM:16. ICES. 2013a. Mackerel in the Northeast Atlantic (combined Southern, Western, and North Sea spawning components).
In Report of the ICES Advisory Committee, 2013. ICES Advice 2013, Book 9, Section 9.4.17. ICES. 2013b. Report of the Ad hoc Group on the Distribution and Migration of Northeast Atlantic Mackerel
(AGDMM), 30–31 August 2011 and 29–31 May 2012, ICES Headquarters, Copenhagen. ICES CM 2013/ACOM:58. 211 pp.
ICES. 2014a. Advice basis. In Report of the ICES Advisory Committee, 2014. ICES Advice 2014, Book 1. ICES. 2014b. Report of the Benchmark Workshop on Pelagic Stocks (WKPELA). ICES CM 2014/ACOM: 43. ICES. 2014c. Report of the WGWIDE Subgroup for Updated Mackerel Advice for 2014, April 2014, by
correspondence. ICES CM 2014/ACOM:48. 40 pp. ICES. 2014d. Mackerel in the Northeast Atlantic (combined Southern, Western, and North Sea spawning components).
In Report of the ICES Advisory Committee, 2014. ICES Advice 2014, Book 9, Section 9.3.17a. ICES. 2014e. Report of the Working Group on Widely Distributed Stocks (WGWIDE), 28 August–01 September 2014,
ICES Headquarters, Copenhagen. ICES CM 2014/ACOM:15.
Figure 9.3.17b.3 Mackerel in the Northeast Atlantic (combined Southern, Western, and North Sea spawning components). Stock–recruitment plot.
8 ICES Advice 2014, Book 9
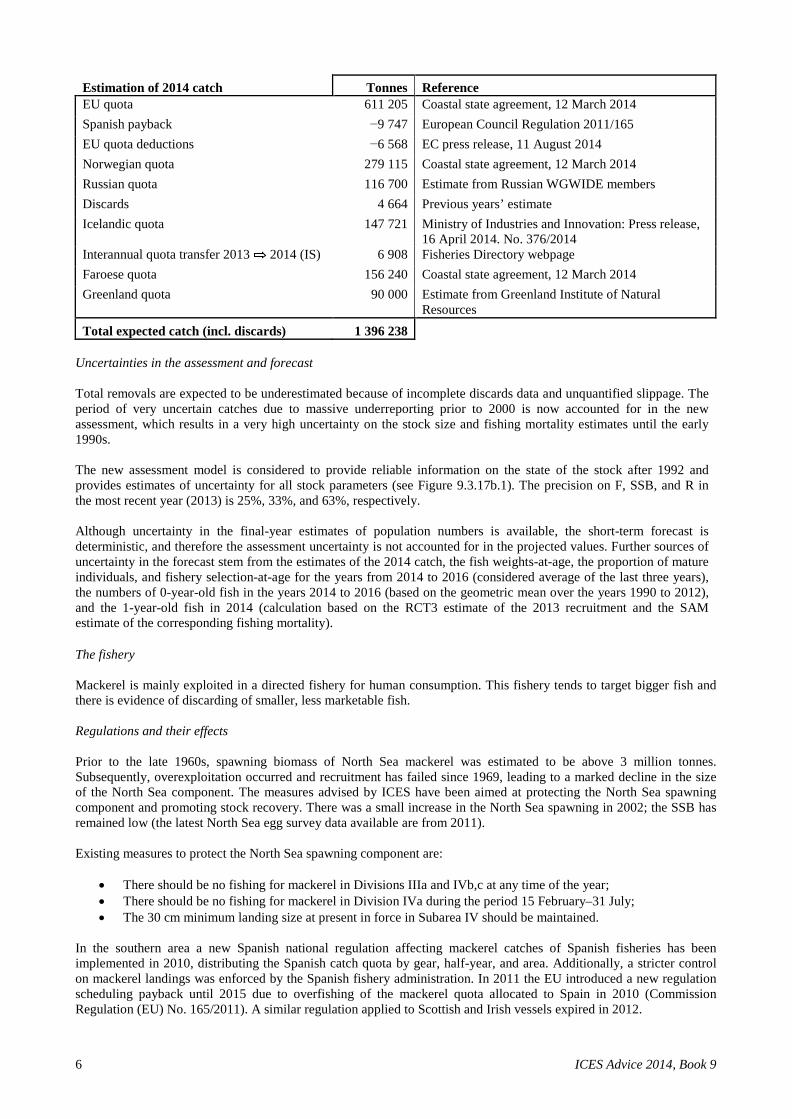
Table 9.3.17b.1 Mackerel in the Northeast Atlantic. Advice, management, and catch data for the combined area. Year ICES
advice Predicted catch corresp. to advice
Total agreed TAC3
Official
landings5 Disc.1
slip ICES catch2,4
1987 Given by stock component 442 616 11 655 1988 Given by stock component 610 622 36 680 1989 Given by stock component 532 576 7 590 1990 Given by stock component 562 580 16 628 1991 Given by stock component 612 609 31 668 1992 Given by stock component 707 729 25 760 1993 Given by stock component 767 784 18 825 1994 Given by stock component 837 794 5 821 1995 Given by stock component 645 729 8 756 1996 Significant reduction in F - 452 509 11 564 1997 Significant reduction in F - 470 517 19 570 1998 F between 0.15 and 0.2 498 549 627 8 667 1999 F of 0.15 consistent with PA 437 562 585 n/a 640 2000 F = 0.17: Fpa 642 612 655 2 738 2001 F = 0.17: Fpa 665 670 660 1 737 2002 F = 0.17: Fpa 694 683 685 24 773 2003 F = 0.17: Fpa 542 583 600 9 670 2004 F = 0.17: Fpa 545 532 587 11 650 2005 F = 0.15 to 0.20 [320–420] 422 447 20 543 2006 F = 0.15 to 0.20 [373–487] 444 318a 18 473 2007 F = 0.15 to 0.20 [390–509] 502 558 8 579 2008 F = 0.15 to 0.20 [349–456] 458 420 27 611 2009 F = 0.15 to 0.20 [443–578] 605b 442 13 735 2010 harvest control rule [527–572] 885c 862 7 869 2011 See scenarios [529–672] 959c 930 9 939
2012 Follow the management plan [586–639] 927c 877 15 893
2013 Follow the management plan [497–542] 906c 927 5 932
2014 Follow the management plan [927–1011] 1 396c
2015 Follow the management plan [831–906]
Weights in thousand tonnes. 1Data on discards and slipping from only two fleets. 2Landings and discards from Divisions and Subareas IIa, IIIa, IV, V, VI, VII, VIII, and IXa. 3For all areas, except some catches in international waters in Subarea II. 4Catches updated in 2003 with revisions from SGDRAMA in 2002. 5 Updated with ICES FishStats data. a Incomplete. b Does not include the unilateral Norway/Faroe Islands TAC first declared in 2009, nor the Icelandic quota. c No internationally agreed quotas. Values presented are the sum of unilateral quotas.
ICES Advice 2014, Book 9 9
Table 9.3.17b.2 Mackerel in the Northeast Atlantic. Advice, management, and catch data for the Western component. Year ICES
advice Predicted catch corresp. to advice
Agreed TAC1
Disc. slip
ICES catch2,3
1987 SSB = 1.5 mill. t; TAC 380 405 11 633 1988 F = F0.1; TAC; closed area; landing size 430 573 36 656 1989 Halt SSB decline; TAC 355 495 7 571 1990 TAC; F = F0.1 480 525 16 606 1991 TAC; F = F0.1 500 575 31 647 1992 TAC for both 1992 and 1993 670 670 25 742 1993 TAC for both 1992 and 1993 670 730 18 805 1994 No long-term gains in increased F 831a 800 5 796 1995 20% reduction in F 530 608 8 728 1996 No separate advice - 422 11 529 1997 No separate advice - 416 19 529 1998 No separate advice - 514 8 623 1999 No separate advice - 520 0 597 2000 No separate advice - 573 2 703 2001 No separate advice - 630 1 694 2002 No separate advice - 642 24 723 2003 No separate advice - 548 9 644 2004 No separate advice - 500 11 615 2005 No separate advice - 397 20 494 2006 No separate advice - 418b 17 420 2007 No separate advice - 472 8 519 2008 No separate advice - 431 27 552 2009 No separate advice - 569 13 627 2010 No separate advice - ---c 4 817 2011 No separate advice - ---c 8 920 2012 No separate advice - ---c 11 864 2013 No separate advice - ---c 2 910 2014 No separate advice - ---c 2015 No separate advice -
Weights in thousand tonnes. 1 TAC for mackerel taken in all Divisions and Subareas VI, VII, VIIIa,b,d, Vb, IIa, IIIa, and IVa. 2 Landings and discards of the Western component; includes some catches from the North Sea component. 3 Catches updated in 2003 with revisions from SGDRAMA in 2002. a Catch at status quo F. b Revised from previous year (was 392). c No internationally agreed TAC.
10 ICES Advice 2014, Book 9
Table 9.3.17b.3 Mackerel in the Northeast Atlantic. Advice, management, and catch data for the North Sea component.
Year ICES
advice Predicted catch corresp. to advice1
Agreed TAC2
ICES catch3
1987 Lowest practical level LPL 55 3 1988 Closed areas and seasons; min. landing size; bycatch regulations LPL 55 6 1989 Closed areas and seasons; min. landing size; bycatch regulations LPL 49.2 7 1990 Closed areas and seasons; min. landing size; bycatch regulations LPL 45.2 10 1991 Closed areas and seasons; min. landing size; bycatch regulations LPL 65.5 -* 1992 Closed areas and seasons; min. landing size; bycatch regulations LPL 76.3 -* 1993 Maximum protection; closed areas and seasons; min landing size LPL 83.1 -* 1994 Maximum protection; closed areas and seasons; min landing size LPL 95.7 -* 1995 Maximum protection; closed areas and seasons; min landing size LPL 76.3 -* 1996 Maximum protection; closed areas and seasons; min landing size LPL 52.8 -* 1997 Maximum protection; closed areas and seasons; min landing size LPL 52.8 -* 1998 Maximum protection; closed areas and seasons; min landing size LPL 62.5 -* 1999 Maximum protection; closed areas and seasons; min landing size LPL 62.5 -* 2000 Maximum protection; closed areas and seasons; min landing size LPL 69.7 -* 2001 Maximum protection; closed areas and seasons; min landing size LPL 71.4 -* 2002 Maximum protection; closed areas and seasons; min landing size LPL 72.9 -* 2003 Maximum protection; closed areas and seasons; min landing size LPL 62.5 -* 2004 Maximum protection; closed areas and seasons; min landing size LPL 57.7 -* 2005 Maximum protection; closed areas and seasons; min landing size LPL 44.9 -* 2006 Maximum protection; closed areas and seasons; min landing size LPL 47.1 -* 2007 Maximum protection; closed areas and seasons; min landing size LPL 53.1 -* 2008 Maximum protection; closed areas and seasons; min landing size LPL 48.6 -* 2009 Maximum protection; closed areas and seasons; min landing size LPL 63.8 -* 2010 Maximum protection; closed areas and seasons; min landing size LPL - -* 2011 Maximum protection; closed areas and seasons; min landing size LPL - -* 2012 Maximum protection; closed areas and seasons; min landing size LPL - -* 2013 Maximum protection; closed areas and seasons; min landing size LPL - -* 2014 Maximum protection; closed areas and seasons; min landing size LPL - 2015 Maximum protection; closed areas and seasons; min landing size LPL
Weights in thousand tonnes. 1 Subarea IV and Division IIIa. 2 TAC for Subarea IV, Divisions IIIa, IIIb,c,d (EU zone), and Division IIa (EU zone). 3 Estimated landings of the North Sea component. * No information. LPL = Lowest Practical Level.
ICES Advice 2014, Book 9 11
Table 9.3.17b.4 Mackerel in the Northeast Atlantic. Advice, management, and catch data for the Southern component.
Year ICES advice
Predicted catch corresp. to advice
Agreed TAC1
ICES catch2
1987 Reduce juvenile exploitation - 36.57 22 1988 Reduce juvenile exploitation - 36.57 25 1989 No advice - 36.57 18 1990 Reduce juvenile exploitation - 36.57 21 1991 Reduce juvenile exploitation - 36.57 21 1992 No advice - 36.57 18 1993 No advice - 36.57 20 1994 No advice - 36.57 25 1995 No advice - 36.57 28 1996 No separate advice - 30.00 34 1997 No separate advice - 30.00 41 1998 No separate advice - 35.00 44 1999 No separate advice - 35.00 44 2000 No separate advice - 39.20 36 2001 No separate advice - 40.18 43 2002 No separate advice - 41.10 50 2003 No separate advice - 35.00 26 2004 No separate advice - 32.31 35 2005 No separate advice - 24.87 50 2006 No separate advice - 26.18 53 2007 No separate advice - 29.61 63 2008 No separate advice - 27.01 60 2009 No separate advice - 35.83 108 2010 No separate advice - 33.88 52 2011 No separate advice - 37.14 19 2012 No separate advice - 36.74 29 2013 No separate advice - 31.16 22 2014 No separate advice - 56.64 2015 No separate advice -
Weights in thousand tonnes. 1Division VIIIc, Subareas IX and X, and CECAF Division 34.1.1 (EU waters only). 2Catches updated in 2003 with revisions from SGDRAMA in 2002.
12 ICES Advice 2014, Book 9
ICES Advice 2011, Book 9 15
Table 9.3.17b.5a Mackerel in the Northeast Atlantic (combined Southern, Western, and North Sea spawning components). Catches (in tonnes) by country 1988–2012 (data submitted by Working Group members).
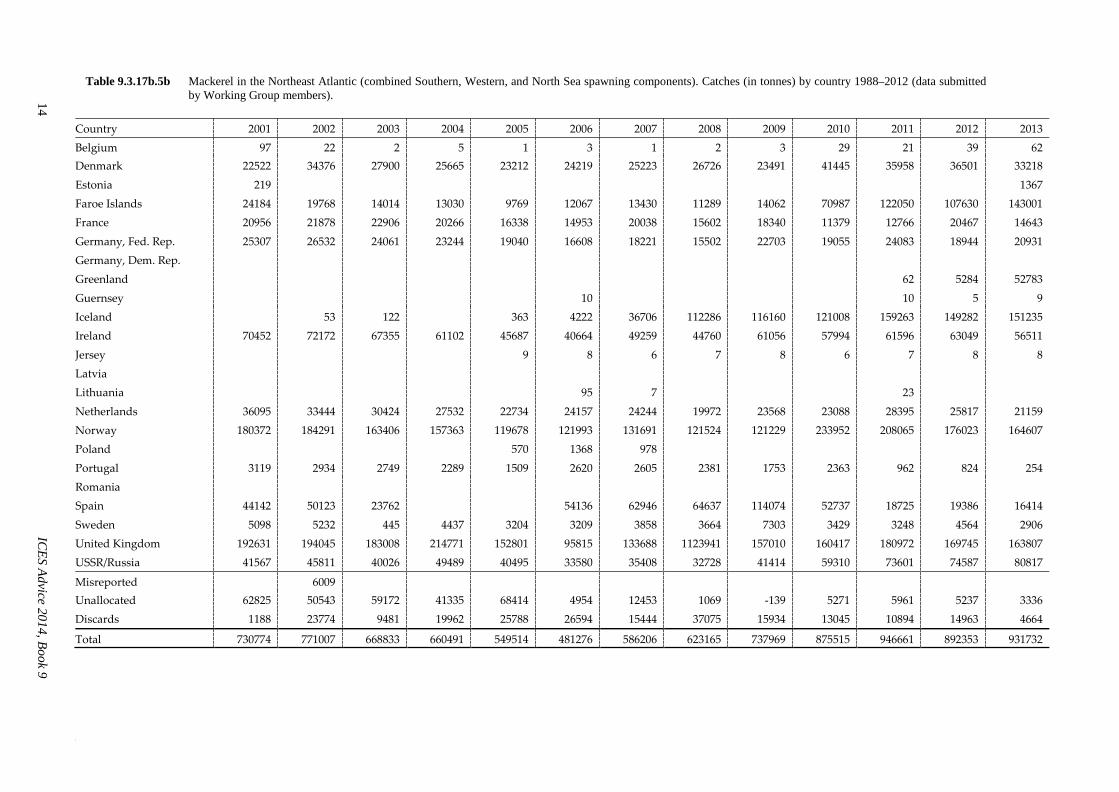
Table 9.3.17b.5b Mackerel in the Northeast Atlantic (combined Southern, Western, and North Sea spawning components). Catches (in tonnes) by country 1988–2012 (data submitted by Working Group members).
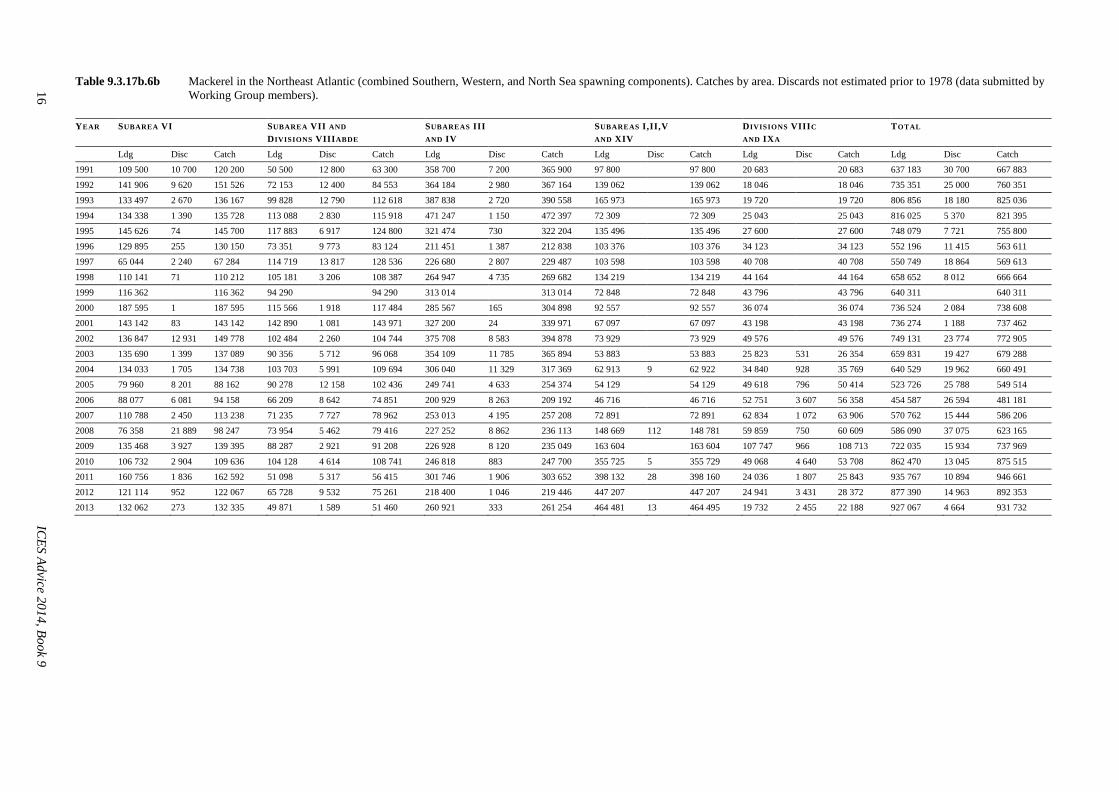
Table 9.3.17b.6a Mackerel in the Northeast Atlantic (combined Southern, Western, and North Sea spawning components). Catches by area. Discards not estimated prior to 1978 (data submitted by Working Group members).
Table 9.3.17b.6b Mackerel in the Northeast Atlantic (combined Southern, Western, and North Sea spawning components). Catches by area. Discards not estimated prior to 1978 (data submitted by Working Group members).
Table 9.3.17b.7 Mackerel in the Northeast Atlantic (combined Southern, Western, and North Sea spawning components). Summary of the stock assessment. Low = lower limit and High = higher limit of 95% confidence interval of the mean F at ages 4–8. Recruitment in thousands, SSB and landings in tonnes.
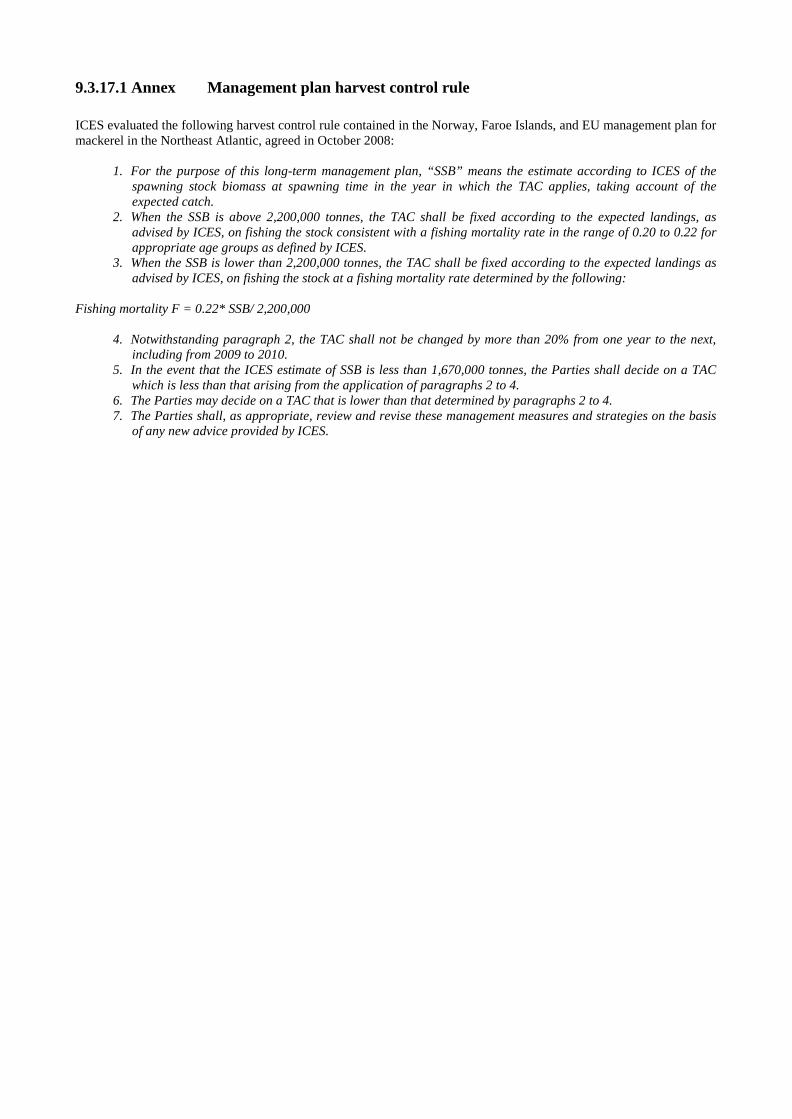
9.3.17.1 Annex Management plan harvest control rule
ICES evaluated the following harvest control rule contained in the Norway, Faroe Islands, and EU management plan for mackerel in the Northeast Atlantic, agreed in October 2008:
1. For the purpose of this long-term management plan, “SSB” means the estimate according to ICES of the spawning stock biomass at spawning time in the year in which the TAC applies, taking account of the expected catch.
2. When the SSB is above 2,200,000 tonnes, the TAC shall be fixed according to the expected landings, as advised by ICES, on fishing the stock consistent with a fishing mortality rate in the range of 0.20 to 0.22 for appropriate age groups as defined by ICES.
3. When the SSB is lower than 2,200,000 tonnes, the TAC shall be fixed according to the expected landings as advised by ICES, on fishing the stock at a fishing mortality rate determined by the following:
Fishing mortality F = 0.22* SSB/ 2,200,000
4. Notwithstanding paragraph 2, the TAC shall not be changed by more than 20% from one year to the next, including from 2009 to 2010.
5. In the event that the ICES estimate of SSB is less than 1,670,000 tonnes, the Parties shall decide on a TAC which is less than that arising from the application of paragraphs 2 to 4.
6. The Parties may decide on a TAC that is lower than that determined by paragraphs 2 to 4. 7. The Parties shall, as appropriate, review and revise these management measures and strategies on the basis