60
Jason Schupbach Director of Design Programs CREATIVE PLACEMAKING & LIVABILITY Sunil Iyengar Director of Research National Endowment for the Arts
| Date post: | 28-Jul-2015 |
| Category: |
Government & Nonprofit |
| Upload: | place-maker |
| View: | 56 times |
| Download: | 1 times |
Jason SchupbachDirector of Design Programs
CREATIVE PLACEMAKING & LIVABILITY
Sunil IyengarDirector of Research
National Endowment for the Arts
CREATIVE PLACEMAKING

In creative placemaking, partners from public, private, nonprofit, and community sectors strategically shape the
physical and social character of a neighborhood, town, city or region around arts and design activities.
- Markusen, A. & Gawda, A (2010) Creative Placemaking

PARTNERSHIPS

Federal Partners

Foundation Partners

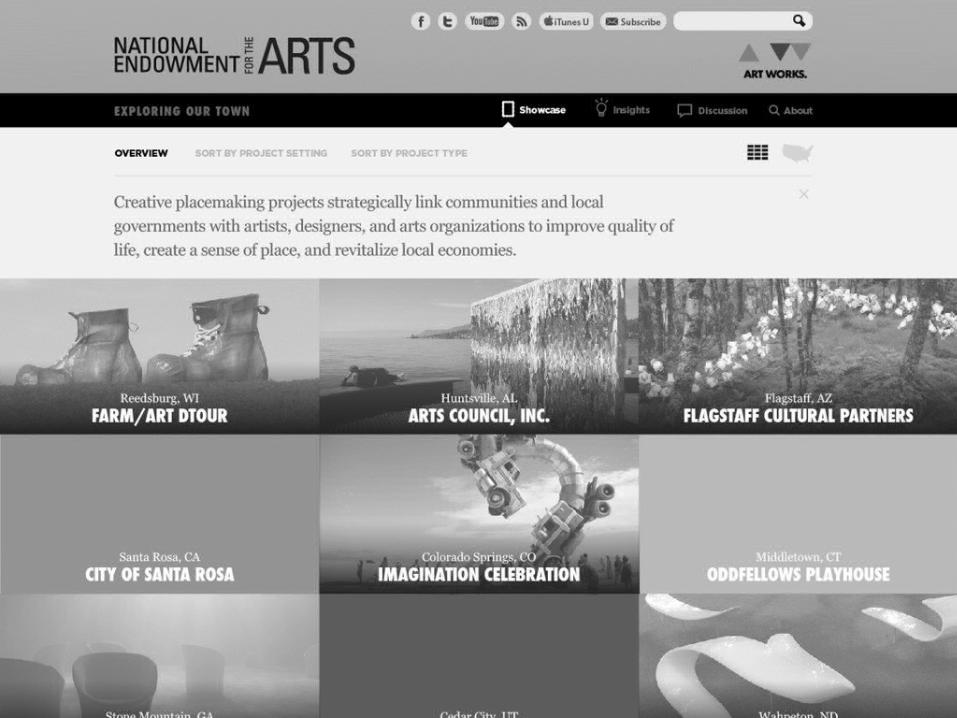
Our Town
LOCAL GOVERNMENT +
ARTS ORGANIZATIONS
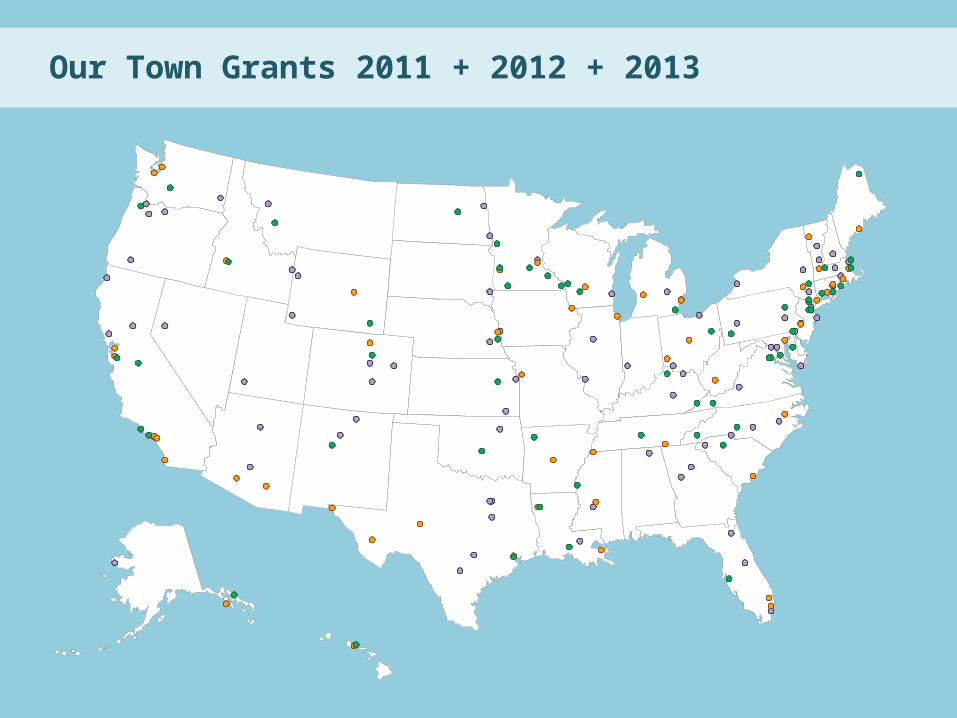
Our Town Grants 2011 + 2012 + 2013

<1,000
1,000-10,000
10,000-50,000
50,000-100,000
100,000-200,000
>200,000
35 of 59 < population 100,000
Our Town FY13 population size of recommended awardees

439 partners
6 State Arts Agencies: CT,ME,NC,OK,WA,WI
33 Local Arts Agencies
147 arts partners
Our Town 2013 Partners on 59 Grantees

Our Town 2013 147 Art Partners
Artist Communities
Arts Education
Dance
Design
Literature
Media
Multidisciplinary & Presenting
Museum
Music & Opera
Theater & Musical Theater
Traditional and Folk Arts
Visual Arts
0 5 10 15 20 25 30

Nonprofit Organizations: • Aging services• Botanic gardens• Development/community reinvestment • Environmental • Historic preservation • Land planning (Main Streets)• Libraries • Religious• Recreation• Scientific• Youth development
Education: • Private K-12
schools• School districts• Universities
Government: • Non-arts local, state and federal agencies
Local businesses: • Banks• Construction firms• Farms• Galleries• Hospitals• Newspapers• Restaurants• Real estate developers
Other:• Business associations • Business Improvement Districts• Foundations• Land Trusts
Our Town 2013 Partners

Asset Mapping
Creative Industry
Artist Space
Creative Entrepreneurship
Cultural Facility
Public Art Planning
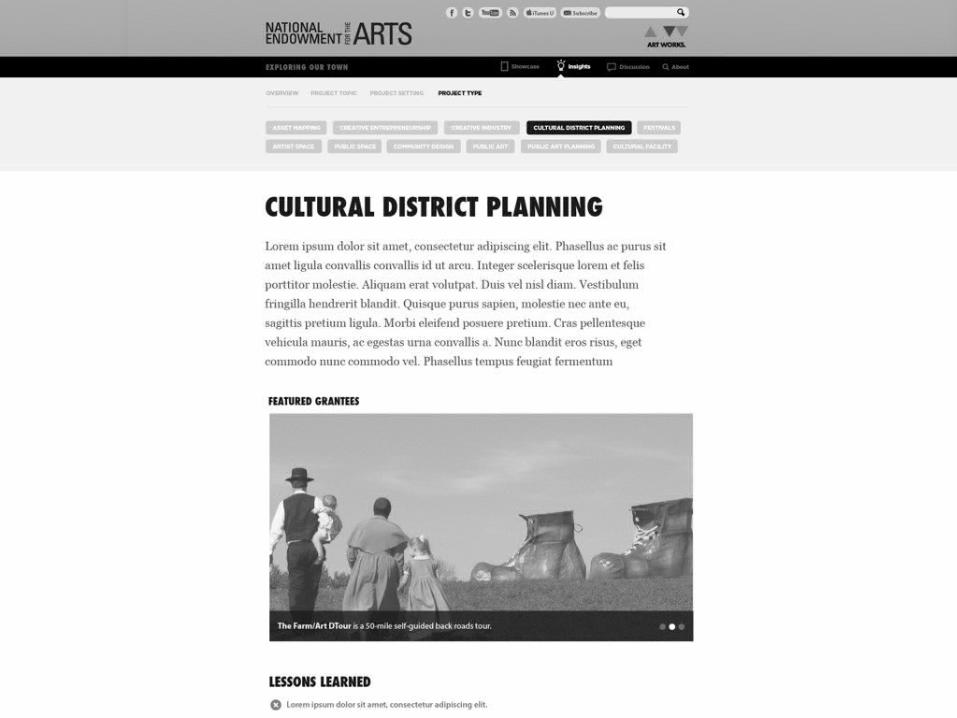
Cultural District Planning
Public Space
Festival/Performance
Public Art
Multidisciplinary Arts Programming
0 2 4 6 8 10 12 14 16
Our Town 2013 Project Types

The Bridge by Elena Colombo Courtesy of ArtsQuest, photos by Ryan Hulvat
ArtsQuest SteelStacks, Bethlehem, PA

The Bridge by Elena Colombo Courtesy of ArtsQuest, photos by Ryan Hulvat
ArtsQuest SteelStacks, Bethlehem, PA

Sugar Hill Landscape Arts Masterplan, Detroit, MI

Courtesy of Trey McIntrye project
Boise Bright Spot Project, Boise, ID
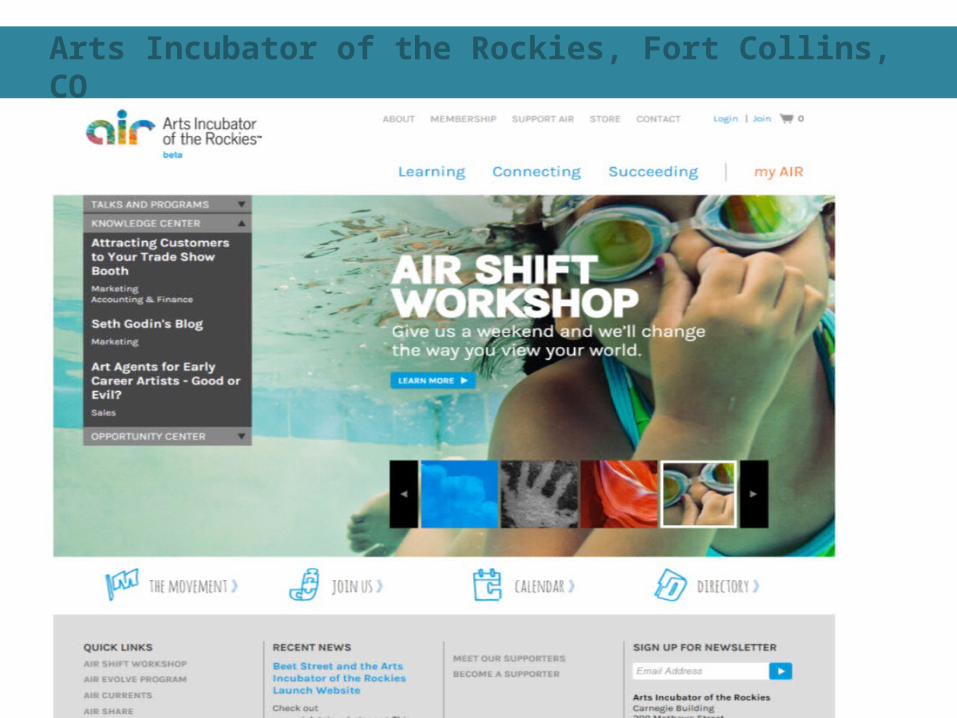
Arts Incubator of the Rockies, Fort Collins, CO
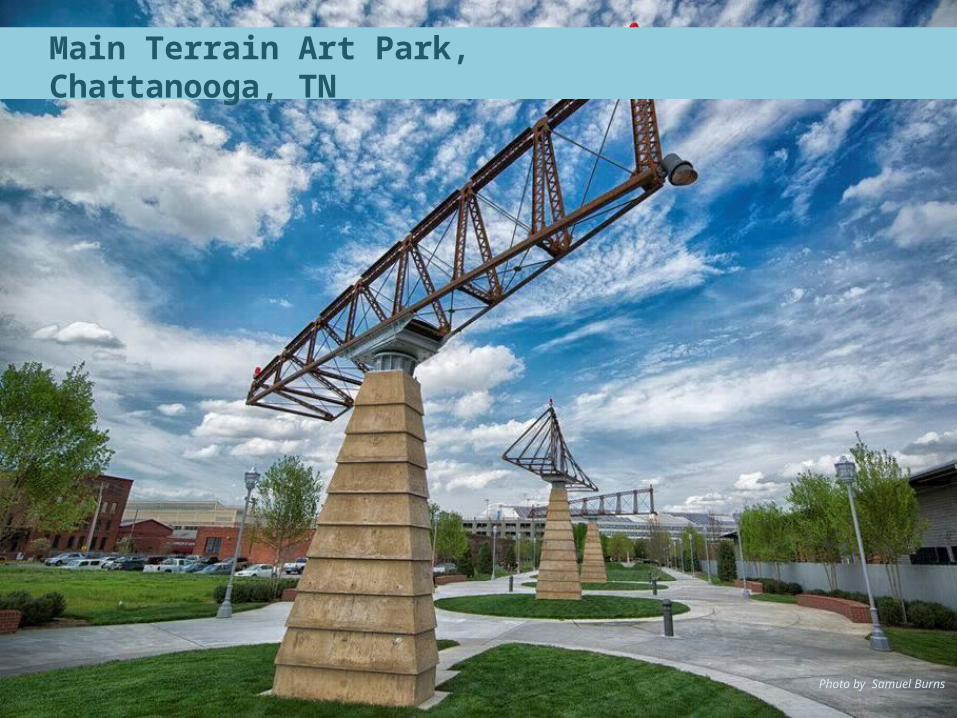
Photo by Samuel Burns
Main Terrain Art Park, Chattanooga, TN

Datagroove by Future cities lab
Silicon Valley Inside/Out, San Jose, CA
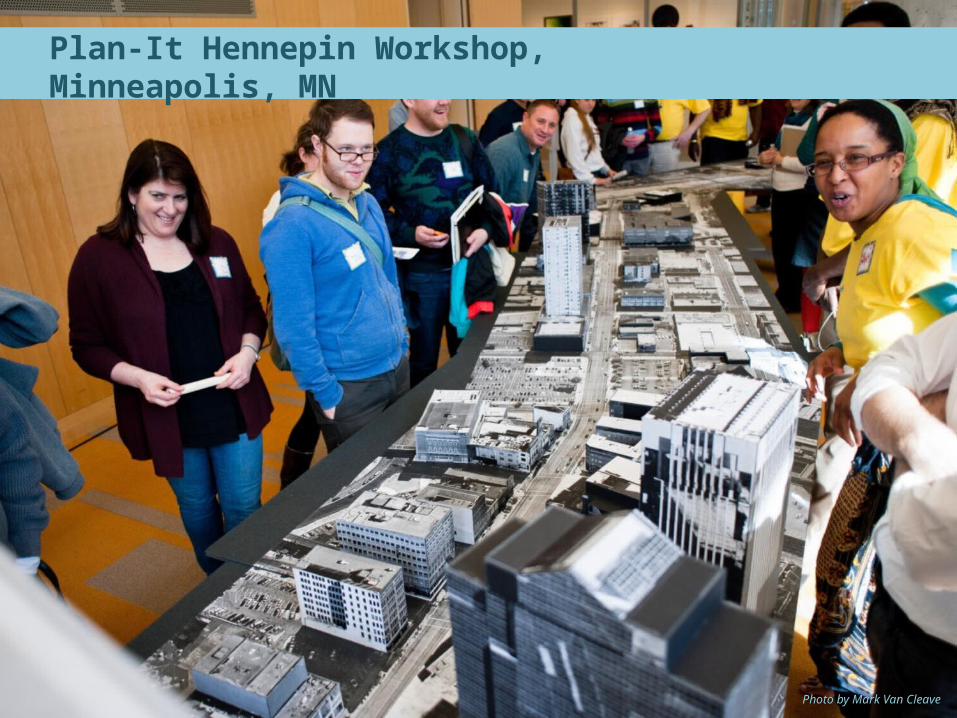
Photo by Mark Van Cleave
Plan-It Hennepin Workshop, Minneapolis, MN
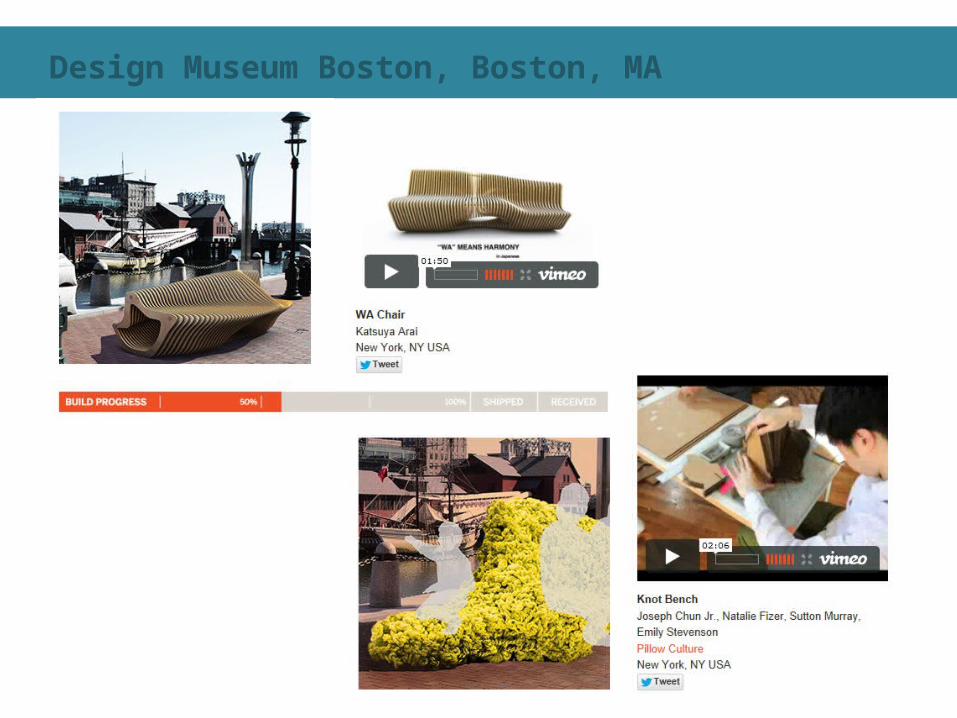
Design Museum Boston, Boston, MA

Rendering, La Dallman Architects
Harmony Center, Milwaukee, WI

Wormfarm Farm Art – Dtour Reedsburg, WI

CultureBlocks, Philadelphia, PA

FIELD BUILDING

Podcasts

Webinars
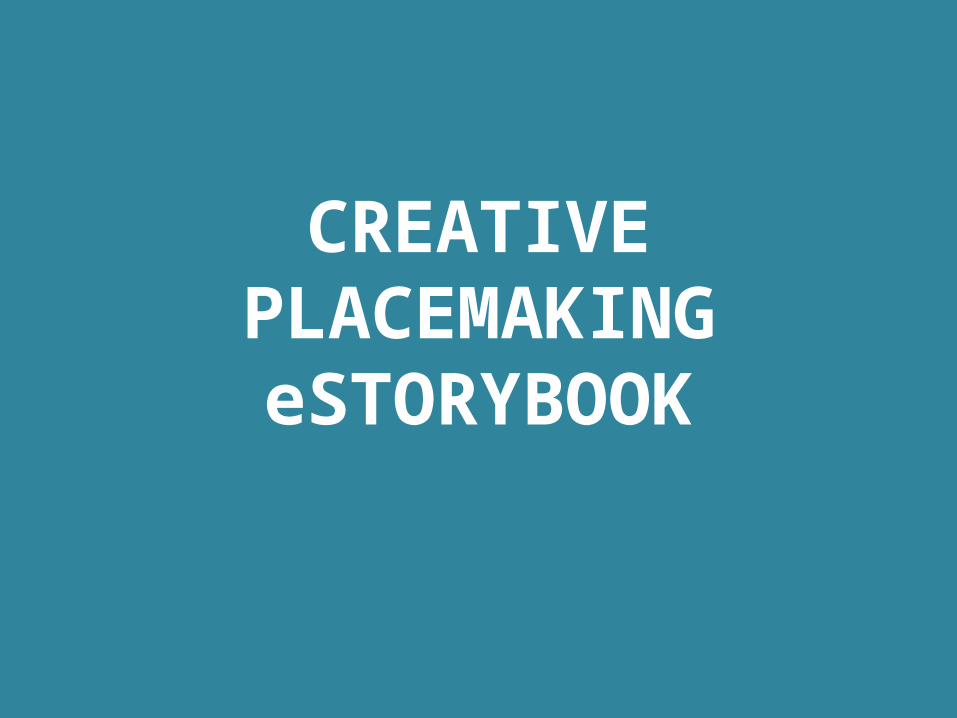
CREATIVEPLACEMAKINGeSTORYBOOK


MEASURING IMPACT

EVALUATION

NEA Strategic Goals with Measurable Outcomes
GOAL 1 To Create Art That Meets the Highest Standards of Excellence
GOAL 2 To Engage the Public with Diverse and Excellent Art
GOAL 3 To Promote Public Knowledge and Understanding about the Contributions of the Arts

Example #1: Outcome Measurements
OUTCOME
PERFORMANCEMEASURE
PROGRESS
The Portfolio of American Art is Expanded
Post-Award Review, by Independent Experts, of Artistic Excellence in NEA Grants Supporting Arts Creation
NEA conducting pilot study of post-grant reviews to assess artistic excellence of completed projects

Example #2: Outcome Measurements
OUTCOME
PERFORMANCEMEASURE
PROGRESS
Americans Throughout the Nation Experience Art
Percent of Adults Who Report Being Affected by NEA-Funded Art
NEA conducting pilot study to survey audiences at grantees’ art exhibits, performances, and screenings
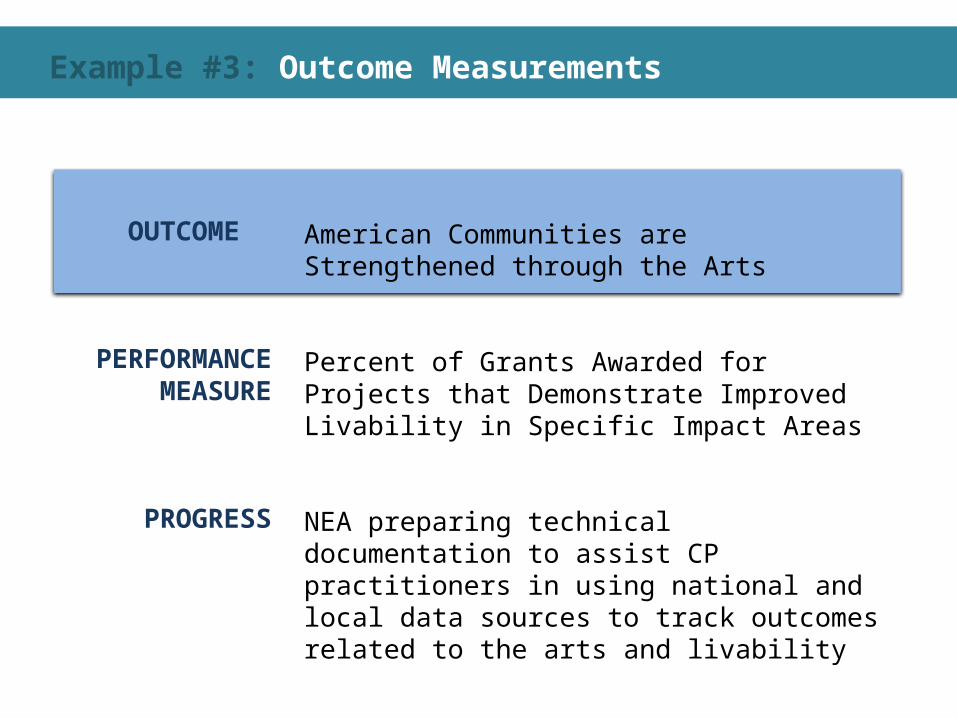
Example #3: Outcome Measurements
OUTCOME
PERFORMANCEMEASURE
PROGRESS
American Communities are Strengthened through the Arts
Percent of Grants Awarded for Projects that Demonstrate Improved Livability in Specific Impact Areas
NEA preparing technical documentation to assist CP practitioners in using national and local data sources to track outcomes related to the arts and livability

Arts & Livability Indicators: Why now?
• Open Government/Data Environment
• Publicly Accessible, but Scattered Sources
• Empower Communities to Have Data-Driven Conversations about Priorities and Resources
• Supplement Planned or Ongoing Evaluations
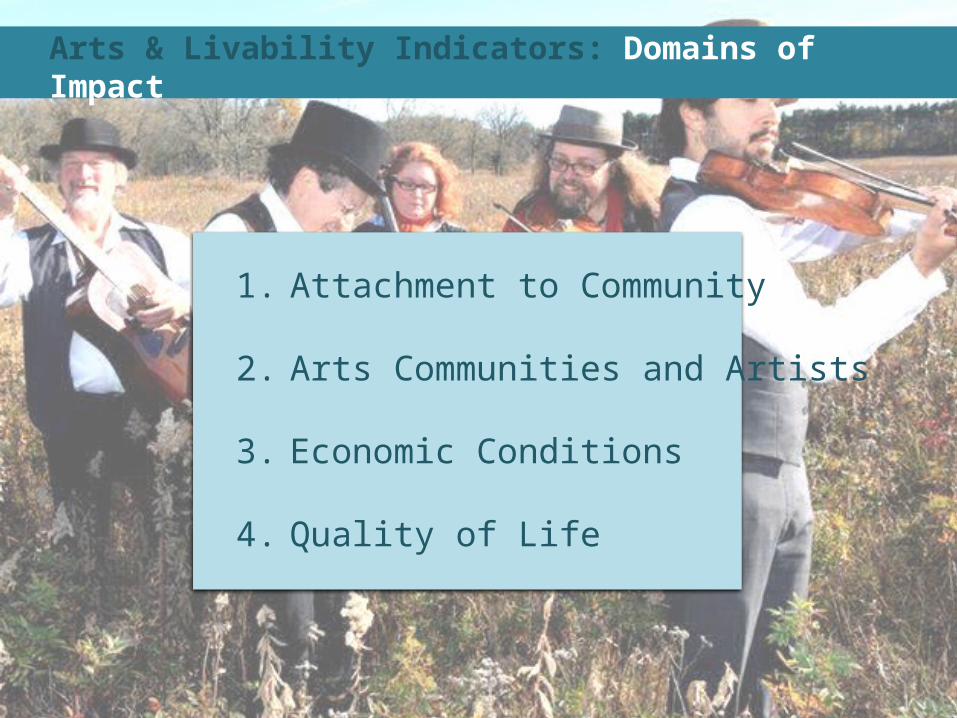
1. Attachment to Community
2. Arts Communities and Artists
3. Economic Conditions
4. Quality of Life
Arts & Livability Indicators: Domains of Impact

• Determine whether the national data capture local conditions
• Identify local-level indicators and data sources of CP-related impacts
Validating Arts & Livability Indicators (VALI): Project Goals

VALI Methods
Site visit Convening with representatives
Focus group with uninvolved experts

• Majority of indicators were deemed relevant
• Mixed results for some indicators
• Urban and rural respondent views differed infrequently
• Problems with using county and zip-code level data to capture local outcomes
• More contextual indicators requested
VALI Early Findings
@jackiebrookner

Example #1: Indicator and Contextual Issues
Domain: Attachment to Community Indicator: # of civic engagement establishments per 1,000 people Geo level: Zip code, county Data source: County Business Patterns, U.S. Census Bureau
• Data may not be available for some low-population areas• Purely voluntary organizations (no paid employees) are excluded• Educational institutions and some commercial establishments (e.g., local coffee shops) are excluded
Data Concerns:

Example #1: Notes for Interpretation
• In low-pop areas, a simple count of civic establishments can replace or supplement this indicator
• Location of civic establishments may not reflect community where members live
• Indicator should be paired with economic indicators such as median income and poverty rate
• Saturation-level effects should be considered

Example #2: Indicator and Contextual Issues
Domain: Arts Communities and Artists Indicator: # of arts, culture, and humanities nonprofits per
1,000 people Geo level: Census tract, county Data source: National Center for Charitable Statistics,
The Urban Institute
• Location may not reflect where nonprofit is active or delivering services• Nonprofits earning revenue less than $25,000 are excluded
Data Concerns:

Example #2: Notes for Interpretation
• Does not account for organizations that are non-arts-centric, but which yet provide venues for arts engagement
• Increasing density of arts organizations in a community not always desirable
• Indicator could be enhanced with more information on the scope of a community’s nonprofit activities in the arts

Example #3: Indicator and Contextual Issues
Domain: Economic Conditions Indicator: Active businesses (% of businesses collecting mail)
Geo level: Census tract Data source: U.S. Postal Service, U.S. Department of Housing &
Urban Development
• Businesses that collect their mail through post office boxes (instead of location address) are excluded• Businesses under construction are also excluded
Data Concerns:

Example #3: Notes for Interpretation
• Indicator could be enhanced with a count of the actual number of businesses in the area
• For example, a high percentage of “active” businesses but a low number of commercial addresses might suggest less economic stability

1. User’s Guide to National Arts & Livability Indicators
2. Guide to Local Data Sources and Indicators Relevant to CP
3. NEA/Urban Institute Report on VALI Study, Methodology, and Findings
4. Web Presence for CP Evaluation Tools
VALI Planned Product Releases

7 out of 31 grants awarded in 2012-2013 went to arts and livability related projects
More in the Pipeline
Arts and Livability Related Projects
Other Projects
NEA Research: Art Works Grants Program

QUESTIONS?

Jason SchupbachDirector of Design Programs
CREATIVE PLACEMAKING & LIVABILITY
Sunil IyengarDirector of Research
National Endowment for the Arts


