Near-¢eld optical imaging of abasic sites on a single DNA molecule JongMin Kim a , Hiroshi Muramatsu b , HeaYeon Lee a ; , Tomoji Kawai a ; a ISIR-Sanken, Osaka University, 8-1 Mohogaoka, Ibaraki, Osaka 567-0047, Japan b School of Bionics, Tokyo University of Technology, Katakura, Hachioji, Tokyo 192-0982 Japan Received 26 September 2003; revised 3 November 2003; accepted 3 November 2003 First published online 14 November 2003 Edited by Horst Feldmann Abstract Scanning near-¢eld optical microscopy (SNOM) imaging was performed to allow for the direct visualization of damaged sites on individual DNA molecules to a scale of a few tens of nanometers. Fluorescence in situ hybridization on ex- tended DNA molecules was modi¢ed to detect a single abasic site. Abasic sites were speci¢cally labelled with a biotinlylated aldehyde-reactive probe and £uorochrome-conjugated strepta- vidin. By optimizing the performance of the SNOM technique, we could obtain high contrast near-¢eld optical images that enabled high-resolution near-¢eld £uorescence imaging using optical ¢ber probes with small aperture sizes. High-resolution near-¢eld £uorescence imaging demonstrated that two abasic sites within a distance of 120 nm are clearly obtainable, some- thing which is not possible using conventional £uorescence in situ hybridization combined with far-¢eld £uorescence micros- copy. ȣ 2003 Federation of European Biochemical Societies. Pub- lished by Elsevier B.V. All rights reserved. Key words: Scanning near-¢eld optical microscopy ; DNA damage ; DNA imaging ; Avidin^biotin interaction 1. Introduction Scanning near-¢eld optical microscopy (SNOM), a form of scanning probe microscopy, uses a near-¢eld light source as an imaging mechanism and can provide sub-wavelength reso- lution under various conditions; see for review, for example, [1]. Conventional SNOM can simultaneously produce shear- force and optical images. This dual capacity means that the SNOM image can, in principle, provide more information about a sample than the force image alone. We are developing an imaging system called scanning near-¢eld optical/atomic- force microscopy (SNOM/AFM) in which a bent optical ¢ber probe is used as a cantilever [2]. Both feedback methods have their di¡erent merits. The SNOM/AFM, however, has certain advantages with soft samples and can provide better resolu- tion of a topographic image than that of the normal shear- force-controlled SNOM because of its round tip shape [2], although high-resolution optical imaging for small biosamples remains unsatisfactory. DNA lesions are an important source of biological muta- tions. One of the most prevalent sites of DNA damage is at an abasic site, also called an apurinic/apyrimidinic (AP) site, where a DNA base residue is subsequently removed [3,4]. These abnormal sites can be formed from spontaneous depu- rination, deamination, ionizing radiation or from repair mech- anisms in plants and animals [5^7]. The abasic sites can po- tentially cause carcinogenesis, in addition to cellular death [8]. Since the DNA damage sustained from one DNA molecule to another is di¡erent, a sensitive and reliable method to detect AP sites on individual DNA molecules is fundamentally es- sential in the ¢eld of genetic studies. The visualization of speci¢c DNA molecules can provide for a more detailed study of various DNA mechanisms includ- ing DNA transcription, repair and recombination [5^7]. For example, Michalet et al. visualized speci¢c sequences on ex- tended DNA molecules [9]. Lin et al. developed whole-genome optical mapping of Deinococcus radiodurans [10]. Further- more, the direct visualization of abasic sites has been per- formed by Hirose et al. using far-¢eld £uorescence techniques [11]. One drawback of the far-¢eld technique is its limitation in optical resolution. For example, the precise detection of short sequences or sequence-speci¢c function composed of only a few codons is di⁄cult since far-¢eld optical resolution at room temperature cannot be improved to values below 300 nm [1], which corresponds to a DNA length of approximately 1 kb. Recently, Winkler et al. combined chromosome £uores- cence in situ hybridization with SNOM [12], however, a sim- ilar methodology applied to DNA related investigations using SNOM has not been reported. Here, we report for the ¢rst time high-resolution near-¢eld £uorescence imaging of abasic sites on DNA molecules. 2. Materials and methods 2.1. Abasic DNA sample A schematic £ow diagram representing the preparation of the aba- sic DNA sample is illustrated in Fig. 1. Target DNA molecules con- taining abasic sites were prepared by incubating V-DNA (Wako pure Chemicals, Inc., Japan) in sodium citrate bu¡er (100 mM NaCl, 10 mM sodium citrate, pH 5.0) at 70‡C for 90 min. Following this, 10 Wl of 10 mM aldehyde-reactive probe-conjugated biotin (ARP-biotin, 445 Da, Dojindo, Japan) solution was added to 10 Wl of the abasic DNA solution (50^100 ng/Wl) and the mixture was incubated at 37‡C for 1 h. The solution was then puri¢ed by passage through a gel ¢ltration column (chroma spin TE-1000, BD Biosciences Clontech, Inc.). Ten Wl of a 1/5000 diluted streptavidin solution (s11224, V52 kDa, Molecular Probe Inc.) labeled with alexa 532 dye (A532, 4 mol of dye per protein in a manufacturer’s solution test, adsorption max: 532 nm, emission max: 554 nm, Molecular Probe Inc.) was added to 10 Wl of the biotinylated DNA solution and incubated at 37‡C for 1 h. The DNA^streptavidin complex was puri¢ed by passage through a gel 0014-5793 / 03 / $22.00 ȣ 2003 Federation of European Biochemical Societies. Published by Elsevier B.V. All rights reserved. doi :10.1016/S0014-5793(03)01298-5 *Corresponding authors. Fax: (81)-6-6875 2440. E-mail addresses: [email protected](H. Lee), [email protected](T. Kawai). Abbreviations : SNOM, scanning near-¢eld optical microscopy; AP, apurinic/apyrimidinic; A532, alexa 532; FWHM, full width half max- imum FEBS 27880 FEBS Letters 555 (2003) 611^615
Transcript
Near-¢eld optical imaging of abasic sites on a single DNA molecule
aISIR-Sanken, Osaka University, 8-1 Mohogaoka, Ibaraki, Osaka 567-0047, JapanbSchool of Bionics, Tokyo University of Technology, Katakura, Hachioji, Tokyo 192-0982 Japan
Received 26 September 2003; revised 3 November 2003; accepted 3 November 2003
First published online 14 November 2003
Edited by Horst Feldmann
Abstract Scanning near-¢eld optical microscopy (SNOM)imaging was performed to allow for the direct visualization ofdamaged sites on individual DNA molecules to a scale of a fewtens of nanometers. Fluorescence in situ hybridization on ex-tended DNA molecules was modi¢ed to detect a single abasicsite. Abasic sites were speci¢cally labelled with a biotinlylatedaldehyde-reactive probe and £uorochrome-conjugated strepta-vidin. By optimizing the performance of the SNOM technique,we could obtain high contrast near-¢eld optical images thatenabled high-resolution near-¢eld £uorescence imaging usingoptical ¢ber probes with small aperture sizes. High-resolutionnear-¢eld £uorescence imaging demonstrated that two abasicsites within a distance of 120 nm are clearly obtainable, some-thing which is not possible using conventional £uorescence insitu hybridization combined with far-¢eld £uorescence micros-copy.- 2003 Federation of European Biochemical Societies. Pub-lished by Elsevier B.V. All rights reserved.
Scanning near-¢eld optical microscopy (SNOM), a form ofscanning probe microscopy, uses a near-¢eld light source asan imaging mechanism and can provide sub-wavelength reso-lution under various conditions; see for review, for example,[1]. Conventional SNOM can simultaneously produce shear-force and optical images. This dual capacity means that theSNOM image can, in principle, provide more informationabout a sample than the force image alone. We are developingan imaging system called scanning near-¢eld optical/atomic-force microscopy (SNOM/AFM) in which a bent optical ¢berprobe is used as a cantilever [2]. Both feedback methods havetheir di¡erent merits. The SNOM/AFM, however, has certainadvantages with soft samples and can provide better resolu-tion of a topographic image than that of the normal shear-force-controlled SNOM because of its round tip shape [2],although high-resolution optical imaging for small biosamplesremains unsatisfactory.
DNA lesions are an important source of biological muta-tions. One of the most prevalent sites of DNA damage is at anabasic site, also called an apurinic/apyrimidinic (AP) site,where a DNA base residue is subsequently removed [3,4].These abnormal sites can be formed from spontaneous depu-rination, deamination, ionizing radiation or from repair mech-anisms in plants and animals [5^7]. The abasic sites can po-tentially cause carcinogenesis, in addition to cellular death [8].Since the DNA damage sustained from one DNA molecule toanother is di¡erent, a sensitive and reliable method to detectAP sites on individual DNA molecules is fundamentally es-sential in the ¢eld of genetic studies.
The visualization of speci¢c DNA molecules can providefor a more detailed study of various DNA mechanisms includ-ing DNA transcription, repair and recombination [5^7]. Forexample, Michalet et al. visualized speci¢c sequences on ex-tended DNA molecules [9]. Lin et al. developed whole-genomeoptical mapping of Deinococcus radiodurans [10]. Further-more, the direct visualization of abasic sites has been per-formed by Hirose et al. using far-¢eld £uorescence techniques[11]. One drawback of the far-¢eld technique is its limitationin optical resolution. For example, the precise detection ofshort sequences or sequence-speci¢c function composed ofonly a few codons is di⁄cult since far-¢eld optical resolutionat room temperature cannot be improved to values below 300nm [1], which corresponds to a DNA length of approximately1 kb. Recently, Winkler et al. combined chromosome £uores-cence in situ hybridization with SNOM [12], however, a sim-ilar methodology applied to DNA related investigations usingSNOM has not been reported. Here, we report for the ¢rsttime high-resolution near-¢eld £uorescence imaging of abasicsites on DNA molecules.
2. Materials and methods
2.1. Abasic DNA sampleA schematic £ow diagram representing the preparation of the aba-
sic DNA sample is illustrated in Fig. 1. Target DNA molecules con-taining abasic sites were prepared by incubating V-DNA (Wako pureChemicals, Inc., Japan) in sodium citrate bu¡er (100 mM NaCl, 10mM sodium citrate, pH 5.0) at 70‡C for 90 min. Following this, 10 Wlof 10 mM aldehyde-reactive probe-conjugated biotin (ARP-biotin,445 Da, Dojindo, Japan) solution was added to 10 Wl of the abasicDNA solution (50^100 ng/Wl) and the mixture was incubated at 37‡Cfor 1 h. The solution was then puri¢ed by passage through a gel¢ltration column (chroma spin TE-1000, BD Biosciences Clontech,Inc.). Ten Wl of a 1/5000 diluted streptavidin solution (s11224, V52kDa, Molecular Probe Inc.) labeled with alexa 532 dye (A532, 4 molof dye per protein in a manufacturer’s solution test, adsorption max:532 nm, emission max: 554 nm, Molecular Probe Inc.) was added to10 Wl of the biotinylated DNA solution and incubated at 37‡C for 1 h.The DNA^streptavidin complex was puri¢ed by passage through a gel
0014-5793 / 03 / $22.00 K 2003 Federation of European Biochemical Societies. Published by Elsevier B.V. All rights reserved.doi:10.1016/S0014-5793(03)01298-5
¢ltration column. The ¢nal DNA^streptavidin solution was mixedwith a DNA intercalator dye molecule (YOYO-1, adsorption max:491 nm, emission max: 509 nm, Molecular Probe Inc.) and spin-coated to stretch the DNA molecules [13] on a Q-APTES (3-(amino-propyl)triethoxysilane)-coated mica substrate [14,15]. The mixing ratioof YOYO-1:bp was 1:5, and a spin speed of 5500 rpm was used forstretching the DNA molecules. The depurination treatment does nota¡ect DNA fragmentation under these conditions but randomly gen-erates a few abasic sites on the DNA molecules as reported by Hiroseet al. [11].
2.2. SNOM instrumentsThe SNOM/AFM instrument is based on a conventional AFM unit
(SPI 3800, Seiko Instruments Inc), which is capable of a dynamicforce mode (DFM) function [14] and uses a bent-type optical ¢berprobe to enable AFM feedback by a beam de£ection method. Lightconsisting of 488 nm from a multi-line Ar ion laser and 532 nm froma Nd YAG laser with an output power of V40 mW was coupled toone end of the optical probe and illuminated from the tip of the probeto the sample surface. After transmission through the aperture of theoptical ¢ber probe, the sample and an optical ¢lter set, the remaininglight was collected by an avalanche photo diode (EGpG, SPCM-AQR-16). Fluorescence signals collected ranged from 510^650 nmand 540^650 nm for YOYO-1 and A532 molecules, respectively. Inan e¡ort to achieve high resolution imaging we modi¢ed the system[15] with respect to the scanning unit and the optical ¢ber probe. Twotechnical modi¢cations were applied for the scanning unit. To en-hance the optical e⁄ciency of the imaging system, self-made optical¢lter sets were used for imaging YOYO-1 and the A532 dye. Insofaras disturbing the movement of the sample when changing the optical¢lter sets was concerned, the sample stage was magnetized, and thesample was ¢xed on a steel ring to attach it ¢rmly on the magneticsample stage. Thin step-etched optical ¢ber probes were used for theimaging [16]. The di¡erence between normal optical ¢ber and the step-etched probes has to do with the spring constant. Due to the lowspring constant, the step-etched probes were originally used for con-tact mode operation but not examined under normal DFM operation.To obtain maximum optical performance, the tip (corn) angle of theoptical ¢ber probe was maximized to enhance the optical transmissione⁄ciency using a multi-mode optical ¢ber and a special etching meth-od. Using the same tip angle, Hosaka et al. demonstrated 15 nmoptical resolution for single molecular £uorescence imaging [17].The detailed manufacturing process of the probe will be discussedelsewhere.
3. Results and discussion
Previously we demonstrated that simultaneous high-resolu-tion topography and £uorescence imaging is possible forYOYO-1 intercalated V-DNA molecules using SNOM/AFM[15]. The location of the intercalated YOYO-1 molecules wasclearly observed when the aperture size of the optical probeused was larger than 50 nm. When aperture sizes below thisvalue were used, the signal-to-noise ratio critically decreasedand successful near-¢eld imaging of the intercalated YOYO-1was di⁄cult. This is also one of the general problems in nor-mal SNOM imaging [1]. By optimizing the performance ofSNOM/AFM as mentioned above, it is possible to obtainhigh-contrast near-¢eld £uorescence images.
Fig. 2 shows an example of high-contrast near-¢eld £uores-cence imaging for the YOYO-1 intercalated V-DNA molecule(1 V = 256 C/10 ms). The intercalation of YOYO-1 is con-trolled by a mixing ratio of 5 bp:1 dye, as recommended bythe manufacturer. The length of the V-DNA molecule wasevaluated to about 21 Wm by a direct £uorescence lengthanalysis of the DNA length direction. As reported by Benninket al. [18], the length of the DNA molecules produced canvary depending on the applied stretching force or theYOYO-1 intercalation conditions. When the applied stretch-ing force is strong, the length of a single V-DNA moleculeproduced can reach up to 24 Wm as shown by Nakao et al.[19]. In the case of spin-stretching, a standard deviation of16.9 T 4.3 Wm for V-DNA molecules has been reported [13]at a spin speed of 5500 rpm. Furthermore, it has been con-¢rmed that a similar £uorescence intensity is obtained fromthe whole DNA length, which is evidence con¢rming the pres-ence of a single DNA molecule [20]. The £uorescence signalintensity of the single DNA molecule was more than ¢ve-foldstronger than that of a previous report [15] at the same optical
Fig. 1. Procedure used for visualizing abasic sites on V-DNA mole-cules.
Fig. 2. Highly contrasted near-¢eld £uorescence image showing freeYOYO-1 (Vexc = 488 nm) on the background. The image area is20U20 Wm2 with a 512U256 data format. The optical resolution offree YOYO-1 molecules and DNA width directions is varied. Forthe free YOYO-1 optical resolution, see the arrow head in thedashed circle. Scanning was performed at a scanning speed of 0.2Hz and £uorescence gate time of 10 ms. A £uorescence signal of 1 Vcorresponds to 256 C/10 ms.
FEBS 27880 8-12-03 Cyaan Magenta Geel Zwart
J. Kim et al./FEBS Letters 555 (2003) 611^615612
resolution (6 100 nm). This is not due to di¡erences in thepreparation of the sample since we have applied the samemixing ratio of dye and bp as in the previous report, butdue to the high throughput e⁄ciency of the optical ¢ber probe[17]. From the background signals (free YOYO-1 molecules)as shown in the dashed circle area in Fig. 2, it can be seen thatthe £uorescence widths of the free dye molecules and thewidths of the DNA £uorescence signals are not same. Thisis an interesting phenomenon since the intercalation geometryof YOYO-1 is limited by the DNA width, and the DNA widthis very small compared with the aperture size. Additionally,this is a common phenomenon with DNA £uorescence imagesderived from far-¢eld microscopy. For example, the £uores-cence DNA widths of YOYO-1 intercalated DNA moleculesgenerally exceed the far-¢eld optical resolution by more thantwo-fold (data not shown, or see [14]). In this image, thedi¡erence in the £uorescence widths between the modulatedbackground signals (ca. 90 nm) and the DNA molecule (ca.300 nm) is more than three-fold at full width half maximums(FWHM). In order to obtain information concerning thisvariation, it is necessary to obtain more high-resolution im-ages.
Fig. 3 shows high-resolution near-¢eld £uorescence imagesfor the V-DNA molecules containing abasic sites in 25U25Wm2 image scales. The imaging was performed separately asa sequence of A532 dye (b) and YOYO-1 (a) to minimize the£uorescence energy transfer [21] of YOYO-1 to A532 mole-
cules. The whole length of the DNA molecule was evaluatedto about 17.5 Wm in Fig. 3a. By superimposing the A532image (b) on the YOYO-1 image (a), the abasic sites onDNA molecule were resolved as shown in Fig. 3c. The globalappearance of the image, i.e. the length of the DNA moleculesand the number of abasic light spots, is similar to the ¢rstreport concerning the detection of abasic sites on V-DNAmolecules as determined by far-¢eld £uorescence microscopy[11] since the experimental conditions used were similar. Fiveor six damaged sites were detected in the DNA molecules inboth cases. Careful inspection for abasic sites is necessarysince the size and intensity of the A532 light spots are notsame. As compared with small and weak light signals fromfree A532 molecules and other abasic sites, the signals fromthe few abasic sites present are broad and strong. In an e¡ortto obtain more information, we enlarged a strong light spot,denoted as ‘Target’ in Fig. 3c.
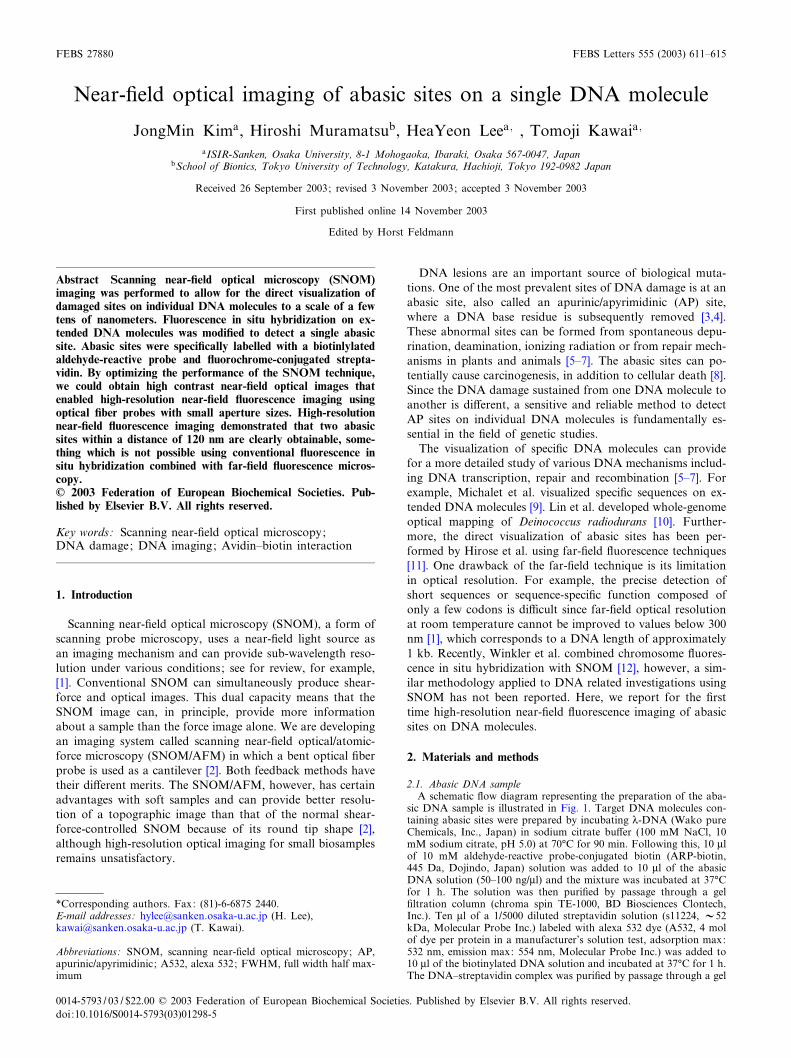
Fig. 4 shows the enlarged near-¢eld £uorescence imagesrepresenting scanned areas of 10U10 Wm2 (Fig. 4a,b,e),2.5U2.5 Wm2 (Fig. 4c,d,f) and 1.5U1.5 Wm2 (Fig. 4g). Origi-nally scanned images are shown in Fig. 4a,c for YOYO-1, andFig. 4b,d for A532 dye, while Fig. 4e,f shows synthesizedimages for each scan area. Big light spots were still discerniblein the originally scanned images for the YOYO-1 and A532(Fig. 4a^d), consistent with Fig. 3. Additionally, a few smalllight spots become visible only when the images were en-larged. When the scan area was wide, for example 25U25
Fig. 3. Direct visualization of DNA abasic sites. YOYO-1 (a) and A532 (b) (Vexc = 532 nm) £uorescence images were scanned separately to ob-tain abasic sites (c) where blue and red signals are from YOYO-1 and A532 dye molecules, respectively. In c, the target has a width of over400 nm and shows strong £uorescence intensity at a FWHM. Scale bars correspond to 5 Wm. A £uorescence signal of 1 V corresponds to 125C/10 ms.
FEBS 27880 8-12-03 Cyaan Magenta Geel Zwart
J. Kim et al./FEBS Letters 555 (2003) 611^615 613
Wm2, 1 pixel of data point corresponded to approximately 50nm of real distance in a horizontal direction since the dataformat was composed of 512 pixels and 256 lines. Conse-quently, if there is 1 pixel of signal missing, a 50 nm imagedistance cannot be detected in the 25 Wm single line. Similarly,in the 2.5U2.5 Wm2 scan area, 1 pixel corresponded to ap-proximately 5 nm of real distance. Therefore, a 1 pixel signalerror does not signi¢cantly a¡ect the resultant £uorescenceimages. This is a general problem in high-resolution scanningprobe microscopy imaging as well as in high-resolution near-¢eld imaging. In the case of near-¢eld optical imaging, singlemolecular dynamics [22] can also in£uence the resultant near-¢eld images. Fig. 4g shows an enlarged image (1.5U1.5 Wm2)of the YOYO-1 signals corresponding to the dashed circlearea in Fig. 4c. At this scale, it is clearly shown that theoriginal single line shaped £uorescence signals of YOYO-1are completely separated. The bulk light spots in Fig. 4g,denoted by the arrows, are believed to be due to the presenceof free YOYO-1 molecules on surface of the substrate. Similarresults were obtained by simultaneous topographic and £uo-rescence imaging for YOYO-1 intercalated V-DNA molecules(data not shown). This suggests that the deviation in £uores-cence widths between the free YOYO-1 molecules and theDNA widths can be accounted for by the low pixel resolutionwhen the scan area is wide. Using the same method for thepreparation of images as shown in Fig. 4e,f, it can be seenthat the target abasic spots were resolved separately within a500 nm area. Three spots were resolved in Fig. 4f, and showdi¡erent £uorescence characteristics. The shortest distance be-tween two light spots is about 120 nm. We are unable todetermine how many excited A532 molecules are involved in
each light spot with the present data. On the other hand, inthe photo-dissociation experiment for the single A532 mole-cule, more than eight consecutive scans were required using asimilar optical probe with aperture size of approximately 25nm (data not shown). Therefore, the signal separation of theA532 light spot cannot be accounted for by the photo-disso-ciation of a single dye molecule. Given that four A532 mole-cules can potentially be conjugated with streptavidin, this doesnot raise the specter of sudden photo-dissociation (see theinstruction manual for s11224).
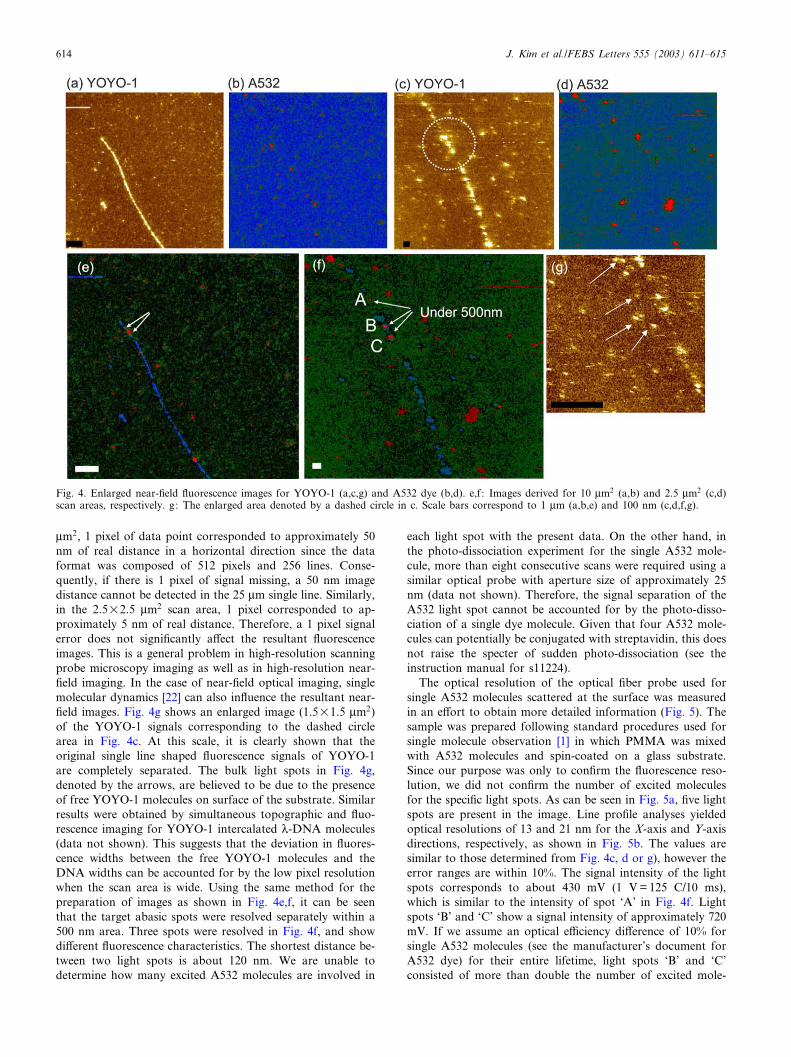
The optical resolution of the optical ¢ber probe used forsingle A532 molecules scattered at the surface was measuredin an e¡ort to obtain more detailed information (Fig. 5). Thesample was prepared following standard procedures used forsingle molecule observation [1] in which PMMA was mixedwith A532 molecules and spin-coated on a glass substrate.Since our purpose was only to con¢rm the £uorescence reso-lution, we did not con¢rm the number of excited moleculesfor the speci¢c light spots. As can be seen in Fig. 5a, ¢ve lightspots are present in the image. Line pro¢le analyses yieldedoptical resolutions of 13 and 21 nm for the X-axis and Y-axisdirections, respectively, as shown in Fig. 5b. The values aresimilar to those determined from Fig. 4c, d or g), however theerror ranges are within 10%. The signal intensity of the lightspots corresponds to about 430 mV (1 V = 125 C/10 ms),which is similar to the intensity of spot ‘A’ in Fig. 4f. Lightspots ‘B’ and ‘C’ show a signal intensity of approximately 720mV. If we assume an optical e⁄ciency di¡erence of 10% forsingle A532 molecules (see the manufacturer’s document forA532 dye) for their entire lifetime, light spots ‘B’ and ‘C’consisted of more than double the number of excited mole-
Fig. 4. Enlarged near-¢eld £uorescence images for YOYO-1 (a,c,g) and A532 dye (b,d). e,f : Images derived for 10 Wm2 (a,b) and 2.5 Wm2 (c,d)scan areas, respectively. g: The enlarged area denoted by a dashed circle in c. Scale bars correspond to 1 Wm (a,b,e) and 100 nm (c,d,f,g).
FEBS 27880 8-12-03 Cyaan Magenta Geel Zwart
J. Kim et al./FEBS Letters 555 (2003) 611^615614
cules compared to light spot ‘A’. However, the number ofexcited molecules does not necessarily relate to the numberof abasic sites since the number of conjugated A532 moleculescan vary with each streptavidin. And therefore, at least morethan three damage sites are located in the A532 light spotsnoted ‘A’ through ‘C’. More thorough inspections are re-quired in order to determine the exact number of abasic sitesor excited dye molecules.
Recently, Sun et al. reported an AFM method for detectingabasic sites [23]. They detected two abasic sites on a 250 bpDNA template. In contrast, the SNOM method can be ap-plied to relatively long DNA molecules, and requires onlystandard laboratory preparation techniques. Although wecould not obtain a simultaneous topographic image by therough surface, the topographic image can be replaced by usingYOYO-1 £uorescence imaging.
In conclusion, we have investigated DNA abasic sites by the
£uorescence labeling technique combined with the high-reso-lution near-¢eld optical technique. To our knowledge, this isthe ¢rst report dealing with the investigation of abasic DNAsites at sub-micron scale using optical techniques. We believethat high-resolution near-¢eld imaging on middle- to short-length DNA samples can be helpful in the areas of DNAdiagnosis and genetic studies.
Acknowledgements: The authors are grateful for the ¢nancial assis-tance provided by a Grant-In-Aid for the Center of Excellence(COE) Research, Japan.
References
[1] Dunn, R.C. (1999) Chem. Rev. 99, 2891^2927.[2] Muramatsu, H., Chiba, N., Ataka, T., Monobe, H. and Fujihira,
M. (1995) Ultramicroscopy 57, 141^146.[3] Lhomme, J., Constant, J.F. and Demeunynck, M. (1999) Bio-
polymer 52, 65^83.[4] Beger, R.D. and Bolton, P.H. (1998) J. Biol. Chem. 273, 15565^
15573.[5] Friedberg, E.C., Walkers, G.C. and Siede, W. (1995) DNA Re-
pair and Mutagenesis. ASM Press, Washington DC.[6] Kubo, K., Ide, H., Wallace, S.S. and Kow, Y.W. (1992) Bio-
chemistry 31, 3703^3708.[7] Meng, X., Benson, K., Chada, K., Hu¡, E.J. and Schwartz, D.C.
(1995) Nat. Genet. 9, 432^438.[8] Rossi, O., Carrozzino, F., Cappelli, E., Carli, F. and Frosina, G.
(2000) Int. J. Cancer 85, 21^26.[9] Michalet, X., Ekong, R., Fougerousse, F., Rousseaux, S., Schur-
ra, C., Hornigold, N., van Slegtenhorst, M., Wolfe, J., Povey,S., Beckmann, J.S. and Bensimon, A. (1997) Science 277, 1518^1523.
[11] Hirose, T., Ohtani, T., Muramatsu, H. and Tanaka, A. (2002)Photochem. Photobiol. 76, 123^126.
[12] Winkler, R., Perner, B., Rapp, A., Durm, M., Cremer, C., Greu-lich, K.-O. and Hausemann, M. (2003) J. Microsc. 209, 23^33.
[13] Yokota, H., Sunwoo, J., Sarikaya, M., Engh, G-v-d. and Aeber-sold, R. (1999) Anal. Chem. 71, 4418^4422.
[14] Lyubchenko, Y.L., Jacobs, B.L. and Lindsay, S.M. (1993) Proc.Natl. Sci. USA USA 90, 2137^2140.
[15] Kim, J.M., Ohtani, T., Sugiyama, S., Hirose, T. and Muramatsu,H. (2001) Anal. Chem. 73, 5984^5991.
[16] Muramatsu, H., Chiba, N. and Fujihira, M. (1997) Appl. Phys.Lett. 71, 2061^2063.
[17] Hosaka, N. and Saiki, T. (2001) J. Microsc. 202, 362^364.[18] Bennink, M.L., Scha«rer, O.D., Lanaar, R., Sakata-Sogawa, K.,
Schins, J.M., Johannes, S.K., de Grooth, B.G. and Greve, J.(1999) Cytometry 36, 200^208.
[19] Nakao, H., Hayashi, H., Yoshino, T., Sugiyama, S., Otobe, K.and Ohtani, T. (2002) Nano Lett. 2, 475^479.
[20] Muramatsu, H., Homma, K., Yamamoto, N., Wang, J., Sakata-Sogawa, K. and Shimamoto, N. (2000) Mater. Sci. Eng. C 12,29^32.
[21] Weiss, S. (1999) Science 283, 1676^1683.[22] Dickson, R.M., Cubitt, A.B., Tsien, R.Y. and Moerner, W.E.
(1997) Nature 388, 355^358.[23] Sun, H.B. and Yokota, H. (2001) Anal. Chem. 73, 2229^2232.
Fig. 5. a: Con¢rmation of near-¢eld £uorescence resolution forA532 dye molecules. Scale bar corresponds to 100 nm. ‘A’ and ‘B’indicate the line pro¢le analysis directions shown in b.