Near Infrared Atmospheric Absorption Over a 25-knm Horizontal Path at Sea Level John L. Streete, J. H. Taylor, and S. L. Ball Atmospheric absorption spectra obtained over a 25-km, horizontal, sea level path in the Cape Kennedy- area are presented. Six 150-cm diam carbon arc searchlights positioned from 11 m to 17 m above the ground were used as sources of continuous radiation. Solar spectra obtained from sea level are traced above the corresponding horizontal path spectra for comparison. The spectral region covered is 0.68 A& to 4.86 ju and the spectral resolution varies over this region from about 0.6 X 10⁻⁴ L to 60 X 14 A. The amount of water vapor in the path varied from 9 to 39 precipitable cm. Introduction The Laboratory of Atmospheric and Optical Physics (LAOP) at Southwestern at Memphis has developed a system for measuring and monitoring atmospheric transmission over a 25-km horizontal path for the Elec- tro-Optics Group, Pan American World Airways, Inc., located at Patrick Air Force Base, Florida. The in- stallation of this system was completed in January 1966. Atmospheric transmission measurements are made with a prism spectrometer over the spectral region from 0.68 A to 15 p. In addition, three radiometers, using wide bandpass filters, continuously monitor the transmission in the ir windows I-VIII and in two regions in the visible. It is felt that the transmission data obtained with the spectrometer will be useful in extending the work of Taylor and Yates', since the path is longer by a factor of about 1..5, and the resolution is greater because the present system is double pass, while the Taylor and Yates spectrometers were single-pass instruments. In addition to the horizontal path measurements, slant path measurements may be obtained using the sun as a source. A coelostat system is used for directing the sun's radiation onto the primary mirror of the opti- cal system used to feed the spectrometer. Since few high-to-medium resolution spectra over long horizontal paths at sea level exist in this spectral region, the authors obtained permission from the Electro-Optics Group to replace the prism instrument with a grating spectrometer for a long enough period of J. H. Taylor and J. L. Streete are with the Laboratory of Atmospheric and Optical Physics, Southwestern at Memphis, Memphis, Tennessee; S. L. Ball is with the Electro-Optics Group, Pan American World Airways, Inc., Patrick Air Force Base, Florida. Received 12 August 1966. time to record spectra over a wavelength region ex- tending from about 0.68 /L to 4.8 . It is the purpose of this paper to present these spectra with solar spectra shown for comparison. Absolute transmission spectra. obtained with the prism spectrometer will be presented at a later time. Experimental Instrumentation and Procedure The grating spectrometer used in making these measurements was a Perkin-Elmer Model 112-G spectrometer, obtained under a contract with the Air Force Cambridge Research Laboratories. This is a, double-pass instrument equipped with a KBr fore- prism unit for spectral isolation. An uncooled PbS detector was used out to about 2.5 AL, and a thermo- couple was used from 2.5 ui to 4.8 p. Both detectors. were used with the appropriate Perkin-Elmer pre- amplifier and a Perkin-Elmer Model 107 amplifier. The recorder used was a Leeds and Northrup Type G. The radiation was chopped inside the grating mono, chromator at 13 c/s. The spectra were obtained using three Bausch & Lomb gratings: a 600 lines/mm grating blazed for 1.2 A, a 300 lines/mm grating blazed for 3 IL, and a 150 lines/mm grating blazed for 6 IL. The size of the ruled area of each grating was 64 mm by 64 mm. The optical system feeding the spectrometer consisted of a 45.7-cm diam parabolic mirror (f/6) and two plane pick-off mirrors. The system used was a modified off-axis Newtonian system, folded twice, which focused the images of the sources on the slit of the foreprism monochromator. A photograph of the system is shown in Fig. 1. The image overfilled the slit hori- zontally owing to the positioning of the searchlights. However, the slit was not filled vertically. The spectrometer and optical system were housed inside a modified Nike-Aj ax work van that was located March 1967 / Vol. 6, No. 3 / APPLIED OPTICS 489
Transcript
Near Infrared Atmospheric Absorption Over a25-knm Horizontal Path at Sea Level
John L. Streete, J. H. Taylor, and S. L. Ball
Atmospheric absorption spectra obtained over a 25-km, horizontal, sea level path in the Cape Kennedy-area are presented. Six 150-cm diam carbon arc searchlights positioned from 11 m to 17 m above theground were used as sources of continuous radiation. Solar spectra obtained from sea level are tracedabove the corresponding horizontal path spectra for comparison. The spectral region covered is 0.68 A&
to 4.86 ju and the spectral resolution varies over this region from about 0.6 X 10⁻⁴ L to 60 X 14 A.
The amount of water vapor in the path varied from 9 to 39 precipitable cm.
IntroductionThe Laboratory of Atmospheric and Optical Physics
(LAOP) at Southwestern at Memphis has developed asystem for measuring and monitoring atmospherictransmission over a 25-km horizontal path for the Elec-tro-Optics Group, Pan American World Airways, Inc.,located at Patrick Air Force Base, Florida. The in-stallation of this system was completed in January 1966.Atmospheric transmission measurements are made witha prism spectrometer over the spectral region from 0.68A to 15 p. In addition, three radiometers, using widebandpass filters, continuously monitor the transmissionin the ir windows I-VIII and in two regions in thevisible.
It is felt that the transmission data obtained withthe spectrometer will be useful in extending the work ofTaylor and Yates', since the path is longer by a factor ofabout 1..5, and the resolution is greater because thepresent system is double pass, while the Taylor andYates spectrometers were single-pass instruments.
In addition to the horizontal path measurements,slant path measurements may be obtained using the sunas a source. A coelostat system is used for directingthe sun's radiation onto the primary mirror of the opti-cal system used to feed the spectrometer.
Since few high-to-medium resolution spectra overlong horizontal paths at sea level exist in this spectralregion, the authors obtained permission from theElectro-Optics Group to replace the prism instrumentwith a grating spectrometer for a long enough period of
J. H. Taylor and J. L. Streete are with the Laboratory ofAtmospheric and Optical Physics, Southwestern at Memphis,Memphis, Tennessee; S. L. Ball is with the Electro-OpticsGroup, Pan American World Airways, Inc., Patrick Air ForceBase, Florida.
Received 12 August 1966.
time to record spectra over a wavelength region ex-tending from about 0.68 /L to 4.8 . It is the purposeof this paper to present these spectra with solar spectrashown for comparison. Absolute transmission spectra.obtained with the prism spectrometer will be presentedat a later time.
Experimental Instrumentation and ProcedureThe grating spectrometer used in making these
measurements was a Perkin-Elmer Model 112-Gspectrometer, obtained under a contract with the AirForce Cambridge Research Laboratories. This is a,double-pass instrument equipped with a KBr fore-prism unit for spectral isolation. An uncooled PbSdetector was used out to about 2.5 AL, and a thermo-couple was used from 2.5 ui to 4.8 p. Both detectors.were used with the appropriate Perkin-Elmer pre-amplifier and a Perkin-Elmer Model 107 amplifier.The recorder used was a Leeds and Northrup Type G.The radiation was chopped inside the grating mono,chromator at 13 c/s. The spectra were obtained usingthree Bausch & Lomb gratings: a 600 lines/mm gratingblazed for 1.2 A, a 300 lines/mm grating blazed for 3 IL,and a 150 lines/mm grating blazed for 6 IL. The sizeof the ruled area of each grating was 64 mm by 64mm.
The optical system feeding the spectrometer consistedof a 45.7-cm diam parabolic mirror (f/6) and two planepick-off mirrors. The system used was a modifiedoff-axis Newtonian system, folded twice, which focusedthe images of the sources on the slit of the foreprismmonochromator. A photograph of the system isshown in Fig. 1. The image overfilled the slit hori-zontally owing to the positioning of the searchlights.However, the slit was not filled vertically.
The spectrometer and optical system were housedinside a modified Nike-Aj ax work van that was located
March 1967 / Vol. 6, No. 3 / APPLIED OPTICS 489
Fig. 1. Photograph of the grating spectrometer and opticalsystem. Some of the monitoring equipment used in the atmos-
pheric transmission program is also shown.
on the roof of the Technical Laboratory at Patrick AirForce Base. The height of the optical axis was 20.3 mabove mean sea level.
The light source consisted of seven antiaircraftcarbon arc searchlights, each 150 cm in diam, fromwhich the glass windshield had been removed. Theselights were located in a missile gantry at Cape Kennedy.The searchlights in the gantry were located at differentdistances above the ground. The following arrange-ment was used: (a) two lights at 10.7 m above meanseal level, (b) two lights at 13.7 m above mean sealevel, and (c) three lights at 16.8 m above mean sealevel.
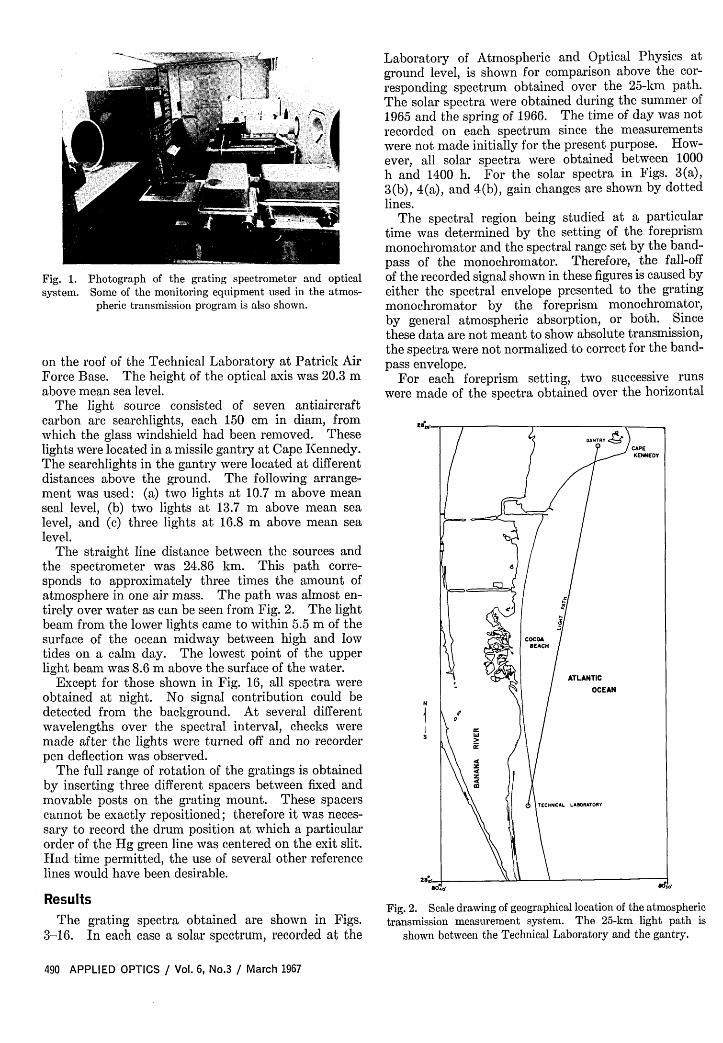
The straight line distance between the sources andthe spectrometer was 24.86 km. This path corre-sponds to approximately three times the amount ofatmosphere in one air mass. The path was almost en-tirely over water as can be seen from Fig. 2. The lightbeam from the lower lights came to within 5.5 m of thesurface of the ocean midway between high and lowtides on a calm day. The lowest point of the upperlight beam was 8.6 m above the surface of the water.
Except for those shown in Fig. 16, all spectra wereobtained at night. No signal contribution could bedetected from the background. At several differentwavelengths over the spectral interval, checks weremade after the lights were turned off and no recorderpen deflection was observed.
The full range of rotation of the gratings is obtainedby inserting three different spacers between fixed andmovable posts on the grating mount. These spacerscannot be exactly repositioned; therefore it was neces-sary to record the drum position at which a particularorder of the Hg green line was centered on the exit slit.Had time permitted, the use of several other referencelines would have been desirable.
Results
The grating spectra obtained are shown in Figs.3-16. In each case a solar spectrum, recorded at the
Laboratory of Atmospheric and Optical Physics atground level, is shown for comparison above the cor-responding spectrum obtained over the 25-kcm path.The solar spectra were obtained during the summer of1965 and the spring of 1966. The time of day was notrecorded on each spectrum since the measurementswere not made initially for the present purpose. How-ever, all solar spectra were obtained between 1000h and 1400 h. For the solar spectra in Figs. 3(a),3(b), 4(a), and 4(b), gain changes are shown by dottedlines.
The spectral region being studied at a particulartime was determined by the setting of the foreprismmonochromator and the spectral range set by the band-pass of the monochromator. Therefore, the fall-offof the recorded signal shown in these figures is caused byeither the spectral envelope presented to the gratingmonochromator by the foreprism monochromator,by general atmospheric absorption, or both. Sincethese data are not meant to show absolute transmission,the spectra were not normalized to correct for the band-pass envelope.
For each foreprism setting, two successive runswere made of the spectra obtained over the horizontal
Fig. 2. Scale drawing of geographical location of the atmospherictransmission measurement system. The 25-km light path is
shown between the Technical Laboratory and the gantry.
path in an attempt to average out atmospheric noise.This noise was considerable at times and is shown oncertain figures. The noise level corresponding to afigure for which it is not explicitly shown is aboutthe same as that of the last figure for which the signalnoise is given. Since the noise level was rather high formost runs, it was averaged during hand tracing bysuperimposing two corresponding recordings. How-ever, Figs. 6(a), 6(b), 7(a) and the second half of Fig.4(a) are direct tracings of the actual recordings and arepresented in order to give the reader an appreciationof the actual appearance of the spectra. In addition,for these particular recordings it was difficult to dif-ferentiate between signal and noise even by the super-position of two recordings. For the second part ofFig. 4(a) the zero is shown for the upper horizontal pathspectra tracing. The spectra recorded in the regionsbetween 0.730 /i to 0.743 , and 0.830 tt to 0.840 are not reproduced because there was no structure ob-served. However, there is some water vapor absorp-tion in these two regions, as can be noted in Ref. 2.This reference also shows some water vapor absorptionin the region around 0.786 . These spectra were ob-tained with higher resolution but over a shorter hori-zontal path than presented here.
In Fig. 6(b) there were no solar spectra obtainedfrom about 1.010 p to 1.030 . Maximum systemgain was required to record the spectra in Fig. 16,although the day was unusually dry for the time ofyear. An attempt was made to obtain spectra in the10-A region on the same day but there was not enoughsignal available.
The zero levels for the bottom spectra are traced
directly from the actual spectra, while horizontal tickmarks on the left and right hand sides of each figure givethe zero level for the upper curves. An idea of the elec-tronic noise can be obtained from the zero tracings forthe horizontal path spectra.
The grating spectrometer was wavelength-calibratedby using both emission and absorption lines. Severalreferences were used in calibrating the instrument.3 65Since only the Hg green line was used for a referenceline, the placement of the final wavelength scale wasdetermined by reference to published atmosphericabsorption spectra.2.6 -9 The accuracy of the wave-length scale below the spectra varies from about ±42 X10-4 p for some of the spectra obtained with the 600lines/mm grating to about *2 X 10⁻³ p for some takenwith the 300 lines/mm grating. On any of the formerspectra wavelengths obtained by linear interpolationbetween wavelength markers should be accurate to atleast *41 X 10-3 , while wavelength accuracy for thelatter spectra should be at least 2 X 10⁻³ 1.. Inmany instances the accuracy will be much better thanthis. However, it was not the purpose of this paperto present spectra from which wavelengths of the var-ious absorption lines of the atmospheric constituentscould be measured extremely accurately. The mainpurpose of this paper was to present telluric spectrataken over a long horizontal path under relativelynormal conditions, conditions under which it might bedesired, for example, to transmit a laser beam.
An absorption structure is in many cases due tothe blending of several lines; sometimes all lines arefrom the same absorber and sometimes there are severalspecies of absorber contributing to the structure. Thepresent spectra were obtained under conditions of ex-tremely high water vapor concentrations, whereasmost of the published high resolution solar spectra inthis region have been obtained from high altitudes withmuch less water vapor in the path. Thus, in comparingthese spectra with Refs. 2, 6-9 it was found that theshape of the structure was sometimes not what wasinferred from observing high resolution solar spectra.
No attempt was made to determine absolute atmo-spheric transmission from these spectra or to normalizethe spectra. However, all spectra were recorded using
Table I. Conditions Under Which Spectra Were Obtained
Approx-imate
spectral Precip-slit Relative itable Num-
Spectral width Tempera- humid- water Ampli- ber of GratingFigure region (.c X ture ity vapor fier search- (lines/number (,.) Date Time 10-4) (OC)a (%)a (cm)a gain lights mm) Order
a These measurements were obtained in the vicinity of the searchlights.
gain 16, except in Fig. 14 for which the gain was 18.Table I lists the conditions under which the spectra
were recorded. Among these are listed approximatespectral slit widths, and the gain and number of lightsused so an approximate determination of the relativesignal reaching the detector can be obtained. Incalculating the spectral slit widths, the diffraction andaberration contributions were not considered. Hence,
the values listed represent lower limits. However,the slit widths were wide enough so these terms shouldbe relatively small. Also listed in Table I are relativehumidity, temperature, and precipitable centimeters ofwater vapor in the path. The values listed for pre-cipitable water vapor are likely to be somewhat lowsince the relative humidity and temperature wereobtained at a station located on land in the vicinity
Fig. 17. Prism spectra obtained over the 25-km path.
Table II. Spectral SlitWidths Used in Obtaining Prism Spectra
Wavelength Spectral slit width(A) (g)
1.0 0.00231.6 0.00252.2 0.00403.7 0.00734.7 0.016
of the gantry, and the path was almost entirely overwater. Meteorological data were available from bothends of the path, and the precipitable water vaporcalculated from both sets of data agreed rather well.However, the data obtained from the source end of thepath were usually the higher of the two precipitablewater vapor values; these data are listed in Table I.
Prism spectra obtained over the 25 km path arepresented in Fig. 17. The spectral region covered inthis figure is the same as that covered by Figs. 3-16;
the ir windows I-VII are quite obvious. These spectraare presented here so the reader may have quick ref-erence to spectra of resolution comparable to that withwhich he is probably more familiar. The spectralslit widths for selected wavelengths are presented inTable II. The amount of precipitable water vaporin the path was approximately 17.8 cm. Three search-lights were used in obtaining the prism spectra. Thegain setting of the Perkin-Elmer Model 107 amplifierwas 18.
An experimental program of this size quite naturallyinvolves a number of people. The authors are indebtedto D. C. Marquis, Pan American World Airways, Inc.,Patrick Air Force Base, Florida, for making available thefacilities necessary to obtain the grating spectra. Also,we would like to acknowledge the work of two studentsat Southwestern, J. M. Durham and J. M. McKnight,who participated in the National Science FoundationUndergraduate Research Participation Program, inrecording most of the solar spectra presented herein.Without the approval and encouragement of J. L.Streete's doctoral committee chairman, Stanley S.Ballard, and the consent of the University of FloridaGraduate School, it is unlikely that this program wouldhave been attempted. The authors are indebted to themany people and groups required to install properlythe equipment and to operate the searchlights.
References1. J. H. Taylor and H. W. Yates, J. Opt. Soc. Am. 47, 223
(1957).2. J. A. Curcio, L. F. Drummeter, and G. L. Knestrick, Appl.
Opt. 3,1401 (1964).3. E. K. Plyler, Alfred Danti, L. R. Blaine, and E. D. Tidwell,
J. Res. Natl. Bur. Std. 64A, 29 (1960).4. E. K. Plyler, N. M. Gailar, T. A. Wiggins, J. Res. Natl. Bur.
Std. 48, 221 (1952).5. S. Mizushima and colleagues, Tokyo University, Hongo,
Tokyo, Japan. A report on the Perkin-Elmer gratingspectrophotometer model 112-G. English translation byPerkin-Elmer Corp., Norwalk, Conn.
6. L. Delbouille and G. Roland, Final Report Contract AF61(514)-962.
7. M. Migeotte, L. Neven, and J. Sevensson, Final Report Con-tract AF61(514)-432 Part I (1956); Part II (1957).
8. 0. C. Mohler, A. K. Pierce, R. R. McMath, and L. Goldberg,Photometric Atlas of the Near Infra-Red Solar SpectrumX 8465 to X 25,242 (University of Michigan Press, Ann Arbor,1950).
9. J. H. Shaw, R. M. Chapman, J. N. Howard, and M. L. Ox-holm, Astrophys. J., 113,268 (1951).