Page 1
Near-Surface Temperature Lapse Rates over Arctic Glaciers and Their Implicationsfor Temperature Downscaling
ALEX S. GARDNER,* MARTIN J. SHARP,* ROY M. KOERNER,1,# CLAUDE LABINE,*,@
SARAH BOON,*,& SHAWN J. MARSHALL,** DAVID O. BURGESS,*,11 AND DAVID LEWIS*
* Department of Earth and Atmospheric Sciences, University of Alberta, Edmonton, Alberta, Canada1 Geological Survey of Canada, Ottawa, Ontario, Canada
@ Campbell Scientific (Canada) Limited, Edmonton, Alberta, Canada& Department of Geography, University of Lethbridge, Lethbridge, Alberta, Canada
** Department of Geography, University of Calgary, Calgary, Alberta, Canada11 Canada Centre for Remote Sensing, Natural Resources Canada, Ottawa, Ontario, Canada
(Manuscript received 18 September 2008, in final form 26 January 2009)
ABSTRACT
Distributed glacier surface melt models are often forced using air temperature fields that are either
downscaled from climate models or reanalysis, or extrapolated from station measurements. Typically, the
downscaling and/or extrapolation are performed using a constant temperature lapse rate, which is often taken
to be the free-air moist adiabatic lapse rate (MALR: 68–78C km21). To explore the validity of this approach,
the authors examined altitudinal gradients in daily mean air temperature along six transects across four
glaciers in the Canadian high Arctic. The dataset includes over 58 000 daily averaged temperature measure-
ments from 69 sensors covering the period 1988–2007. Temperature lapse rates near glacier surfaces vary on
both daily and seasonal time scales, are consistently lower than the MALR (ablation season mean: 4.98C km21),
and exhibit strong regional covariance. A significant fraction of the daily variability in lapse rates is associated
with changes in free-atmospheric temperatures (higher temperatures 5 lower lapse rates). The temperature
fields generated by downscaling point location summit elevation temperatures to the glacier surface using
temporally variable lapse rates are a substantial improvement over those generated using the static MALR.
These findings suggest that lower near-surface temperature lapse rates can be expected under a warming climate
and that the air temperature near the glacier surface is less sensitive to changes in the temperature of the free
atmosphere than is generally assumed.
1. Introduction
Mass loss from glaciers and ice caps is likely the second
largest contribution to global sea level rise after ocean
thermal expansion (Meier et al. 2007). Quantifying past
contributions from this source is challenging because of
the limited availability of measurements of glacier sur-
face mass balance and rates of iceberg calving. Glacier
surface mass balance models are widely used to com-
pensate for this lack of measurements and can be used to
predict how climate change will influence future glacier
contributions to global eustatic sea level (Gregory and
Oerlemans 1998; Braithwaite and Raper 2002; Marshall
et al. 2005; Bougamont et al. 2005; Hanna et al. 2005).
Mass balance models calculate snow and ice melt using
two main approaches: the energy balance approach and
the temperature-index or ‘‘degree day’’ approach. The
latter approach assumes an empirical relationship be-
tween melting and near-surface air temperature, while the
former involves the assessment of all the major energy
fluxes to and from the glacier surface in order to deter-
mine the energy available for melt. In either case, spatially
distributed modeling is required to capture spatial and
temporal patterns of surface melt (Glover 1999; Arnold
et al. 2006). Such modeling requires accurate downscaling
of coarse-resolution temperature fields derived from
climate models or reanalysis to produce near-surface air
# Deceased.
Corresponding author address: Alex Gardner, Department of
Earth and Atmospheric Sciences, 1-16B Earth Sciences Building,
University of Alberta, Edmonton, AB T6G 2E3, Canada.
E-mail: [email protected]
15 AUGUST 2009 G A R D N E R E T A L . 4281
DOI: 10.1175/2009JCLI2845.1
� 2009 American Meteorological Society
Page 2
temperature fields with an appropriate spatial resolu-
tion. Downscaling can be performed either by running a
regional climate model (forced at its boundaries with
coarse-resolution climate model output or data from
climate reanalysis) at the desired resolution or by com-
puting near-surface temperatures from climate model
fields using a digital elevation model of the glacier sur-
face and an assumed temperature lapse rate.
‘‘Lapse rate’’ is defined as ‘‘the decrease of an atmo-
spheric variable with height, the variable being tem-
perature, unless otherwise specified’’ (Glickman 2000),
and it often refers to the environmental lapse rate in a
vertical profile of the atmosphere. Here we use lapse
rate to refer to the decrease in near-surface temperature
with elevation following the glacier surface. We define
lapse rates to be positive when temperature decreases as
elevation increases in order to be consistent with usage
in the atmospheric science community. However, we
note that most previously published glacier near-surface
lapse rates have been given the reverse sign convention
(positive lapse rate 5 increase in temperature with in-
creasing elevation; Braun and Hock 2004; Hanna et al.
2005; Otto-Bliesner et al. 2006b; Marshall et al. 2007;
Gardner and Sharp 2009). This difference in sign con-
vention should be noted when comparing our results
with those presented in these other studies.
Regional climate modeling at high spatial resolution
requires extensive computational resources, so this ap-
proach is best suited for downscaling temperature fields
spanning short time periods to either relatively small ice
masses or larger ice masses with low spatial gradients in
melt rates. For large and complex regions like the Ca-
nadian high Arctic, running a regional climate model for
multiple years at a resolution desirable for modeling
glacier melt (;1 km) is computationally challenging, so
statistical temperature downscaling remains an attrac-
tive proposition. The lapse rate used to downscale near-
surface temperatures is often taken to be the moist
adiabatic lapse rate (MALR 5 68–78C km21; Glover
1999; Flowers and Clarke 2002; Thomas et al. 2003;
Arnold et al. 2006; Bassford et al. 2006a,b; de Woul et al.
2006; Otto-Bliesner et al. 2006a; Raper and Braithwaite
2006). However, temperature lapse rates measured
close to glacier surfaces can differ substantially from the
MALR (Greuell and Bohm 1998; Braun and Hock 2004;
Hanna et al. 2005; Marshall et al. 2007). Neglecting to
account for these differences may result in large errors
in downscaled temperature fields and in the magnitude
and spatial distribution of modeled glacier melt (Greuell
and Bohm 1998; Otto-Bliesner et al. 2006b; Gardner and
Sharp 2009).
Near-surface temperature lapse rates vary on diurnal
and seasonal time scales because of changes in the sen-
sible heat flux between the free atmosphere and the
underlying surface. This flux is influenced by temporal
and spatial changes in free-atmosphere and surface
temperatures, surface roughness, and wind speed. Be-
cause near-surface air temperatures are intermediate
between those of the free atmosphere and the surface
and surface temperatures over a melting glacier are
fixed at the melting point temperature, near-surface
lapse rates over melting glaciers are often lower than
lapse rates in the free atmosphere (Greuell and Bohm
1998). Marshall et al. (2007) found that measured near-
surface lapse rates over a Canadian Arctic ice field were
systematically lower than free-air lapse rates, and that
daily changes in lapse rates were associated with changes
in synoptic weather patterns. In the summer, lapse rates
were closer to the free-air MALR when there was en-
hanced cyclonic activity, but were considerably lower
than the MALR (,28C km21) when anticyclonic circu-
lation prevailed.
Here we discuss measurements of surface air tem-
peratures and lapse rates made on four large ice masses
in the Canadian high Arctic at various intervals during
the period 1988–2007. The Canadian high Arctic con-
tains the largest volume of land ice in the world outside
Greenland and Antarctica and is a potentially significant
contributor to global sea level change. Mass balance
measurements have been made at five sites in the region
for over 40 yr (Cogley et al. 1996; Koerner 2005), but
little is known about the magnitude, trends, and inter-
annual variability of glacier mass balance across much of
the region. Distributed, regional-scale mass balance
modeling is required to better estimate both past and
future contributions of glacier melt in this region to
global sea level change. The goals of this study are
therefore (i) to determine whether the relationships
identified by Marshall et al. (2007) apply throughout the
region, (ii) to develop and validate an empirical method
to model temporally variable lapse rates that can be
used to downscale temperature fields derived from cli-
mate models or reanalysis to the complex surface
topography of these ice masses, and (iii) to compare
the results from this method with those generated by
downscaling using the MALR.
Our analysis is based on six datasets from the Prince of
Wales Ice Field, the Agassiz Ice Cap, the John Evans
Glacier on Ellesmere Island, and the Devon Island Ice Cap
(Fig. 1). These datasets contain over 58 000 measure-
ments of daily mean temperature from 69 sensors cover-
ing the period June 1988 to May 2007. Near-surface lapse
rates were calculated from these datasets and compared
with estimates of daily mean lower-troposphere temper-
atures derived from the National Centers for Environ-
mental Prediction’s North American Regional Reanalysis
4282 J O U R N A L O F C L I M A T E VOLUME 22
Page 3
(NARR; Mesinger et al. 2006). We present an empirical
approach to downscaling the NARR temperatures that
involves the prediction of near-surface lapse rates over
glaciers from NARR 750-mbar mean daily air tempera-
ture standardized anomalies, where anomalies are taken
relative to the 1979–2006 summer mean temperature and
have been standardized by dividing the anomalies by their
respective standard deviation. NARR bias-corrected
summit elevation air temperatures were then downscaled
using the modeled near-surface lapse rate for each day.
2. Site details
a. Agassiz Ice Cap
The 21 000 km2 Agassiz Ice Cap, located on the east-
ern side of Ellesmere Island (Fig. 1), is the second largest
ice cap in the Canadian high Arctic (Sharp et al. 2003). In
the spring of 1988, an automatic weather station (A_1)
was erected at the site where two surface-to-bedrock
boreholes were drilled by the Geological Survey of
Canada in 1984 and 1987 (Koerner and Fisher 1990;
Fisher et al. 1995). Two more stations were installed at
lower elevations along a northeast-oriented transect in
June 1991 (A_2) and April 1994 (A_3). All three stations
are equipped with Campbell Scientific (CS) 107F tem-
perature sensors. These stations are still in operation, are
maintained annually by CS Canada Ltd. and the Geo-
logical Survey of Canada, and comprise the Agassiz
transect, which extends 30 km horizontally and ranges in
elevation from 880 to 1740 m MSL.
b. Devon Island Ice Cap
The dome-shaped Devon Island Ice Cap (area
;14 000 km2) on the eastern side of Devon Island (Fig. 1)
is the southernmost glacier included in this study. Two of
the six temperature–elevation transects are located on
this ice cap. The longest running transect, Devon_N, is
located on the north slope of the ice cap and spans a
horizontal distance of .40 km and an elevation range
from 330 to 1880 m MSL. It consists of six automatic
weather stations installed between 1992 and 2005, four
of which are currently in operation and are maintained
by the Geological Survey of Canada (Koerner 2005). All
temperatures are measured with CS 107F sensors.
The second transect, Devon_S, is located on the south-
facing slope of the ice cap and consists of three CS 107F
FIG. 1. Map of Canadian high Arctic with the six temperature–elevation sensor transects shown
with heavy black lines.
15 AUGUST 2009 G A R D N E R E T A L . 4283
Page 4
sensors and 17 HOBO H8-PRO sensors manufactured by
Onset Scientific Ltd. Sensors were installed between 2004
and 2006 and were distributed at ;2 km intervals along a
50-km transect from the ice cap summit to its southern
margin. Most sensors on this transect, which spans an
elevation range from 480 to 1800 m MSL, are currently
operational and are maintained by the Arctic and Alpine
Research Group at the University of Alberta.
c. John Evans Glacier
John Evans Glacier, the only valley glacier included in
this study, is located on the east coast of Ellesmere Is-
land to the south of the Agassiz Ice Cap (Fig. 1). In June
1996, three HMP35CF relative humidity–temperature
sensors were installed on automatic weather stations
located at elevations of 260, 820, and 1180 m MSL
(Arendt and Sharp 1999; Boon et al. 2003). In May 2001,
16 HOBO H8-PRO temperature sensors were installed
at ;100-m vertical intervals along a 15-km transect
[John Evans Glacier (JEG) transect] following the
centerline of the glacier from its terminus (140 m) to
its summit (1470 m). The weather stations and the
16 HOBO sensors were removed in June 2003.
d. Prince of Wales Ice Field
The Prince of Wales Ice Field is located in eastern
Ellesmere Island, to the south of John Evans Glacier
(Fig. 1). Two temperature–elevation sensor transects
were operated on the ice field between 2001 and 2003
(Marshall et al. 2007). The 170-km Prince of Wales ice
Field (POW)_N transect, which crosses the northern
part of the ice field, was installed in spring 2001. It
consisted of one CS 107, one Veriteq Instruments Inc.
SP-2000, and 12 HOBO H8-PRO temperature sensors
located at elevations ranging from 130 to 1730 m MSL.
The 130-km southern transect, POW_S, which spanned
an elevation range from 550 to 1350 m MSL, was in-
stalled in spring 2002 and consisted of two SP-2000 and
four HOBO H8-PRO temperature sensors. All sensors
were removed in spring 2003. Marshall et al. (2007)
provide a more detailed description of the ice field and
the datasets derived from these transects.
3. Data and methods
a. Near-surface temperatures
All temperature sensors were installed in solar radiation
shields mounted on metal or plastic poles drilled into the
glacier surface. Sensors were mounted between 1 and
1.5 m above the surface and in open locations repre-
sentative of the surrounding area. Temperatures were
originally recorded as 15 min, 30 min, 1 h, 2 h, or daily
averages and were postprocessed to produce daily av-
erages. A list of all temperature sensors used in the
study, locations, and periods of operation can be found
in the appendix (Table A1) along with sensor specifi-
cations (Table A2).
Sensor measurement accuracies range between 61.08C
at low (,2308C) temperatures and 60.28C at 08C (Table
A2). Marshall et al. (2007) conducted an extensive study
to determine additional errors due to instrument cali-
bration (0.18–0.78C) and varying sensor height relative to
the glacier surface (60.18C for daily averages). They es-
timated the overall uncertainty in the daily average
temperature measurements to be 61.38C. This value is
also adopted for the measurement error in this study.
Gaps in sensor records exist (mostly during winter
months) where stations were removed for servicing,
because the battery or sensor failed, when sensors were
found less than 0.5 m (high accumulation) or more than
2.5 m (high ablation) above the surface, and where
sensor poles collapsed because of ablation or interfer-
ence from polar bears. Figure 2a shows the annual
number of daily averaged temperature measurements
made along each transect. All quality controlled daily
average temperature measurements for each transect
have been included as supplementary material for this
manuscript and can be found online at the University of
Alberta Arctic and Alpine Research Group’s Web site
(http://arctic.eas.ualberta.ca/).
b. Lapse rates
Using daily mean temperatures and assuming con-
stant sensor elevations, daily lapse rates were calculated
for each transect using simple linear regression. For the
Devon_S, JEG, POW_N, and POW_S transects, mea-
sured temperatures below 2308C were excluded from
lapse rate calculations because of increased instrument
errors at these temperatures. For the Agassiz and
Devon_N transects, where CS 107F temperature sensors
were used, all temperatures below 2508C were ex-
cluded. Lapse rates were only calculated when three or
more separate temperature measurements were avail-
able along a transect, and when the elevation difference
between the lowest and highest available stations
exceeded 500 m. These criteria reduce the impact of
temperature measurement errors on calculated lapse
rates, but also reduce the number of days for which lapse
rates can be calculated. For the six transects, between
44% and 91% of days with temperature measurements
yielded lapse rates (Fig. 2b). There are fewer than
20 days of data for POW_S in January, February,
and March, so no values are reported for these months
and the POW_S transect is omitted from the discussion
of winter lapse rates.
4284 J O U R N A L O F C L I M A T E VOLUME 22
Page 5
c. Regional climate reanalysis
The NARR dataset (32 km and 45 layer) is available for
the period from 1979 to 2006 for the entire North Amer-
ican region. Data were provided by the National Oceanic
and Atmospheric Administration/Office of Oceanic and
Atmospheric Research/Earth System Research Labora-
tory (NOAA/OAR/ESRL) Physical Sciences Division
(PSD), Boulder, Colorado, from their Web site (http://
www.cdc.noaa.gov/).
The variables 500-mbar geopotential height (500Z)
and 750-mbar air temperature (750T) were selected to
characterize atmospheric conditions over the four Ca-
nadian high Arctic glaciers. Here 500Z was chosen to
describe synoptic-scale variability in the midtroposphere,
which has a strong influence on lower-troposphere tem-
peratures, regional glacier melt, and near-surface lapse
rates in the Canadian high Arctic (Alt 1987; Wang et al.
2005; Gardner and Sharp 2007; Marshall et al. 2007);
750T was selected to describe free-air temperatures at an
elevation of ;2200 m MSL, which is at least 500 m above
the NARR model topography in the regions of the four
glaciers examined in this study. The influence of changes
in free-atmospheric temperatures was investigated be-
cause these temperatures can affect near-surface lapse
rates directly by modifying the sensible heat flux to and
from the surface and indirectly by altering other surface
energy balance components (i.e., the amount of absorbed
solar radiation through melt-induced modification of
the surface albedo). The influence of atmospheric winds
was also investigated because winds can modify both
free-air and near-surface lapse rates through the hori-
zontal advection of air masses of different temperatures
and moisture contents, by forcing the ascent/descent of
advected air masses over terrain and by altering the
turbulent heat fluxes between the free atmosphere and
the surface. However, no consistent relationships were
found between wind components and lapse rates.
Daily average time series for the selected NARR
variables were created for each glacier by averaging
over a six-gridcell domain (96 km by 64 km) centered
over each glacier. All time series were generated for the
period January 1988 to December 2006, which extends
from the first year of on-glacier temperature data to the
last year of NARR data available from the NOAA/
OAR/ESRL Physical Sciences Division’s Web site.
To ensure that the NARR data accurately model
climatic variability over the region of interest, 750T
(averaged over the regions occupied by each glacier)
was correlated with individual temperature series from
on-glacier sensors located above 1000 m MSL on each
glacier. All near-surface measurements are highly pos-
itively correlated with the corresponding NARR 750T
(annual: r 5 0.84–0.98; summer: r 5 0.71–0.92). As with
other correlations presented in this paper, monthly
means were subtracted from the time series prior to
correlation.
d. Statistical analysis
Pearson product–moment correlation analysis
(Shumway and Stoffer 2006) was used to identify rela-
tionships between NARR meteorological variables,
lapse rates, and glacier surface temperatures. Before
correlation coefficients (r) were calculated, a centered
three-day moving average low-pass filter was applied to
all time series. This removed local noise that was present
at daily frequencies and improved comparisons between
time series from field sites that are separated by up to
700 km and may be affected by the same synoptic events
FIG. 2. Annual number of (a) daily averaged temperature measurements and (b) calculated
lapse rates (b) for each of the six near-surface glacier temperature–elevation transects.
15 AUGUST 2009 G A R D N E R E T A L . 4285
Page 6
but at different times. As with most subannual meteo-
rological time series, there are strong red noise (seasonal
cycle) components in the datasets that must be removed
before representative correlation coefficients can be
determined. This was accomplished by subtracting
monthly means from all time series before correlation
coefficients were calculated. The significance of the
correlation coefficients was determined using a two-
tailed Student’s t test with the null hypothesis that the
time series were uncorrelated (r 5 0). The low-pass filter
introduces lag-1 and lag-2 serial correlations into the
time series that might affect the assessment of the sta-
tistical significance of correlation coefficients, although
‘‘inferences about the correlation coefficient seem to be
relatively weakly affected by serial correlation’’ (von
Storch and Zwiers 1999, p. 149). To err on the side of
caution, we adopted a 99% confidence level (p , 0.01)
as the threshold for statistical significance.
4. Results
a. Near-surface temperatures
Mean annual temperatures averaged over all sensors
ranged from 218.98 to 215.58C for the Agassiz and JEG
transects, respectively. Average monthly transect tem-
peratures are lowest in February (from 2358 to 2298C)
and highest in July (from 218 to 128C). There are pro-
nounced seasonal cycles in the monthly mean standard
deviations of daily temperatures, with higher standard
deviations (3.58 to 7.18C) during the winter [December–
February (DJF)] and lower values (2.08–3.78C) during
the summer [June–August (JJA)]. The lower standard
deviations in summer are in part due to fixed tempera-
tures (08C) at the melting surface.
The relationship between elevation and seasonal
mean temperature is much stronger during the summer
(average r 5 20.94; Fig. 3b) than in the winter (average
r 5 20.68; Fig. 3a). This suggests that a constant regional
near-surface lapse rate is a better description of the
near-surface temperature field during the summer than
in the winter. There is also a significant correlation
(r 5 0.73) between elevation and the standard deviation
of the daily near-surface temperatures in summer (Fig.
3d) but not in winter (Fig. 3c). The atmospheric controls
governing this observed relationship will be discussed in
section 5.
b. Lapse rates
Daily near-surface lapse rates ranged between
211.98C km21 (recorded during a strong temperature
inversion over the JEG transect in March 2003) and
14.88C km21 (recorded over the Devon_S transect in
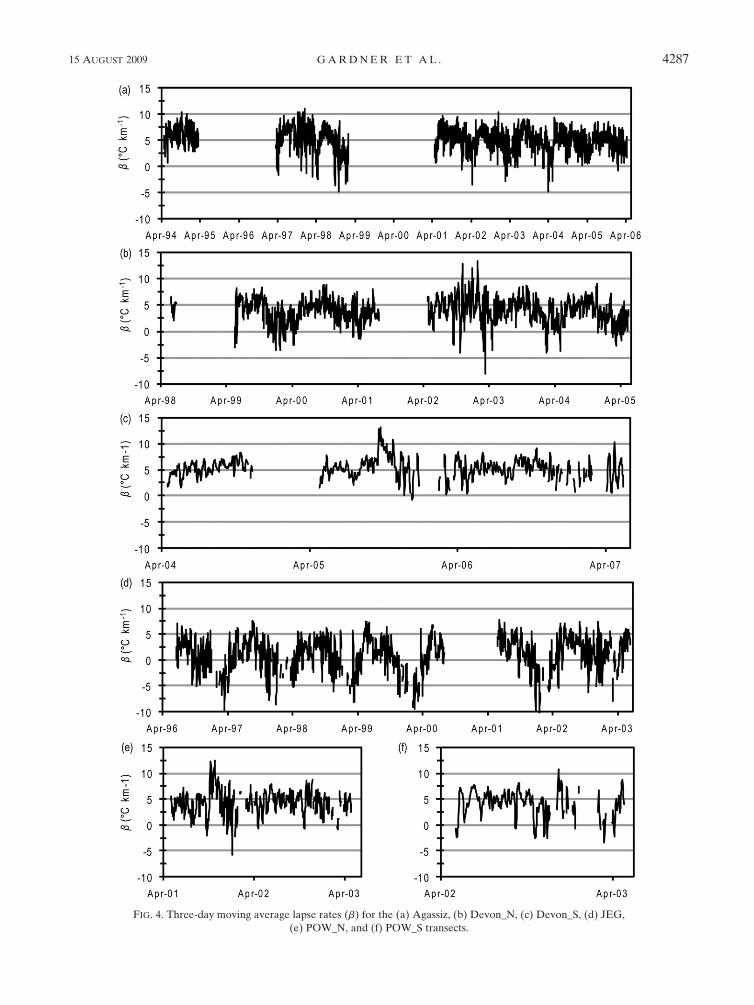
November 2002). Centered 3-day moving average lapse
rates for each of the six transects are presented in Fig. 4.
Lapse rates are generally lower during colder months
and higher during warmer months. Monthly mean
values (Fig. 5) are on average 1.88C km21 higher in sum-
mer than in winter. Monthly mean daily temperature–
elevation correlation coefficients are also larger in
summer (r 5 0.82–0.97) than in winter (r 5 0.63–0.85),
FIG. 3. Average (a) DFJ and (b) JJA near-surface temperatures and (c),(d) their standard
deviations with respect to sensor elevation. The relationship between temperature and elevation
is much weaker in winter (r 5 20.68) than in summer (r 5 20.94) and standard deviations are
significantly correlated with elevation in summer (r 5 0.73) only.
4286 J O U R N A L O F C L I M A T E VOLUME 22
Page 7
FIG. 4. Three-day moving average lapse rates (b) for the (a) Agassiz, (b) Devon_N, (c) Devon_S, (d) JEG,
(e) POW_N, and (f) POW_S transects.
15 AUGUST 2009 G A R D N E R E T A L . 4287
Page 8
suggesting that the assumption of a linear near-surface
lapse rate is most appropriate during the summer
months. Lower lapse rates are expected during winter
months because of a persistent lower-troposphere tem-
perature inversion that is observed throughout the
Arctic (Serreze and Barry 2005, 139–143). During polar
night, when there is little or no solar radiation, an at-
mospheric temperature inversion results from longwave
radiative equilibrium between the highly emissive
colder snow surface and the less emissive and warmer
lower troposphere. It is maintained by the northward
advection of warmer subarctic air (Overland and Guest
1991). The strength of the lower-troposphere tempera-
ture inversion is strongly influenced by the presence of
diamond dust (Overland and Guest 1991) and occur-
rence of cloud cover (Serreze et al. 1992). Near-surface
lapse rates over JEG are on average 2.28C km21 lower
than lapse rates over the other five transects in summer
and 4.48C km21 lower in winter (Fig. 5). The Agassiz
transect has the highest average summer (6.48C km21)
and winter (4.68C km21) lapse rates. This is likely due to
the Agassiz transect’s generally colder climate, which
results in less frequent summer melt and a less extensive
melting zone than is observed at the other three sites
(Wang et al. 2005). Less melt area leads to less area at
lower elevations with surface temperatures fixed at 08C,
resulting in slightly higher near-surface lapse rate.
Lower temperatures also result in higher MALRs be-
cause the MALR tends toward the dry air lapse rate as
temperatures cool. All other mean summer and winter
lapse rates lay within the ranges 4.98 6 0.48C km21 and
3.28 6 0.58C km21, respectively. These values are sys-
tematically lower than standard MALRs, which is con-
sistent with most previously published values for Arctic
glaciers and the Greenland Ice Sheet (Table 1).
Cross correlations between daily lapse rates along
the different glacier transects are stronger during sum-
mer months than in winter (Table 2). This suggests that
regional-scale processes account for a larger fraction
of the variance in lapse rates during summer than win-
ter. To illustrate the strength of this regional influence,
all available lapse rates for summer 2002 are plotted in
Fig. 6.
c. Relationship between near-surface lapse ratesand atmospheric conditions
Summer daily mean lapse rates measured over all six
temperature–elevation transects are significantly lower
FIG. 5. Monthly mean lapse rates (b) for all six transects.
TABLE 1. Previously reported Arctic glacier and ice sheet near-surface temperature lapse rates (b).
Location Study Months b (8C km21)
Devon Island Ice Cap, Nunavut, Canada Shepherd et al. (2007) Not given 4.6
Devon Island Ice Cap, Nunavut, Canada Mair et al. (2005) JJA 4.8
Greenland Ice Sheet Steffen and Box (2001) Annual 7.1
Greenland Ice Sheet Steffen and Box (2001) June 4.0
Greenland Ice Sheet Box and Rinke (2003) June, July 5.0
Greenland Ice Sheet (.1000 m MSL) Hanna et al. (2005) JJA 7.9
Greenland Ice Sheet (#1000 m MSL) Hanna et al. (2005) JJA 4.3
Nigardsbreen, Norway Johannesson et al. (1995)* Summer 5.8
Ny-Alesund, Spitsbergen Wright et al. (2005) Not given 4.0
Prince of Wales Ice Field, Nunavut, Canada Marshall et al. (2007) JJA 4.7
Qamanarssup, West Greenland Johannesson et al. (1995)* Summer 6.6
Storstrommen, Northeast Greenland Bøggild et al. (1994) June, August 4.0
Satujokull, Iceland Johannesson et al. (1995)* Summer 5.3
* Determined through model calibration (not measured).
4288 J O U R N A L O F C L I M A T E VOLUME 22
Page 9
than the free-air MALR when summit elevation tem-
peratures are anomalously high (Fig. 7). The relation-
ship between measured lapse rates and temperatures is
strongest when lapse rates are compared with temper-
ature measurements taken at higher elevations. In ad-
dition, when near-surface lapse rates are correlated with
NARR 500Z and 750T (averaged over each of the four
glaciers) the strongest relationships are between sum-
mer lapse rates and 750T (Fig. 8).
Variations in summer 750T over the Canadian high
Arctic are associated with synoptic-scale southerly
advection of warm North American continental air and
northerly advection of cold polar air masses that affect
temperatures on a regional scale (Alt 1987; Gardner and
Sharp 2007). Mean summer correlation coefficients with
summer 750T are negative and significant for all lapse
rate series and range between r 5 20.55 and 20.81.
These findings show that lower lapse rates are associated
with warmer air masses and higher rates with colder air
masses.
5. Influence of free-atmospheric temperatures onnear-surface temperatures and lapse rates
To explain what drives the relationship between free-
air temperatures and near-surface lapse rates we focus
on a vertical cross section of the atmospheric boundary
layer between the glacier surface and the free atmo-
sphere, and discuss the ‘‘climate sensitivity’’ of the near-
surface air temperature. This is defined here as the
change in near-surface temperature relative to a change
in the free-atmospheric temperature. During the sum-
mer, the glacier surface gains energy through a positive
net radiation flux and, to a lesser extent, through tur-
bulent heat transfer and rainfall. The snow and glacier
ice warm until the surface reaches the melting point,
after which further net inputs of energy produce melt
while the surface temperature remains fixed at 08C.
Because surface temperatures are fixed over a melting
glacier surface and free-atmosphere temperatures de-
crease with increasing elevation, the free atmosphere
becomes warmer relative to the surface as the surface
elevation decreases. This gradient drives a flux of sen-
sible heat from the atmosphere to the glacier surface
that modifies the temperature of the air within the
boundary layer. A larger sensible heat flux will result in
greater cooling of the boundary layer relative to the
temperature of the free atmosphere, so the climate
sensitivity of the near-surface air temperature over a
melting surface will be less than unity.
The upper portions of Arctic glaciers will often re-
main frozen while melt occurs at lower elevations.
Where the surface is frozen, the temperature of the snow/
ice surface can vary with changes in the free-air tem-
perature. Because of this, vertical temperature gradients
in the boundary layer over frozen surfaces are generally
not as large as those found over melting surfaces. Thus,
near-surface air temperatures over frozen surfaces have
larger climate sensitivities than temperatures over melt-
ing surfaces. Consistent with this argument, Denby et al.
TABLE 2. Summer (JJA) and winter (DJF) cross correlations between each of the lapse rate time series of the six sensor transects.
Significant (p # 0.01) correlations are shown in bold.
Winter Summer
Agassiz Devon_N Devon_S JEG POW_N Agassiz Devon_N Devon_S JEG POW_N
Devon_N 0.34 0.29
Devon_S 0.25 — 0.37 0.81JEG 0.35 0.40 — 0.45 0.25 —
POW_N 0.37 0.31 — 0.50 0.25 0.47 — 0.83
POW_S — — — — — 0.09 0.52 — 0.76 0.89
FIG. 6. All available 2002 summer lapse rates (b).
15 AUGUST 2009 G A R D N E R E T A L . 4289
Page 10
(2002) showed that the climate sensitivity of near-surface
air temperatures over the Greenland Ice Sheet was close
to unity in the dry snow zone (no melt) and that it de-
creased with elevation to a value of only 0.3 in the lower
ablation zone. This explains the observed increase in the
standard deviation of glacier near-surface temperatures
at higher surface elevations (Fig. 3d).
The sensible heat flux, and therefore the degree to
which the temperature of the atmospheric boundary
layer air is modified, is also influenced by the wind speed.
Observations (van den Broeke 1997) and modeling
studies (Denby et al. 2002) in Greenland show that
downslope glacier winds increase systematically with in-
creases in free-atmospheric temperatures during the ab-
lation season. This has the effect of increasing the
sensible heat flux at lower elevations when warm air is
advected into the region. However, the climate sensitivity
of the glacier wind is relatively low (0–0.2 m s21 8C21), so
changes in the near-surface temperature will be pri-
marily governed by changes in the sensible heat flux that
FIG. 7. Summer daily mean lapse rates (b) plotted against measured summit elevation
temperatures for the (a) Agassiz, (b) Devon_N, (c) Devon_S, (d) JEG, (e) POW_N, and
(f) POW_S temperature–elevation transects with heavy black lines showing the linear regres-
sion relationship between the two variables.
FIG. 8. Mean monthly correlation coefficients between lapse rates and 750T. Only those values significant at the
0.01 level are shown.
4290 J O U R N A L O F C L I M A T E VOLUME 22
Page 11
result from changes in free-air temperatures (Denby
et al. 2002). Glacier winds over the ice masses examined
in this study are not as well developed as those observed
over the Greenland Ice Sheet and will have less impact
on the sensible heat flux variability than was observed by
Denby et al. (2002). Summer mean daily wind speed and
direction measurements from three weather stations
located on JEG and three stations located on the Devon
Island Ice Cap show an increase in the frequency of
downslope (katabatic) winds at lower elevations, but
neither transect shows an increase in mean wind speed at
lower elevations or any consistent relationship between
wind speed and 750T.
The relationship between the climate sensitivity of
near-surface temperature and elevation means that, when
warm air is advected into the region, near-surface tem-
peratures over glaciers will not rise uniformly. Because of
larger near-surface air temperature sensitivities at higher
elevations, near-surface air temperature will increase
more at higher elevations than at lower elevations in re-
sponse to an increase in free-atmospheric temperature.
This has the effect of reducing the lapse rate, consistent
with the strong negative correlation between 750T and
lapse rates (Fig. 8). Ablation season dependence of sur-
face roughness on elevation (preference for snow at
higher elevations and ice at lower elevations) may also
play a role in modifying the glacier near-surface lapse rate
but is not investigated in this study.
6. Implications for the modeling of near-surfacetemperatures
During the melt season, the variability in measured
lapse rates is strongly related to the variability in 750T
(Fig. 8). This relationship was used to develop simple
empirical models to predict daily near-surface lapse
rates from standardized daily anomalies in 750T (sum-
mer means removed and divided through by respective
standard deviation). Using least squares regression
analysis, model coefficients were calculated for each of
the four glaciers (Table 3). Because the regression
models are based on standardized anomalies (mean 5 0),
all model y intercepts (b) are equal to respective glacier
mean summer lapse rates. Where more than one daily
lapse rate measurement was available for the same gla-
cier (i.e., Devon and POW), the lapse rate was taken to
be the mean of the two estimated values.
Nonablation season lapse rates are important for the
determination of end-of-winter snowpack temperatures.
However, the relationship between free-air tempera-
tures and lapse rates breaks down outside the ablation
season and there is no strong relationship between
nonablation season lapse rates and either winds or
geopotential height that can be used to model them.
Thus we chose not to attempt to downscale winter
temperatures. If winter temperatures are needed for a
mass balance modeling study, we suggest setting the
lapse rate for days outside the ablation season to the
mean nonablation season lapse rate (Table 3). A lapse
rate minimum threshold of 08C km21 should also be
applied to summer values to prevent unrealistically low
lapse rates during extreme warm periods. This threshold
does not impact the results presented here but might be
relevant if the lapse rate models developed here were
applied to years that are anomalously warm compared
to the years examined in this study.
a. Validation of temperature extrapolation methods
Prior to comparing long-term differences in surface
air temperature estimates made using modeled daily
lapse rates with those made using a constant MALR
(6.58C km21), the modeled daily lapse rate downscaling
method was validated over the Devon Island Ice Cap for
the summer of 2006. Coefficients for the Devon lapse
rate model were first calibrated by excluding 2006 data.
Daily lapse rates were then calculated for the 2006 melt
season using daily NARR 750T standardized anomalies.
Daily observed, modeled, and constant measured mean
summer (5.18C km21) lapse rates are plotted together
with the MALR (6.58C km21) in Fig. 9. There is rea-
sonably good consistency between the patterns of vari-
ability in the observed and modeled lapse rates (r 5 0.68)
and their means, which are not statistically different
when compared using a two-tailed Student’s t test with
the null hypothesis that the means are equal. Both lapse
rates are significantly lower than the MALR.
For the validation process, least squares linear re-
gression was used to reconstruct daily summit elevation
temperatures (1880 m) by extrapolating 2006 daily
temperature measurements made along the Devon_S
transect. This effectively minimizes the local error as-
sociated with single-station measurements and provides
a temporally continuous summit elevation temperature
that can be extrapolated to lower elevations using a
specified lapse rate.
TABLE 3. Best-fit linear regression slope (m), mean summer (b, y
intercept), and nonablation season (bw) lapse rates and r values for
modeling summer near-surface lapse rates with 750T standardized
anomalies.
Agassiz Devon JEG POW
m (8C km21) 20.83 20.84 21.31 21.39
b (8C km21) 6.4 4.9 3.1 4.6
bw (8C km21) 4.8 4.0 0.4 4.2
r 0.55 0.61 0.75 0.80
15 AUGUST 2009 G A R D N E R E T A L . 4291
Page 12
To assess the errors associated with lapse rate choice
when downscaling near-surface temperatures, measured
and modeled daily lapse rates, a constant lapse rate
equal to the 2006 summer mean (5.18C km21), and the
MALR were used to extrapolate reconstructed summit
temperatures to the elevation of each Devon_S transect
temperature sensor with a complete 2006 summer re-
cord. Taking the daily mean temperature measured at
each station as the true temperature, mean and standard
errors in daily mean temperatures were determined
for each of the four extrapolation methods (Fig. 10).
Averaged over all stations, temperatures extrapolated
using mean daily and summer measured lapse rates have
a mean error of zero as they have been derived directly
from the 2006 summer station data (Fig. 10a). Temper-
atures extrapolated using modeled lapse rates have a
small mean cold bias (20.38C) while those extrapolated
using the MALR have a strong warm bias (0.88C) that
decreases with increasing elevation. Compared with air
temperatures extrapolated using a constant lapse rate,
modeled daily lapse rates offer a slight improvement
in the standard error of the estimated temperatures
(Fig. 10b).
A similar error analysis for estimates of positive
degree-days (PDDs), a quantity that is strongly related to
glacier melt (Braithwaite 1981; Hock 2003), reveals that
only those extrapolation methods that employ variable
lapse rates can reproduce the observed annual PDD
values (mean error ’08 6108C day yr21; Figs. 10c,d).
Because near-surface lapse rates vary systematically with
temperature, employing the constant mean summer
lapse rate results in temperature underestimation during
relatively cold periods and overestimation during rela-
tively warm periods. Across all stations, this results in an
average PDD overestimation of 258C day yr21, with a
mean error as high as 758C day yr21 at the lowest station.
Using the MALR greatly overestimates total PDDs with
mean errors as high as 1608C day yr21.
b. Comparison between PDDs downscaled usingdaily modeled lapse rates and a constant MALR
To illustrate differences in surface air temperature
estimates when differing lapse rates are employed, we
FIG. 9. Three-day average measured and modeled near-surface
lapse rates (b) for Devon Island Ice Cap. The mean measured
summer lapse rate (5.18C km21) and the MALR (6.58C km21)
are plotted for comparison. Modeled lapse rates were calcu-
lated using 750T anomalies and linear regression coefficients cali-
brated with temperature–elevation data from previous years.
Measured and modeled lapse rates are fully independent and are
significantly correlated (r 5 0.68).
FIG. 10. (left) Mean and (right) standard error in (a),(b) near-surface temperatures and (c),(d) positive degree-days
extrapolated from reconstructed summit elevation temperatures using variable daily mean measured and modeled
lapse rates as well as constant lapse rates equal to the 2006 mean summer lapse rate (5.18C km21) and MALR
(6.58C km21).
4292 J O U R N A L O F C L I M A T E VOLUME 22
Page 13
compared daily mean temperatures downscaled to gla-
cier surfaces [Canada3D digital elevation model (DEM),
available from Natural Resources Canada] from NARR
750T using both daily modeled lapse rates and the
MALR for the period 1994–2006. Results are displayed
as total PDDs. As part of the downscaling process, 750T
was first adjusted to the temperature at the highest
available station on each glacier by subtracting the
monthly mean difference between 750T and the station
temperatures. The derived station temperature was then
downscaled over the entire glacier surface at the 3D
DEM resolution (30 s approximately 900 3 200 m) using
the two different lapse rates.
Using the model coefficients provided in Table 3 and
daily 750T standardized anomalies, mean annual total
PDDs for the period 1994–2006 were estimated for each
of the four glaciers (Fig. 11). Average annual PDD totals
for the Agassiz Ice Cap, Devon Island Ice Cap, John
Evans Glacier, and Prince of Wales Ice Field were 808,
1308, 1808, and 808C day yr21, respectively. Averaged
over each glacier, the annual total PDDs derived from
near-surface temperatures downscaled using daily mod-
eled lapse rates are 208, 1608, 1308, and 1408C day yr21
less than PDD totals generated using the constant
MALR for the Agassiz and Devon Island Ice Caps,
John Evans Glacier, and Prince of Wales Ice Field, re-
spectively. Except for the Agassiz Ice Cap (which has
the lowest mean summer temperatures, one of the
lowest estimated average annual PDD totals, and the
highest near-surface temperature lapse rates), down-
scaling with the MALR results in a substantial over-
estimation of near-surface air temperatures and annual
PDDs. In the case of the Prince of Wales Ice Field, using
the MALR produces annual PDD estimates nearly 3
times those derived using modeled lapse rates. This
large difference is due not only to the nearly 28C km21
difference between the mean of the modeled lapse
rate and the MALR but also to (i) the large vertical
distance over which temperatures are downscaled
(;1800 m), (ii) the high sensitivity of lapse rates to
changes in 750T standardized anomalies (21.398C km21),
(iii) low annual PDD totals, and (iv) the large number
of days (averaged over all stations: 43 days yr21) with
near-surface temperatures within 628C of the freezing
point.
To illustrate the spatial differences in PDD estimates,
mean annual PDDs estimated from surface air tem-
peratures downscaled using modeled daily lapse rates
(Fig. 12a) and the MALR (Fig. 12b) are shown for the
Devon Island Ice Cap. Because both downscaling meth-
ods extrapolate from the same summit point location
temperature series, our model comparisons show good
agreement between downscaling methods near summit
elevations and larger disagreement at lower elevations. If
adjusted sea level temperatures had been extrapolated
instead, the MALR would result in an underestimate of
near-surface temperatures and total PDDs relative to
those determined using modeled daily lapse rates, as
opposed to the overestimates reported here.
FIG. 11. The 1994–2006 area averaged mean annual PDDs
for the Agassiz Ice Cap, Devon Island Ice Caps, JEG, and POW
derived from near-surface temperature fields downscaled from
NARR 750T using daily modeled and a constant lapse rate set
equal to the MALR (6.58C km21).
FIG. 12. The 1994–2006 mean annual PDDs for the Devon Island Ice Caps derived from near-
surface temperature fields downscaled from NARR 750T using (a) daily modeled lapse rates
and (b) a constant lapse rate equal to the MALR.
15 AUGUST 2009 G A R D N E R E T A L . 4293
Page 14
7. Discussion
Consistent with previous studies (Greuell and Bohm
1998; Steffen and Box 2001; Lowe and Porter 2004;
Hanna et al. 2005; Mair et al. 2005; Wright et al. 2005;
Marshall et al. 2007; Shepherd et al. 2007), we found that
ablation season near-surface lapse rates observed over
Arctic glacier surfaces are consistently lower than the
MALR. Higher near-surface lapse rates of 78–98C km21
have been reported for some valley glaciers (Schuler
et al. 2005; Brock et al. 2006). In these cases, however,
lapse rates were derived using air temperatures mea-
sured at two weather stations, one of which was located
at a higher elevation on glacier ice and the other at a
lower elevation on exposed ice-free ground. This has the
effect of producing artificially high near-surface glacier
lapse rates because the temperatures recorded at the
lower weather stations are not as strongly affected by the
cooling effects of the glacier surface as those at the up-
per stations. Using these lapse rates to extrapolate near-
surface temperatures over large altitudinal distances
over ice could result in significant errors.
Near-surface lapse rates over glaciers vary on seasonal
and daily time scales, a phenomenon that, although well
documented (Braun and Hock 2004; Steffen et al. 2004;
Hanna et al. 2005; Marshall et al. 2007), is rarely ac-
counted for in the downscaling or extrapolation of near-
surface air temperatures (Greuell and Bohm 1998;
Gardner and Sharp 2009). Unlike previous studies, our
work has shown that the variability in glacier near-surface
lapse rates during summer months is significantly corre-
lated on a regional scale and that this covariability appears
to be controlled by regional-scale changes in lower-
troposphere (750 mbar) temperatures that are associated
with the passage of synoptic weather systems (Alt 1987;
Gardner and Sharp 2007; Marshall et al. 2007). During the
ablation season, the sensitivity of glacier near-surface air
temperature to changes in free-atmosphere temperature
increases with elevation (Denby et al. 2002). This is be-
cause surface temperatures are fixed at 08C over melting
glacier surfaces, while free-atmosphere temperatures de-
crease with increasing elevation. As the surface elevation
decreases, the free atmosphere becomes warmer relative
to the surface, which drives a sensible heat flux that cools
the atmospheric boundary layer at a rate that is propor-
tional to the vertical temperature gradient. The less fre-
quent occurrence of melt at higher elevations reinforces
this relationship, as near-surface temperatures have a
higher climate sensitivity over frozen surfaces than over
melting surfaces (Denby et al. 2002). To a lesser extent,
glacier winds (which are known to increase in strength
with the magnitude of the atmospheric boundary layer
temperature inversion; van den Broeke 1997) also support
an increase in sensible heat flux with decreasing eleva-
tion (Denby et al. 2002). Therefore, near-surface air
temperatures will increase more at higher elevations
than at lower elevations in response to an increase in free-
atmospheric temperature. This effectively reduces the
near-surface lapse rate and results in the negative rela-
tionship between 750T and near-surface lapse rates.
This relationship was used successfully to develop
glacier-specific models for the downscaling of coarse-
resolution temperature fields. Through the model vali-
dation process it was shown that summer near-surface
air temperatures downscaled using modeled daily lapse
rates substantially improve estimates of total PDDs over
glaciers relative to use of a constant lapse rate equal to
either the mean ablation season lapse rate or the MALR.
When lower-troposphere temperatures were downscaled
over each of the four glaciers examined in this study for
the period from 1994 to 2006, the use of a constant
MALR overestimated annual total PDDs by an average
of 110 6 648C day yr21 relative to values estimated using
modeled lapse rates. In the case of the Prince of Wales Ice
Field, annual mean PDDs estimated using a constant
MALR were nearly 3 times greater than those estimated
using modeled lapse rates. The chronic overestimation of
PDDs when the MALR is employed can result in sig-
nificant errors in glacier mass balance estimates when the
near-surface temperature is used to model glacier melt.
Following a similar methodology to the one outlined
here, Gardner and Sharp (2009) showed that, for the
Devon Island Ice Cap over the period 1980–2006, esti-
mates of glacier mass balance made using a degree-day
model can be as much as 4 times more negative when
summit elevation temperatures are downscaled with the
MALR than estimates made using a variable lapse rate
modeled from lower-troposphere temperatures and 2.5
times more negative when downscaling is performed us-
ing a mean measured summer lapse rate.
Despite good regional correlations and success at
downscaling temperatures over individual glaciers, lapse
rate model coefficients differ between glaciers (Table 3).
There is generally good agreement in the model slopes
(m) (from 20.83 to 21.398C km21), but mean summer
lapse rates (b : y intercept) vary greatly (6.48–3.18C km21)
between glaciers. This suggests that lapse rate models
should be calibrated for individual glaciers. If it is nec-
essary to downscale temperatures over Arctic glaciers
for which there are insufficient measurements to cali-
brate a model, we suggest using m 5 21.18C km21 and
b 5 4.98C km21. These model parameters correspond to
the average model slope for the four glacier-specific
models (Table 3) and the mean ablation season lapse
rate for the six transects and all previously published
Arctic ablation season lapse rates included in Table 1.
4294 J O U R N A L O F C L I M A T E VOLUME 22
Page 15
For the four glaciers examined in this study, applying
this model to downscale 750T to near-surface tempera-
tures for the period of 1994–2006 produces total PDD
estimates that are on average 178 6358C day yr21 larger
than total PDD estimates derived using the site-specific
lapse rate models. Similar estimates made using a con-
stant lapse rate equal to the mean ablation season lapse
rate (4.98C km21) produce total PDD estimates that are
on average 338 6468C day yr21 too large.
In this study, near-surface lapse rates were parameter-
ized using standardized 750-mbar temperature anomalies
because temperatures at this pressure level are represen-
tative of free-air temperatures for all four glaciers exam-
ined and provide the highest correlations (not shown)
with near-surface lapse rates when compared to surface
and other lower- and midtroposphere temperatures. This
being said, model coefficients are relatively insensitive to
the temperature used for the parameterization of the
lapse rate model. Parameterizations based on NARR
surface, 900-, 850-, or 500-mbar standardized temperature
anomalies, derived in the same way as for 750T, result in
model slopes that are within ;620% of those reported
for the glacier-specific lapse rate models based on 750T
(Table 3) and within ;615% of the regional model. All
alternative models have the same mean lapse rate (inter-
cept) but have slightly lower regression coefficients when
averaged across all four glaciers. Standardized surface air
temperature anomalies provide the poorest model fit, as
they are the least representative of free-air temperatures.
Near-surface air temperatures were downscaled from
glacier summit temperatures to lower elevations. This
approach was used because NARR temperatures (sur-
face or lower-troposphere) show increased correlation
with on-glacier temperature measurements as the ele-
vation of the on-glacier measurement increases. This
suggests that NARR, and likely other regional/global
climate models, does a better job at simulating higher-
elevation temperatures (which are closer to free-air
values) than temperatures at lower elevations [which are
more strongly influenced by complex local effects, e.g.,
topography, katabatic winds, higher frequency of sur-
face melt (stronger sensible heat flux), and increased
influence from low-lying cloud]. Our approach to down-
scaling involves two steps: interpolating the NARR
lower-troposphere temperatures to an elevation on the
ice cap and then downscaling from that elevation using a
computed lapse rate. Errors arising from the first step
are minimized by interpolating measured temperatures
to the ice cap summit elevation, while those arising from
the lapse-rate-based downscaling are independent of the
choice of height from which to interpolate. Thus total
error in surface air temperature estimates should be
minimized by the approach that we have adopted.
8. Conclusions
The negative relationship between near-surface lapse
rates and lower-troposphere temperatures suggests that
lower lapse rates can be expected under a warming cli-
mate. This trend is driven by the increase in free-air
temperatures, the migration of the glacier melt zone to
higher elevations earlier in the season (larger glacier area
with a fixed surface temperature) and, to a lesser extent,
by enhanced glacier winds. This means that, as ablation
season temperatures warm over the Arctic, temperatures
near the glacier surface may become less sensitive to
temperature changes in the free atmosphere. If this be-
havior were incorporated into glacier mass balance
models, it could reduce projections of Arctic glacier melt
and its contributions to sea level in a warmer climate. The
opposite would be true if variable lapse rates were used to
extrapolate terminus (lower elevation) near-surface
temperatures to higher elevations.
Acknowledgments. This paper is dedicated to the
memory of the late Roy ‘‘Fritz’’ Koerner, who pioneered
the use of automatic weather stations on Canada’s Arctic
glaciers. This work was supported by NSERC Canada
(through Discovery, Northern Supplement and Equip-
ment Grants to M. Sharp, and an Alexander Graham Bell
Canada Graduate Scholarship to A. S. Gardner), Envi-
ronment Canada through the CRYSYS program, the
Northern Scientific Training Program (Indian and
Northern Affairs Canada), the Institute for Geophysical
Research and Circumpolar Boreal Alberta Research
Grant fund (University of Alberta), the Alberta Inge-
nuity Fund and Meteorological Service of Canada
(through scholarships to A. S. Gardner), and the Cana-
dian Foundation for Climate and Atmospheric Sciences
through the Polar Climate Stability Network. We also
thank the anonymous reviewers for their well-thought-
out and helpful suggestions. We gratefully acknowledge
the efforts of Brad Danielson, Anthony Arendt, Trudy
Wohlleben, Fiona Cawkwell, and Faron Anslow for their
assistance with setting up and maintaining the sensor
networks. We also thank the Polar Continental Shelf
Project, Natural Resources Canada (Contribution 036-07)
for logistical support and the Nunavut Research Institute
and Nunavut communities for permission to conduct our
field programs.
APPENDIX
Temperature Sensors Used in Study
Transect temperature sensor details (Table A1) and
sensor accuracies (Table A2) are provided in the fol-
lowing tables. All quality controlled daily average
15 AUGUST 2009 G A R D N E R E T A L . 4295
Page 16
TABLE A1. Temperature sensor identification (ID), sensor type, location, and periods of operation.
Transect ID Station ID
Sensor
type
Lat
(8N)
Lon
(8W)
Elevation
(m MSL)
First month
of record
Last month
of record
Agassiz A_1 107F 80.80 72.90 1736 Jun 1988 Apr 2006
A_2 107F 80.83 71.90 1314 Jun 1991 Apr 2006
A_3 107F 80.87 71.28 878 Apr 1994 Apr 2006
Devon_N D1_N 107F 75.34 82.10 1880 Apr 1997 May 2005
D2_N 107F 75.37 82.67 1780 Mar 1992 Mar 1995
D3_N 107F 75.39 82.76 1768 Apr 2000 May 2005
D4_N 107F 75.42 82.95 1628 May 1999 Aug 2003
D5_N 107F 75.49 83.28 1339 May 1998 May 2005
D6_N 107F 75.69 83.26 330 Apr 1997 May 2005
Devon_S D1_S 107F 75.34 82.68 1802 May 2005 Jan 2007
D2_S 107F 75.18 82.78 1415 Jun 2004 May 2007
D3_S 107F 75.01 82.88 994 May 2005 May 2007
Km0 HOBO 75.34 82.68 1802 May 2004 Sep 2004
Km4.7 HOBO 75.30 82.70 1744 Apr 2004 May 2007
Km8 HOBO 75.27 82.72 1676 Sep 2004 Feb 2005
Km9.1 HOBO 75.26 82.73 1636 Apr 2004 Mar 2007
Km13.6 HOBO 75.22 82.75 1502 Apr 2004 Dec 2006
Km21.4 HOBO 75.15 82.79 1328 Apr 2004 May 2007
Km24.6 HOBO 75.12 82.81 1255 Apr 2004 May 2007
km27.9 HOBO 75.09 82.83 1194 Apr 2004 Aug 2004
km30.2 HOBO 75.07 82.84 1146 May 2005 Apr 2006
km31.4 HOBO 75.06 82.85 1104 Apr 2006 Feb 2007
Km34.6 HOBO 75.03 82.86 1036 Apr 2006 Dec 2006
Km36.8 HOBO 75.01 82.88 994 Apr 2004 Feb 2007
Km39.2 HOBO 74.99 82.89 966 Apr 2004 Aug 2004
Km41.7 HOBO 74.97 82.90 874 Apr 2004 Feb 2007
Km43.7 HOBO 74.95 82.92 786 Apr 2004 Sep 2005
km45.7 HOBO 74.94 82.93 677 Apr 2004 Dec 2006
Km47.7 HOBO 74.92 82.94 478 Apr 2004 Nov 2006
JEG UWS 35CF 79.71 74.56 1183 Jun 1996 Jul 2002
MWS 35CF 79.67 74.35 824 Jun 1996 Jul 2002
LWS 35CF 79.63 74.08 261 Jun 1996 Jul 2002
1500m HOBO 79.72 74.50 1470 May 2001 Jun 2003
1300m-W HOBO 79.70 74.55 1320 Jun 2002 May 2003
1300m-E HOBO 79.71 74.49 1324 May 2001 Jun 2003
1250m HOBO 79.72 74.55 1245 May 2001 Jun 2002
1200m HOBO 79.71 74.56 1185 May 2002 Jun 2003
1100m HOBO 79.70 74.53 1110 May 2001 Jun 2003
1000m HOBO 79.69 74.50 1026 May 2001 Jun 2003
900m HOBO 79.68 74.44 915 May 2001 Jun 2003
800m HOBO 79.67 74.35 825 May 2002 May 2003
700m HOBO 79.67 74.30 705 May 2001 Jun 2003
600m HOBO 79.65 74.30 630 May 2001 May 2003
500m HOBO 79.64 74.19 510 May 2001 May 2003
400m HOBO 79.65 74.11 400 May 2001 Jun 2003
300m HOBO 79.64 74.08 300 May 2001 Jun 2003
250m HOBO 79.63 74.08 235 Jun 2002 May 2003
200m HOBO 79.63 74.08 209 May 2001 May 2003
140m HOBO 79.62 74.07 140 Jun 2001 May 2003
POW_N P_AWS 107 78.49 79.43 1727 Jun 2001 Sep 2002
WL1300 HOBO 78.50 80.23 1300 May 2001 May 2003
WL1100 HOBO 78.64 81.20 1094 May 2001 May 2003
SL1060 HOBO 78.60 79.86 1060 May 2001 Jun 2002
SL850 HOBO 78.64 79.53 850 May 2001 May 2003
WL750 HOBO 78.71 81.23 747 May 2001 May 2003
4296 J O U R N A L O F C L I M A T E VOLUME 22
Page 17
temperature measurements for each transect are avail-
able as supplementary material online at the University
of Alberta Arctic and Alpine Research Group’s Web
site (http://arctic.eas.ualberta.ca/).
REFERENCES
Alt, B. T., 1987: Developing synoptic analogs for extreme mass
balance conditions on Queen Elizabeth Island ice caps.
J. Climate Appl. Meteor., 26, 1605–1623.
Arendt, A., and M. Sharp, 1999: Energy balance measurements on
a Canadian High Arctic glacier and their implications for mass
balance modelling. Proc. IUGG Symp., Birmingham 1999:
Interactions Between the Cryosphere, Climate and Greenhouse
Gases, Birmingham, United Kingdom, International Union of
Geodesy and Geophysics, 165–172.
Arnold, N. S., W. G. Rees, A. J. Hodson, and J. Kohler, 2006: To-
pographic controls on the surface energy balance of a High
Arctic valley glacier. J. Geophys. Res., 111, F02011, doi:10.1029/
2005JF000426.
Bassford, R. P., M. J. Siegert, J. A. Dowdeswell, J. Oerlemans,
A. F. Glazovsky, and Y. Y. Macheret, 2006a: Quantifying the
mass balance of ice caps on Severnaya Zemlya, Russian High
Arctic. I: Climate and mass balance of the Vavilov Ice Cap.
Arct. Antarct. Alp. Res., 38, 1–12.
——, ——, and ——, 2006b: Quantifying the mass balance of ice
caps on Severnaya Zemlya, Russian High Arctic. II: Modeling
the flow of the Vavilov Ice Cap under the present climate.
Arct. Antarct. Alp. Res., 38, 13–20.
Bøggild, C. E., N. Reeh, and H. Oerter, 1994: Modelling abla-
tion and mass-balance sensitivity to climate change of Stor-
strommen, northeast Greenland. Global Planet. Change, 9,
79–90.
Boon, S., M. Sharp, and P. Nienow, 2003: Impact of an extreme
melt event on the runoff and hydrology of a High Arctic gla-
cier. Hydrol. Processes, 17, 1051–1072.
Bougamont, M., J. L. Bamber, and W. Greuell, 2005: A surface
mass balance model for the Greenland Ice Sheet. J. Geophys.
Res., 110, F04018, doi:10.1029/2005JF000348.
Box, J. E., and A. Rinke, 2003: Evaluation of Greenland Ice Sheet
surface climate in the HIRHAM regional climate model using
automatic weather station data. J. Climate, 16, 1302–1319.
Braithwaite, R. J., 1981: On glacier energy balance, ablation, and
air temperature. J. Glaciol., 27, 381–391.
——, and S. C. B. Raper, 2002: Glaciers and their contribution to
sea level change. Phys. Chem. Earth, 27, 1445–1454.
Braun, M., and R. Hock, 2004: Spatially distributed surface energy
balance and ablation modelling on the ice cap of King George
Island (Antarctica). Global Planet. Change, 42, 45–58.
Brock, B. W., I. C. Willis, and M. J. Sharp, 2006: Measurement and
parameterization of aerodynamic roughness length varia-
tions at Haut Glacier d’Arolla, Switzerland. J. Glaciol., 52,
281–297.
Cogley, J. G., W. P. Adams, M. A. Ecclestone, F. Jung-Rothenhausler,
and C. S. L. Ommanney, 1996: Mass balance of White Glacier,
Axel Heiberg Island, NWT, Canada, 1960-91. J. Glaciol., 42,
548–563.
Denby, B., W. Greuell, and J. Oerlemans, 2002: Simulating the
Greenland atmospheric boundary layer. Part II: Energy bal-
ance and climate sensitivity. Tellus, 54A, 529–541.
TABLE A1. (Continued)
Transect ID Station ID
Sensor
type
Lat
(8N)
Lon
(8W)
Elevation
(m MSL)
First month
of record
Last month
of record
WL610 SP-2000 78.68 79.10 660 Apr 2002 May 2003
LL1500 HOBO 78.55 79.07 1500 Apr 2002 May 2003
LL1300 HOBO 78.61 78.67 1308 May 2001 May 2003
LL1100 HOBO 78.63 78.47 1105 May 2001 May 2003
LL800 HOBO 78.71 76.36 799 May 2001 Apr 2002
LL600 HOBO 78.72 75.98 602 May 2001 May 2003
LL400 HOBO 78.70 75.47 395 May 2001 May 2003
LL130 HOBO 78.68 74.97 129 May 2001 Jan 2003
POW_S P_STH SP-2000 77.87 80.81 1350 May 2002 May 2003
HM1050 HOBO 78.03 81.25 1056 May 2002 May 2003
HM740 HOBO 78.05 81.65 740 May 2002 Oct 2002
KR960 HOBO 77.71 80.25 945 May 2002 May 2003
KR750 HOBO 77.64 80.00 750 May 2002 Jan 2003
KR550 SP-2000 77.53 79.54 550 May 2002 May 2003
TABLE A2. Temperature sensor measurement range and accuracy.
Sensor type Manufacturer Temperature range Accuracy (worst case) Accuracy (at 08C)
107F Campbell Scientific Ltd. 253 to 1488C 60.58C 60.28C
107 Campbell Scientific Ltd. 235 to 1508C 60.98C 60.38C
HMP 35CF Vaisala 253 to 1488C 60.58C 60.28C
HOBO H8-PRO Onset Scientific Ltd. 230 to 1508C 61.08C 60.28C
SP-2000 Veriteq Instruments Inc. 235 to 1858C 61.08C 60.28C
15 AUGUST 2009 G A R D N E R E T A L . 4297
Page 18
de Woul, M., R. Hock, M. Braun, T. Thorsteinsson, T. Johannesson,
and S. Halldorsdottir, 2006: Firn layer impact on glacial runoff:
A case study at Hofsjoekull, Iceland. Hydrol. Processes, 20,
2171–2185.
Fisher, D. A., R. M. Koerner, and N. Reeh, 1995: Holocene cli-
matic records from Agassiz Ice Cap, Ellesmere Island, NWT,
Canada. Holocene, 5, 19–24.
Flowers, G. E., and G. K. C. Clarke, 2002: A multicomponent
coupled model of glacier hydrology 2. Application to Trap-
ridge Glacier, Yukon, Canada. J. Geophys. Res., 107, 2288,
doi:10.1029/2001JB001124.
Gardner, A. S., and M. Sharp, 2007: Influence of the Arctic cir-
cumpolar vortex on the mass balance of Canadian high Arctic
glaciers. J. Climate, 20, 4586–4598.
——, and ——, 2009: Sensitivity of net mass balance estimates to
near-surface temperature lapse rates when employing the
degree-day method to estimate glacier melt. Ann. Glaciol., 50,
80–86.
Glickman, T., Ed., 2000: Glossary of Meteorology. 2nd ed. Amer.
Meteor. Soc., 855 pp.
Glover, R. W., 1999: Influence of spatial resolution and treatment
of orography on GCM estimates of the surface mass balance of
the Greenland Ice Sheet. J. Climate, 12, 551–563.
Gregory, J. M., and J. Oerlemans, 1998: Simulated future sea-level
rise due to glacier melt based on regionally and seasonally
resolved temperature changes. Nature, 391, 474–476.
Greuell, W., and R. Bohm, 1998: 2 m temperatures along melting
mid-latitude glaciers, and implications for the sensitivity of the
mass balance to variations in temperature. J. Glaciol., 44, 9–20.
Hanna, E., P. Huybrechts, I. Janssens, J. Cappelen, K. Steffen, and
A. Stephens, 2005: Runoff and mass balance of the Greenland
Ice Sheet: 1958-2003. J. Geophys. Res., 110, D13108, doi:10.1029/
2004JD005641.
Hock, R., 2003: Temperature index melt modelling in mountain
areas. J. Hydrol., 282, 104–115.
Johannesson, T., O. Sigurdsson, T. Laumann, and M. Kennett,
1995: Degree-day glacier mass-balance modeling with appli-
cations to glaciers in Iceland, Norway and Greenland.
J. Glaciol., 41, 345–358.
Koerner, R. M., 2005: Mass balance of glaciers in the Queen Eliz-
abeth Islands, Nunavut, Canada. Ann. Glaciol., 42, 417–423.
——, and D. A. Fisher, 1990: A record of Holocene summer climate
from a Canadian High-Arctic ice core. Nature, 343, 630–631.
Lowe, A. T., and P. R. Porter, 2004: Variability of air temperatures
lapse rates: Preliminary results from the Karakoram Himalaya,
Pakistan. Geophysical Research Abstracts, Vol. 6, Abstract
04441. [Available online at http://www.cosis.net/abstracts/
EGU04/04441/EGU04-J-04441.pdf.]
Mair, D., D. Burgess, and M. Sharp, 2005: Thirty-seven year mass
balance of Devon Ice Cap, Nunavut, Canada, determined by
shallow ice coring and melt modeling. J. Geophys. Res., 110,
F01011, doi:10.1029/2003JF000099.
Marshall, S. J., H. Bjornsson, G. E. Flowers, and G. K. C. Clarke,
2005: Simulation of Vatnajokull ice cap dynamics. J. Geophys.
Res., 110, F03009, doi:10.1029/2004JF000262.
——, M. J. Sharp, D. O. Burgess, and F. S. Anslow, 2007: Surface
temperature lapse rate variability on the Prince of Wales Ice-
field, Ellesmere Island, Canada: Implications for regional-scale
downscaling of temperature. Int. J. Climatol., 27, 385–398.
Meier, M. F., M. B. Dyurgerov, U. K. Rick, S. O’Neel, W. T. Pfeffer,
R. S. Anderson, S. P. Anderson, and A. F. Glazovsky, 2007:
Glaciers dominate eustatic sea-level rise in the 21st century.
Science, 317, 1064–1067.
Mesinger, F., and Coauthors, 2006: North American Regional
Reanalysis. Bull. Amer. Meteor. Soc., 87, 343–360.
Otto-Bliesner, B. L., S. J. Marshall, J. T. Overpeck, G. H. Miller, and
A. Hu, 2006a: Simulating arctic climate warmth and icefield
retreat in the Last Interglaciation. Science, 311, 1751–1753.
——, ——, ——, ——, and ——, 2006b: Support material: Simu-
lating arctic climate warmth and icefield retreat in the Last
Interglaciation. Science, 311, 1751–1753.
Overland, J. E., and P. S. Guest, 1991: The Arctic snow and air
temperature budget over sea ice during winter. J. Geophys.
Res., 96, 4651–4662.
Raper, S. C. B., and R. J. Braithwaite, 2006: Low sea level rise
projections from mountain glaciers and icecaps under global
warming. Nature, 439, 311–313.
Schuler, T. V., R. Hock, M. Jackson, H. Elvehoy, M. Braun,
I. Brown, and J. O. Hagen, 2005: Distributed mass-balance and
climate sensitivity modelling of Engabreen, Norway. Ann.
Glaciol., 42, 395–401.
Serreze, M. C., and R. G. Barry, 2005: The Arctic Climate System.
Cambridge Atmospheric and Space Science Series, Cam-
bridge University Press, 385 pp.
——, J. D. Kahl, and R. C. Schnell, 1992: Low-level temperature
inversions of the Eurasian Arctic and comparisons with Soviet
drifting station data. J. Climate, 5, 615–629.
Sharp, M., L. Copland, K. Filbert, D. Burgess, and S. Williamson,
2003: Recent changes in the extent and volume of Canadian
Arctic glaciers. Papers and Recommendations: Snow Watch
2002 Workshop and Workshop on Assessing Global Glacier
Recession, Glaciological Data Rep. GD-32, Boulder, CO,
NSIDC, 73–75.
Shepherd, A., Z. Du, T. J. Benham, J. A. Dowdeswell, and
E. M. Morris, 2007: Mass balance of Devon Ice Cap, Canadian
Arctic. Ann. Glaciol., 46, 249–254.
Shumway, R. H., and D. S. Stoffer, 2006: Time Series Analysis and
Its Applications: With R Examples. 2nd ed. Springer-Verlag,
575 pp.
Steffen, K., and J. Box, 2001: Surface climatology of the Greenland
Ice Sheet: Greenland climate network 1995-1999. J. Geophys.
Res., 106, 33 951–33 964.
——, S. V. Nghiem, R. Huff, and G. Neumann, 2004: The melt
anomaly of 2002 on the Greenland Ice Sheet from active and
passive microwave satellite observations. Geophys. Res. Lett.,
31, L20402, doi:10.1029/2004GL020444.
Thomas, R. H., W. Abdalati, E. Frederick, W. B. Krabill,
S. Manizade, and K. Steffen, 2003: Investigation of surface
melting and dynamic thinning on Jakobshavn Isbrae, Green-
land. J. Glaciol., 49, 231–239.
van den Broeke, M. R., 1997: Structure and diurnal, variation of the
atmospheric boundary layer over a mid-latitude glacier in
summer. Bound.-Layer Meteor., 83, 183–205.
von Storch, H., and F. W. Zwiers, 1999: Statistical Analysis in Cli-
mate Research. Cambridge University Press, 484 pp.
Wang, L., M. J. Sharp, B. Rivard, S. Marshall, and D. Burgess, 2005:
Melt season duration on Canadian Arctic ice caps, 2000–2004.
Geophys. Res. Lett., 32, L19502, doi:10.1029/2005GL023962.
Wright, A., J. Wadham, M. Siegert, A. Luckman, and J. Kohler,
2005: Modelling the impact of superimposed ice on the mass
balance of an Arctic glacier under scenarios of future climate
change. Ann. Glaciol., 42, 277–283.
4298 J O U R N A L O F C L I M A T E VOLUME 22