64
1 Nearmap Ltd Investor Strategy Presentation 17 November 2016
| Date post: | 28-May-2018 |
| Category: |
Documents |
| Upload: | trinhthuan |
| View: | 213 times |
| Download: | 0 times |

1
Nearmap LtdInvestor Strategy Presentation
17 November 2016

2
Agenda
1. Nearmap Vision, Strategy & Business Model – Dr Rob Newman, Managing Director and CEO
2. Australia Distribution Overview – Mr John Biviano, Senior Vice President & General Manager, Australia
3. US Distribution Overview – Mr Patrick Quigley, Senior Vice President & General Manager, United States
4. Content & Technology Strategy – Mr Paul Lapstun, Chief Technology Officer
5. Nearmap 3D Product Strategy – Ms Leah Rankin, VP of Product & Engineering
6. Nearmap Summary – Dr Rob Newman
3
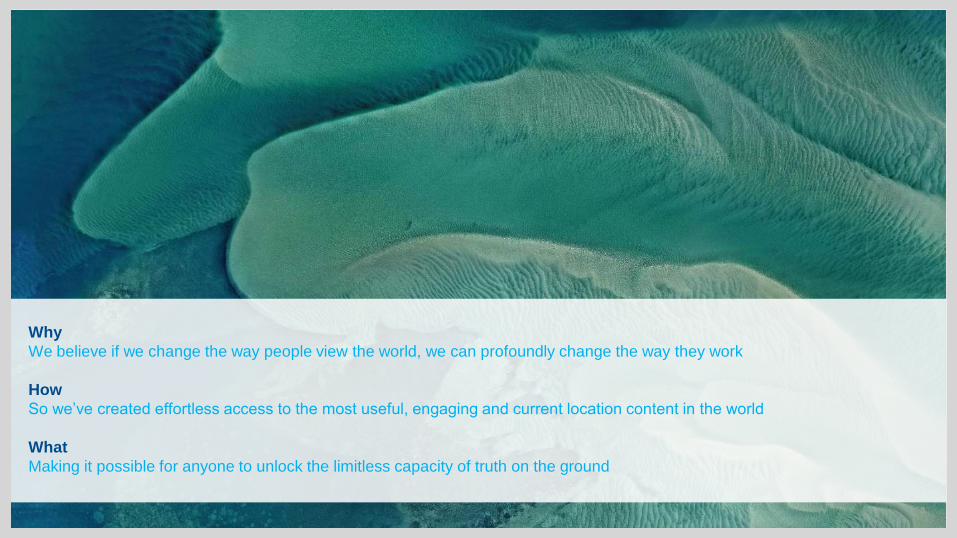
Why
We believe if we change the way people view the world, we can profoundly change the way they work
How
So we’ve created effortless access to the most useful, engaging and current location content in the world
What
Making it possible for anyone to unlock the limitless capacity of truth on the ground

4
The Nearmap team
Experienced leadership with a growth oriented executive team
Patrick QuigleySenior Vice President &
General Manager, US
Paul LapstunChief Technology Officer
Andy WattChief Financial Officer
(Commencing Dec 2016)
John BivianoSenior Vice President &
General Manager, Australia
Dr Rob NewmanChief Executive Officer &
Managing Director
Leah RankinVice President – Product
& Engineering

5
Traditional aerial imagery has a multitude of uses
These cover a range of industries and applications
The traditional aerial imagery market has a
number of specialist applications, with end-
use in a range of sectors.
Nearmap’s unique subscription platform
already addresses a number of these
applications and industries – before taking
into account the market expansion which
the platform brings.
Traditional aerial imagery applications and industries which Nearmap’s expanded offering already addresses
Applications Industries
Geospatial technology Government
Media & entertainment Commercial enterprises
Construction & engineering Civil engineering
Energy Military
Defence & intelligence Energy
Conservation & research Others (including insurance)
Disaster response management
Natural resources management

6
The traditional aerial imagery market is large and expanding
The market is forecast for rapid growth in the upcoming years
Global market for taking and processing
images from an elevated position has
experienced rapid growth, which is forecast
to continue.
Location content is expanding out of
specialist uses to broad use in many
business applications.
Nearmap’s unique business model is
perfectly positioned to make location
content easily accessible and broadly
available.
Global aerial imaging market (US$)1
2016 2023CAGR %
13.5%
AU 50.0M 10.4% 100.4M
US 443.8 14.5% 1,151.8M
1 Transparency Market Research “Aerial Imaging Market: Global Industry Analysis, Size, Share, Growth, Trends and Forecast, 2015-2023”
1,363.4m3,341.7m

Fragmented market
Location content providers
typically focussed on specific
use cases or geographic
locations
Lack of currency
Traditional methods of
delivering location content
involve significant time
between capture and delivery
of content to customers
Manual processing
Traditional methods of
delivering location content
involve significant manual
processing of images
Delivery limits customer use
Lack of currency and access to
broad based location content
has limited usage in industries
which would derive significant
benefit
7
Nearmap has broadened the traditional aerial imagery market
Our unique offering overcomes a range of limitations experienced by traditional market operators
The traditional aerial imagery market is
focussed on bespoke captures – generally
a higher cost proposition for customers,
with manual processing and lack of image
currency and accessibility.

8
Nearmap is uniquely positioned to leverage the growth in the location content market
Enhanced technology and product capability deliver a platform for growth
State of the art capture systems deliver 2D and
3D content
AU coverage – 88% of population, 21M
people, 7M dwellings
US coverage – 65% of population, 210M people,
70M dwellings
Proprietary collection,
processing and stitching software
Instant access to subscription content,
delivered within days of capture
Cloud based storage of full
library of location content
Leading content
State of the art camera systems including
HyperCamera2 (launched April 2016)
Significant coverage of Australia and US
population
Proprietary software
Proprietary collection, processing and
stitching software with unique IP providing
market leading product
Subscription access

The Nearmap Point of Innovation
We capture, manage and deliver the most current location content in the world
Generating leadsFind sites fit for products and
services
More than just providing unique imagery, our
customers use Nearmap’s location content to
address a broad range of needs in their
business, with 6 key jobs in their
organisations which we help facilitate.
9
Estimating &
quotingReduce time to prepare quotes
and estimates
Planning & inspectingCreate detailed plans by accessing
more vivid and recent information
about your location of interest Monitoring &
validatingEffectively monitor projects to
ensure they’re on track and
validate data from the past and
3rd party sources
Assessing riskWith access to current and historic
high quality visuals and estimation
tools
Communicate & visualizeCommunicate effectively to colleagues and
customers with high quality imagery and
relevant information

10
Nearmap has expanded the addressable market
Nearmap’s cloud based platform for delivery of high resolution location based content has expanded the traditional aerial imagery market
Many Nearmap customers have not
traditionally been aerial imagery customers –
Nearmap’s unique offering has expanded the
potential users of aerial imagery location
content and therefore the market.
1 Estimate based on internal research and external analysis
(Transparency Market Research “Aerial Imaging Market: Global Industry Analysis, Size, Share, Growth, Trends and Forecast, 2015-
2023”, IBIS World Industry Report M6922 “Surveying and Mapping Services in Australia”)
Current Nearmap Australian ACV portfolio AU$34.4M~ 20% from traditional aerial imagery customers
~ 80% from new aerial imagery users1
Estimated Australian
market size for
Nearmap’s current
product AU$250–300M
Traditional Australian
Aerial Imagery market
AU$65M
Nearmap addressable
market expansion
AU$185-235M
+ =
11
MapBrowser
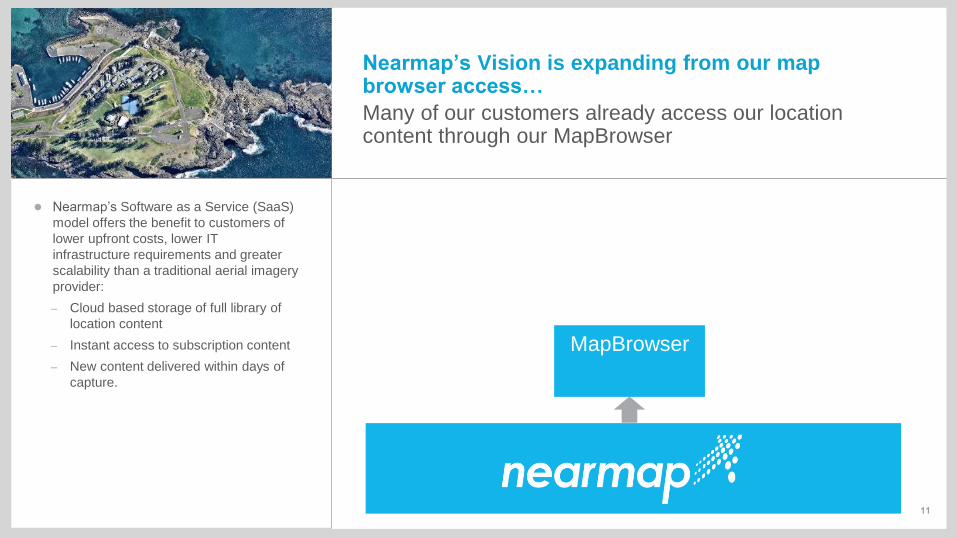
Nearmap’s Vision is expanding from our map browser access…
Many of our customers already access our location content through our MapBrowser
Nearmap’s Software as a Service (SaaS)
model offers the benefit to customers of
lower upfront costs, lower IT
infrastructure requirements and greater
scalability than a traditional aerial imagery
provider:
– Cloud based storage of full library of
location content
– Instant access to subscription content
– New content delivered within days of
capture.

12
…to integration with 3rd party apps…
Our location content integrates seamlessly with world class 3rd party applications
MapBrowser 3rd party apps
Esri Autodesk Google Maps for Work
Pitney Bowes MapInfoBentley Systems
For more sophisticated users, our
location content integrates with a number
of third party applications.
These may be with third party providers.
The content can also be integrated into a
customer’s bespoke internal applications.

13
MapBrowser 3rd party appsMachine
learning
Change detection
Object classification
Automated quoting &
assessment
Built environment &
asset management
Transportation
management
Renewable energy &
resource management
Automated assessment
…to being a critical tool for rapidly emerging markets
Our location content provides rich data for machine learning tools and automated applications
For many emerging industry verticals,
detailed, up-to-date location content will
be critical.
Combining our data with machine
learning will enable solutions which
automate many tasks which are currently
manual, such as:
– Autonomous driving validation; and
– Mass change detection.
3D location content will allow even
greater levels of automation.

14
Adoption of a SaaS model for the primary
delivery of Nearmap’s location content
provides a range of benefits to both
Nearmap and the customer.
The Nearmap business model
Why Software as a Service (SaaS)
For the customer:
On demand licensing with upfront
costs minimised
No software to install – users only
require a web browser, with API
integration possible
No infrastructure to provision and
maintain – hardware management is
not core to our customers’ business
Latest capture and all historical
captures are instantly available
For Nearmap:
Positive working capital – customers
typically pay annually up-front
Sales and marketing spend to be
only ~15% of pro forma revenue
Usage driven revenue model (users
charged generally annually, up-
front)
Revenue growth organic as
customer use cases increase –
enables us to grow revenues over
time as customers become more
familiar with the product and add
more users and use cases

15
A key metric for our business is the
Annualised Contract Value (ACV) of a
customer, representing the annualised
value of all active subscription contracts in
effect at a particular date.
Our sales and marketing efforts are
focussed on generating incremental ACV
in each period equal to or greater than our
sales & marketing cost – a contribution
ratio of at least 100%.
After the initial sales and marketing
investment in obtaining a customer,
retained customers have a high lifetime
value (LTV) as they renew subscriptions
given our high gross margins and low
customer churn.
A strong base of recurring revenue
Initial sales and marketing investment generates positive long term cash flow
Cumulative Cash Flow - Indicative Case 1
Quarterly incremental ACV $1M
Sales team contribution ratio 100%
Customer churn 10% pa
Capture cost $1M per quarter, increasing 10% pa
Positive cash flow Year 3 Q1
-6
-4
-2
0
2
4
6
8
10
1 - Q1 1 - Q2 1 - Q3 1- Q4 2 - Q1 2- Q2 2 - Q3 2- Q4 3 - Q1 3 - Q2 3 - Q3 3 - Q4 4 - Q1 4 - Q2 4 - Q3 4 - Q4 5 - Q1 5 - Q2 5 - Q3 5 - Q4
Indicative Case 1
16
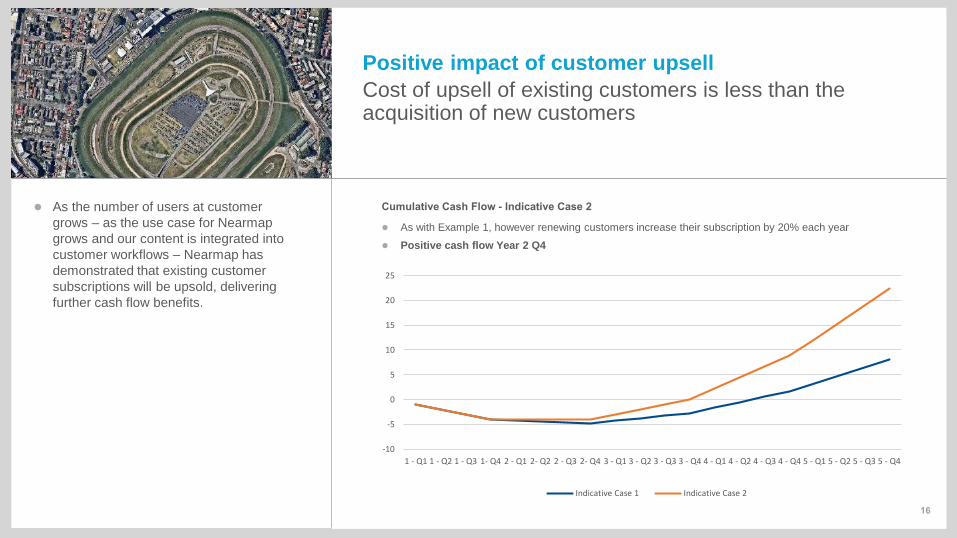
As the number of users at customer
grows – as the use case for Nearmap
grows and our content is integrated into
customer workflows – Nearmap has
demonstrated that existing customer
subscriptions will be upsold, delivering
further cash flow benefits.
Positive impact of customer upsell
Cost of upsell of existing customers is less than the acquisition of new customers
Cumulative Cash Flow - Indicative Case 2
As with Example 1, however renewing customers increase their subscription by 20% each year
Positive cash flow Year 2 Q4
-10
-5
0
5
10
15
20
25
1 - Q1 1 - Q2 1 - Q3 1- Q4 2 - Q1 2- Q2 2 - Q3 2- Q4 3 - Q1 3 - Q2 3 - Q3 3 - Q4 4 - Q1 4 - Q2 4 - Q3 4 - Q4 5 - Q1 5 - Q2 5 - Q3 5 - Q4
Indicative Case 1 Indicative Case 2

17
Doubling the sales and marketing
investment in the example on the previous
page, to double the new business ACV won
in each year, has a significant impact on
long term cash flow through the benefit of
the renewal of previous years subscriptions
over and above current year new business
ACV.
The leverage of sales & marketing investment
Increased sales & marketing investment has the potential to accelerate long term cash flow
Cumulative Cash Flow - Indicative Case 3
As with Example 2, however sales & marketing effort doubled with contribution ratio of 100% maintained.
Positive cash flow Year 2 Q1
-10
0
10
20
30
40
50
60
70
80
1 - Q1 1 - Q2 1 - Q3 1- Q4 2 - Q1 2- Q2 2 - Q3 2- Q4 3 - Q1 3 - Q2 3 - Q3 3 - Q4 4 - Q1 4 - Q2 4 - Q3 4 - Q4 5 - Q1 5 - Q2 5 - Q3 5 - Q4
Indicative Case 1 Indicative Case 2 Indicative Case 3

18
The Nearmap customer journey
Our sales approach is focussed on landing new customers, and expanding usage with our existing customers
Landing an initial customer
Customer may not be a
traditional user of aerial
imagery
Initial subscription may be
small to demonstrate use
case within the customer
organisation
Expanding at customers
Use case and usage grows
at a customer
Nearmap’s location content
becomes integrated into
customer workflows
Integration with customers
Critical customer processes
incorporate Nearmap
location content – usage is
embedded within the
customer
Our ‘land and expand’ strategy is focussed
on initial wins with customers to
demonstrate the benefit of our location
content, and then retaining and expanding
our use case at those customers over time.
Indicative Example
Year 1
ACV $100kYear 2
ACV $300k
Year 3
ACV $1M+

19
The Nearmap sales approach
Nearmap’s sales engagement model is focussed on the lifetime of our customers
Marketing
Targeted at companies and users where we
have already established strong use cases.
Lead Generation and Content is highly
focused and delivers qualified leads to
sales.
Sales
Direct Sales model which has three key
functions:
1) Bring new customers to Nearmap
2) Retain and upsell our existing customer
base, through increased usage and
adding higher value products
3) Targeted sales to enterprise customer
Our sales engagement model is designed to
support our ‘land and expand’ strategy, from
the development of our initial location
content through to customer support.

20
The Nearmap sales team model
Nearmap’s sales teams focus on specific components of our existing and new customer base
Account
Management
New
Business
Strategic
Accounts
Renewal
Portfolio
Although tailored to specific geographies,
our sales approach is focussed on:
– Generating new business with small to
medium enterprises (New Business)
– Focussing on large enterprise accounts,
both for new business and growing
existing customers (Strategic Accounts)
– Managing the relationship with our
existing customer base (Account
Management).
The closing ACV portfolio forms the base of
the renewal portfolio in the subsequent
period.
Components of ACV portfolio

21
Nearmap has two regionally focused businesses
Supported by a global sales and service delivery infrastructure
AustraliaJohn Biviano
United StatesPatrick Quigley
Nearmap Corporate
Nearmap has been capturing imagery in
Australia since 2008, with US imagery
capture starting in 2014.
Each geography is at a different stage in the
development of its business.

22
Australia Distribution Overview – Mr John Biviano, Senior Vice President & General Manager, Australia

23
Nearmap has been operating in Australia
using our business model for 5 years.
Nearmap has effectively created the market
and is the acknowledged market leader in
the space.
The benefits of our business model are now
clearly being demonstrated by our
Australian operations.
Australia – John Biviano
The Australian distribution business is the most established and our core as we expand
AU revenues rebased to first year of capture ($M)
0
5
10
15
20
25
30
12
34
56
78
9
- - 0.2 3.7 5.6
10.5
17.8
23.6
29.7

24
AU Customers
Our customers are in a broad range of sectors across the economy
Nearmap’s Australian customer base
covers a range of industry sectors, and
includes many customers who had not
been traditional aerial imagery customers –
until Nearmap’s unique subscription model.

25
Diverse, growing Australian customer base
Growth came from new business and existing customers – in a growing market
Client base is increasingly diverse with top
10 representing ~16% of the total portfolio.
Subscription ACV values of Top 10
Australian customers grew by 63.6% yoy:
– Two customers with subscriptions now
over $1M per annum.
3.3 5.4
21.7
29.0
0
5
10
15
20
25
30
35
40
FY15 FY16
$M
Top 10 Portfolio Balance
AU ACV portfolio composition FY15 to FY16
Growth %
37.6 %
33.6 %

26
Accelerated growth in our Australian business
The Australian business demonstrated strong growth in customers, revenue and annualised contract value
Key highlights:
~38% growth in ACV1 portfolio to $34.4M
Estimated lifetime portfolio value2 of $338M
>1,300 additional customers taking total
customers >6,800
Over 50,000 active users
* FY15 closing subscriptions normalised for cessation of personal subscriptions during FY16
5,503
6,827
30-Jun-15 30-Jun-16
Growth in normalised* AU customer numbers
25.0
34.4
30-Jun-15 30-Jun-16
Annualised contract value –Australia ($M)
1. ACV Annualised Contract Value = annualised value of all active subscription contracts in effect at a particular date
2. Lifetime Portfolio Value Lifetime Portfolio Value = (ACV Portfolio x Gross Margin %) / Churn %

27
Australian customers growing across the portfolio
Growth came in all subscription sizes
Nearmap’s customer base is increasingly
diverse.
Product continues to be valued by a range of
different industries and client types.
Growth has been achieved across every
segment of the market.
Accelerating revenue growth half-on-half.
-
2.0
4.0
6.0
8.0
10.0
12.0
14.0
$400 > $2k $2k > $15k $15k > $50k > $50k
FY14 FY15 H1 16 H2 FY16
SME ENTERPRISE
AU Revenue by subscription size ($M)

28
Given the relative maturity of our
Australian business, our sales and
marketing efforts are focussed on
maintaining and expanding our existing
customers as well as continuing add
new customers to our portfolio.
AU Sales Team
The Australian sales team is focussed on all the components of our ACV portfolio
Account
Management6 FTE
New
Business7 FTE
Strategic
Accounts8 FTE
Supported by Australian sales management,
marketing and operations support
Components of ACV portfolio
29
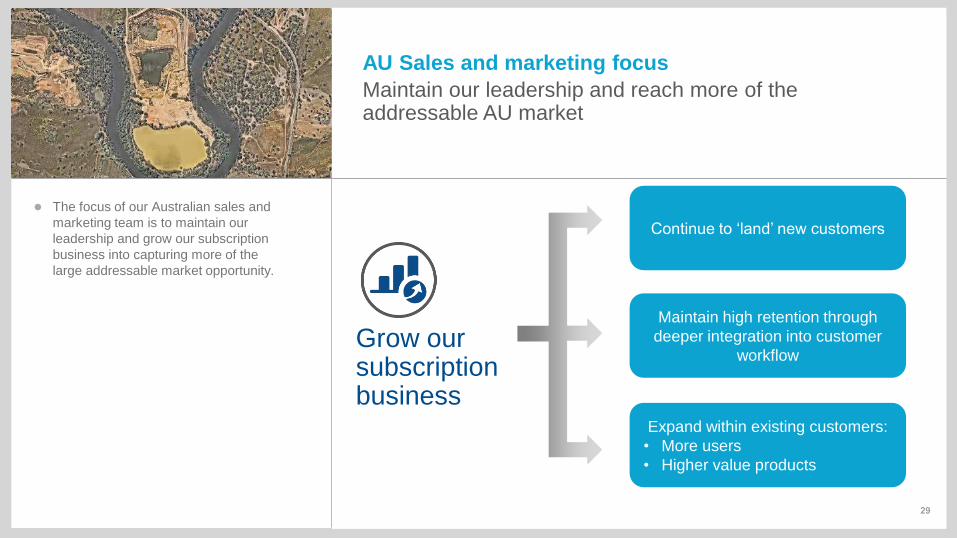
AU Sales and marketing focus
Maintain our leadership and reach more of the addressable AU market
Grow our subscription business
Continue to ‘land’ new customers
Maintain high retention through
deeper integration into customer
workflow
Expand within existing customers:
• More users
• Higher value products
The focus of our Australian sales and
marketing team is to maintain our
leadership and grow our subscription
business into capturing more of the
large addressable market opportunity.

30
Expanding the available portion of the addressable market through:
– Generating marketing qualified leads for our New Business Representatives through
targeted marketing efforts focussed on high value sectors
– Increasing awareness of Nearmap in target sectors through trade shows and marketing
campaigns
New business acquisition of our Strategic Account Managers and New Business
Representatives focussed on landing – win a customer initially with a subscription which
enables Nearmap to demonstrate the benefit of our location content for larger application
within their organisation – in order to expand.
Sales cycle for new customers range from 1 day for smaller SME customers to 3-6 months
for large Enterprise customers.
Approximately one third of our incremental ACV is generated from new customers.
Continue to land new customers
A significant market opportunity remains to be tapped
Our current ACV of $34.4M in the
context of a market size estimate of
$250-300M represents a significant
opportunity to be tapped, through a
range of initiatives.

31
Once a customer has been acquired, our Account Managers are focussed on retaining
customers, as well as integrating our location content into their workflow to expand the use
case and allow subscriptions to be upsold.
Customer churn is typically seen in the longer tail of our customers, with strategies in place
to minimise churn including:
– Targeted marketing activities focussed on potential churning customers
– Regular sales team contact including at least one site visit.
Upsell of existing customers typically generates approximately 2/3rds of our incremental
ACV in Australia.
Maintain high customer retention and expand customer usage
Our Account Managers focus on maintaining our existing customers and deeper integration of Nearmap content into their workflows
Our existing customer base represents
a significant opportunity to grow our
business, through not just retaining
those customers but expanding their
usage of Nearmap.

32
US Distribution Overview – Mr Patrick Quigley, Senior Vice President & General Manager, United States
33
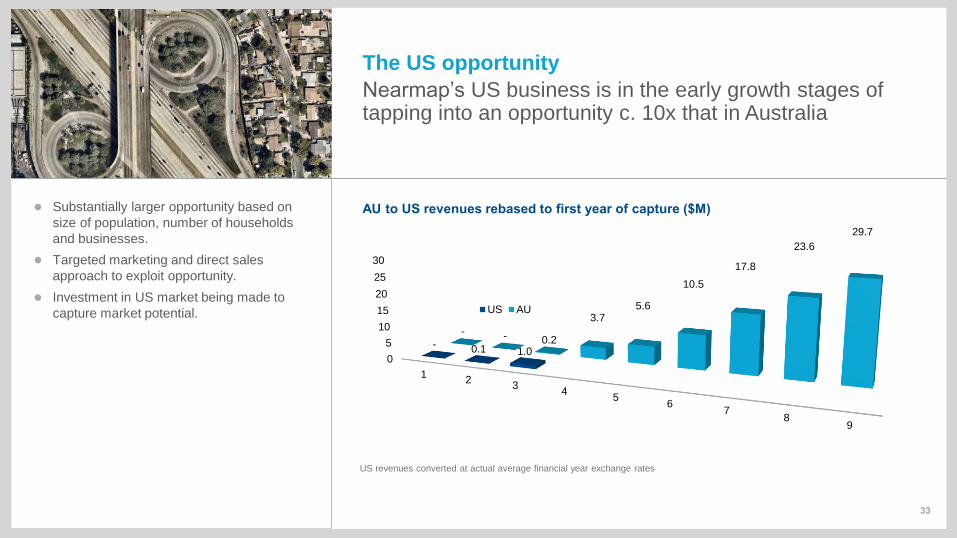
The US opportunity
Nearmap’s US business is in the early growth stages of tapping into an opportunity c. 10x that in Australia
AU to US revenues rebased to first year of capture ($M) Substantially larger opportunity based on
size of population, number of households
and businesses.
Targeted marketing and direct sales
approach to exploit opportunity.
Investment in US market being made to
capture market potential.
0
5
10
15
20
25
30
12
34
56
78
9
- 0.1 1.0
- - 0.2
3.7 5.6
10.5
17.8
23.6
29.7
US AU
US revenues converted at actual average financial year exchange rates

34
Sales and marketing optimisation
Enhancements to our sales and marketing operations in H2 FY16 has increased team productivity
Our learnings from our initial US operations
have resulted in significant enhancements to
our sales and marketing process, resulting
in increased effectiveness and efficiency of
our customer acquisition.
Sales led free trials
All free trials are led,
managed and measured by
the US sales team
Managed paid ads
High visibility on click-
through of our targeted
digital ads
Customer list targeting
Targeted sales &
marketing search and lead
acquisition through list
targeting
Lead measurement
Measurement refined to
enable cohort analysis,
conversion and
disqualification

US Customers
Customers in a broad range of sectors
Our US customer base continues to
grow. Our portfolio is diverse yet
focussed, showing synergy with
industries in Australia.
Our customers have grown to over 400
logos to date and include some key
strategic names.
35

36
In order to replicate the business model in
the US at this early stage, our US sales
and marketing efforts are focussed on
targeting and landing new customers
across our targeted industry verticals.
In addition, we have our first customers
with annual subscriptions now coming up
for renewal.
US Sales Team
The US sales team is focussed on winning new customers and expanding within existing customers
New
Business11 FTE
Strategic
Accounts3 FTE
Supported by US sales management, marketing
and operations support
Components of ACV portfolio
37
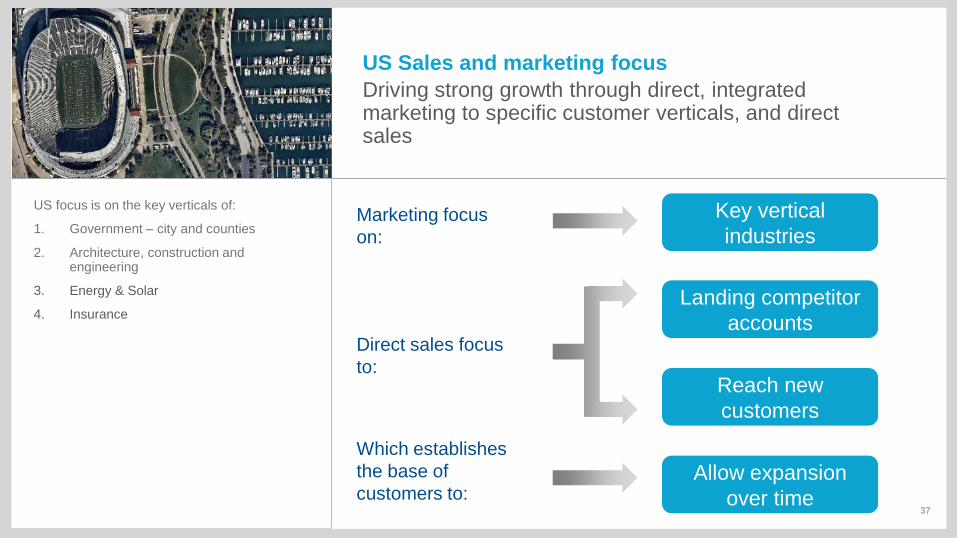
US Sales and marketing focus
Driving strong growth through direct, integrated marketing to specific customer verticals, and direct sales
Direct sales focus
to:
Landing competitor
accounts
Reach new
customers
Allow expansion
over time
Key vertical
industriesMarketing focus
on:
Which establishes
the base of
customers to:
US focus is on the key verticals of:
1. Government – city and counties
2. Architecture, construction and engineering
3. Energy & Solar
4. Insurance

38
US marketing efforts focussed on our key
verticals, with a targeted, multi-channel
approach including:
Attendance at industry, trade and GIS fairs
Acquisition of customer lists
Social media marketing, including use of
Google Ad Words
Targeted advertising and sponsored articles
Marketing to target industry verticals
Marketing efforts are targeted at increasing awareness and generating marketing qualified leads in target industry verticals

39
Marketing utilizes strategic relationships
Nearmap’s relationships with industry leaders such as Esri present unique marketing opportunities at scale
For example, Nearmap was featured in the
latest October Esri ArcNews publication with
a Global readership of over 1 million.

40
Leverage partners to broaden our channel
Partners broaden the reach and value of Nearmap’slocation content
Entering into partnerships with key
customers allows Nearmap to:
– Gain access to industry verticals
which are not a focus of our direct
sales campaigns, such as water
management and insurance
– Leverage Nearmap’s location content
into artificial intelligence applications. Insurance
Water management
“The Nearmap agreement gives our subscribers unprecedented insight and clarity. Our land classification accuracy averages between 95 –99%, but requires extremely high-resolution imagery to highlight property details.”
Quoting and designing
“Nearmap’s high quality aerial imagery is a critical ingredient in TomTom’s recipe for delivering the most up-date and accurate maps. Today’s maps are expected to not only provide real-time location information but also to enable autonomous driving functionality in the very near future. With this expectation, it is important for TomTom to source highly accurate information from suppliers like Nearmap.”
Insurance
Traffic routing and mapping
41
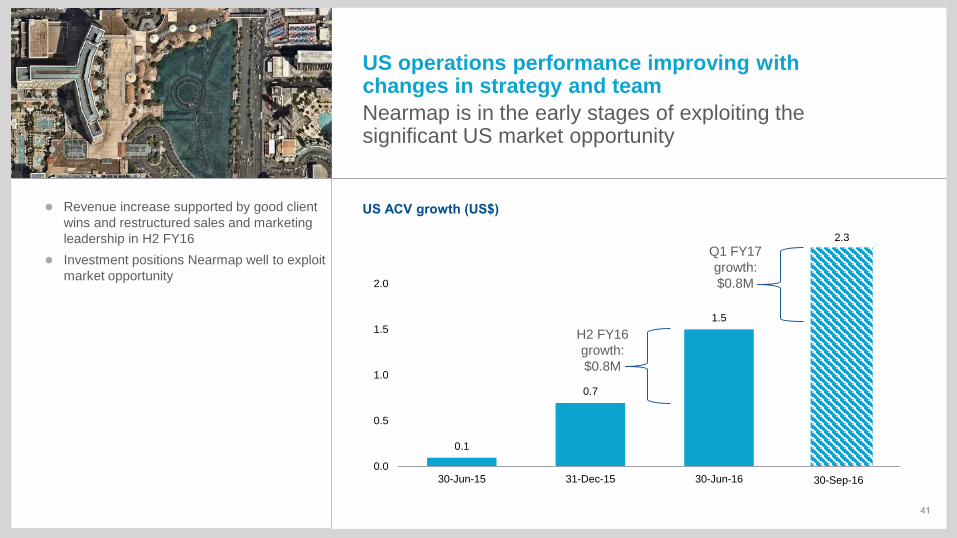
US operations performance improving with changes in strategy and team
Nearmap is in the early stages of exploiting the significant US market opportunity
Revenue increase supported by good client
wins and restructured sales and marketing
leadership in H2 FY16
Investment positions Nearmap well to exploit
market opportunity
US ACV growth (US$)
0.1
0.7
1.5
0.0
0.5
1.0
1.5
2.0
30-Jun-15 31-Dec-15 30-Jun-16
2.3
30-Sep-16
H2 FY16
growth:
$0.8M
Q1 FY17
growth:
$0.8M

42
Content & Technology Strategy – Mr Paul Lapstun, Chief Technology Officer

43
Our location content strategy
We aim to be the world’s leading provider of location content, capturing more of the real world in greater detail than anyone else
High resolution
Low resolution
Out-of-date Current
Premium
Aerial
Aerial &
Satellite
Premium
Satellite
Compared to other providers of large-scale
location content, Nearmap’s strategy is to offer
content which has:
– More area and population
– More frequent updates
– Higher resolution
– Greater accuracy
– Richer attributes

44
Capture efficiency and consistency
Our current-generation camera systems allow us to efficiently and consistently capture large areas of Australia and the United States
Australian
Nearmap coverage
88% of population
21M people
7M dwellings
United States
Nearmap coverage
66% of population
210M people
70M dwellings
10x
Source: Nearmap company information

45
Nearmap 3D
Transition from 2D imaging to 3D imaging, enabled by HyperCamera2
Vertical and four-way oblique imaging system:
– High-quality vertical imaging and oblique
imaging in four cardinal directions
– Higher spatial accuracy than previous
systems
– Compact scanning camera system that fits
in a variety of aircraft.
HyperCamera2 – Vertical and four-way oblique imaging
north
oblique
east
oblique
south
oblique west
oblique
vertical

46
Oblique Imagery 45-degree views in the four cardinal directions

47
Nearmap 3D
Detailed 3D imaging using HyperCamera2
3D imaging system:
– Detailed 3D imaging using multiview
triangulation
– Digital surface model (DSM), 3D point
cloud and 3D mesh outputs
– 3D data compatible with a wide variety of
GIS and CAD systems.
HyperCamera2 – 3D imaging

48

49
Wide-Area HyperCamera2
Next-generation HyperCamera2 will operate at higher altitudes and capture with even greater efficiency
higher and faster
jet operation
state-wide and
country-wide
capture
Current-generation
HyperCamera2 Scanning camera system architecture scales
to very high altitudes and capture efficiencies:
– Wider footprint and higher aircraft speeds
drive efficiencies
– Enables state-wide and country-wide
capture.
Next-generation
HyperCamera2
50
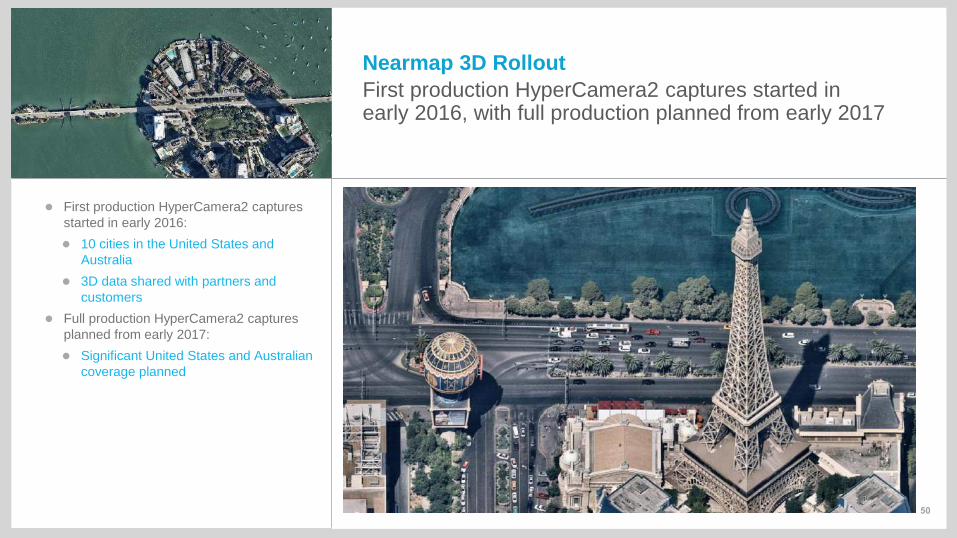
Nearmap 3D Rollout
First production HyperCamera2 captures started in early 2016, with full production planned from early 2017
First production HyperCamera2 captures
started in early 2016:
10 cities in the United States and
Australia
3D data shared with partners and
customers
Full production HyperCamera2 captures
planned from early 2017:
Significant United States and Australian
coverage planned

51
Nearmap 3D Product Strategy – Ms Leah Rankin, VP of Product & Engineering

52
Site assessment and planning for
construction and engineering
Measure cable from street into a high
rise building
Assess location for new wireless tower
Oblique imagery grows location content use cases
Oblique and 3D location content allows our customers to extract more meaning
Location content captured using
HyperCamera2 technology unlocks
additional value to our customers.
The resulting 3D location content data
opens up new opportunities for our content
in emerging industries.
Use cases for urban 3D data
Robust change detection
Semi-automated roof and structure
modelling
Calculation of solar irradiance and
shading, e.g. for solar installations

53
Use Case:
Solar Panel Modelling & Design
Nearmap already provides value to Solar
companies with accurate quoting for solar
panel installation from the desktop –
removing the need to go on site.
As we move from 2D to 3D, our next
generation content takes this to a new
level.
Site visits for quoting and design
Process was very manual
Long sales lead time
Prior to Nearmap
High resolution, up to date imagery
Enables quoting from desktop
No site visit
Still need to go on site for design
Nearmap 2D

54
Use Case:
Solar Panel Modelling & Design
Nearmap 3D gives customers access to
roof pitch & height so they can ensure
accurate placement of panels.
There is also the potential to identify ‘hot
spots’ for solar installations at scale.

55
Use Case:
Solar Panel Modelling & Design
Nearmap 3D allows accurate roof
modelling and the calculation of shading &
solar irradiance to determine solar panel
output and optimal panel placement.

56
Use Case:
Solar Panel Modelling & Design
Nearmap 3D allows accurate roof
modelling and the calculation of shading &
solar irradiance to determine solar panel
output and optimal panel placement.

57
Use Case:
Insurance underwriting
Integrating Nearmap content into their
workflow enables insurance companies
to visualise a home (and the surrounding
area) to make accurate assessments
from their desktop.
Historical imagery allows them to assess
the location before and after a claim.

58
Use Case:
Insurance underwriting
Oblique imagery gives them much
greater visibility of the property as they
can inspect the side of buildings and
other hidden areas.

59
Nearmap 3D supports our land and expand strategy
Through increased uses for existing customers and new market opportunities
Supports our sales strategy
Nearmap 3D is a natural
extension of our ‘land and
expand’ sales strategy
Existing customer growth
3D opens up new opportunities
for existing customers,
increasing their use and
expanding further into their
organisation
Location content market
expansion
3D enables new use cases
which provide an opportunity to
further grow the location
content market

60
Growth Drivers & Outlook – Dr Rob Newman, Managing Director and CEO

61
Increase new customers using our content – Significant opportunities available
with new customers, with the subscription model and platform suiting small, medium
and large customers (scales from a single user to thousands). Strategy underpinned
by a direct-to-customer sales strategy underpinned by marketing and inside sales
teams. Open web access, usage driven licensing and limited requirements for
customisation ensure efficient sales processes
Expanding usage by our existing customers – Growing the number of users in
existing customers through expanding the use cases and integrating into existing
customer workflows
Investing in our product and technology to drive uptake of our content and
expand its use cases in emerging industries – Addition of technology
functionality (HC2), API interfaces with other location content,
Pursuing strategic partnerships – Expanding the application and usage of our
location content
Engagement of our team – Ensuring ongoing success through a highly engaged
Nearmap team
Expanding coverage – Longer term, expanding content and access to new
geographies
Multiple growth drivers
Nearmap is focussed on a number of growth drivers as the base of recurring revenue builds

62
Nearmap upcoming key milestones
Nearmap is focussed on several key priorities in the short term focussed on achieving its long term goals
Continued growth in AustraliaContinued targeted investment in sales and marketing
Drive strong growth in the USWe will consider increased investment in sales and
marketing to drive higher growth
Leverage Nearmap’s location content as core
to rapidly emerging marketsExpand investment in 3D product to drive further
expansion of the addressable market

DisclaimerThe material in this presentation has been prepared by Nearmap Limited ACN 083 702 907 (Nearmap) and is general background information about Nearmap’s activities current as at the date of this presentation. This presentation provides information in summary form only and is not intended to be complete. Nearmap makes no representation or warranty as to the accuracy, completeness or reliability of any of the information contained in this presentation. It is not intended to be relied upon as advice to investors or potential investors and does not take into account the investment objectives, financial situation or needs of any particular investor. Due care and consideration should be undertaken when considering and analysing Nearmap’s financial performance.
This presentation may contain forward-looking statements, including statements regarding Nearmap’s current intentions, plans, expectations, assumptions and beliefs about future events. The words “anticipate”, “believe”, “expect”, “project”, “forecast”, “estimate”, “likely”, “intend”, “outlook”, “should”, “could”, “may”, “target”, “plan” and other similar expressions are intended to identify forward-looking statements. Investors and potential investors are cautioned not to place undue reliance on these forward-looking statements. Nearmap does not undertake any obligation to publicly release the result of any revisions to these forward-looking statements to reflect events or circumstances after the date of this presentation to reflect the occurrence of unanticipated events. While due care has been used in the preparation of forecast information, actual results may vary in a materially positive or negative manner. Forecasts and hypothetical examples are subject to risks, uncertainty and contingencies outside Nearmap’s control and are based on estimates and assumptions that are subject to change.
To the maximum extent permitted by law, each of Nearmap and its directors, officers, employees, agents, contractors, advisers and any other person associated with the preparation of this presentation disclaims any liability, including without limitation any liability arising from fault or negligence, for any errors or misstatements in, or omissions from, this presentation or any direct, indirect or consequential loss howsoever arising from the use or reliance upon the whole of any part of this presentation or otherwise arising in connection with it.
All currency amounts are in AU dollars unless otherwise noted.
Contact DetailsLevel 6
6-8 Underwood Street
Sydney, NSW 2000
Australia
Telephone: +61 (0) 2 8076 0700
Facsimile: +61 (0) 2 8076 0701
Email: [email protected]
Website: www.nearmap.com
57

Appendix – Definitions
64
ACVAnnualised Contract Value = annualised value of all active subscription contracts in effect at a particular date
Lifetime Portfolio ValueLifetime Portfolio Value = (ACV Portfolio x Gross Margin %) / Churn %


