Nebraska Medicaid Expansion Protecting a Critical Infrastructure Supporting Main Street Improving Worker Health and Productivity Allan Jenkins, Ph.D. Professor of Economics University of Nebraska at Kearney Ron Konecny, Ph.D. Professor of Management University of Nebraska at Kearney Prepared for the Nebraska Hospital Association & AARP Nebraska April 1, 2015
Transcript
Nebraska Medicaid Expansion Protecting a Critical Infrastructure
Supporting Main Street
Improving Worker Health and Productivity
Allan Jenkins, Ph.D. Professor of Economics
University of Nebraska at Kearney
Ron Konecny, Ph.D. Professor of Management
University of Nebraska at Kearney
Prepared for the Nebraska Hospital Association & AARP Nebraska
The June 2012 National Federation of Independent Business (NFIB) v. Sebelius Supreme Court decision upholding the constitutionality of the Patient Protection and Affordable Care Act (ACA) included a totally unexpected secondary decision – individual states could decide the issue of Medicaid expansion. The court decision set off a flurry of economic impact studies as individual states sought to identify the costs and benefits before deciding whether to proceed with expansion. It was a substantial decision – expanding Medicaid coverage to all citizens with incomes less than 138 percent of the Federal Poverty Level (FPL) would extend benefits to 16 – 17 million low-income people across the nation. [1] Medicaid expansion in Nebraska would extend coverage to approximately 79,593 by FY2019-20. [2]
The state-level impact studies following the Supreme Court decision generally focused on three major topics. First was the immediate budgetary impact of expansion on each state; second was the likely decrease in the amount of bad debt/charity care for providers; and third was the estimation of state economic and employment impacts stemming from the injection of federal funds. Impacts were generally addressed through the development of state-specific IMPLAN, REMI, or RIMS models.
There was a significant time pressure on the expansion decision because the ACA temporarily altered the traditional Federal Medical Assistance Percentage (FMAP) formula. Medicaid is jointly funded by the federal government and the state, but the federal share is not uniform. The FMAP formula is structured so the federal government pays a larger portion of Medicaid costs in states with lower per capita incomes relative to the national average. FMAP rates have a statutory minimum of 50 percent and a statutory maximum of 83 percent. For FY 2014, regular FMAP rates ranged from 50.00 percent to 73.05 percent. Nebraska’s FMAP for FY 2015 is 53.27 percent. Under the ACA, states would receive 100 percent FMAP for the cost of providing benchmark coverage to newly eligible individuals from 2014 through 2016. For the newly-eligible, the FMAP rate will phase down to 95 percent in 2017, 94 percent in 2018, 93 percent in 2019, and 90 percent in 2020 and beyond. [3]
Medicaid expansion was included in the ACA as part of an overall strategy to decrease the number of uninsured Americans. The strong economic growth of the 1990s had increased the non-elderly adult population with access to employment-based health benefits and decreased the uninsured rate. However, the economy became more volatile after 2000, impacting both the unemployment rate and the uninsured rate. Health insurance coverage was also influenced by the continuing decrease in the number of employers offering health benefits. Employment-based health insurance is never evenly distributed across income groups. For low-wage workers, only 20 percent are even offered employment-related insurance. Because the cost of the employee premium contribution is high relative to total compensation for these workers, the take-up rate is noticeably low.
2
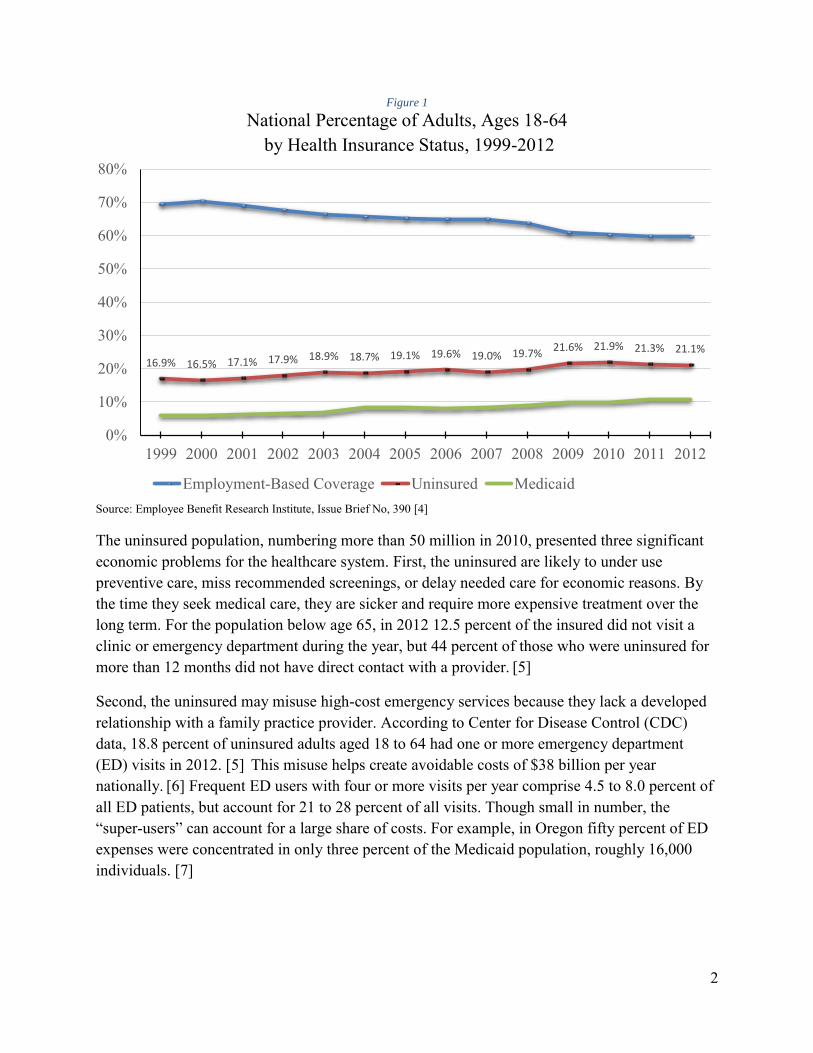
Figure 1
National Percentage of Adults, Ages 18-64 by Health Insurance Status, 1999-2012
Source: Employee Benefit Research Institute, Issue Brief No, 390 [4]
The uninsured population, numbering more than 50 million in 2010, presented three significant economic problems for the healthcare system. First, the uninsured are likely to under use preventive care, miss recommended screenings, or delay needed care for economic reasons. By the time they seek medical care, they are sicker and require more expensive treatment over the long term. For the population below age 65, in 2012 12.5 percent of the insured did not visit a clinic or emergency department during the year, but 44 percent of those who were uninsured for more than 12 months did not have direct contact with a provider. [5]
Second, the uninsured may misuse high-cost emergency services because they lack a developed relationship with a family practice provider. According to Center for Disease Control (CDC) data, 18.8 percent of uninsured adults aged 18 to 64 had one or more emergency department (ED) visits in 2012. [5] This misuse helps create avoidable costs of $38 billion per year nationally. [6] Frequent ED users with four or more visits per year comprise 4.5 to 8.0 percent of all ED patients, but account for 21 to 28 percent of all visits. Though small in number, the “super-users” can account for a large share of costs. For example, in Oregon fifty percent of ED expenses were concentrated in only three percent of the Medicaid population, roughly 16,000 individuals. [7]
Percent of Workers Offered Employer Sponsored Health Insurance Coverage (2007 – 2008)
Source: Social Security Administration [8]
Third, the uninsured are often unable to pay for healthcare services received, creating billions of dollars in bad debt/charity care. In 2013, the uninsured were only able to pay for 21 percent of medical costs incurred, generating $84.9 billion in uncovered costs for hospitals, clinics, and physicians. [9] Charity care is care for which hospitals never expected reimbursement. Bad debt occurs when the provider cannot obtain reimbursement for care provided because patients are unable or unwilling to pay their bills. In 2013, the American Hospital Association estimated that hospitals incurred $46.4 billion nationally in bad debt/charity care, equaling 5.9 percent of their total expenses. [10] In 1980, hospitals were faced with $3.9 billion in bad debt/charity care ($11.03 billion in 2013 dollars). By 2013 it had increased to $46.4 billion, thus roughly quadrupling between 1980 and 2013 in real terms.
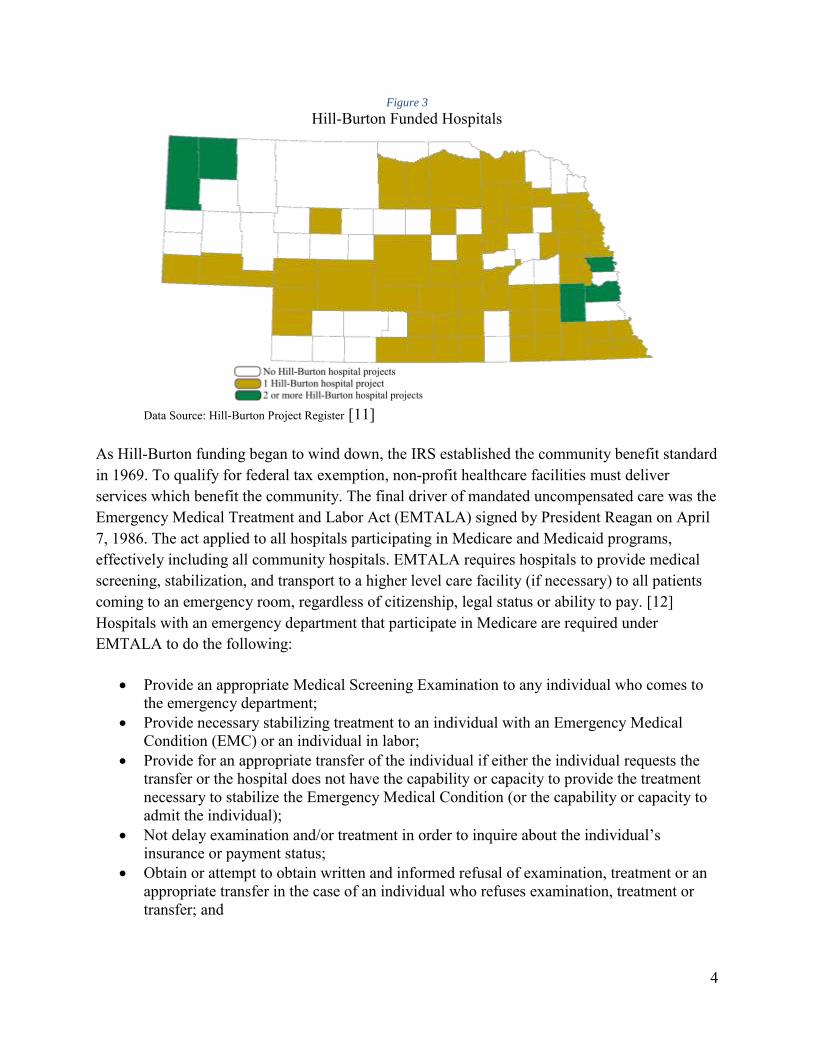
Community hospitals cannot unilaterally address the issue of bad debt/charity care because it is a consequence of the community-benefit component allowing hospitals to maintain their not-for-profit status. The Hill-Burton Act of 1946 provided government grants and low-interest loans to non-profit hospitals. In exchange for this financing, Hill-Burton required that non-profit hospitals provide charity care or discounted care for low-income patients. By the time expenditures had ended in 1975, Hill-Burton had provided $4.6 billion in grants and $1.5 billion in loans to facilities in more than 4,000 communities. Hill-Burton provided vital funding for the construction of 72 Nebraska hospitals. [11]
0%
20%
40%
60%
80%
100%
Bottom 2 3 4 5 6 7 8 9 TopWage decile
Percent of workers offered EmployerSponsored Health Insurance coverage
Percent of workers enrolled in anEmployer Sponsored Health Insuranceplan
4
Figure 3
Hill-Burton Funded Hospitals
Data Source: Hill-Burton Project Register [11]
As Hill-Burton funding began to wind down, the IRS established the community benefit standard in 1969. To qualify for federal tax exemption, non-profit healthcare facilities must deliver services which benefit the community. The final driver of mandated uncompensated care was the Emergency Medical Treatment and Labor Act (EMTALA) signed by President Reagan on April 7, 1986. The act applied to all hospitals participating in Medicare and Medicaid programs, effectively including all community hospitals. EMTALA requires hospitals to provide medical screening, stabilization, and transport to a higher level care facility (if necessary) to all patients coming to an emergency room, regardless of citizenship, legal status or ability to pay. [12] Hospitals with an emergency department that participate in Medicare are required under EMTALA to do the following:
Provide an appropriate Medical Screening Examination to any individual who comes to the emergency department;
Provide necessary stabilizing treatment to an individual with an Emergency Medical Condition (EMC) or an individual in labor;
Provide for an appropriate transfer of the individual if either the individual requests the transfer or the hospital does not have the capability or capacity to provide the treatment necessary to stabilize the Emergency Medical Condition (or the capability or capacity to admit the individual);
Not delay examination and/or treatment in order to inquire about the individual’s insurance or payment status;
Obtain or attempt to obtain written and informed refusal of examination, treatment or an appropriate transfer in the case of an individual who refuses examination, treatment or transfer; and
5
Not take adverse action against a physician or qualified medical personnel who refuses to transfer an individual with an emergency medical condition, or against an employee who reports a violation of these requirements.
Hospitals that fail to comply with EMTALA requirements can be fined, sued by other facilities that have suffered a financial loss as a result of patient dumping, or sued by any individual who suffers harm as a result of the hospital's failure to comply. Non-compliance with EMTALA will lead Centers for Medicare & Medicaid Services (CMS) to initiate a host of sanctions and fines, up to complete termination from the Medicare/Medicaid programs.
Non-hospital providers including community clinics and private physician clinics are also impacted by uncompensated care, facing approximately $34 billion in losses in 2013. [9] Providers must recoup these losses by increasing costs for those patients with insurance, a de facto silent tax or asking for assistance from government. This hidden tax is referred to as “Cost Shifting” in economics. There is empirical evidence that cost shifting takes place: Zwangziger et al. found that both not-for-profit and for-profit hospitals increased private-pay rates in response to Medicare payment rate reductions. [13] A Kaiser Family Foundation report calculated that each uninsured individual received $1,702 in implicitly subsidized uncompensated care, at a total cost of $69.4 billion in 2013. [9]
Bad debt/charity care is certainly influenced by unexpected events. In 2010, there were 37.9 million injury-related visits to emergency departments, accounting for 30 percent of all ED visits. [14] There was no insurance coverage in 16 percent of ED visits. [15] Rural areas tend to have high rates of motor vehicle accidents. One in every 46 licensed drivers in Nebraska is involved in a motor vehicle collision each year, with 211 people killed and 16,083 injured in traffic accidents in 2013. According to the National Safety Council formula for calculable costs, motor vehicle crashes cost Nebraska over $727 million in 2013. [16]
Events triggering the necessity of medical care are not uniform. An accident or medically-necessary event creating less than $500 in costs can be addressed over time even by families lacking insurance. However, few accidents and interventions are that small - the average medical cost of an accident in 2013 was $4,414 per injured person. [17] There are also extraordinarily expensive cases. An analysis of South Dakota Medicaid inpatient hospital statistics revealed that 2.7 percent of hospital inpatient stays were responsible for 49 percent of total inpatient payments. [18] For these economically catastrophic events, uninsured families have no realistic chance of paying the bill. Every uninsured single adult or family thus presents an ongoing financial risk to the local community hospital. For the wider society, bad debt/charity care actually creates a “silent tax” that influences insurance premiums and taxes. Hospitals cover a portion of bad debt/charity care by subsidy through higher-than-necessary prices for patients with quality insurance. Government (both state
6
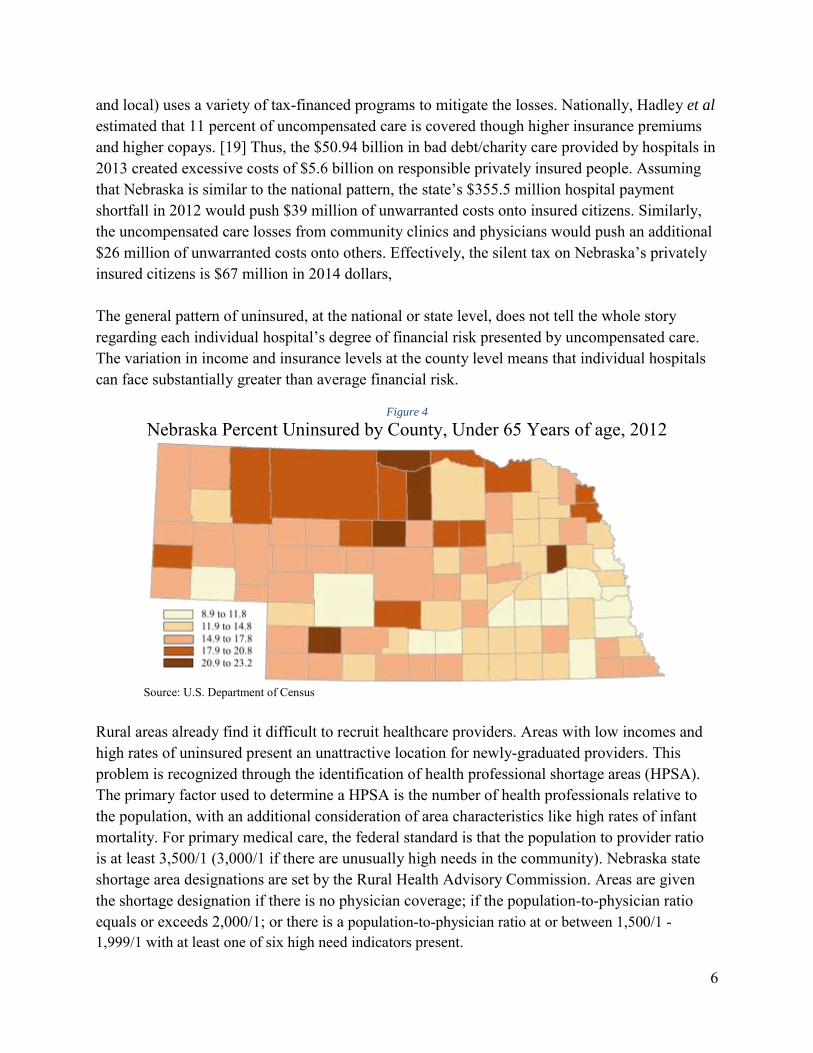
and local) uses a variety of tax-financed programs to mitigate the losses. Nationally, Hadley et al estimated that 11 percent of uncompensated care is covered though higher insurance premiums and higher copays. [19] Thus, the $50.94 billion in bad debt/charity care provided by hospitals in 2013 created excessive costs of $5.6 billion on responsible privately insured people. Assuming that Nebraska is similar to the national pattern, the state’s $355.5 million hospital payment shortfall in 2012 would push $39 million of unwarranted costs onto insured citizens. Similarly, the uncompensated care losses from community clinics and physicians would push an additional $26 million of unwarranted costs onto others. Effectively, the silent tax on Nebraska’s privately insured citizens is $67 million in 2014 dollars, The general pattern of uninsured, at the national or state level, does not tell the whole story regarding each individual hospital’s degree of financial risk presented by uncompensated care. The variation in income and insurance levels at the county level means that individual hospitals can face substantially greater than average financial risk.
Figure 4
Nebraska Percent Uninsured by County, Under 65 Years of age, 2012
Source: U.S. Department of Census
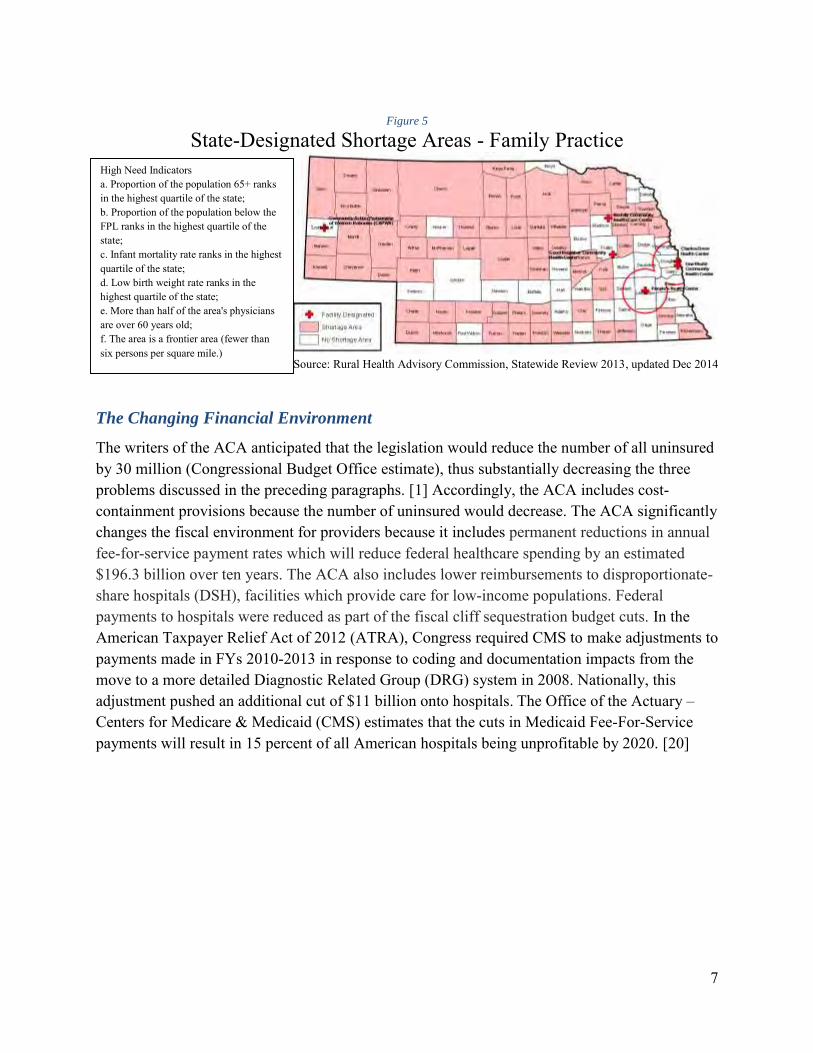
Rural areas already find it difficult to recruit healthcare providers. Areas with low incomes and high rates of uninsured present an unattractive location for newly-graduated providers. This problem is recognized through the identification of health professional shortage areas (HPSA). The primary factor used to determine a HPSA is the number of health professionals relative to the population, with an additional consideration of area characteristics like high rates of infant mortality. For primary medical care, the federal standard is that the population to provider ratio is at least 3,500/1 (3,000/1 if there are unusually high needs in the community). Nebraska state shortage area designations are set by the Rural Health Advisory Commission. Areas are given the shortage designation if there is no physician coverage; if the population-to-physician ratio equals or exceeds 2,000/1; or there is a population-to-physician ratio at or between 1,500/1 - 1,999/1 with at least one of six high need indicators present.
Source: Rural Health Advisory Commission, Statewide Review 2013, updated Dec 2014
The Changing Financial Environment
The writers of the ACA anticipated that the legislation would reduce the number of all uninsured by 30 million (Congressional Budget Office estimate), thus substantially decreasing the three problems discussed in the preceding paragraphs. [1] Accordingly, the ACA includes cost-containment provisions because the number of uninsured would decrease. The ACA significantly changes the fiscal environment for providers because it includes permanent reductions in annual fee-for-service payment rates which will reduce federal healthcare spending by an estimated $196.3 billion over ten years. The ACA also includes lower reimbursements to disproportionate-share hospitals (DSH), facilities which provide care for low-income populations. Federal payments to hospitals were reduced as part of the fiscal cliff sequestration budget cuts. In the American Taxpayer Relief Act of 2012 (ATRA), Congress required CMS to make adjustments to payments made in FYs 2010-2013 in response to coding and documentation impacts from the move to a more detailed Diagnostic Related Group (DRG) system in 2008. Nationally, this adjustment pushed an additional cut of $11 billion onto hospitals. The Office of the Actuary – Centers for Medicare & Medicaid (CMS) estimates that the cuts in Medicaid Fee-For-Service payments will result in 15 percent of all American hospitals being unprofitable by 2020. [20]
High Need Indicators a. Proportion of the population 65+ ranks in the highest quartile of the state; b. Proportion of the population below the FPL ranks in the highest quartile of the state; c. Infant mortality rate ranks in the highest quartile of the state; d. Low birth weight rate ranks in the highest quartile of the state; e. More than half of the area's physicians are over 60 years old; f. The area is a frontier area (fewer than six persons per square mile.)
8
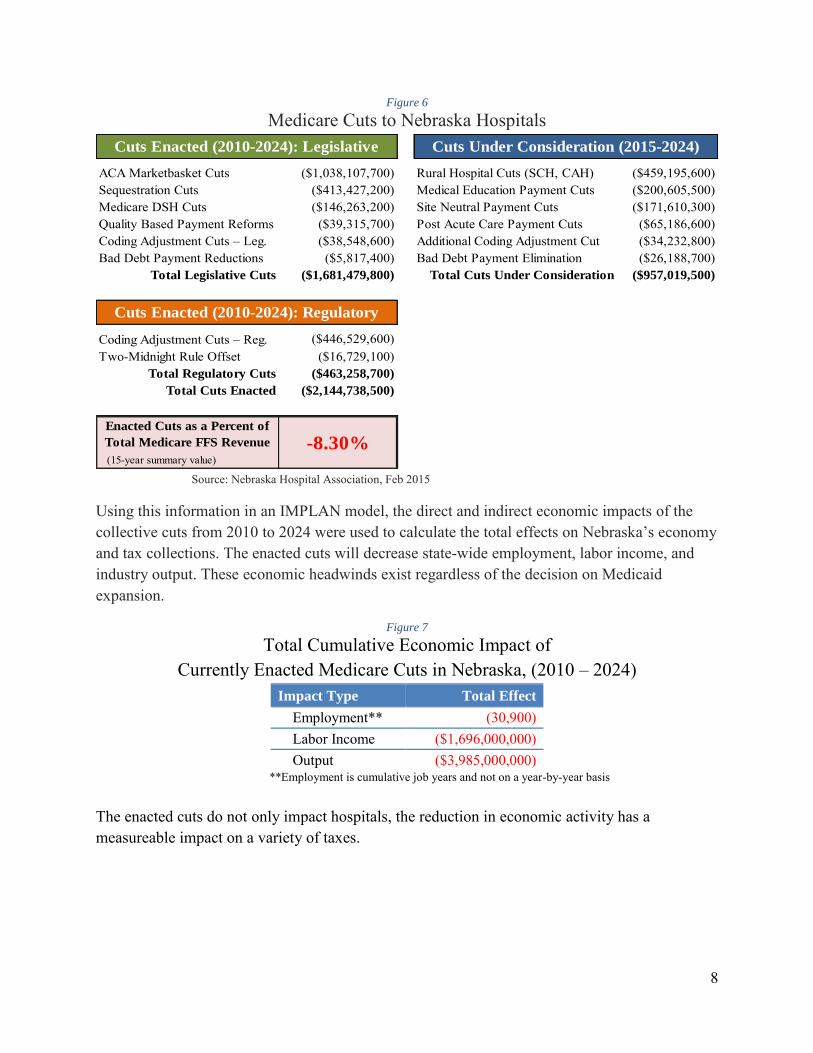
Figure 6
Medicare Cuts to Nebraska Hospitals
ACA Marketbasket Cuts Rural Hospital Cuts (SCH, CAH) ($459,195,600)Sequestration Cuts Medical Education Payment Cuts ($200,605,500)Medicare DSH Cuts Site Neutral Payment Cuts ($171,610,300)Quality Based Payment Reforms Post Acute Care Payment Cuts ($65,186,600)Coding Adjustment Cuts – Leg. Additional Coding Adjustment Cut ($34,232,800)Bad Debt Payment Reductions Bad Debt Payment Elimination ($26,188,700)
Total Legislative Cuts Total Cuts Under Consideration ($957,019,500)
Cuts Enacted (2010-2024): Legislative Cuts Under Consideration (2015-2024)
($1,038,107,700)($413,427,200)($146,263,200)
($463,258,700)
($2,144,738,500)
Enacted Cuts as a Percent of
Total Medicare FFS Revenue -8.30%
($38,548,600)($5,817,400)
($1,681,479,800)
Cuts Enacted (2010-2024): Regulatory
($446,529,600)($16,729,100)
Source: Nebraska Hospital Association, Feb 2015
Using this information in an IMPLAN model, the direct and indirect economic impacts of the collective cuts from 2010 to 2024 were used to calculate the total effects on Nebraska’s economy and tax collections. The enacted cuts will decrease state-wide employment, labor income, and industry output. These economic headwinds exist regardless of the decision on Medicaid expansion.
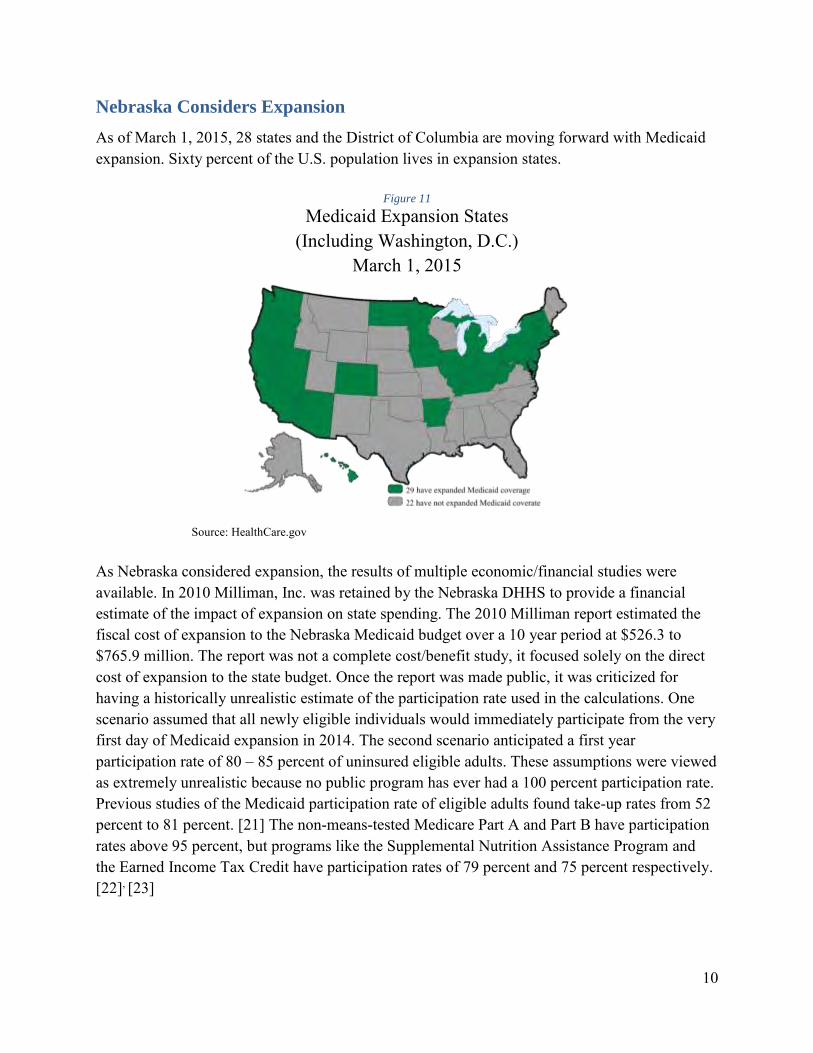
Figure 7
Total Cumulative Economic Impact of Currently Enacted Medicare Cuts in Nebraska, (2010 – 2024)
Impact Type Total Effect
Employment** (30,900) Labor Income ($1,696,000,000) Output ($3,985,000,000)
**Employment is cumulative job years and not on a year-by-year basis
The enacted cuts do not only impact hospitals, the reduction in economic activity has a measureable impact on a variety of taxes.
9
Figure 8
Total Cumulative Tax Impact of Currently Enacted Medicare Cuts in Nebraska, (2010 – 2024) State and Local Taxes Federal Taxes
NE Income Tax ($32,945,000) US Personal Income Tax ($45,732,000) NE Sales Tax ($32,222,000) US Corporate Profit Tax ($31,416,000) NE Property Tax ($35,959,000) Other US Taxes ($92,747,000) NE Motor Vehicle ($2,776,000) NE Corporate Taxes ($1,640,000)
Other Nebraska Taxes ($10,911,000)
Total Nebraska Tax ($116,453,000) Total Federal Tax ($169,895,000)
The enacted cuts are substantial, but are not the end of the story. Cost containment pressures are not going to end in the near future. The sheer size of healthcare spending in the federal budget makes it an attractive target for a variety of future cuts.
Figure 9
Total Cumulative Economic Impact of Medicare Cuts Under Consideration in Nebraska, (2015 – 2024)
Impact Type Total Effect
Employment (13,500) Labor Income ($742,000,000) Output ($1,743,000,000)
**Employment is cumulative job years and not on a year-by-year basis
Figure 10
Total Cumulative Tax Impact of Medicare Cuts Under Consideration in Nebraska, (2015 – 2024)
State and Local Taxes Federal Taxes
NE Income Tax ($14,409,000) US Personal Income Tax ($20,001,000) NE Sales Tax ($14,093,000) US Corporate Profit Tax ($13,740,000) NE Property Tax ($15,727,000) Other US Taxes ($40,563,000) NE Motor Vehicle ($1,214,000) NE Corporate Taxes ($717,000)
Other Nebraska Taxes ($4,772,000)
Total Nebraska Tax ($50,932,000) Total Federal Tax ($74,304,000)
10
Nebraska Considers Expansion
As of March 1, 2015, 28 states and the District of Columbia are moving forward with Medicaid expansion. Sixty percent of the U.S. population lives in expansion states.
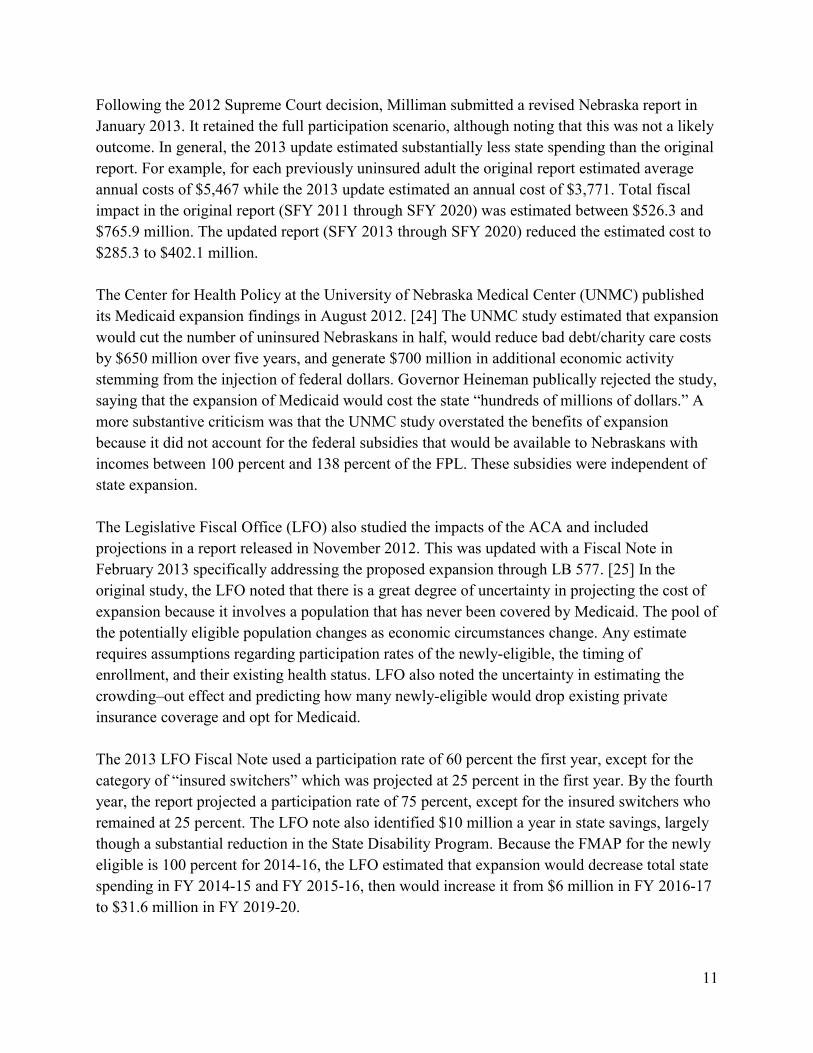
Figure 11
Medicaid Expansion States (Including Washington, D.C.)
March 1, 2015
Source: HealthCare.gov As Nebraska considered expansion, the results of multiple economic/financial studies were available. In 2010 Milliman, Inc. was retained by the Nebraska DHHS to provide a financial estimate of the impact of expansion on state spending. The 2010 Milliman report estimated the fiscal cost of expansion to the Nebraska Medicaid budget over a 10 year period at $526.3 to $765.9 million. The report was not a complete cost/benefit study, it focused solely on the direct cost of expansion to the state budget. Once the report was made public, it was criticized for having a historically unrealistic estimate of the participation rate used in the calculations. One scenario assumed that all newly eligible individuals would immediately participate from the very first day of Medicaid expansion in 2014. The second scenario anticipated a first year participation rate of 80 – 85 percent of uninsured eligible adults. These assumptions were viewed as extremely unrealistic because no public program has ever had a 100 percent participation rate. Previous studies of the Medicaid participation rate of eligible adults found take-up rates from 52 percent to 81 percent. [21] The non-means-tested Medicare Part A and Part B have participation rates above 95 percent, but programs like the Supplemental Nutrition Assistance Program and the Earned Income Tax Credit have participation rates of 79 percent and 75 percent respectively. [22], [23]
11
Following the 2012 Supreme Court decision, Milliman submitted a revised Nebraska report in January 2013. It retained the full participation scenario, although noting that this was not a likely outcome. In general, the 2013 update estimated substantially less state spending than the original report. For example, for each previously uninsured adult the original report estimated average annual costs of $5,467 while the 2013 update estimated an annual cost of $3,771. Total fiscal impact in the original report (SFY 2011 through SFY 2020) was estimated between $526.3 and $765.9 million. The updated report (SFY 2013 through SFY 2020) reduced the estimated cost to $285.3 to $402.1 million. The Center for Health Policy at the University of Nebraska Medical Center (UNMC) published its Medicaid expansion findings in August 2012. [24] The UNMC study estimated that expansion would cut the number of uninsured Nebraskans in half, would reduce bad debt/charity care costs by $650 million over five years, and generate $700 million in additional economic activity stemming from the injection of federal dollars. Governor Heineman publically rejected the study, saying that the expansion of Medicaid would cost the state “hundreds of millions of dollars.” A more substantive criticism was that the UNMC study overstated the benefits of expansion because it did not account for the federal subsidies that would be available to Nebraskans with incomes between 100 percent and 138 percent of the FPL. These subsidies were independent of state expansion. The Legislative Fiscal Office (LFO) also studied the impacts of the ACA and included projections in a report released in November 2012. This was updated with a Fiscal Note in February 2013 specifically addressing the proposed expansion through LB 577. [25] In the original study, the LFO noted that there is a great degree of uncertainty in projecting the cost of expansion because it involves a population that has never been covered by Medicaid. The pool of the potentially eligible population changes as economic circumstances change. Any estimate requires assumptions regarding participation rates of the newly-eligible, the timing of enrollment, and their existing health status. LFO also noted the uncertainty in estimating the crowding–out effect and predicting how many newly-eligible would drop existing private insurance coverage and opt for Medicaid. The 2013 LFO Fiscal Note used a participation rate of 60 percent the first year, except for the category of “insured switchers” which was projected at 25 percent in the first year. By the fourth year, the report projected a participation rate of 75 percent, except for the insured switchers who remained at 25 percent. The LFO note also identified $10 million a year in state savings, largely though a substantial reduction in the State Disability Program. Because the FMAP for the newly eligible is 100 percent for 2014-16, the LFO estimated that expansion would decrease total state spending in FY 2014-15 and FY 2015-16, then would increase it from $6 million in FY 2016-17 to $31.6 million in FY 2019-20.
12
Kaiser Family Foundation (KFF) released a national and state-by-state analysis of expansion on November 1, 2012. [26] KFF estimated the incremental cost of Medicaid expansion for each state, including an adjustment for an anticipated reduction in uncompensated care. The report findings suggested that for most states the Medicaid expansion with other provisions of the ACA would significantly reduce the number of uninsured at a modest net cost. For Nebraska, the study predicted a 47.6 percent reduction in the number of uninsured at a net cost (after adjusting for the decrease in uncompensated care) of a 1.1 percent increase in state spending on Medicaid. In April 2013, the Omaha-based Platte Institute released its own report on Medicaid expansion. [27] The report focused on the variability of estimates arising from earlier studies, and cautioned policy-makers to be mindful of the considerable uncertainty regarding the eventual costs and benefits of expansion. It suggested a policy of waiting to see what happens in those states that have decided to move forward with expansion to obtain a clearer picture of costs and participation rates. Further, the Platte Institute report suggests that the “likelihood of continued federal funding should be challenged as federal budget pressures will likely reduce Medicaid payments in the future.” The report also challenges the idea that there will be any significant decrease in uncompensated care. Unlike the other reports, the Platte Institute study had a strong normative component, arguing that regardless of fiscal impact Medicaid expansion should be opposed because it will increase Nebraskans’ dependence upon the federal government.
Early Findings on the Impact of 2014 Expansion
The impact of expansion is beginning to emerge as data from the first two quarters of 2014 becomes available. Regarding the uninsured, Medicaid expansion states with a state-run exchange have seen the largest decreases, with the number of uninsured falling from 16.1 percent in 2013 to 12.1 percent in the second quarter of 2014 (a 25 percent decrease). [28] A study published in the New England Journal of Medicine indicated that the national uninsured rate for those ages 18 to 64 fell by 22 percent, falling from 21.0 percent in September 2013 to 16.3 percent in April 2014. [29] For those with incomes between 139 percent and 400 percent of the FPL, coverage gains were significant in states with or without Medicaid expansion. This finding is expected since it is consistent with the subsidies provided by the ACA for private insurance in this income range, regardless of state decisions regarding expansion. The study also found that in expansion states the uninsured rate for those at or below 138 percent of the FPL decreased twice as much as in non-expansion states. On the important issue of bad debt/charity care, multiple studies are showing a 25 – 40 percent decrease in expansion states. Research prepared by DHHS Office of the Assistant Secretary for Planning and Evaluation (ASPE) presented a substantial collection of information on this issue. [30] Using data from the American Hospital Association and cost reports from CMS, ASPE estimated that hospitals had bad debt/charity care costs between $46 and $51 billion in 2012. The report then used direct earnings data from five large for-profit hospital groups, survey
13
information from three state hospital associations, and statistics from a 465 hospital databank to identify the early impacts of expansion. The for-profit hospitals included: Community Health Systems (206 hospitals in 29 states); Hospital Corporation of America (165 hospitals and 115 surgery centers in 20 states); Tenet Healthcare Corporation (80 hospitals and 200 outpatient centers in 14 states); LifePoint Hospitals (60 hospitals in 20 states) and Universal Health Services (25 hospitals, 195 behavioral health facilities, three surgery centers in 37 states). Survey data came from the Arizona Healthcare and Hospital Association, the Colorado Hospital Association, and the Arkansas Hospital Association. The third source of information included data released by the Colorado Hospital Association from its shared data-bank of financial and utilization figures from 465 hospitals across 30 states. Participating hospitals in the data-bank were located in both expansion and non-expansion states - the 30 states included 15 states in each category. ASPE estimates that 2014 hospital bad debt/charity care costs are $5.7 billion lower than the baseline, a 16 percent reduction. The report notes that $4.2 billion of this reduction is from states which expanded Medicaid at the beginning of FY 2014. Expansion states were seeing a 25 percent reduction from the baseline. The non-expansion states saw a much smaller decrease of $1.5 billion, representing a nine percent reduction from baseline spending. In 2012, Nebraska hospitals provided $355.5 million in bad debt/charity care ($366.6 million in 2014 dollars). If the national pattern holds true for the state, then Nebraska hospitals should see a nine percent drop in the $366.6 million. If Nebraska expanded Medicaid, it could expect a drop of 25 percent. The expansion impact is the difference between the two outcomes, and would create a 16 percent decrease, or $59 million dollars, in Nebraska hospital bad debt/charity care. According to ASPE, both the reported financial data and survey responses indicated substantial differences in expansion verses non-expansion states. Uninsured hospital admissions in expansion states fell by 28 to 33 percent relative to the previous year. In non-expansion states, the change in uninsured hospital admissions ranged from a seven percent decrease to a six percent increase. The data for Q2 2014 was more limited, but the available data indicated that the gap between the two sets of states was even greater for Q2 comparisons. Expansion states saw decreases in uninsured admissions ranging from 48 to 72 percent; non-expansion states had decreases of zero to 14 percent. While the ASPE brief focused primarily on changes in uncompensated care, it also noted that hospital finances are affected by changes in utilization related to the expansion of insurance coverage. Increased volumes from higher utilization generally strengthen a hospital’s financial picture because of the fixed costs associated with any facility. Cost containment efforts by government and private insurers have decreased the average hospital stay over the past two decades from six days to 4.8 days. This decrease has negatively impacted hospitals’ financial metrics because they have high fixed costs and have limited opportunities to adjust variable costs like labor. Even with few patients, the hospital must be staffed 24/7.
14
Figure 12
Percent Change in the Volume of Uninsured Admissions Q1 2013 to Q1 2014
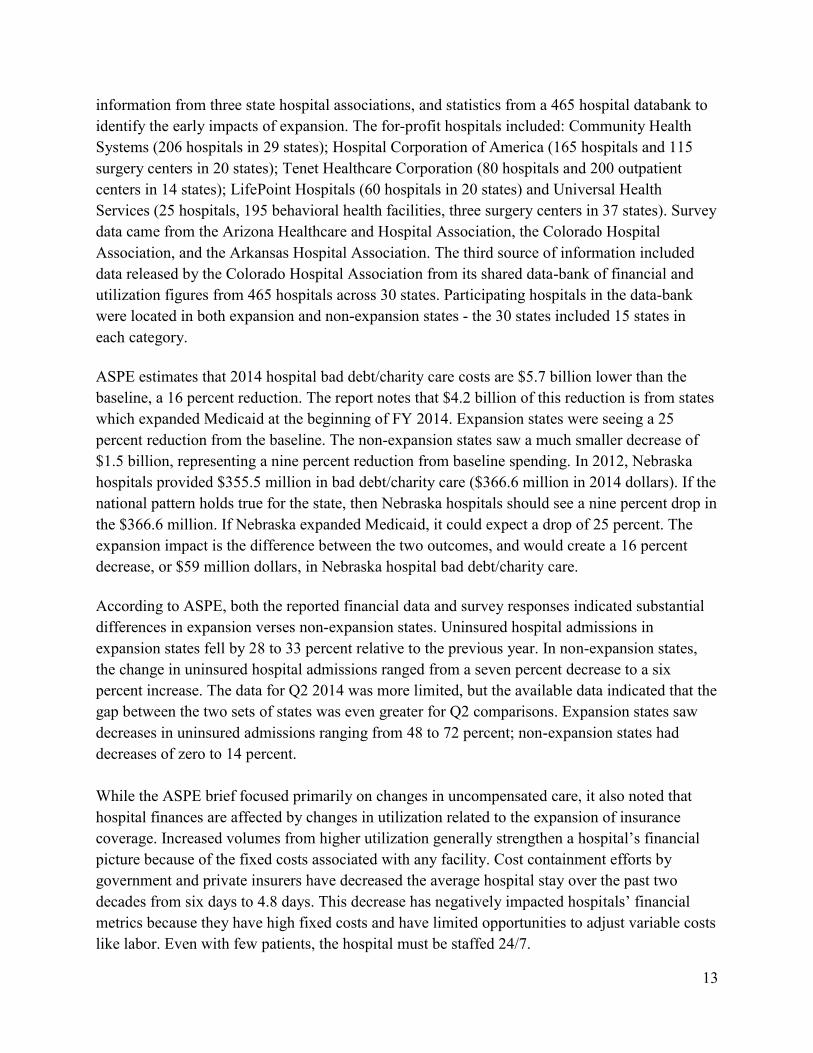
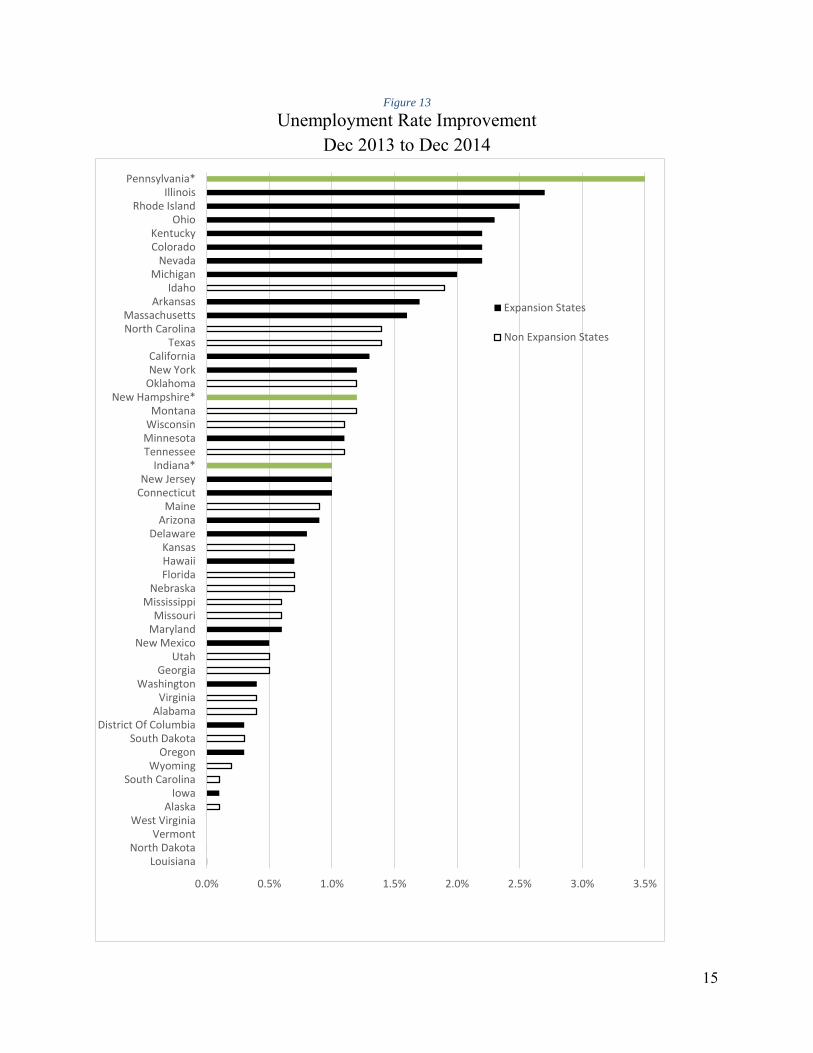
Source: U.S. Department of Health & Human Services [30] The ASPE brief examined prior insurance expansions to provide guidance on expected changes in hospital utilization for the previously uninsured. One situation already exists in which the previously uninsured abruptly gain coverage – as individuals turn 65 and automatically qualify for Medicare. This newly covered group has a relative increase in admissions of 12-20 percent, with the increase particularly pronounced for those with chronic conditions. Evidence is also available from states which moved forward with Medicaid expansion before 2014. For example, evidence from Oregon’s early expansion showed that coverage increased the likelihood of being admitted to the hospital from 6.7 percent to 8.8 percent. The expansion of health insurance in Massachusetts did not appear to increase overall hospital utilization, though it did decrease preventable hospitalizations. A Wisconsin public insurance plan for low-income uninsured childless adults initiated in 2009 found that in the first year of coverage outpatient visits increased 29 percent and emergency department visits increased 46 percent while inpatient hospitalizations declined 59 percent. [30] Expansion states are seeing generally robust economic growth. Eight of the ten states with the largest percentage decrease in the unemployment rate in 2014 had expanded Medicaid by January 1, 2014. Likewise, seven of the ten states with the greatest decrease in Chapter 7 bankruptcies in 2014 were states that had expanded by January 1. Another state in the top ten bankruptcy reduction list was New Hampshire, which expanded on August 15, 2014.
-35%
-30%
-25%
-20%
-15%
-10%
-5%
0%
5%
10%
CommunityHealthSystem
HCA LifePoint Tenet CJA Survey ColordoHospitals
ArkansasHospitals
Overall Medicaid Expansion States Medicaid Non-Expansion States
15
Figure 13
Unemployment Rate Improvement Dec 2013 to Dec 2014
0.0% 0.5% 1.0% 1.5% 2.0% 2.5% 3.0% 3.5%
LouisianaNorth Dakota
VermontWest Virginia
AlaskaIowa
South CarolinaWyoming
OregonSouth Dakota
District Of ColumbiaAlabama
VirginiaWashington
GeorgiaUtah
New MexicoMarylandMissouri
MississippiNebraska
FloridaHawaiiKansas
DelawareArizona
MaineConnecticutNew Jersey
Indiana*TennesseeMinnesotaWisconsinMontana
New Hampshire*OklahomaNew YorkCalifornia
TexasNorth CarolinaMassachusetts
ArkansasIdaho
MichiganNevada
ColoradoKentucky
OhioRhode Island
IllinoisPennsylvania*
Expansion States
Non Expansion States
16
Figure 14
Percent Improvement in Bankruptcy Rate Dec 2013 to Dec 2014
0% 5% 10% 15% 20% 25% 30%
SCWVCTOKKYWISDALORDEARUT
NMNJVANEIA
TNPAIL
MTMO
TXOHWANCMEIN
GANY
MNAZ
MDFLIDLARIKS
NDMSMI
MANHNVHIAKCOWYCAVT
Expansion States
Non ExpansionStatesPartial YearExpansion States
17
Collectively, these studies indicate that the ACA has reduced the number of uninsured, is improving access to appropriate care and preventive services, is having a substantial positive impact on provider revenue, and is reducing the difficulties that families have in paying medical bills.
Evidence from Expansions Prior to 2014
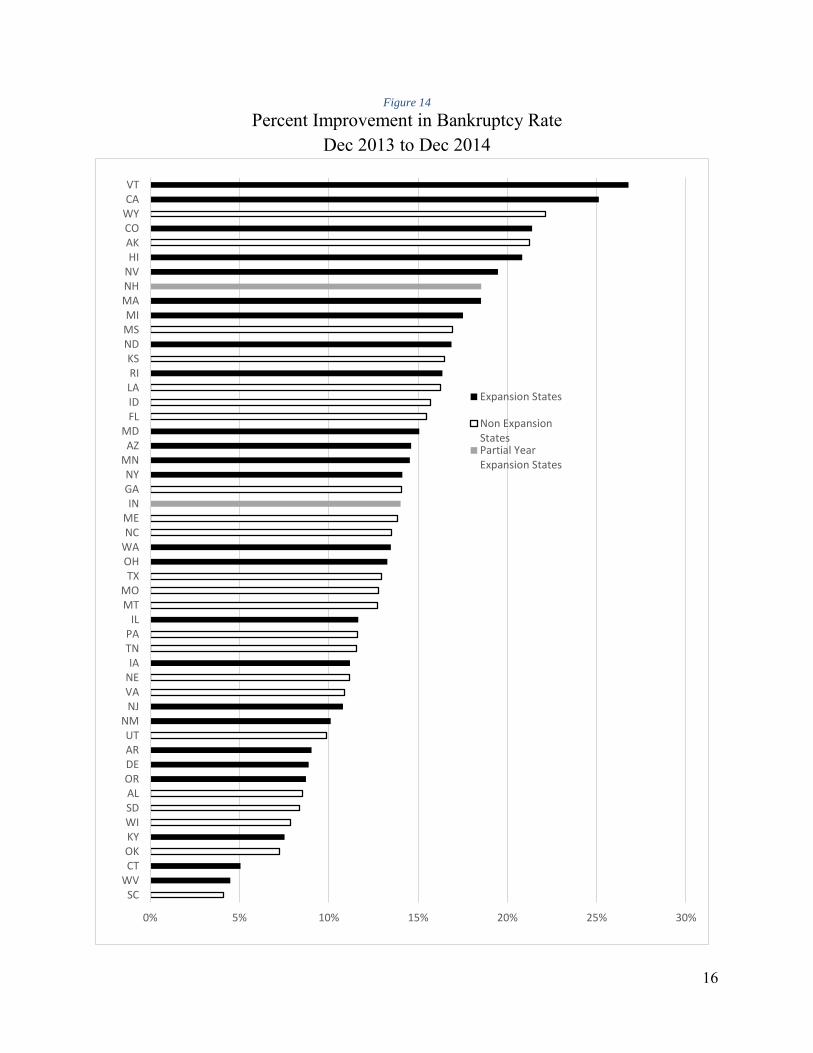
Prior to the enactment of the ACA, most state Medicaid programs excluded low-income adults without dependent children unless they were disabled or chronically ill. However, some states provided coverage to this population with state-only dollars, tobacco-settlement funds, or under special Medicaid waivers. Waivers allowed states to experiment through actions like putting ceilings on enrollment, requiring beneficiary payment of premiums and cost sharing, and limiting the services included in the benefit package.
Figure 15
Coverage for Low-Income Childless Adults in Selected States
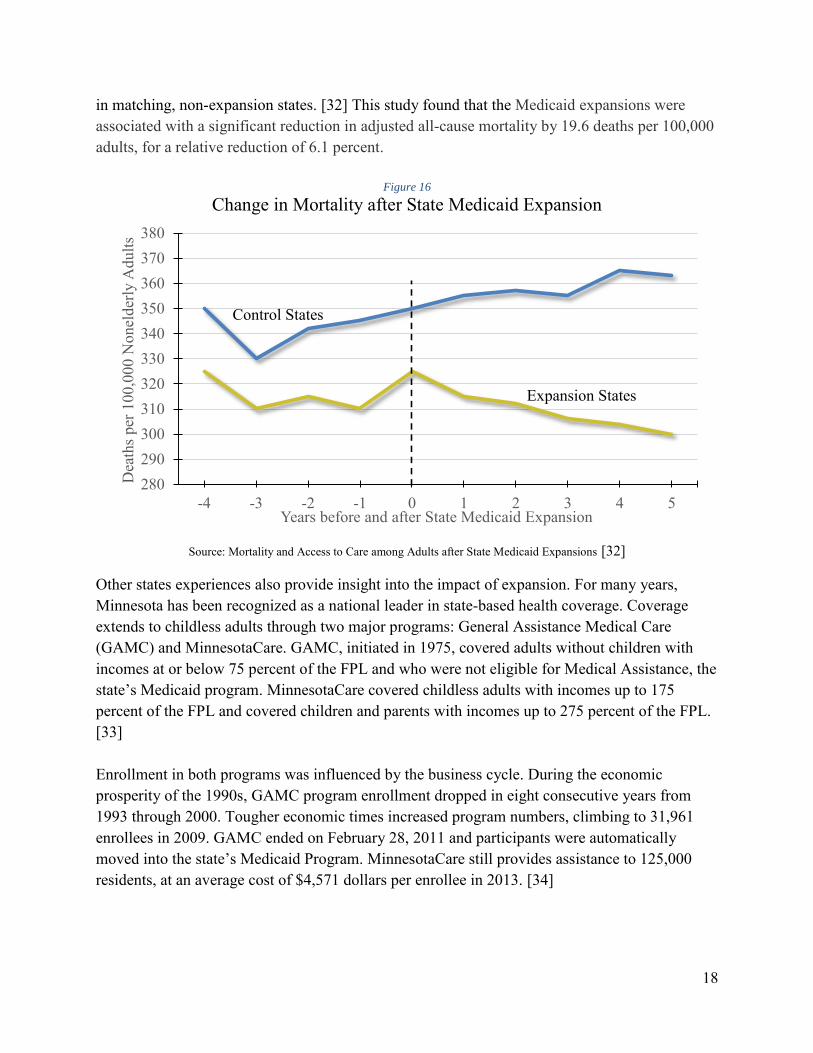
Source: Center for Health Care Strategies, Inc. [31] The impact of these various experiments have been widely studied and discussed. One of the strongest statements on the effectiveness of expansion came from Sommers et al., who compared outcomes in three early expansion states (New York, Arizona, and Maine) with health outcomes
18
in matching, non-expansion states. [32] This study found that the Medicaid expansions were associated with a significant reduction in adjusted all-cause mortality by 19.6 deaths per 100,000 adults, for a relative reduction of 6.1 percent.
Figure 16
Change in Mortality after State Medicaid Expansion
Source: Mortality and Access to Care among Adults after State Medicaid Expansions [32]
Other states experiences also provide insight into the impact of expansion. For many years, Minnesota has been recognized as a national leader in state-based health coverage. Coverage extends to childless adults through two major programs: General Assistance Medical Care (GAMC) and MinnesotaCare. GAMC, initiated in 1975, covered adults without children with incomes at or below 75 percent of the FPL and who were not eligible for Medical Assistance, the state’s Medicaid program. MinnesotaCare covered childless adults with incomes up to 175 percent of the FPL and covered children and parents with incomes up to 275 percent of the FPL. [33] Enrollment in both programs was influenced by the business cycle. During the economic prosperity of the 1990s, GAMC program enrollment dropped in eight consecutive years from 1993 through 2000. Tougher economic times increased program numbers, climbing to 31,961 enrollees in 2009. GAMC ended on February 28, 2011 and participants were automatically moved into the state’s Medicaid Program. MinnesotaCare still provides assistance to 125,000 residents, at an average cost of $4,571 dollars per enrollee in 2013. [34]
280290300310320330340350360370380
-4 -3 -2 -1 0 1 2 3 4 5
Dea
ths p
er 1
00,0
00 N
onel
derly
Adu
lts
Years before and after State Medicaid Expansion
Control States
Expansion States
19
Nebraska Demographics and Healthcare Sector
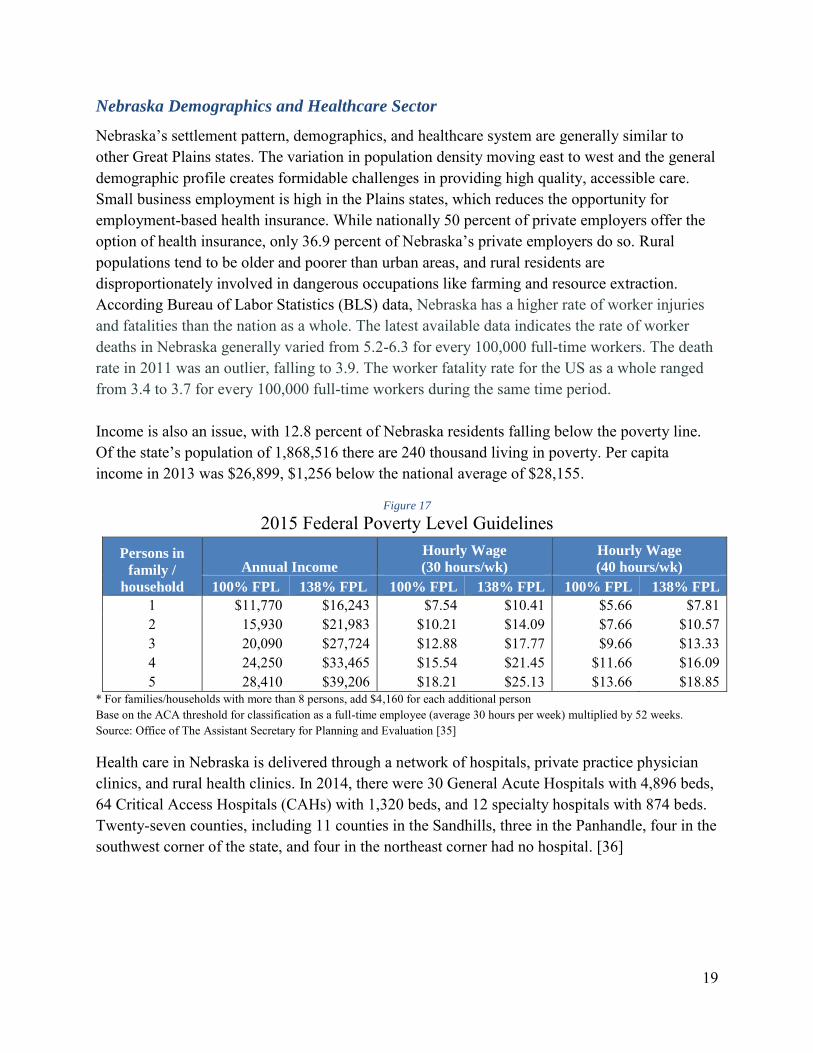
Nebraska’s settlement pattern, demographics, and healthcare system are generally similar to other Great Plains states. The variation in population density moving east to west and the general demographic profile creates formidable challenges in providing high quality, accessible care. Small business employment is high in the Plains states, which reduces the opportunity for employment-based health insurance. While nationally 50 percent of private employers offer the option of health insurance, only 36.9 percent of Nebraska’s private employers do so. Rural populations tend to be older and poorer than urban areas, and rural residents are disproportionately involved in dangerous occupations like farming and resource extraction. According Bureau of Labor Statistics (BLS) data, Nebraska has a higher rate of worker injuries and fatalities than the nation as a whole. The latest available data indicates the rate of worker deaths in Nebraska generally varied from 5.2-6.3 for every 100,000 full-time workers. The death rate in 2011 was an outlier, falling to 3.9. The worker fatality rate for the US as a whole ranged from 3.4 to 3.7 for every 100,000 full-time workers during the same time period. Income is also an issue, with 12.8 percent of Nebraska residents falling below the poverty line. Of the state’s population of 1,868,516 there are 240 thousand living in poverty. Per capita income in 2013 was $26,899, $1,256 below the national average of $28,155.
* For families/households with more than 8 persons, add $4,160 for each additional person Base on the ACA threshold for classification as a full-time employee (average 30 hours per week) multiplied by 52 weeks. Source: Office of The Assistant Secretary for Planning and Evaluation [35]
Health care in Nebraska is delivered through a network of hospitals, private practice physician clinics, and rural health clinics. In 2014, there were 30 General Acute Hospitals with 4,896 beds, 64 Critical Access Hospitals (CAHs) with 1,320 beds, and 12 specialty hospitals with 874 beds. Twenty-seven counties, including 11 counties in the Sandhills, three in the Panhandle, four in the southwest corner of the state, and four in the northeast corner had no hospital. [36]
20
Figure 18
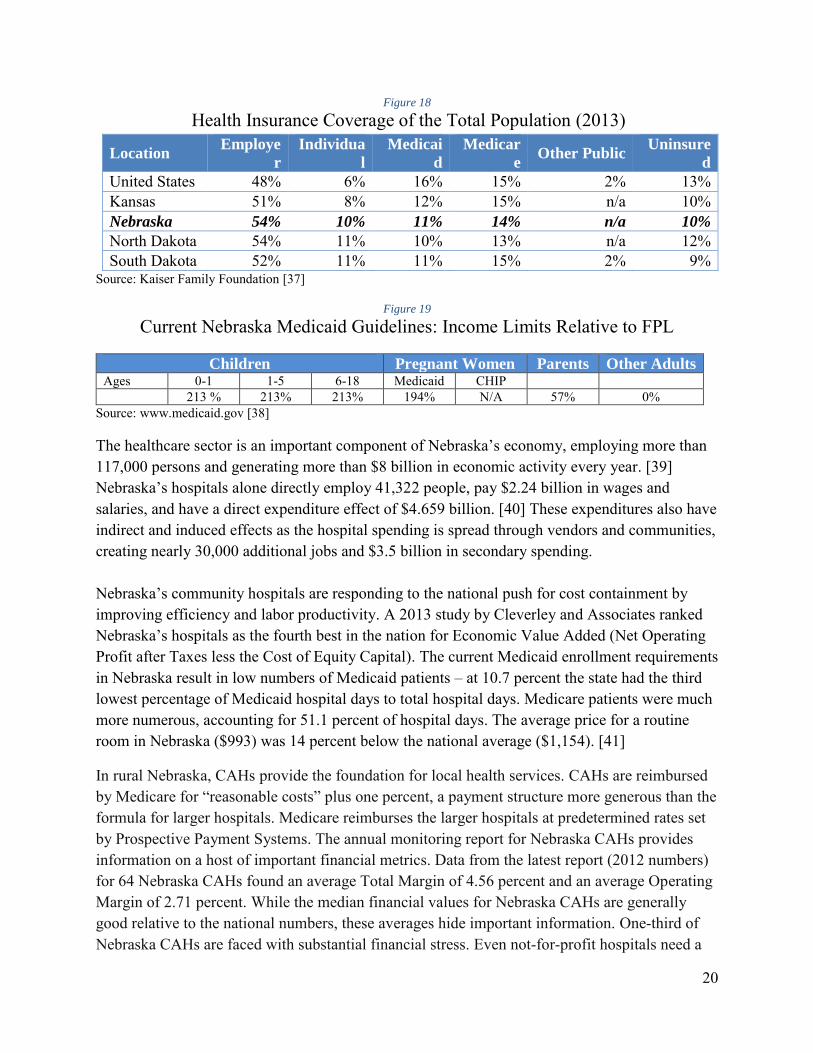
Health Insurance Coverage of the Total Population (2013)
North Dakota 54% 11% 10% 13% n/a 12% South Dakota 52% 11% 11% 15% 2% 9%
Source: Kaiser Family Foundation [37]
Figure 19
Current Nebraska Medicaid Guidelines: Income Limits Relative to FPL
Children Pregnant Women Parents Other Adults Ages 0-1 1-5 6-18 Medicaid CHIP 213 % 213% 213% 194% N/A 57% 0%
Source: www.medicaid.gov [38]
The healthcare sector is an important component of Nebraska’s economy, employing more than 117,000 persons and generating more than $8 billion in economic activity every year. [39] Nebraska’s hospitals alone directly employ 41,322 people, pay $2.24 billion in wages and salaries, and have a direct expenditure effect of $4.659 billion. [40] These expenditures also have indirect and induced effects as the hospital spending is spread through vendors and communities, creating nearly 30,000 additional jobs and $3.5 billion in secondary spending. Nebraska’s community hospitals are responding to the national push for cost containment by improving efficiency and labor productivity. A 2013 study by Cleverley and Associates ranked Nebraska’s hospitals as the fourth best in the nation for Economic Value Added (Net Operating Profit after Taxes less the Cost of Equity Capital). The current Medicaid enrollment requirements in Nebraska result in low numbers of Medicaid patients – at 10.7 percent the state had the third lowest percentage of Medicaid hospital days to total hospital days. Medicare patients were much more numerous, accounting for 51.1 percent of hospital days. The average price for a routine room in Nebraska ($993) was 14 percent below the national average ($1,154). [41]
In rural Nebraska, CAHs provide the foundation for local health services. CAHs are reimbursed by Medicare for “reasonable costs” plus one percent, a payment structure more generous than the formula for larger hospitals. Medicare reimburses the larger hospitals at predetermined rates set by Prospective Payment Systems. The annual monitoring report for Nebraska CAHs provides information on a host of important financial metrics. Data from the latest report (2012 numbers) for 64 Nebraska CAHs found an average Total Margin of 4.56 percent and an average Operating Margin of 2.71 percent. While the median financial values for Nebraska CAHs are generally good relative to the national numbers, these averages hide important information. One-third of Nebraska CAHs are faced with substantial financial stress. Even not-for-profit hospitals need a
21
total margin above two percent to cover uncompensated care, acquire new technology, and build a capital fund for long-term facility development. Using data from the last four financial reports, 15 to 23 Nebraska CAHs are operating at a negative total margin or an unsustainably low positive total margin less than two percent.
Figure 20
Nebraska CAHs with Low Total Margins Year 2009 2010 2011 2012
Number of CAHs 19 (29.2 percent) 23 (35.4 percent) 15 (23.1 percent) 23 (35.4 percent)
Source: Nebraska Department of Health & Human Services [42]
All hospitals are operating in an increasingly cost-conscious environment as national policy attempts to slow the growth of healthcare spending. National health expenditures grew at an average annual rate of 9.3 percent between 1960 and 2012. However, between 2010 and 2013 spending only grew at a 3.8 percent annual rate, the lowest rate of growth for any four-year period since 1960. [43] Hospitals have absorbed nearly $122 billion in funding reductions since 2010. [44] While this reduction in expenditure growth is good at the macroeconomic level, it places increasing financial stress on individual hospitals. According to the AHA, more than 25 percent of hospitals had a negative operating margin in 2012. [45] At the national level, since January 2010, 48 hospitals have closed in rural areas. Financial losses led to the closure of one Nebraska CAH, Tilden Community Hospital, in 2014.
CAHs are not the only providers experiencing increasing financial stress. While overall hospital-sector bond defaults are relatively rare, hospitals account for a disproportionately high share of U.S. public finance defaults. Of the 58 non-housing public agency defaults from 1986 through 2012, 25 (43 percent) were hospitals, although hospitals comprised only four percent of U.S. public finance ratings entities. Furthermore, hospital ratings are more volatile than any other U.S. public finance sector, with 11.7 percent of hospital ratings raised or lowered in 2012, compared with an average of 5.3 percent for all of (non-housing) U.S. public finance offerings. According to a Standard and Poor report, the current level of hospital default still understates the true level of credit risk in the sector. The report observed that as hospitals face increasing financial pressure to the extent that they are bordering on or facing default, they often merge into or are acquired by a larger, more financially secure system. The merger avoids the default; it does not make the financial stresses disappear. The current hospital environment, with a high level of mergers and acquisitions, has thus precluded many distressed hospitals from defaulting. [46]
Hospital merger and acquisition activity remains high, increasing by 10 percent in the first quarter of 2014 relative to the previous year. A report by L.E.K. Consulting, based upon a survey of 150 hospitals CEOs and other healthcare leaders, estimates that by 2020 the 100 largest hospital systems will account for 60 percent of total activity, up from 40 percent in 2008. Mergers increasing scale allows the hospitals to spread costs and improve leverage with suppliers and insurance companies. [47] The downside of merger activity includes the loss of
22
local control and the increased possibility of individual facilities being impacted by actions outside their control.
The Nebraska ACA Experience in 2014
Nebraska was one of 26 states opting to use a Federal Marketplace Exchange rather than create a state exchange. There were four insurance carriers participating in 2014: Blue Cross Blue Shield of Nebraska, Coventry Health Care, Health Alliance Midwest, and CoOportunity. In late December 2014, Iowa-based CoOportunity was taken over by Iowa state regulators and stopped selling policies. Three carriers are participating in 2015: Blue Cross Blue Shield of Nebraska, Coventry Health Care and Assurant. By the end of the first open enrollment period in April 2014, 42,975 Nebraskans had enrolled through the exchange and 10,360 had enrolled in ACA-compliant plans off-exchange. An additional 9,546 exchange applicants were found eligible for existing Medicaid in Nebraska (the Woodwork Population). The majority of exchange enrollees, 87 percent, received financial assistance. [48]
By the end of January 2015, 64,008 Nebraskans had enrolled in private plans through the exchange, including those whose 2014 plans were renewed. During the first two months of the current open enrollment period, 88 percent of Nebraska’s exchange enrollees were eligible for premium subsidies, and 43 percent were new to the exchange. [49] The remainder already had exchange coverage in 2014 and either renewed their plan for 2015 or selected a different exchange plan to replace it. Nebraskans enrolling in 2015 health plans through the federal marketplaces were qualifying for tax credits averaging $245 per month. The credits will reduce average monthly insurance premiums from $355 to $110. The federal subsidies in 2014 injected approximately $110 million into the economy. Because part of this money went to administrative costs located outside the state, the following table uses a $93 million injection into the Nebraska healthcare sector.
Figure 21
Total Nebraska Economic Impact for $93 Million ACA Premium Subsidy, 2014
Impact Type Total Effect Tax Receipts
Employment 1,320 Sales Tax $1,376,000 Labor Income $73,000,000 Property Tax $1,507,000 Output $170,000,000 Motor Vehicle $37,000 Other Taxes $2,059,000
Total Tax $4,979,000
Healthcare is a Critical Infrastructure Component
From an economic development perspective, a viable healthcare sector is an essential element. In fact, healthcare facilities should rightly be considered a critical infrastructure component, as
central to economic growth as access to transportation, education, and communication. There are at least three important linkages between healthcare and overall local economic development. High-quality, affordable care facilities help a region attract and maintain business and industry, attract and retain retirees, and create employment. Quality of life factors, which obviously include healthcare, are central to location decisions by businesses, families, and retirees. Further, healthcare brings new money into the community via third party payors. Lacking access to quality care is just as damaging to development as not having a highway going through town.
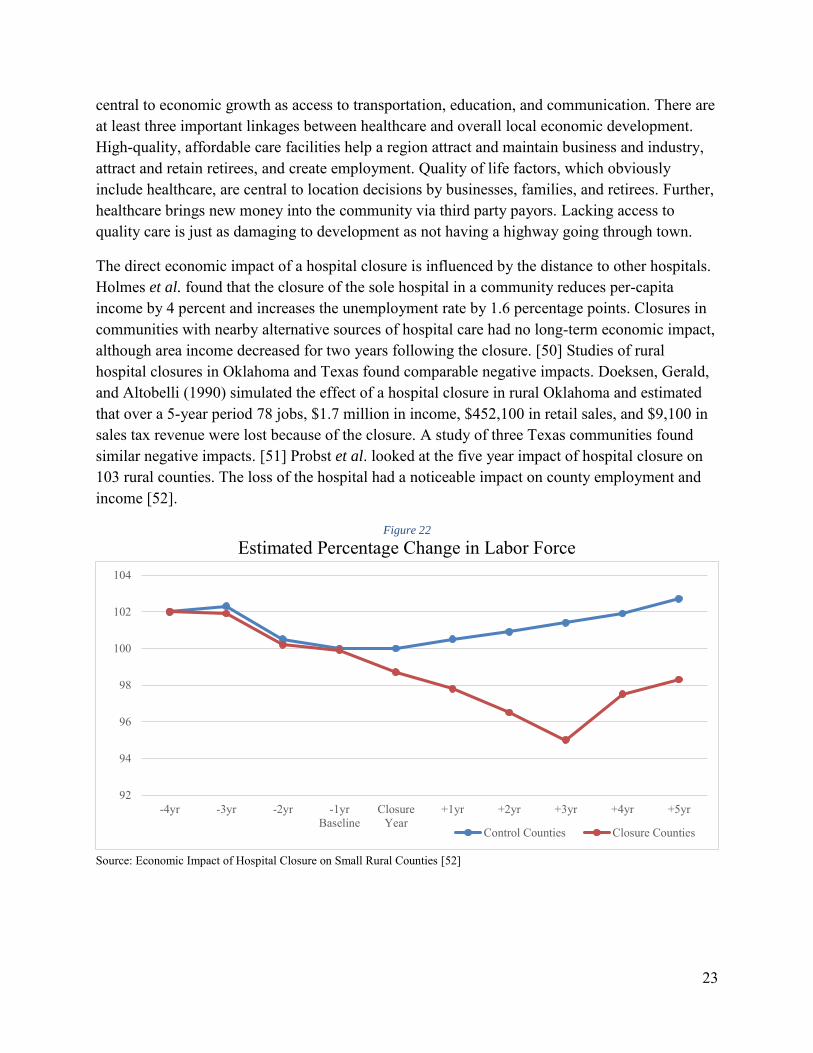
The direct economic impact of a hospital closure is influenced by the distance to other hospitals. Holmes et al. found that the closure of the sole hospital in a community reduces per-capita income by 4 percent and increases the unemployment rate by 1.6 percentage points. Closures in communities with nearby alternative sources of hospital care had no long-term economic impact, although area income decreased for two years following the closure. [50] Studies of rural hospital closures in Oklahoma and Texas found comparable negative impacts. Doeksen, Gerald, and Altobelli (1990) simulated the effect of a hospital closure in rural Oklahoma and estimated that over a 5-year period 78 jobs, $1.7 million in income, $452,100 in retail sales, and $9,100 in sales tax revenue were lost because of the closure. A study of three Texas communities found similar negative impacts. [51] Probst et al. looked at the five year impact of hospital closure on 103 rural counties. The loss of the hospital had a noticeable impact on county employment and income [52].
Figure 22
Estimated Percentage Change in Labor Force
Source: Economic Impact of Hospital Closure on Small Rural Counties [52]
92
94
96
98
100
102
104
-4yr -3yr -2yr -1yrBaseline
ClosureYear
+1yr +2yr +3yr +4yr +5yr
Control Counties Closure Counties
24
Figure 23
Percentage Change in Earned Income (Excluding farming and Mining Incomes)
Source: Economic Impact of Hospital Closure on Small Rural Counties [52]
Viewing healthcare as a critical component of community infrastructure is useful because it provides a basis for thinking about the appropriate role of different levels of government. Infrastructure projects tend to be expensive and long-lasting, so projects often involve a combination of funding sources. For example, all levels of government provide substantial funding for surface transportation. Total federal, state, and local spending on surface transportation averaged $207 billion annually between 2007 and 2011. The federal government provided 25 percent ($51 billion); states contributed 40 percent ($82 billion); and localities (i.e., municipalities, counties, and local transportation authorities) accounted for the remaining 36 percent ($74 billion). These spending figures include both capital investment (construction, rehabilitation, restoration, and reconstruction) and operating expenditures (snow and ice removal, traffic signals, street lights, etc.). [53]
Perhaps the best perspective for viewing the role of government in providing support for healthcare facilities is a comparison with the Rural Electrification Act of 1936 and the subsequent creation of the Rural Electrification Administration (REA). While 90 percent of urban dwellers had electricity by the early 1930s, only 10 percent of rural dwellers and farmers did. Private companies were not interested in building costly electricity lines into the countryside because individual farmers could never cover the marginal cost of installation and upkeep of the lines. The Rural Electrification Act, sponsored by George Norris of Nebraska, created incentives for rural areas to establish electric cooperatives. By 1939, the REA had helped establish 417 electric co-ops, which served 288,000 households. In Nebraska, 34 rural electric co-ops were established. [54]
92
94
96
98
100
102
104
106
108
110
-4yr -3yr -2yr -1yrBaseline
ClosureYear
+1yr +2yr +3yr +4yr +5yr
Control Counties Closure Counties
25
The importance of federal funding is illustrated by the first project undertaken by the Elkhorn Public Power District, created to serve rural Madison County. The project, constructing 273.75 miles of line and necessary substations, was started in 1939 and finished in 1940. Its cost in 1939 dollars, $167,273, would be $2.85 million dollars today. One year after completion the line served 250 customers. [55] Individual farmers did not have the financial resources to self-finance a project of this magnitude. By 1945, hundreds of millions of dollars had been loaned out by the Rural Electric Agency at two percent interest rate for a 25 year term (later expanded to 35 year payback period). Nearly all small rural communities and an estimated nine out of ten farms were electrified. Today the Nebraska Rural Electric Association systems have 1000 employees serving more than 230,000 customers spread across 85,500 miles of line. [54]
Cost/Benefit Analysis
Cost/benefit analysis is a powerful tool for evaluating the value of a proposed public policy. One issue that arises in this approach is that short-term costs are generally more readily identifiable than long-term benefits. In discussing healthcare policy, the difficulty in valuing long-term benefits relative to short-term costs is particularly problematic. Providing any additional services requires resources, which in turn requires payment. Thus, the short-term costs are readily apparent. The major benefits of better health – higher quality of life and increased productivity – unfold over time and are not easily measured in monetary units. Spending money to save a critically ill infant, for example, creates the possibility of a lifetime of benefits accruing from that initial expenditure. The money spent is easily measured; the intrinsic and economic value of the life saved is inherently difficult to measure.
An example of short-term costs but long-term benefits is found in a recently published National Bureau of Economic Research Working Paper by Brown, Kowalski and Lurie: Medicaid as an
Investment in Children: What is the Long-Term Impact on Tax Receipts? The study examined the impact of expansions to Medicaid and SCHIP occurring in the 1980s and 1990s. Using data from the IRS, the researchers calculated longitudinal health insurance eligibility from birth to age 18 for children in cohorts affected by these expansions, and linked eligibility to expanded coverage with later economic outcomes as young adults. Increased eligibility was positively related to later economic circumstances. Participating children paid more in cumulative taxes by age 28, collected less in Earned Income Tax Credit payments, and female participants had higher cumulative wages by age 28 than eligible non-participants. The study calculated that the government spent $872 in 2011 dollars for each additional year of Medicaid eligibility induced by the expansions, but also estimated that the government will recoup 56 cents of every dollar spent on childhood Medicaid by the time these cohorts reach age 60. The return on investment does not take into account other benefits that accrue to both the children and the wider society, including estimated decreases in mortality and increases in college attendance. [56]
26
Public Cost: Impact on State Budgets
Because the FMAP for 2014–16 is 100 percent, expansion initially reduces costs for all states. With or without expansion, a variety of provisions in the ACA increases state spending on Medicaid as currently eligible residents enroll in greater numbers. Thus, the true cost of expansion is calculated as the incremental cost, not the total future increase in state Medicaid spending. According to a Kaiser Foundation report from 2013, the projected incremental cost to states if all fifty implemented the Medicaid expansion is $8 billion from 2013-2022. This figure includes the state share of costs for newly eligible adults and for the additional participation among currently eligible residents, the woodwork population. [57] As discussed in the earlier section describing completed Nebraska studies, there was variance in the estimated cost to the state. This paper will rely on the Legislative Fiscal Office estimates for two critical reasons: 1) the LFO has the deepest access to state budgetary information; 2) the LFO report is the newest, so has the advantage of the latest possible information.
Public Cost: The Crowd-Out Effect
Medicaid expansion will have a crowd-out effect, reducing the demand for private insurance. Some low-income citizens with existing private insurance will switch to Medicaid to reduce out-of-pocket expenses. The experience from states that have increased Medicaid eligibility in the past indicates that expansion also leads to a small reduction in employer-sponsored insurance. Studies from states that have previously expanded coverage to poor adults find a 10 percent to 20 percent switch from private to public insurance. [58] Gruber, in an extensive review of the literature covering the crowd-out effect, found that studies identified private insurance decreases of 20 percent to 50 percent of the public insurance increase. [59] In the Oregon Health Experiment, Baicker et al. found no statistically significant impact of Medicaid coverage on private health insurance, finding that for the study group “private insurance through an employer is not an option.” [60]
Woodwork population
The cost of the currently eligible but not enrolled, the so-called “Woodwork Population,” is not actually a cost of expanding Medicaid. These individuals are already eligible under existing rules but are now more likely to enroll because of the new ACA rules. The Kaiser Family Foundation had calculated the number of already eligible but not enrolled at 5,500 to 6,000 persons in Nebraska. Official 2014 enrollment numbers identified 9,879 applicants who were already eligible for Medicaid. For perspective, the average Nebraska Medicaid/CHIP enrollment per month in 2014 was 235,497. The 2014 woodwork population thus represents roughly four percent of existing enrollees.
27
Benefit: Supporting Main Street by Increasing Discretionary Income for Low-Wage
Workers
The consumption pattern of low-income families is well known – they spend most of their discretionary income on locally-purchased necessities. Because these families have limited savings and financial assets, they are susceptible to unexpected economic/financial shocks stemming from accidents, illness, or job loss. The Great Recession beginning in December 2007 severely strained many families’ financial resources. This fragility was exposed in a July 2014 report from the Federal Reserve Board of Governors. Survey respondents were asked how they would pay for an unanticipated emergency expense of $400. Slightly less than half (48 percent) reported that they could handle such an expense, paying for it entirely using cash, money currently in their checking/savings account, or on a credit card that they would pay in full at the next statement. The remainder (52 percent) indicated that such an emergency expense would be challenging to handle: respondents indicated that they could not cover the expense (19 percent); would have to sell something (9 percent); or would have to borrow at least part of the expense, including using a credit card that they would pay off over time (17 percent), borrowing from friends or family (12 percent), or using a payday loan (4 percent). [61]
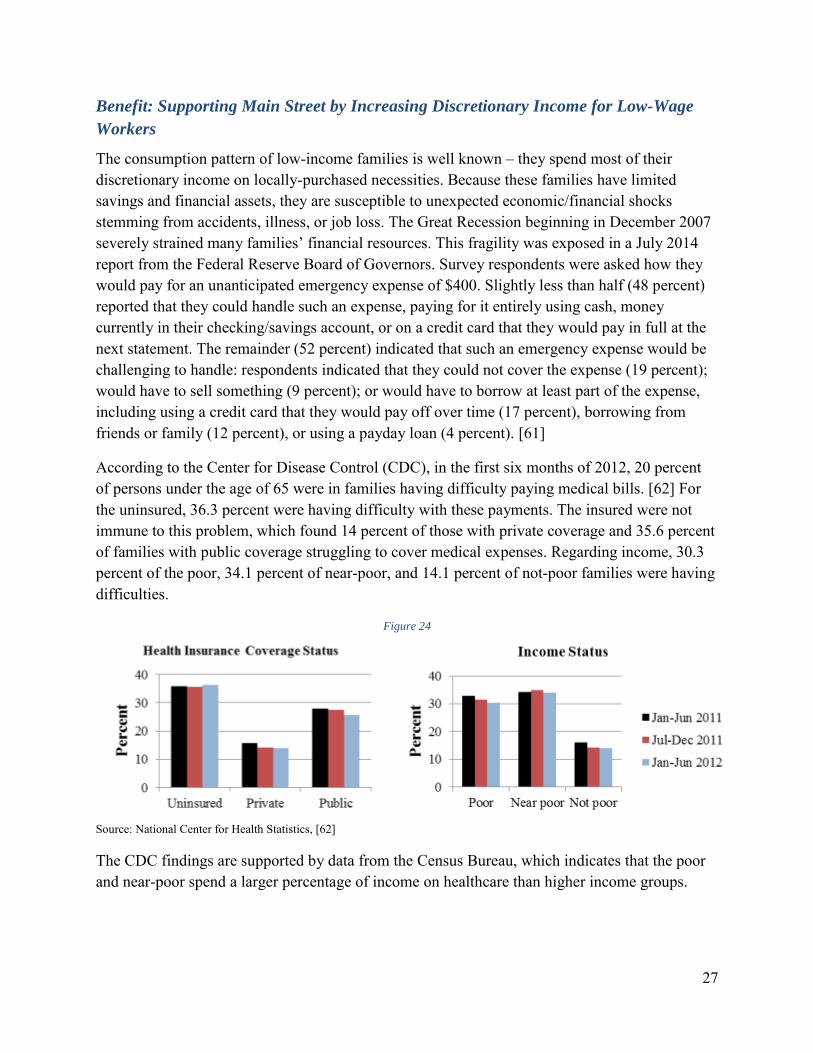
According to the Center for Disease Control (CDC), in the first six months of 2012, 20 percent of persons under the age of 65 were in families having difficulty paying medical bills. [62] For the uninsured, 36.3 percent were having difficulty with these payments. The insured were not immune to this problem, which found 14 percent of those with private coverage and 35.6 percent of families with public coverage struggling to cover medical expenses. Regarding income, 30.3 percent of the poor, 34.1 percent of near-poor, and 14.1 percent of not-poor families were having difficulties.
Figure 24
Source: National Center for Health Statistics, [62]
The CDC findings are supported by data from the Census Bureau, which indicates that the poor and near-poor spend a larger percentage of income on healthcare than higher income groups.
28
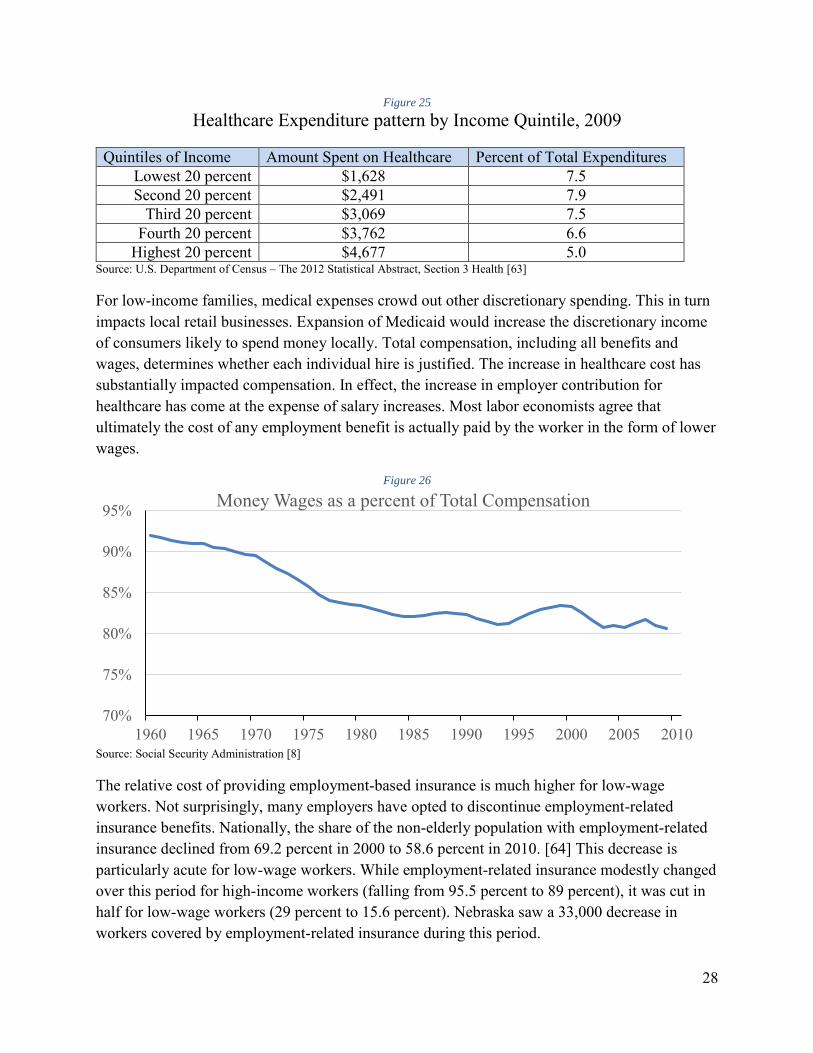
Figure 25
Healthcare Expenditure pattern by Income Quintile, 2009
Quintiles of Income Amount Spent on Healthcare Percent of Total Expenditures Lowest 20 percent $1,628 7.5 Second 20 percent $2,491 7.9
Third 20 percent $3,069 7.5 Fourth 20 percent $3,762 6.6
Highest 20 percent $4,677 5.0 Source: U.S. Department of Census – The 2012 Statistical Abstract, Section 3 Health [63]
For low-income families, medical expenses crowd out other discretionary spending. This in turn impacts local retail businesses. Expansion of Medicaid would increase the discretionary income of consumers likely to spend money locally. Total compensation, including all benefits and wages, determines whether each individual hire is justified. The increase in healthcare cost has substantially impacted compensation. In effect, the increase in employer contribution for healthcare has come at the expense of salary increases. Most labor economists agree that ultimately the cost of any employment benefit is actually paid by the worker in the form of lower wages.
Figure 26
Source: Social Security Administration [8]
The relative cost of providing employment-based insurance is much higher for low-wage workers. Not surprisingly, many employers have opted to discontinue employment-related insurance benefits. Nationally, the share of the non-elderly population with employment-related insurance declined from 69.2 percent in 2000 to 58.6 percent in 2010. [64] This decrease is particularly acute for low-wage workers. While employment-related insurance modestly changed over this period for high-income workers (falling from 95.5 percent to 89 percent), it was cut in half for low-wage workers (29 percent to 15.6 percent). Nebraska saw a 33,000 decrease in workers covered by employment-related insurance during this period.
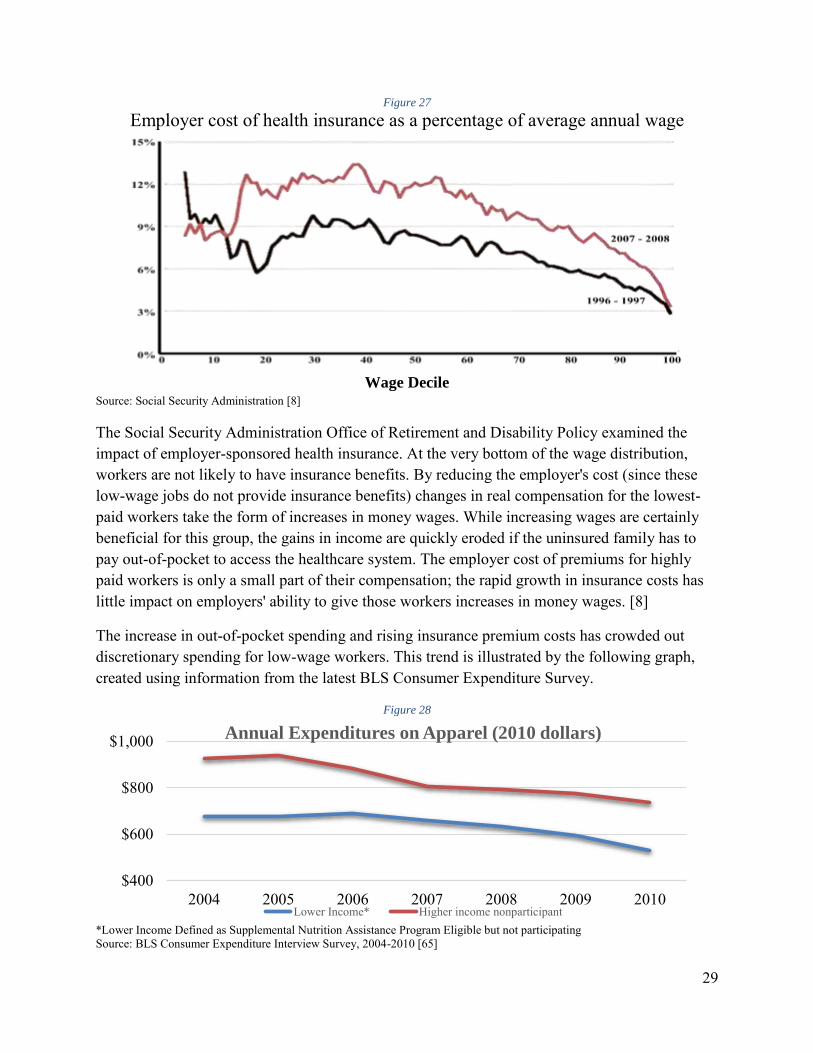
Employer cost of health insurance as a percentage of average annual wage
Wage Decile
Source: Social Security Administration [8]
The Social Security Administration Office of Retirement and Disability Policy examined the impact of employer-sponsored health insurance. At the very bottom of the wage distribution, workers are not likely to have insurance benefits. By reducing the employer's cost (since these low-wage jobs do not provide insurance benefits) changes in real compensation for the lowest-paid workers take the form of increases in money wages. While increasing wages are certainly beneficial for this group, the gains in income are quickly eroded if the uninsured family has to pay out-of-pocket to access the healthcare system. The employer cost of premiums for highly paid workers is only a small part of their compensation; the rapid growth in insurance costs has little impact on employers' ability to give those workers increases in money wages. [8]
The increase in out-of-pocket spending and rising insurance premium costs has crowded out discretionary spending for low-wage workers. This trend is illustrated by the following graph, created using information from the latest BLS Consumer Expenditure Survey.
Figure 28
*Lower Income Defined as Supplemental Nutrition Assistance Program Eligible but not participating Source: BLS Consumer Expenditure Interview Survey, 2004-2010 [65]
$400
$600
$800
$1,000
2004 2005 2006 2007 2008 2009 2010
Annual Expenditures on Apparel (2010 dollars)
Lower Income* Higher income nonparticipant
30
The lowest quintile of income spends $1,650 annually on healthcare, or 7.5 percent of their income. Under Medicaid expansion the percent out-of-pocket spent on healthcare would fall to two and one half percent. A five percent savings in healthcare spending ($1,100 per enrollee) results in an annual increase in discretionary income of $88 million for the 79,593 new enrollees in FY 2019-20. The additional $88 million in expenditures supports 800 jobs, creates $32 million in additional income and generates $4.9 million in state and local taxes.
Benefit: Providing Efficient Public Support for Job Creation
Nebraska has a variety of programs providing incentives for job creation. While there were early small-scale programs, LB 775 (The Employment and Investment Growth Act of 1987) signified a new willingness by the state to provide substantial benefits through income tax credits and sales tax refunds. LB 775 also contained provisions allowing the exclusion of capital gains income from sale of corporate stock by a corporate employee. According to Unicameral reports, the cost of this capital gains exclusion benefit varied from $2 million to $50 million per year. By 2007, the cumulative cost of LB 775 since 1987 was $367 million.
In 2005, the Unicameral adopted LB 312 (The Nebraska Advantage Act) to replace LB 775. The Department of Revenue annually publishes a report containing statistics regarding investment, employment, wages and credits and refunds earned and used. From this, Revenue can estimate the annual "cost" of LB 312. This estimated cost is a source of considerable disagreement because it is impossible to know how much activity would have occurred in the absence of the incentives. While some business groups argue that incentives have no cost because the increase in activity creates more tax revenue, there is no empirical support that targeted incentives are costless. There is disagreement among economists as to what the cost is, but no disagreement with the conclusion that there is a cost.
A special Unicameral Performance Audit Committee report entitled: Nebraska Department of
Revenue: An Examination of Nebraska Advantage Tax Incentive Programs was completed in February 2013. As noted in the report:
Tax incentives represent a “cost” to the state in revenue the state would have collected in the absence of the incentives. For 2008 to 2011, the Department reported that 33 businesses used almost $101 million in Advantage Act incentives but acknowledged that the figure underestimates the full state cost. The underestimation is due to (1) additional tax credits the 33 businesses had earned but not used, and (2) additional businesses the Department expects will be found eligible for incentives based on actions taken between 2008 and 2011. [66]
The report estimated that the cost-per-job for jobs created under the centerpiece Nebraska Advantage Act ranged from $42,747, considering only compensation tax credits, to $234,568 considering all earned benefits except the property tax exemption. By comparison, IMPLAN
31
modeling of the healthcare sector in Nebraska finds that each $71,000 increase in healthcare spending creates one new job.
Benefit: Reduction in Cost-shifting to Taxpayers and the Insured
Bad Debt/Charity Care does not solely impact providers. To cover part of the loss, providers shift cost to insurers and private pay patients in the form of higher charges for health services or to taxpayers in the form of government assistance payments to healthcare. Private insurers pass their additional cost to families and businesses in the form of higher premiums. Taxpayers also contribute a substantial amount to cover these costs. In 2013, Kaiser Family Foundation estimated that $53.3 billion was paid to help providers offset losses. Most funding ($32.8 billion) came from the federal government through programs including Medicaid and Medicare, the Veterans Health Administration, the Indian Health Service, Community Health Centers block grants, and Ryan White CARE Act. States and localities provided $19.8 billion, and the private sector provided $0.7 billion. The exact amount of cost shifting to the private insured is difficult to estimate at the national level because of regional differences in costs and premiums. After accounting for government funding, $21.1 billion remains. Private insurance reimbursement to providers exceeds costs by 30 percent, which provides coverage for some of the bad debt/charity care.
Benefit: Supporting Main Street by Reducing Medical-related Bankruptcy
As noted earlier, roughly 20 percent of all families have trouble paying medical bills. Medical expenses have two influences on the circumstances leading to bankruptcy. In some cases the medical expense itself is the direct cause of the bankruptcy. Other times, a medically-related job loss is the precipitating event. The family’s debt load, manageable before the illness or accident, became overwhelming with the interruption of income. As noted earlier, many families have few financial resources available to tap during times of emergency. To the extent that bankruptcy losses are never recouped by the creditors, they represent a second silent tax on local businesses.
In a widely reported study by Harvard University faculty, 60 percent of bankruptcies had a significant medical debt component. [67] Bankruptcies are catastrophic for individual families but are also very damaging to Main Street businesses. The unsecured claims create direct business losses and make it likely that any outstanding medical bills will become bad debt for local providers. Expansion of Medicaid can partially shelter low-income families from bankruptcy. Gross et. al. found that a 10 percent increase in Medicaid coverage reduced bankruptcy by eight percent. [68]
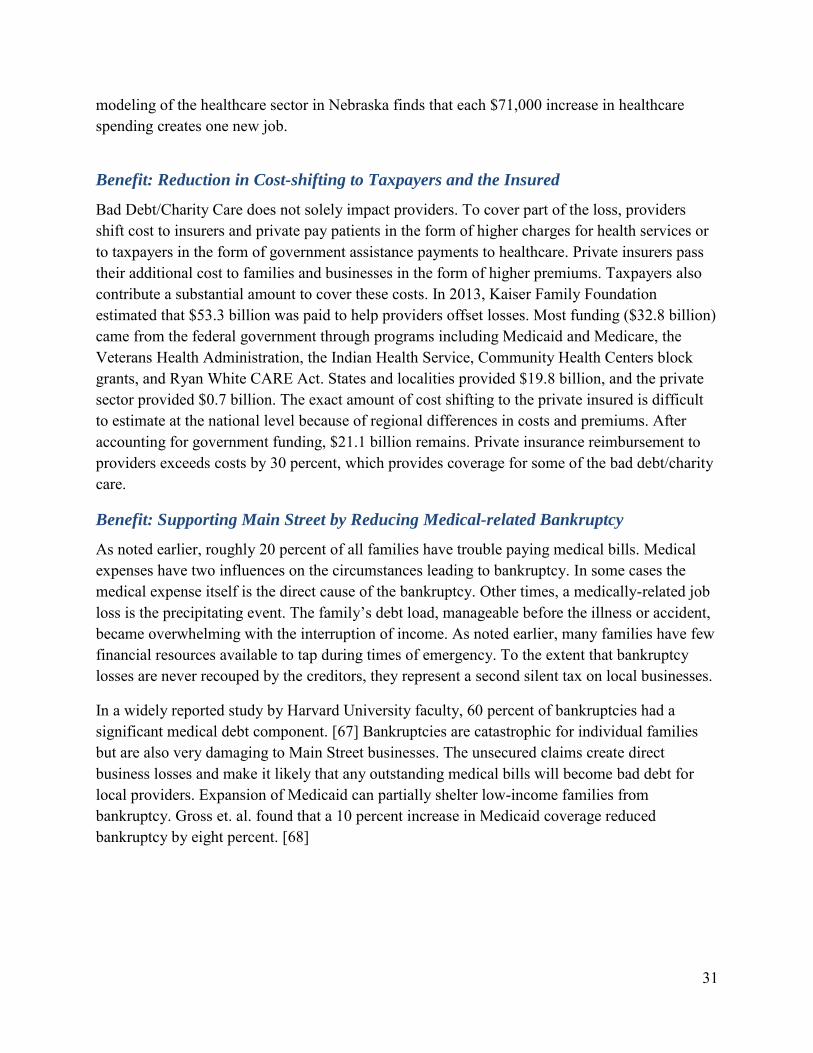
Source: 2013 Report of Statistics Required by the Bankruptcy Abuse Prevention and Consumer Protection Act of 2005 [69] Note: Cases with predominantly non-business debts commenced during the 12-month period ending December 31, 2013.
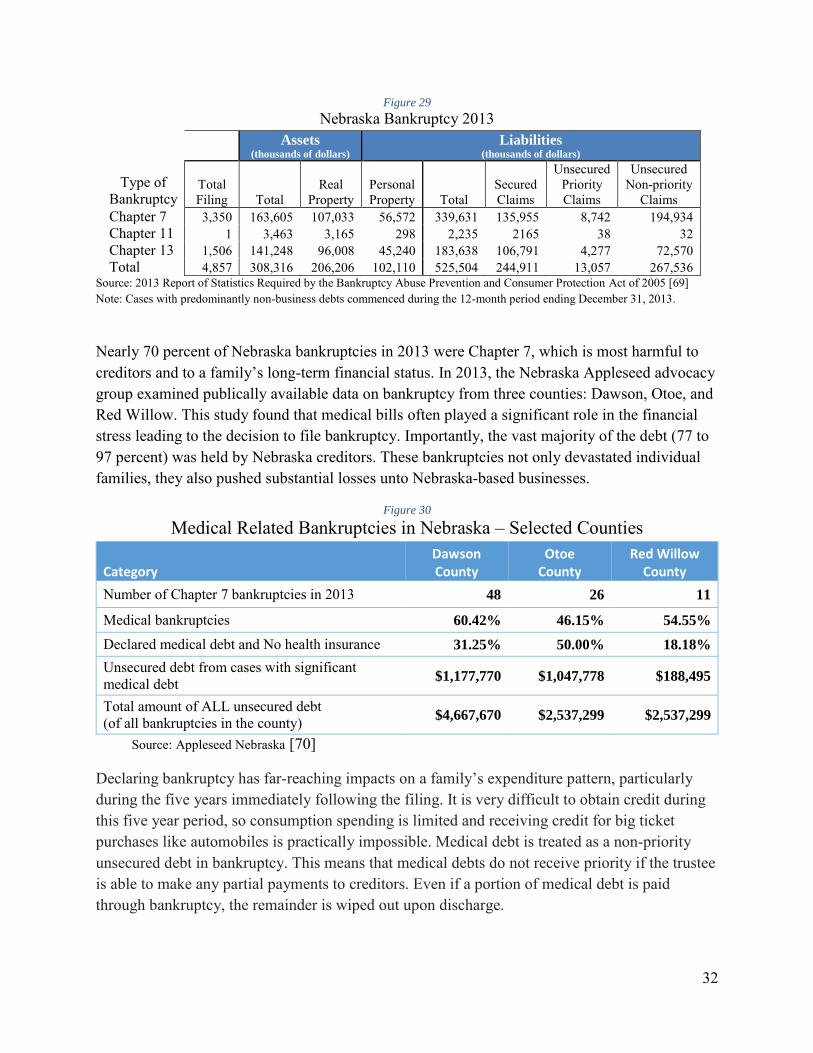
Nearly 70 percent of Nebraska bankruptcies in 2013 were Chapter 7, which is most harmful to creditors and to a family’s long-term financial status. In 2013, the Nebraska Appleseed advocacy group examined publically available data on bankruptcy from three counties: Dawson, Otoe, and Red Willow. This study found that medical bills often played a significant role in the financial stress leading to the decision to file bankruptcy. Importantly, the vast majority of the debt (77 to 97 percent) was held by Nebraska creditors. These bankruptcies not only devastated individual families, they also pushed substantial losses unto Nebraska-based businesses.
Figure 30
Medical Related Bankruptcies in Nebraska – Selected Counties
Category Dawson County
Otoe County
Red Willow County
Number of Chapter 7 bankruptcies in 2013 48 26 11
Medical bankruptcies 60.42% 46.15% 54.55%
Declared medical debt and No health insurance 31.25% 50.00% 18.18%
Unsecured debt from cases with significant medical debt $1,177,770 $1,047,778 $188,495
Total amount of ALL unsecured debt (of all bankruptcies in the county) $4,667,670 $2,537,299 $2,537,299
Source: Appleseed Nebraska [70]
Declaring bankruptcy has far-reaching impacts on a family’s expenditure pattern, particularly during the five years immediately following the filing. It is very difficult to obtain credit during this five year period, so consumption spending is limited and receiving credit for big ticket purchases like automobiles is practically impossible. Medical debt is treated as a non-priority unsecured debt in bankruptcy. This means that medical debts do not receive priority if the trustee is able to make any partial payments to creditors. Even if a portion of medical debt is paid through bankruptcy, the remainder is wiped out upon discharge.
33
One interesting side-note on the issue of medically related bankruptcy, a high-profile filing occurred in 2011, when Mary Brown and her husband filed a petition of bankruptcy seeking relief for $55,000 in debts. Mrs. Brown, who was uninsured, was the named plaintiff in the National Federation of Independent Business Supreme Court lawsuit decided in 2012. The debt listed in the bankruptcy filing included $4,500 in medical bills. [71]
We estimate the savings from averted bankruptcies using Gross’s reported findings and the experience of the 2014 expansion states. In 2014, expansion states saw a 17 percent decrease in bankruptcy while non-expansion had a 13 percent reduction. Using the four percent difference as the impact of expansion times the $525 million in total liabilities for 2013 gives an initial decrease of $21.4 million. In future years, as enrollment increases we anticipate additional savings from averted bankruptcies.
Figure 31
Savings from Averted Bankruptcies in Nebraska (millions of dollars)
Year 2015-16 2016-17 2017-18 2018-19 2019-20 Total Savings 21.4 25.0 28.5 32.1 35.7 142.7
Source: authors’ estimation
Benefits: Improved Health and Increased Productivity
The link between income, health, and productivity is well established. For low-income workers, a lack of access to healthcare leads to absenteeism, reduced productivity, and vulnerability to frequent job loss. Human resource researchers have coined the term “presenteeism” to describe the circumstance in which a worker is at work but cannot perform adequately because of illness or injury. Presenteeism includes: time not on task (in the workplace, but not working); decreased quality of work (increased injury rates, product waste, product defects); decreased quantity of work; unresolved unsatisfactory employee interpersonal factors (personality disorders); and unsatisfactory work culture. [72] Presenteeism costs employers two to three times more than direct medical care. [73] Programs that improve the health and vitality of workers improve the quality of labor. Access to medical care improves the physical vigor and the emotional stability of the labor force, which enhances worker longevity and contributes to a workforce that is more productive because it is more experienced. A study of U.S. productivity growth found that 12 percent of the increase for the 1959 - 2006 period stemmed from improved labor quality. [74] Even assuming an annual wage increase of 1 percent, the value of enhanced longevity in a particular job is substantial over a career. Reduced turnover reduces recruitment and training costs. Through longevity at work, employees acquire additional skills that may protect them from long periods of future unemployment. This in turn, helps control the business cost of unemployment compensation.
34
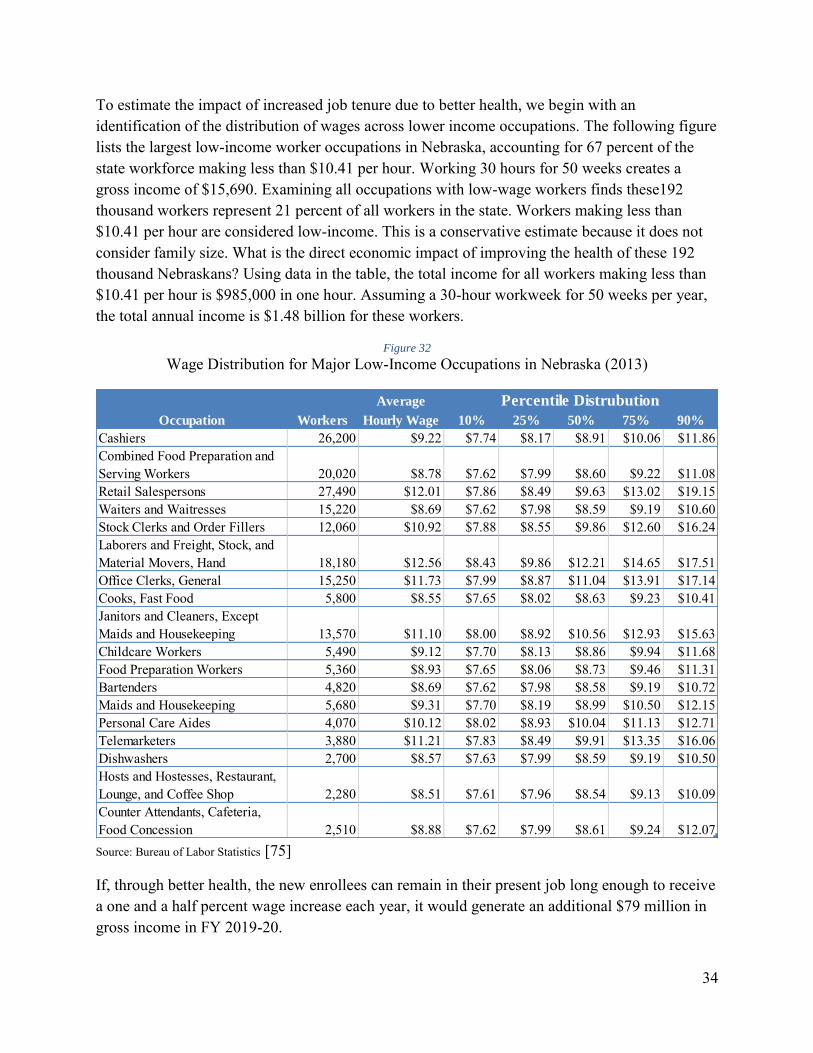
To estimate the impact of increased job tenure due to better health, we begin with an identification of the distribution of wages across lower income occupations. The following figure lists the largest low-income worker occupations in Nebraska, accounting for 67 percent of the state workforce making less than $10.41 per hour. Working 30 hours for 50 weeks creates a gross income of $15,690. Examining all occupations with low-wage workers finds these192 thousand workers represent 21 percent of all workers in the state. Workers making less than $10.41 per hour are considered low-income. This is a conservative estimate because it does not consider family size. What is the direct economic impact of improving the health of these 192 thousand Nebraskans? Using data in the table, the total income for all workers making less than $10.41 per hour is $985,000 in one hour. Assuming a 30-hour workweek for 50 weeks per year, the total annual income is $1.48 billion for these workers.
Figure 32
Wage Distribution for Major Low-Income Occupations in Nebraska (2013)
Source: Bureau of Labor Statistics [75]
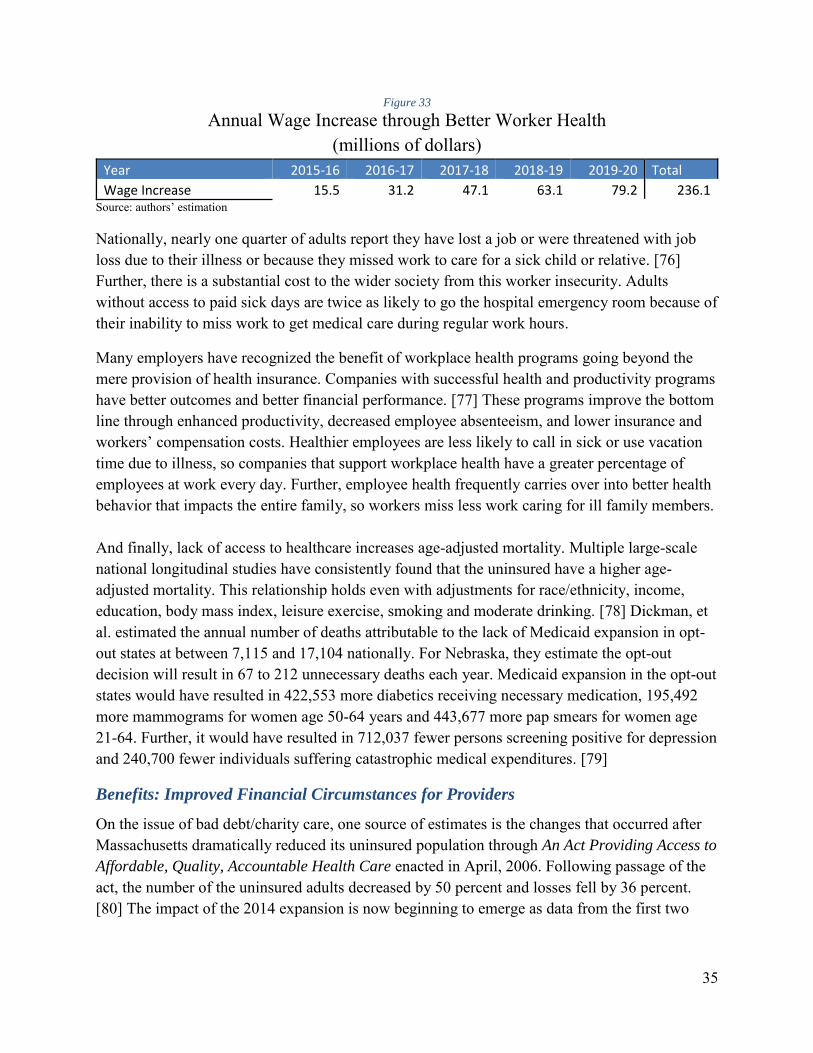
If, through better health, the new enrollees can remain in their present job long enough to receive a one and a half percent wage increase each year, it would generate an additional $79 million in gross income in FY 2019-20.
Nationally, nearly one quarter of adults report they have lost a job or were threatened with job loss due to their illness or because they missed work to care for a sick child or relative. [76] Further, there is a substantial cost to the wider society from this worker insecurity. Adults without access to paid sick days are twice as likely to go the hospital emergency room because of their inability to miss work to get medical care during regular work hours.
Many employers have recognized the benefit of workplace health programs going beyond the mere provision of health insurance. Companies with successful health and productivity programs have better outcomes and better financial performance. [77] These programs improve the bottom line through enhanced productivity, decreased employee absenteeism, and lower insurance and workers’ compensation costs. Healthier employees are less likely to call in sick or use vacation time due to illness, so companies that support workplace health have a greater percentage of employees at work every day. Further, employee health frequently carries over into better health behavior that impacts the entire family, so workers miss less work caring for ill family members. And finally, lack of access to healthcare increases age-adjusted mortality. Multiple large-scale national longitudinal studies have consistently found that the uninsured have a higher age-adjusted mortality. This relationship holds even with adjustments for race/ethnicity, income, education, body mass index, leisure exercise, smoking and moderate drinking. [78] Dickman, et al. estimated the annual number of deaths attributable to the lack of Medicaid expansion in opt-out states at between 7,115 and 17,104 nationally. For Nebraska, they estimate the opt-out decision will result in 67 to 212 unnecessary deaths each year. Medicaid expansion in the opt-out states would have resulted in 422,553 more diabetics receiving necessary medication, 195,492 more mammograms for women age 50-64 years and 443,677 more pap smears for women age 21-64. Further, it would have resulted in 712,037 fewer persons screening positive for depression and 240,700 fewer individuals suffering catastrophic medical expenditures. [79]
Benefits: Improved Financial Circumstances for Providers
On the issue of bad debt/charity care, one source of estimates is the changes that occurred after Massachusetts dramatically reduced its uninsured population through An Act Providing Access to
Affordable, Quality, Accountable Health Care enacted in April, 2006. Following passage of the act, the number of the uninsured adults decreased by 50 percent and losses fell by 36 percent. [80] The impact of the 2014 expansion is now beginning to emerge as data from the first two
quarters becomes available. On the important issue of bad debt/charity care, multiple studies are showing a 25–40 percent decrease in expansion states. Regarding the uninsured, Medicaid expansion states with a state-run exchange have seen the largest decreases, with the number of uninsured falling from 16.1 percent in 2013 to 12.1 percent in the second quarter of 2014 (a 25 percent decrease). [28] The national uninsured rate for the 18 to 64 age group fell by 22 percent, falling from 21.0 percent in September 2013 to 16.3 percent in April 2014. Insurance coverage gains were significant in states with or without Medicaid expansion for those with incomes between 139 percent and 400 percent of the FPL. This is expected since it is consistent with the subsidies provided by the ACA for insurance in this income range, regardless of state decisions regarding Medicaid expansion. Direct evidence indicated that expansion states enjoyed a 16 percent reduction in bad debt/charity care relative to non-expansion states. Total bad debt/charity care for hospitals and all other providers was $592 million in 2013.
Figure 34
Reduction in Bad Debt/Charity Care for all Providers (millions of dollars)
Year 2015-16 2016-17 2017-18 2018-19 2019-20 Total
The ACA contains provisions designed to encourage employers to offer affordable insurance plans. Employers with low-income workers will not face penalties if their employees qualify to enroll in Medicaid. In states deciding to expand Medicaid to 138 percent of FPL this safe haven provides protection for all businesses. For the Nebraska economy, any ACA tax penalty paid by individuals or businesses is a financial leakage.
In a special report on the issue of tax liability for businesses stemming from the ACA, Jackson Hewitt Tax Service calculated the federal tax penalties to employers could total $1.03 billion to $1.55 billion each year in the 25 states that had not yet expanded Medicaid for adults at the time of the report. In very direct language, the report states that: “Any projections of the “net” costs of Medicaid expansions should also reflect the very real costs of the shared responsibility tax penalties to employers in states that do not expand Medicaid. “ The report estimates that Nebraska corporations will face ACA fines of $11 million to $16 million per year. [81]
37
State Program Cost Savings
As identified in the February 23, 2015 LFO Fiscal Note for LB 472, the state will be able to shift some state-aid recipients to Medicaid. Shifts include: the elimination of the State Disability Program; replacement of state provided prescription drugs for low income individuals who are HIV positive or have AIDS; and replacement funding for behavioral health assistance to the mental health regions. LFO estimates program savings of $9.3 million in FY 2015-16, rising to $18 million in FY 2019-20. Inmates of correctional facilities are not eligible for Medicaid, however Medicaid will cover services provided when inmates are hospitalized outside a correctional facility. This savings is estimated at $730,000 per year through FY 2019-20.
Protection Against the Possibility of Credit Downgrade
Hospitals rely on capital markets to finance expansions and facilities upgrades. The cost of borrowing money is influenced by the perceived risk that the borrower may be unable to repay the loan. Fitch Ratings created a special report in October 2013 addressing the impact of Medicaid expansion on hospital credit ratings. According to Fitch, hospitals and healthcare systems operating in states that do not expand Medicaid coverage will face greater financial challenges, and thus lower credit ratings, than providers in states with the expanded program. [82]
Moody’s Investor Service and Standard & Poor’s Ratings Services have also issued reports characterizing a negative outlook for not-for-profit hospitals and health systems. Identified trends working against hospitals included the value-based reimbursement, uncertainty regarding the insurance health exchanges, and the proposed cuts to Medicare. Both S&P and Moody’s include statements that risk was particularly high in states that have not moved forward with Medicaid expansion.
38
Figure 35
National Number of Bond Rating Upgrades and Downgrades Not-for-profit Healthcare, 1994 – 2012
Source: Moody’s Investors Services. Moody's [83]
Costs and Benefits Considered
Medicaid coverage does not flow to a low-income recipient and stop; it flows through the recipient to medical providers. The report considers the costs to the state identified by the Legislative Fiscal Office. Benefits include supporting the local economy by increasing disposable income for low-wage workers; cost-effective job creation relative to existing state tax incentive programs; reducing taxes and private premium subsidization of the uninsured; protecting local creditors by reducing medical-related bankruptcy; helping businesses by improving worker health and productivity; reducing bad debt/charity care for providers; creating state program cost savings; and helping protect the credit ratings for healthcare systems.
IMPLAN Modeling of Fiscal Impact
Beyond the cost/benefit calculation, there is a potential fiscal impact stemming from an increase in federal spending in Nebraska. The impacts are modeled with the IMPLAN 3.1 software using data from the MIG 2014 Nebraska data package. Direct spending is the federal money funding care to the expanded Medicaid population. The healthcare industry will use these funds to hire healthcare workers and to purchase goods and services in order to meet the demand for health services. The suppliers in turn will purchase supplies and hire employees, thus generating an indirect and induced economic impact. IMPLAN is a powerful analytic tool because it is able to track the inter-industry flow of money within an identified region. This allows researchers to identify the multiplier effects originating from an external injection of funds. Currently, more than 1,500 academics and government agencies use IMPLAN.
1. Increased Discretionary Spending: The impact resulting from the increase in family discretionary income through the replacement of private spending on healthcare with publicly funded insurance.
2. Healthcare Cost Shifting: The impact resulting from the decrease in individual hidden cost stemming from increased insurance premiums and higher tax payments designed to mitigate bad debt/charity care.
3. Averted Bankruptcy: The impacts stemming from the reduction in medical related bankruptcies.
4. Better Worker Health: The increase in income for low-wage workers who see an increase in employment hours and tenure because of better health.
5. Charity Care/Bad Debt: The benefits of a partial payment of bad debt/charity care to the healthcare industry.
6. Averted Business Penalty: The impact resulting from businesses avoiding ACA penalties.
7. Medicaid Provider Payments: Payments to providers for patient services that are not otherwise listed. This is used instead of a direct federal injection to avoid any possible double counting of impacts.
Multiple states have used IMPLAN to assess the potential impact of Medicaid expansion, generally focusing on the state level impact of the injection of new federal money. The model was used to estimate the overall economic impacts arising from the direct benefits discussed in the earlier cost/benefit analysis. The model estimates the impacts associated with each benefit in terms of total impact on Nebraska’s economy.
The following table summarizes the direct benefits Nebraska will experience with Medicaid expansion. Additional details are presented in Figures 36 through 39.
40
Figure 36
Direct Economic Benefits Arising from Medicaid Expansion
(millions of nominal dollars) Year 2015-16 2016-17 2017-18 2018-19 2019-20 Total
The flow of funds diagram for FY 2019-20 illustrates how the state and federal funds flow through the system to provide healthcare to the expanded Medicaid population. The values for the Nebraska General Fund expenditures, Federal Funds expenditures, Medicaid Expansion Cost, Administration costs, and Program Savings are taken directly from the Nebraska Legislative Fiscal Office Fiscal Note for LB 472. All other values are the direct calculations from the authors and results from the IMPLAN model. The diagram helps answer a variety of questions because it reinforces the fundamental reality that every dollar has a purpose, that no dollar is forgotten, and that no dollar can be used or counted twice. The authors took great effort to assure that no activity or expenditure was double counted in this cost/benefit analysis. The diagram also reinforces the reality that benefits flow through recipients to providers.
41
Figure 37
Expa
nded
Med
icai
d Fl
ow o
f Fun
ds D
iagr
am
FY 2
019-
20
Cos
t Dat
a So
urce
: LB
472
Fis
cal N
ote,
Feb
ruar
y 20
15, N
E Le
gisla
tive
Fisc
al O
ffice
B
enef
it A
naly
sis:
Jenk
ins A
, Kon
ecny
R. N
ebra
ska
Med
icai
d Ex
pans
ion,
201
5.
F
undi
ng N
ebra
ska
Hos
pita
l Ass
ocia
tion,
AA
RP
42
Figure 38
Econom
ic I
mpacts
FY
2015-1
6F
Y 2
016-1
7F
Y 2
017-1
8F
Y 2
018-1
9F
Y 2
019-2
0
Empl
oym
ent
8,
735
9,
153
9,
468
9,
598
10,
256
Labo
r Inc
ome
$395
,696
,000
$4
13,2
44,0
00
$426
,579
,000
$4
31,8
42,0
00
$459
,939
,000
O
utpu
t$9
26,1
30,0
00
$975
,521
,000
$1
,011
,123
,000
$1
,029
,286
,000
$1
,097
,501
,000
Sta
te a
nd L
ocal T
axes
FY
2015-1
6F
Y 2
016-1
7F
Y 2
017-1
8F
Y 2
018-1
9F
Y 2
019-2
0
Inco
me
Tax
$7,7
30,0
00
$8,0
74,0
00
$8,3
36,0
00
$8,4
39,0
00
$8,9
89,0
00
Sale
s Tax
$9,2
63,0
00
$10,
047,
000
$10,
560,
000
$10,
930,
000
$11,
728,
000
Prop
erty
Tax
$10,
299,
000
$11,
162,
000
$11,
729,
000
$12,
137,
000
$13,
022,
000
Mot
or V
ehic
le$6
97,0
00
$739
,000
$7
68,0
00
$783
,000
$8
35,0
00
Corp
orat
e Ta
xes
$466
,000
$5
08,0
00
$534
,000
$5
56,0
00
$597
,000
O
ther
Tax
es$2
,861
,000
$3
,057
,000
$3
,190
,000
$3
,274
,000
$3
,505
,000
T
ota
l N
ebra
ska T
ax
$31,3
16,0
00
$33,5
87,0
00
$35,1
17,0
00
$36,1
19,0
00
$38,6
76,0
00
Federa
l T
axes
FY
2015-1
6F
Y 2
016-1
7F
Y 2
017-1
8F
Y 2
018-1
9F
Y 2
019-2
0
Pers
onal
Inco
me
Tax
$21,
005,
000
$21,
780,
000
$22,
566,
000
$22,
855,
000
$24,
547,
000
Corp
orat
e Pr
ofit
Tax
$7,2
62,0
00
$7,6
86,0
00
$8,0
84,0
00
$8,3
84,0
00
$8,9
87,0
00
Oth
er T
axes
$41,
048,
000
$42,
594,
000
$44,
154,
000
$44,
762,
000
$48,
072,
000
Tota
l F
edera
l T
ax
$69,
315,
000
$72,
060,
000
$74,
804,
000
$76,
001,
000
$81,
606,
000
Cos
t Dat
a So
urce
: LB
472
Fisc
al N
ote,
Feb
ruar
y 25
, 201
5, L
egisl
ativ
e Fi
scal
Off
ice
Fis
ca
l B
en
efi
t o
f L
B 4
72
by F
isca
l Y
ea
r
Sour
ce: N
ebra
ska
Med
icai
d Ex
pans
ion,
Pre
pare
d by
Alla
n Je
nkin
s, Ph
.D.,
Ron
Kon
ecny
, Ph.
D.,
Febr
uary
25,
201
5
43
Figure 39
Ave
rted
Ban
kru
ptc
y
Ave
rted
Bu
sin
ess
Pen
alty
Bet
ter
Wo
rker
Hea
lth
Ch
arit
y C
are
Bad
Deb
t
Dis
cret
ion
ary
Spen
din
g
Gen
eral
Med
icai
d
Exp
end
itu
res
Hea
lth
care
Co
st S
hif
tin
gTo
tal
Eco
no
mic
Im
pacts
Empl
oym
ent
326
1
12
724
1,3
93
800
6,2
40
450
10
,045
La
bor I
ncom
e$1
3,19
5,00
0 $4
,576
,000
$2
9,28
1,00
0 $7
6,45
1,00
0 $3
2,35
9,00
0 $2
70,8
06,0
00
$24,
678,
000
451
,346
,000
O
utpu
t$4
0,10
2,00
0 $1
3,91
3,00
0 $8
8,99
5,00
0 $1
79,6
17,0
00
$98,
348,
000
$592
,420
,000
$5
7,97
9,00
0
1,0
71,3
74,0
00
Sta
te a
nd
Lo
cal
Taxes
Inco
me
Tax
$259
,000
$9
0,00
0 $5
75,0
00
$1,4
85,0
00
$636
,000
$5
,296
,000
$4
79,0
00
$8,8
20,0
00
Sale
s Tax
$718
,000
$2
51,0
00
$1,5
92,0
00
$1,4
52,0
00
$1,7
60,0
00
$5,0
15,0
00
$469
,000
$1
1,25
7,00
0 Pr
oper
ty T
ax$7
90,0
00
$276
,000
$1
,754
,000
$1
,621
,000
$1
,938
,000
$5
,601
,000
$5
23,0
00
$12,
503,
000
Mot
or V
ehic
le$3
4,00
0 $1
2,00
0 $7
6,00
0 $1
25,0
00
$84,
000
$442
,000
$4
0,00
0 $8
13,0
00
Corp
orat
e Ta
xes
$39,
000
$13,
000
$86,
000
$74,
000
$95,
000
$241
,000
$2
4,00
0 $5
72,0
00
Oth
er T
axes
$172
,000
$6
0,00
0 $3
81,0
00
$492
,000
$4
21,0
00
$1,7
07,0
00
$159
,000
$3
,392
,000
T
ota
l N
E T
ax
$2
,01
2,0
00
$
70
2,0
00
$
4,4
64
,00
0
$5
,24
9,0
00
$
4,9
34
,00
0
$1
8,3
02
,00
0
$1
,69
4,0
00
$
37
,35
7,0
00
Fed
eral
Taxes
Pers
onal
Inco
me
$815
,000
$0
$1
,809
,000
$2
,061
,000
$2
,007
,000
$1
6,65
9,00
0 $6
65,0
00
$24,
016,
000
Corp
orat
e Pr
ofit
$567
,000
$0
$1
,259
,000
$1
,416
,000
$1
,377
,000
$3
,546
,000
$4
57,0
00
$8,6
22,0
00
Oth
er T
axes
$1,6
51,0
00
$0
$3,6
64,0
00
$4,1
80,0
00
$4,0
64,0
00
$32,
087,
000
$1,3
49,0
00
$46,
995,
000
To
tal
Fed
eral
Tax
$3,0
33,0
00
$0
$6,7
32,0
00
$7,6
57,0
00
$7,4
48,0
00
$52,
292,
000
$2,4
71,0
00
$79,
633,
000
To
tal Im
pa
ct
by B
en
efi
t E
xa
min
ed
FY
20
19
-20
Sour
ce: N
ebra
ska M
edic
aid
Expa
nsio
n, P
repa
red
by A
llan
Jenk
ins,
Ph.D
., Ro
n K
onec
ny, P
h.D
., Fe
brua
ry 2
5, 2
015
Cost
Dat
a Sou
rce:
LB4
72 F
isca
l Not
e, F
ebru
ary
25, 2
015,
Leg
isla
tive
Fisc
al O
ffic
e
44
Figure 40
Ad
min
istr
atio
nC
on
trac
ts W
aive
r IT
Oth
er T
ota
l
Eco
no
mic
Im
pacts
Empl
oym
ent
21
1
-
2
11
Labo
r Inc
ome
$8,5
93,0
00
$0
8,
593,
000
Out
put
$26,
127,
000
$0
26,
127,
000
Sta
te a
nd
Lo
cal
Taxes
Inco
me
Tax
$169
,000
$0
$1
69,0
00
Sale
s Tax
$471
,000
$0
$4
71,0
00
Prop
erty
Tax
$519
,000
$0
$5
19,0
00
Mot
or V
ehic
le$2
2,00
0 $0
$2
2,00
0 Co
rpor
ate
Taxe
s$2
5,00
0 $0
$2
5,00
0 O
ther
Tax
es$1
13,0
00
$0
$113
,000
T
ota
l N
E T
ax
$1
,31
9,0
00
$
0
$1
,31
9,0
00
Fed
eral
Taxes
Pers
onal
Inco
me
$531
,000
$0
$5
31,0
00
Corp
orat
e Pr
ofit
$365
,000
$0
$3
65,0
00
Oth
er T
axes
$1,0
77,0
00
$0
$1,0
77,0
00
To
tal
Fed
eral
Tax
$1,9
73,0
00
$0
$1,9
73,0
00
Sour
ce: N
ebra
ska
Med
icai
d Ex
pans
ion,
Pre
pare
d by
Alla
n Je
nkin
s, Ph
.D.,
Ron
Kon
ecny
, Ph.
D.,
Febr
uary
25,
201
5
Cos
t Dat
a So
urce
: LB
472
Fisc
al N
ote,
Feb
ruar
y 25
, 201
5, L
egisl
ativ
e Fi
scal
Off
ice
To
tal Im
pa
ct
by O
ther
Exp
en
dit
ure
s
FY
20
19
-20
45
Conclusion
Examining the issue of Medicaid expansion in Nebraska through a cost/benefit analytical approach finds that expansion will have a strong positive influence on the state’s economy with a small net cost to state government. The total benefits to the state’s retail and financial sectors through the reduction of bankruptcies and the increase in consumer discretionary spending are approximately $571 million dollars over the next five years. Businesses will also benefit from improved worker health, which increases attendance, improves productivity, reduces recruitment and training costs, reduces presenteeism, and facilitates worker skill improvement.
Relative to other state programs to create employment, Medicaid expansion is a cost-effective approach. The Department of Revenue estimates that the cost to the state budget per job created under the Nebraska Advantage Act ranged from $42,747 to $234,568. By comparison, IMPLAN modeling of the healthcare sector in Nebraska finds that each $46,572 increase in Medicaid spending supports one job. Medicaid expansion will support 10,779 jobs in Nebraska in FY 2019-20. It is important to recognize that changes in the financial environment in healthcare are creating substantial employment headwinds. Nebraska providers are facing more than $2 billion in Medicare cuts by 2024, with a potential loss of another $1 billion. The announced cuts alone will reduce state employment by 30,000. Medicaid expansion will help protect the critical healthcare infrastructure necessary for local economic development. One-third of Nebraska’s Critical Access Hospitals are facing severe financial stress, and urban hospitals are struggling to compensate for increasing levels of bad debt/charity care. The loss of a hospital immediately reduces local employment and income, and has a devastating impact on the prospect for future development. Expansion states are seeing dramatic decreases in the number of uninsured and in bad debt/charity care losses for providers. Numerous studies are showing decreases of 25-40 percent in bad debt/charity care in the expansion states. Kentucky saw uncompensated care fall from $1.9 billion in the first three quarters of 2013 to $776 million in the first three quarters of 2014. The net five year impact on the state budget is estimated comparing the total state receipts with the estimated cost provided by the latest LFO fiscal note. Cost to the Nebraska General Fund is identified at $70,333,153. State receipts calculated from the IMPLAN model are $105,960,400. An additional $68,854,600 in revenue is generated for local governments. These results are time sensitive because the FMAP changes over time. In addition to the positive impact on the state budget, Medicaid expansion directly helps the overall economy through the increase in discretionary income, the reduction in bankruptcies, averted ACA business penalties, and better worker health. The five year collective direct benefit of these categories sums to $861 million. On the basis of the preceding information, it is clear that Medicaid expansion beginning in FY 2015-16 passes a rigorous cost/benefit test.
46
Bibliography
[1] CBO, "Updated Estimates for the Insurance Coverage Provisions of the Affordable Care Act," Congressional Budget Office, Washington D.C., March 2012.
[2] L. Hruska, "LB 472 Fiscal Note," Legislative Fiscal Office, February 23, 2015.
[3] A. Mitchell and E. P. Baumrucker, "Medicaid’s Federal Medical Assistance Percentage (FMAP), FY2014," 2013.
[4] P. Fronstin, "Sources of Health Insurance and Characteristics of the Uninsured: Analysis of the March 2013 Current Population Survey," Employee Benefit Research Institute, 2013.
[5] National Center for Health Statistics, "Health, United States 2013 with special Feature on Prescription Drugs," Center for Disease Control and Prevention / U.S. Department of Health and Human Services, Atlanta, 2013.
[6] NEHI, "A Matter of Urgency: Reducing Emergency Department Overuse," The Network for Excellence in Health Innovation, 2010.
[7] CMS, "Reducing Nonurgent Use of Emergency Departments and Improving Appropriate Care in Appropriate Settings," 2014.
[8] G. Burtless and S. Milusheva, "Effects of Employer-Sponsored Health Insurance Costs on Social Security Taxable Wages," Social Security Bulletin, vol. 73, no. a, pp. 83-108, 2013.
[9] T. A. Coughlin, J. Holahan, K. Caswell and M. McGrath, "Uncompensated Care for the Uninsured in 2013: A Detailed Examination," May 2014. [Online]. Available: https://kaiserfamilyfoundation.files.wordpress.com/2014/05/8596-uncompensated-care-for-the-uninsured-in-2013.pdf.
[10] AHA, "Uncompensated Hospital Care Cost Fact Sheet," American Hospital Association, 2015.
[11] Office of Program Planning and Analysis, "Hill-Burton Project Register," U.S. Department of Health, Education, and Welfare, 1971.
[12] MFH, "Hospital Charity Care in the United States," Missouri Foundation for Health, 2005.
47
[13] J. Zwanziger, G. A. Melnick and A. Bamezai, "Can cost shifting continue in a price competitive environment?," Health Economics, vol. 9, no. 3, p. 211, Apr 2000.
[14] CDC, "National Hospital Ambulatory Medical Care Survey: 2011 Emergency Department Summary Tables," 2014.
[15] A. J. Weiss, L. M. Wier, C. Stocks and J. Blanchard, "Overview of Emergency Department Visits in the United States, 2011," 2014.
[16] NDOR, "Motor Vehicle Crash Data / Statistics," Nebraska Department of Roads, 2014.
[17] Physicians Mutual, "Accidents Can Result in Expensive Medical Bills and Debt," 2013.
[18] "Medicaid Overview Report: Providing Cost-Effective Health Care to South Dakota’s Medicaid Recipients," November, 2013.
[19] J. Hadley and T. Holahan, "Covering the Uninsured in 2008: A Detailed Examination of Current Costs and Sources ofPayment, and Incremental Costs of Expanding Coverage," Kaidrt Commision on Medicaid and Uninsured, Washington, 2008.
[20] R. S. Foster, "The Estimated Effect of the Affordable Care Act on Medicare and Medicaid Outlays and Total National Health Care Expenditures," 2011.
[21] B. Sommers, R. Kronick, K. Finegold, R. Po, K. Schwartz and P. Glied, "Understanding Participation Rates in Medicaid: Implications for the Affordable Care Act," U.S. Department of Health and Human Services, 2012.
[22] E. Eslami and K. Cunnyngham, "Supplemental Nutrition Assistance Program Participation Rates: Fiscal Years 2010 And 2011," 2014.
[23] K. Pomertleau, "Overview of the Earned Income Tax Credit on EITC Awareness Day," 31 Jan 2014. [Online]. Available: http://taxfoundation.org/blog/overview-earned-income-tax-credit-eitc-awareness-day.
[24] J. P. Stimpson, "Medicaid Expansion in Nebraska under the Affordable Care Act," 2012.
[25] L. Hruska, "LB 577 Fiscal Note - Legislateve Fiscal Analysis Estimate," February 25, 2013.
[26] B. M. C. C. D. S. Holahan J, "The Cost and Coverage Implications of the ACA Medicaid Expansion: National and State-by-State Analysis.," Kaiser Commission on Medicaid and the Uninsured, Menlo Park, 2012.
48
[27] S. Riley, "Medicaid Expansion: The Economic Analysis Dilemma," Platte Institute fo Economic Research, 2013.
[28] D. Witters, "Arkansas, Kentucky Report Sharpest Drops in Uninsured Rate," Gallup, Omaha, 2014.
[29] B. D. Sommers, T. Musco, K. Finegold, M. Gunja, A. Murke and A. M. McDowell, "Health Reform and Changes in Health Insurance Coverage in 2014," The New England
Journal of Medicine, vol. 371, pp. 867-874, 28 August 2014.
[30] T. DeLeire, K. Joynt and R. McDonald, "Impact Of Insurance Expansion On Hospital Uncompensated Care Costs In 2014," ASPE DHHS, 2014.
[31] S. A. Somers, A. Hamblin, J. M. Verdier and V. L. Byrd, "Covering Low-Income Childless Adults in Medicaid: Experiences from Selected States," Center for Health Care Strategies, Inc., 2010.
[32] B. D. Sommers, K. Baicker and A. M. Epstein, "Mortality and Access to Care amoung Adults after State Medicaid Expansion," New England Journal of Medicine, pp. 1025-34, 2012.
[33] R. Chun, "General Assistance Medical Care," Minnesota House of Representatives, 2010.
[34] MDHS, "Minnesota Health Care Programs," Minnesota Health Care Programs, 2014.
[35] ASPE, "Prior HHS Poverty Guidelines and Federal Register References," 2015.
[36] DHHS, "State of Nebraska Roster Hospitals".
[37] KFF, "Health Insurance Coverage of the Total Population," Kaiser Family Foundation, 2013.
[38] CMS, "Nebraska," Feb 2015. [Online].
[39] L. W. Chen, A. Nguyen, K. Shaw-Sutherland, B. Apenteng and N. VanOsdel, "Nebraska Rral Health Works: The Economic Impact of Critical Access Hospitals on Nebraska's Economy, 2009," University of Nebraska Medical Center, 2012.
[40] AHA, "State of Nebraska Local Economic Impact of Hospitals in 2011," American Hospital Association, 2013.
49
[41] W. O. Cleverley, J. O. Cleverley, J. M. LaFortune and L. E. Handlon, State of the Hospital Industry, Cleverly & Associates, 2013.
[42] D. Palm, B. Luke and M. Brockman, "Assessing the Financial and Operational performance of CAHs in Nebraska," 2014.
[43] AHA, "Health Care Spending Growth Hits Record Low," American Hospital Association, 2014.
[44] AHA, "Hospitals have absorbed nearly $122 billion of new cuts since 2010," American Hospital Association, 2014.
[45] AHA, "Trendwatch Chartbook 2014," American Hospital Association, 2014.
[46] Standard & Poor's Ratingsdirect, "U.S. Not-For-Profit Acute-Care Stand-Alone Hospitals -- Methodology And Assumptions," Dec 2013.
[47] B. Herman, "4 Most Common Strategies to Combat Financial Pressures," Becker's Hospital Review, 2014.
[48] ASPE, "Profile for Affordable Care Act Coverage Expansion Enrollment for Medicaid/CHIP and the Health Insurance Marketplace - Nebraska," ASPE - DHHS, 14.
[49] L. Norris, "Nebraska health insurance exchange," HealthInsurance.org, 2014. [Online]. Available: http://www.healthinsurance.org/nebraska-state-health-insurance-exchange/.
[50] G. M. Holmes, R. T. Slifkin, R. K. Randolph and S. Poley, "The Effect of Rural Hospital Closures on Community Economic Health," Health Services Research, vol. 42, no. 2, pp. 467-485, 2006.
[51] G. A. Doeksen, R. A. Loewen and D. A. Strawn, "A Rural Hospital's Impact on a Community's Economic Health," The Journal or Rural Health, vol. 6, no. 1, pp. 53-64, 1990.
[52] J. C. Probst, D. E. Berry and T. C. Ricketts, "Economic Impact of Hospital Closure on Small Rural Counties, 1984 to 1988: Demonstration of a Comparative Analysis Approach," Journal of Rural Health, vol. 15, no. 4, 2008.
[53] PEW, "Intergovernmental Challenges in Surface Transportation Funding," The Pew Charitable Trusts, 2014.
50
[54] "Working for Nebraska," Nebraska Rural Electric Association, 2015. [Online]. Available: http://workingfornebraska.org/about-us/.
[55] ERPPD, "History," Elkhorm Rural Public Power District, 2014. [Online]. Available: http://erppd.com/about-erppd/history/.
[56] D. W. Brown, A. E. Dowalski and I. Z. Lurie, "Medicaid as an Investment in Children: What is the Long-Term Impact on Tax Receipts? NBER Working Paper No. 20835," The National Bureau of Economic Research, 2015.
[57] KFF, "How Will the Uninsured in Nebraska Fare Under the Affordable Care Act?," 2014.
[58] M. Broaddus and J. Angeles, "Medicaid Expansion in Health Reform not Likely to Crowd Out Private Insurance," Center on Budget and Policy Priorities, 2010.
[59] J. Gruber, Public finance and Public Policy, 4th ed., New York: Worth Prublishers, 2013.
[60] K. Baicker, A. Finkelstein, J. Song and S. Taubman, "The Impact of Medicaid on Labor Market Activity and Program Participation: Evidence from the Oregon Health Insurance Experiment," American Economic Review: Papers and Proceedings, vol. 104, no. 5, pp. 322-28, 2014.
[61] DCCA, "Report on the EconomicWell-Being of U.S. Households in 2013," Washington, DC, 2014.
[62] R. A. Cohen, W. K. Kirzinger and R. M. Gindi, "Problems Paying Medical Bills: Early Release of Estimates from the National Health Interview Survey, January 2011-June 2012," Center for Disease Control, 2013.
[63] Census, "The 2012 Statistical Abstract - Health and Nutrition Section 3," 2012.
[64] E. Gould, "A decade of declines in employer-sponsored health insurance coverage," Economic Policy Institute, 2013.
[65] BLS, "Recent trends in spending patterns of Supplemental Nutrition Assistance Program participants and other lowincome Americans," 2013.
[66] M. Carter, K. Gudmunson, C. Mabin and S. Meese, "Nebraska Department of Revenue: An Examination of Nebraska Advantage Tax Incentive Programs," Legislative Audit Office, State of Nebraska, 2013.
51
[67] D. U. Himmelstein, D. Thone, E. Warren and S. Woolhandler, "Medical Bankruptcy in the United States, 2007: results of a national study," The American Journal of Medicine, vol. 8, no. 122, pp. 741-746, 2009.
[68] N. M. Gross, "Health insurance and the consumer bankruptcy decision: evidence from expansions of Medicaid," Journal Public Econ, vol. 95, pp. 767-778, 2011.
[69] U.S. Courts, "Assets and Liabilities Reported by Debtors - Tables 1A, 1B, 1D, 1X," Administative Office of the U.S. Cours on behalf of the Fededral Judiciary, 2015.
[71] D. Dranove and M. L. Millenson, "Medical Bankruptcy: Myth Versus Fact," HealthAffairs, [Online]. Available: http://content.healthaffairs.org/content/25/2/w74.full.
[72] R. Loeppke, P. A. Hymel, L. T. Pizzi and D. L. Konicki, "Health-Related Workplace Productivity Measurement: General and Migraine-Specific Recommendations from the ACOEM Expert Panel," Journal of Occupational and Enviromental Medicine, April 2003.
[73] Mayo Clinic, "The True Cost of Poor Health," Mayo Clinic Health Solutions, 2008.
[74] D. W. Jorgenson, M. S. Ho and K. J. Stiroh, "A Retrospective Look at the U.S. Productivity Growth Resurgence," Journal of Economic Perspectives, pp. 3-24, 2008.
[75] BLS, "State Occupational Employment and Wage Estimates,May 2013 - Nebraska," Bureau of Labor Statistics, U.S. Department of Labor, 2015.
[76] T. Smith and J. Kim, "Paid Sick Days: Attitudes and Experiences," 2010.
[77] R. J. Mitchell and P. Bates, "Measuring Health-Related Productivity Loss," Population
Health Management, vol. 14, no. 2, pp. 93-98, Apr 2011.
[78] A. P. Wilper, S. Woolhandler, K. E. Lasser, D. McCormick, D. H. Bor and D. U. Himmelstein, "Health Insurance and Mortality in US Adults," Research and Practice, vol. 99, no. 12, pp. 2289-95, Dec 2009.
[79] S. Dickman, D. Himmelstein, D. McCormick and S. Wollhandler, "Opting Out of Medicaid Expansion: The Health And Financial Impacts," Jan 2014. [Online]. Available: http://healthaffairs.org/blog/2014/01/30/opting-out-of-medicaid-expansion-the-health-and-financial-impacts/.
52
[80] "Health Safety Net 2011 Annual Report," Massachusetts Division of Health Care Finance and Policy, 2012.
[81] B. Haile and G. Brandes, "State Medicaid Choices and the Hidden Tax Surprises for Employers," Jackson Hewitt Tax Service Inc., 2014.
[82] A. Kates and J. LaBuhn, "Adverse Expansion: Hospitals, States, and Medicaid," Fitch Ratings, 2013.
[83] Moodys, "Not for Profit Healthcare Sets New Record in Downgraded Debt 2012," Moody's Investors Services, 2013.