Page 1
Nebraska Transportation Center
Report # UNL: SPR-1(07) P598 Final Report
INvesTIgaTIoN aNd MITIgaTIoN of drIver CoNfusIoN aT ModerN rouNdabouTs
aemal Khattak, Ph.d. Associate ProfessorDepartment of Civil EngineeringUniversity of Nebraska-Lincoln
“This report was funded in part through grant[s] from the Federal Highway Administration [and Federal Transit Administration], U.S. Department of Transportation. The views and opinions of the authors [or agency] expressed herein do not necessarily state or reflect those of the U. S. Department of Transportation.”
Nebraska Transportation Center262 WHIT2200 Vine StreetLincoln, NE 68583-0851(402) 472-1975
ram bishu, Ph.d., ProfessorKaren schurr, Lecturergregroy McKnight, Masters student
Wbs: 26-1118-0085-001
Page 2
Investigation and Mitigation of Driver
Confusion at Modern Roundabouts
Dr. Aemal Khattak
Associate Professor
Department of Civil Engineering
University of Nebraska-Lincoln
Dr. Ram Bishu
Professor
Department of Civil Engineering
University of Nebraska-Lincoln
Karen Schurr
Lecturer
Department of Civil Engineering
University of Nebraska-Lincoln
Gregory McKnight
Masters Student
Department of Civil Engineering
University of Nebraska-Lincoln
NDOR Research Project SPR-1(07) P598
Transportation Research Studies
A Report on Research Sponsored By
Nebraska Department of Roads
1500 Nebraska Highway 2
Lincoln, NE 68509-4759
Nebraska Transportation Center
University of Nebraska-Lincoln
113 Nebraska Hall
Lincoln, NE 68588-0530
October 30, 2009
Page 3
ii
1. Report No.
26-1118-0085-001
2. Government Accession No.
3. Recipient's Catalog No.
4. Title and Subtitle
Investigation and Mitigation of Driver Confusion
at Modern Roundabouts
5. Report Date
October 30, 2009
6. Performing Organization Code
SPR-1(07) P598
7. Author(s)
Dr. Aemal Khattak, Dr. Ram Bishu, Karen Schurr, and Gregory McKnight
8. Performing Organization Report No.
9. Performing Organization Name and Address
University of Nebraska-Lincoln
Nebraska Transportation Center
2200 Vine St. 262 Whittier Research Center
PO Box 830851
Lincoln, NE 68583-0851
10. Work Unit No. (TRAIS)
11. Contract or Grant No.
12. Sponsoring Agency Name and Address
Nebraska Department of Roads
1500 Nebraska Highway 2
Lincoln, NE 68509-4759
13. Type of Report and Period Covered
Draft Report,
14. Sponsoring Agency Code
NTC TRB RiP 11917
15. Supplementary Notes
16. Abstract
This research deals with two related issues: investigation and mitigation of roundabout elements that lead to driver
confusion, and development of a flexible criteria matrix by which the Nebraska Department of Roads (NDOR) can
evaluate arterial intersections to identify good candidates for conversion to roundabouts. The use of modern roundabouts
along arterial roadways is relatively new in Nebraska. The first urban arterial roundabout was opened to traffic in June of
2002 at the intersection of 33rd and Sheridan Blvd in the City of Lincoln. Citizens and some professionals were somewhat
skeptical of the capability of this roundabout to improve traffic delay and safety. However, after the construction of this
roundabout the City of Lincoln has reported reduced traffic delays and the Nebraska Department of Roads (NDOR) has
reported a reduction in traffic accidents. The objectives of the research include: (1) identification of user issues and
confusing elements of roundabouts via surveys and development of mitigation measures for safer usage of arterial
roundabouts in Nebraska; and (2) development of a criteria matrix for arterial intersections that NDOR can use to check the
candidacy of intersections for conversion to single-or multi-lane roundabouts.
17. Key Words
18. Distribution Statement
19. Security Classif. (of this report)
Unclassified
20. Security Classif. (of this page)
Unclassified
21. No. of Pages
147
22. Price
Page 4
iii
Table of Contents
LIST OF FIGURES.......................................................................................................................... v
LIST OF TABLES ......................................................................................................................... vii
DISCLAIMER .............................................................................................................................. xii
ACKNOWLEDGMENTS ............................................................................................................... xiii
ABSTRACT ................................................................................................................................ xiv
EXECUTIVE SUMMARY .............................................................................................................. xv
CHAPTER 1 INTRODUCTION ......................................................................................................... 1
1.1 Report Organization ...................................................................................................................... 1
1.2 Background ................................................................................................................................... 1
1.3 Research Statement and Objectives .............................................................................................. 4
1.4 Research Hypotheses .................................................................................................................... 5
CHAPTER 2 LITERATURE REVIEW ................................................................................................ 7
2.1 Roundabout Safety and Operations ............................................................................................... 7
2.2 Roundabout Modeling ................................................................................................................... 9
2.3 Public Opinion, Involvement and Impact ................................................................................... 11
2.4 Roundabout Information Dissemination to the Public ................................................................ 14
2.5 Driver Confusion and Error......................................................................................................... 15
2.6 Review of Roundabout Operations Video .................................................................................. 17
2.7 Literature Review Summary ....................................................................................................... 21
CHAPTER 3 SURVEY DESIGN ..................................................................................................... 22
3.1 Survey Questionnaire .................................................................................................................. 22
3.2 Survey Questionnaire Data Analysis Use ................................................................................... 23
3.3 Survey Distribution Sites ............................................................................................................ 25
Page 5
iv
CHAPTER 4 DATA COLLECTION ................................................................................................. 26
4.1 Survey Distribution Methodology ............................................................................................... 26
4.2 Survey Distribution ..................................................................................................................... 26
4.3 Data Reduction ............................................................................................................................ 33
CHAPTER 5 DATA ANALYSIS ..................................................................................................... 34
5.1 Data Analysis Methodology ........................................................................................................ 34
5.2 Results of Questions Assessing Knowledge of Roundabout Negotiation ................................... 38
5.3 Cross Tabulation of Individual Questions Results ...................................................................... 40
5.4 Analysis of Roundabout Knowledge ........................................................................................... 53
5.5 T-test Analysis Results ................................................................................................................ 53
5.6 Ordinal Regression Model Estimation Results ........................................................................... 54
5.7 Roundabout Elements of Concern to Drivers.............................................................................. 57
5.8 Helpful Informational Techniques .............................................................................................. 57
CHAPTER 6 CONCLUSIONS AND RECOMMENDATIONS................................................................ 59
6.1 Conclusions ................................................................................................................................. 59
6.2 Recommendations ....................................................................................................................... 61
6.3 Future Work ................................................................................................................................ 64
REFERENCES .............................................................................................................................. 65
APPENDICES .............................................................................................................................. 68
Appendix A Survey Questionnaire ................................................................................................... 69
Appendix B Data Coding & Reduction ............................................................................................. 81
Appendix C Cross Tabulation Results .............................................................................................. 89
Appendix D Graphical Representation of Significant Results ........................................................ 114
Appendix E Roundabout Information from Nebraska Driver’s Manual ......................................... 146
Page 6
v
List of Figures
1.1 Key Roundabout Features ..............................................................................................3
2.1 Total Crashes after the Construction of the 33rd
and Sheridan Roundabout................20
5.1 Responses to Questions Assessing Knowledge of Roundabout Negotiation ..............40
5.2 Elements of Concern to Drivers ...................................................................................57
5.3 Preferred Helpful Information Techniques ..................................................................58
6.1 Suggested Update to NE Driver’s Manual on Driving Single-Lane ...............................
Roundabouts .........................................................................................................62
6.2 Suggested Update to NE Driver’s Manual on Driving Multi-Lane .................................
Roundabouts ..........................................................................................................63
D.1 Question C2 Graphical Results for Hypothesis 1 .....................................................114
D.2 Question C4 Graphical Results for Hypothesis 1 .....................................................115
D.3 Question C7 Graphical Results for Hypothesis 1 .....................................................116
D.4 Question C9 Graphical Results for Hypothesis 1 .....................................................117
D.5 Question C10 Graphical Results for Hypothesis 1 ...................................................118
D.6 Question C11 Graphical Results for Hypothesis 1 ...................................................119
D.7 Question C7 Graphical Results for Hypothesis 2 .....................................................120
D.8 Question C11 Graphical Results for Hypothesis 2 ...................................................121
D.9 Question C2 Graphical Results for Hypothesis 3 .....................................................122
D.10 Question C4 Graphical Results for Hypothesis 3 ...................................................123
D.11 Question C6 Graphical Results for Hypothesis 3 ...................................................124
D.12 Question C7 Graphical Results for Hypothesis 3 ...................................................125
D.13 Question C9 Graphical Results for Hypothesis 3 ...................................................126
D.14 Question C10 Graphical Results for Hypothesis 3 .................................................127
Page 7
vi
D.15 Question C11 Graphical Results for Hypothesis 3 .................................................128
D16 Question C2 Graphical Results for Hypothesis 4 ....................................................129
D.17 Question C4 Graphical Results for Hypothesis 4 ...................................................130
D.18 Question C10 Graphical Results for Hypothesis 4 .................................................131
D.19 Question C2 Graphical Results for Hypothesis 6 ...................................................132
D.20 Question C5 Graphical Results for Hypothesis 6 ...................................................133
D.21 Question C6 Graphical Results for Hypothesis 6 ...................................................134
D.22 Question C7 Graphical Results for Hypothesis 6 ...................................................135
D.23 Question C10 Graphical Results for Hypothesis 6 .................................................136
D.24 Question C11 Graphical Results for Hypothesis 6 .................................................137
D.25 Question C2 Graphical Results for Hypothesis 7 ...................................................138
D.26 Question C4 Graphical Results for Hypothesis 7 ...................................................139
D.27 Question C5 Graphical Results for Hypothesis 7 ...................................................140
D.28 Question C7 Graphical Results for Hypothesis 7 ...................................................141
D.29 Question C8 Graphical Results for Hypothesis 7 ...................................................142
D.30 Question C9 Graphical Results for Hypothesis 7 ...................................................143
D.31 Question C10 Graphical Results for Hypothesis 7 .................................................144
D.32 Question C11 Graphical Results for Hypothesis 7 .................................................145
E.1 Existing Information in Nebraska Driver’s Manual .................................................147
Page 8
vii
List of Tables
2.1 Roundabout Safety and Operations Literature Summary ..............................................9
2.2 Roundabout Model Development Literature Summary ...............................................11
2.3 Public Opinion, Involvement, and Impact Literature Summary ..................................13
2.4 Driver Confusion Literature Summary ........................................................................17
2.5 Video Review of Conflict Summary............................................................................18
2.6 Conflict Comparison ....................................................................................................19
3.1 Questions that Assess Knowledge of Roundabout Negotiation ..................................24
4.1 Plattsmouth Survey Distribution Activity Centers ......................................................27
4.2 Lincoln Survey Distribution Activity Centers .............................................................28
4.3 Omaha Survey Distribution Activity Centers ..............................................................29
4.4 Blair Survey Distribution Activity Centers..................................................................30
4.5 Norfolk Survey Distribution Activity Centers .............................................................31
4.6 Return Rate for Survey Distribution Centers ...............................................................32
5.1 Variables Used in Analyses .........................................................................................34
5.2 Responses to Questions Assessing Knowledge of Correct Negotiation ......................39
5.3 Chi-squared Significance Values from Cross Tabulation Analyses ............................41
5.4 Frequency of Responses for Hypothesis 1 ...................................................................42
5.5 Frequency of Responses for Hypothesis 2 ...................................................................43
5.6 Frequency of Responses for Hypothesis 3 ...................................................................45
5.7 Frequency of Responses for Hypothesis 4 ...................................................................46
5.8 Frequency of Responses for Hypothesis 6 ...................................................................48
5.9 Frequency of Responses for Hypothesis 7 ...................................................................50
Page 9
viii
5.10 Hypotheses Significant Cross Tabulation Results .....................................................51
5.11 T-test Results for Hypotheses ....................................................................................54
5.12 Ordinal Regression Model Results ............................................................................55
5.13 Significant Parameters from Regression Analysis .....................................................56
B.1 Variable Coding for Analysis ......................................................................................82
B.2 Deleted Survey Responses ..........................................................................................88
C.1 Hypothesis 1 Cross Tabulation Results for Question C2 ............................................89
C.2 Hypothesis 1 Cross Tabulation Results for Question C4 ............................................89
C.3 Hypothesis 1 Cross Tabulation Results for Question C5 ............................................90
C.4 Hypothesis 1 Cross Tabulation Results for Question C6 ............................................90
C.5 Hypothesis 1 Cross Tabulation Results for Question C7 ............................................90
C.6 Hypothesis 1 Cross Tabulation Results for Question C8 ............................................91
C.7 Hypothesis 1 Cross Tabulation Results for Question C9 ............................................91
C.8 Hypothesis 1 Cross Tabulation Results for Question C10 ..........................................91
C.9 Hypothesis 1 Cross Tabulation Results for Question C11 ..........................................92
C.10 Hypothesis 2 Cross Tabulation Results for Question C2 ..........................................92
C.11 Hypothesis 2 Cross Tabulation Results for Question C4 ..........................................92
C.12 Hypothesis 2 Cross Tabulation Results for Question C5 ..........................................93
C.13 Hypothesis 2 Cross Tabulation Results for Question C6 ..........................................93
C.14 Hypothesis 2 Cross Tabulation Results for Question C7 ..........................................93
C.15 Hypothesis 2 Cross Tabulation Results for Question C8 ..........................................94
C.16 Hypothesis 2 Cross Tabulation Results for Question C9 ..........................................94
C.17 Hypothesis 2 Cross Tabulation Results for Question C10 ........................................94
Page 10
ix
C.18 Hypothesis 2 Cross Tabulation Results for Question C11 ........................................95
C.19 Hypothesis 3 Cross Tabulation Results for Question C2 ..........................................95
C.20 Hypothesis 3 Cross Tabulation Results for Question C4 ..........................................96
C.21 Hypothesis 3 Cross Tabulation Results for Question C5 ..........................................96
C.22 Hypothesis 3 Cross Tabulation Results for Question C6 ..........................................97
C.23 Hypothesis 3 Cross Tabulation Results for Question C7 ..........................................97
C.24 Hypothesis 3 Cross Tabulation Results for Question C8 ..........................................98
C.25 Hypothesis 3 Cross Tabulation Results for Question C9 ..........................................98
C.26 Hypothesis 3 Cross Tabulation Results for Question C10 ........................................99
C.27 Hypothesis 3 Cross Tabulation Results for Question C11 ........................................99
C.28 Hypothesis 4 Cross Tabulation Results for Question C2 ........................................100
C.29 Hypothesis 4 Cross Tabulation Results for Question C4 ........................................100
C.30 Hypothesis 4 Cross Tabulation Results for Question C5 ........................................100
C.31 Hypothesis 4 Cross Tabulation Results for Question C6 ........................................101
C.32 Hypothesis 4 Cross Tabulation Results for Question C7 ........................................101
C.33 Hypothesis 4 Cross Tabulation Results for Question C8 ........................................101
C.34 Hypothesis 4 Cross Tabulation Results for Question C9 ........................................102
C.35 Hypothesis 4 Cross Tabulation Results for Question C10 ......................................102
C.36 Hypothesis 4 Cross Tabulation Results for Question C11 ......................................102
C.37 Hypothesis 5 Cross Tabulation Results for Question C2 ........................................103
C.38 Hypothesis 5 Cross Tabulation Results for Question C4 ........................................103
C.39 Hypothesis 5 Cross Tabulation Results for Question C5 ........................................104
C.40 Hypothesis 5 Cross Tabulation Results for Question C6 ........................................104
Page 11
x
C.41 Hypothesis 5 Cross Tabulation Results for Question C7 ........................................104
C.42 Hypothesis 5 Cross Tabulation Results for Question C8 ........................................105
C.43 Hypothesis 5 Cross Tabulation Results for Question C9 ........................................105
C.44 Hypothesis 5 Cross Tabulation Results for Question C10 ......................................105
C.45 Hypothesis 5 Cross Tabulation Results for Question C11 ......................................106
C.46 Hypothesis 6 Cross Tabulation Results for Question C2 ........................................106
C.47 Hypothesis 6 Cross Tabulation Results for Question C4 ........................................106
C.48 Hypothesis 6 Cross Tabulation Results for Question C5 ........................................107
C.49 Hypothesis 6 Cross Tabulation Results for Question C6 ........................................107
C.50 Hypothesis 6 Cross Tabulation Results for Question C7 ........................................107
C.51 Hypothesis 6 Cross Tabulation Results for Question C8 ........................................108
C.52 Hypothesis 6 Cross Tabulation Results for Question C9 ........................................108
C.53 Hypothesis 6 Cross Tabulation Results for Question C10 ......................................108
C.54 Hypothesis 6 Cross Tabulation Results for Question C11 ......................................109
C.55 Hypothesis 7 Cross Tabulation Results for Question C2 ........................................109
C.56 Hypothesis 7 Cross Tabulation Results for Question C4 ........................................110
C.57 Hypothesis 7 Cross Tabulation Results for Question C5 ........................................110
C.58 Hypothesis 7 Cross Tabulation Results for Question C6 ........................................110
C.59 Hypothesis 7 Cross Tabulation Results for Question C7 ........................................111
C.60 Hypothesis 7 Cross Tabulation Results for Question C8 ........................................111
C.61 Hypothesis 7 Cross Tabulation Results for Question C9 ........................................111
C.62 Hypothesis 7 Cross Tabulation Results for Question C10 ......................................112
C.63 Hypothesis 7 Cross Tabulation Results for Question C11 ......................................112
Page 12
xi
C.64 Initial Ordinal Regression Analysis ........................................................................113
Page 13
xii
Disclaimer
This report was funded in part through grants from the Federal Highway Administration,
U.S. Department of Transportation. The views and opinions of the authors expressed herein do
not necessarily state or reflect those of the U. S. Department of Transportation or the Nebraska
Department of Roads, or the University of Nebraska-Lincoln. This report does not constitute a
standard, specification, or regulation. Trade or manufacturers’ names that appear in this report
are cited only because they were relevant to this research. The appearances of trade or
manufacturers’ names do not constitute endorsements.
Page 14
xiii
Acknowledgments
The research team is thankful to the Nebraska Department of Roads for sponsoring this
research. Members of the project technical advisory committee, including Jim Knott, Don Turek,
Dan Waddle, Laura Lenzen, and Virendra Singh, provided direction for this research and
insightful comments on multiple aspects of roundabout research. The research team is thankful to
the Nebraska Department of Roads Materials and Research Division staff, including Moe
Jamshidi, Amy Starr, Jodi Gibson, Lieska Halsey, and Matt Beran, for providing help with
multiple aspects of this research project. Respondents to the roundabout survey including those
who helped with the pilot survey are acknowledged for providing valuable input.
Page 15
xiv
Abstract
This research deals with two related issues: investigation and mitigation of roundabout
elements that lead to driver confusion, and development of a flexible criteria matrix by which the
Nebraska Department of Roads (NDOR) can evaluate arterial intersections to identify good
candidates for conversion to roundabouts. The use of modern roundabouts along arterial
roadways is relatively new in Nebraska. The first urban arterial roundabout was opened to traffic
in June of 2002 at the intersection of 33rd and Sheridan Blvd in the City of Lincoln. Citizens and
some professionals were somewhat skeptical of the capability of this roundabout to improve
traffic delay and safety. However, after the construction of this roundabout the City of Lincoln
has reported reduced traffic delays and the Nebraska Department of Roads (NDOR) has reported
a reduction in traffic accidents. The objectives of the research include: (1) identification of user
issues and confusing elements of roundabouts via surveys and development of mitigation
measures for safer usage of arterial roundabouts in Nebraska; and (2) development of a criteria
matrix for arterial intersections that NDOR can use to check the candidacy of intersections for
conversion to single-or multi-lane roundabouts.
Page 16
xv
Executive Summary
Construction of modern roundabouts in place of traditional four-legged intersections is
becoming common in the United States. Roundabout negotiation can be confusing for drivers
who are not familiar with their use. This research was carried out to identify roundabout
elements that play a role in incorrect roundabout negotiation, ascertain driver characteristics
prominent in incorrect roundabout negotiation, assess the relative potential for incorrect
negotiation amongst different groups of drivers, and suggest measures for improving drivers’
abilities to negotiate roundabouts.
Potential for incorrect roundabout negotiation was measured by asking questions in a
survey questionnaire related to rules of roundabout negotiation and the purpose of different
roundabout elements. Incorrectly answered questions from the survey identified roundabout
design elements that can potentially lead to incorrect roundabout use. Analyses tested seven
hypotheses regarding driver characteristics leading to incorrect roundabout negotiation. Results
showed six driver groups that had greater potential for incorrect roundabout negotiation:
Unfamiliar roundabout users compared to familiar users (those drivers using roundabouts
more than once per month).
Passenger vehicle drivers compared to specialty vehicle drivers (police, bus, etc.).
Drivers in cities without roundabouts compared to drivers in cities with roundabouts.
Older drivers compared to younger drivers (ages less than 60 years).
Drivers who dislike roundabouts compared to drivers that like roundabouts.
Drivers that are not confident they can drive through a roundabout compared to drivers
that are confident they can drive through a roundabout.
Page 17
xvi
Drivers that do not generally wear their seat belt when driving have a greater potential for
incorrect roundabout negotiation compared to drivers that generally wear a seat belt.
Drivers that generally do not avoid certain roadways and intersections because of traffic
congestion have a greater potential for incorrect roundabout negotiation compared to
drivers that generally avoid certain roadways and intersections because of traffic
congestion.
Results also showed that drivers were concerned about the behavior of other drivers,
emergency vehicle procedures, and wanted to receive information on roundabouts via driver’s
manual, brochures and on-site signage. Recommendations include provision of information on a
priority basis to non-specialty vehicle drivers concerning roundabout elements, including truck
apron purpose and use, turn signal use, and emergency vehicle procedures. The research team
also recommends updating information on roundabouts contained in the Nebraska Driver’s
Manual.
Page 18
1
Chapter 1 Introduction
1.1 Report Organization
This report consists of five chapters; this introductory chapter is followed by a chapter
that provides a review of relevant literature on roundabouts. The third chapter presents details of
a roundabout survey questionnaire developed as part of this research project and collected data,
while the fourth chapter describes analysis of the collected data including testing of research
hypotheses. The last chapter of this report presents research conclusions, recommendations, and
identifies roundabout issues for future research.
1.2 Background
Consideration and construction of modern roundabouts in place of traditional four-legged
intersections is increasing in the United States. Modern roundabouts in the United States have
been adopted from Europe and Australia, where roundabout usage is more common. The modern
roundabout is a circular intersection that requires entering drivers to yield to traffic in the circle
and allows for continuous traffic flow through the intersection at speeds less than 30 mph (1).
Roundabouts provide operational and safety benefits and their common use in transportation
roadway design is recommended (2, 3, 4). Many drivers confuse modern roundabouts with
rotaries and neighborhood traffic circles. While these three roadway design elements do have
similarities, they have different operational and design characteristics as described below.
A rotary intersection is a precursor of the modern roundabout, as it is a circular
intersection designed to move traffic more efficiently (more continuous flow of traffic) through
an intersection than a more typical stop-controlled or signalized intersection. A rotary, much like
a modern roundabout, has continuous traffic flow, creating little delay from stoppage. Rotary
applications were limited due to the large diameter requirement, as large as 1,000 ft for design
Page 19
2
speeds of 40 mph; and a limited capacity of no more than 3,000 vehicles per hour (vph) entering
from all intersection legs (5). Rotaries operated according to the traditional “yield-to-the-right”
rule where circulating traffic yielded to entering traffic. Rotaries were common in the United
States prior to the 1960’s but they did not operate effectively and had high crash rates so they fell
out of use (1). Design guidelines for rotary intersections were removed from the American
Association of State Highway and Transportation Officials (AASHTO) design guidebook in
1984 (6, 7).
Roadway designers use neighborhood traffic circles on local streets for traffic calming
purposes. The diameters of these circles are typically smaller than modern roundabout diameters.
The typical neighborhood traffic circle diameter is less than 25 ft, while a modern roundabout
typically has a diameter of at least 45 ft and it can be as large as 200 ft (1). The approaches of a
neighborhood traffic circle may be uncontrolled or stop-controlled and are usually
unchannelized. Some neighborhood traffic circles allow direct left turn movements similar to an
uncontrolled intersection (1).
Modern roundabouts differ from rotaries and neighborhood traffic circles in several
design and operational features. In a roundabout, all traffic must yield on entry, approaches are
channelized, and geometric curvature is designed for travel speeds that are typically less than 30
mph (1).
Figure 1.1 shows the general geometric layout of a modern roundabout (hereafter referred
to simply as a roundabout). Splitter islands separate entering and exiting traffic and also deflect
traffic to reduce entrance speeds. The splitter islands also provide a refuge point for pedestrians.
Roundabouts have a central island with a truck apron (for small diameter roundabouts) to
accommodate large vehicles negotiating the horizontal curvature of the roadway. A roundabout
Page 20
3
can be designed at varying diameters (45 – 200 ft) to accommodate many individual project
requirements, such as right-of-way (ROW) restraints, roadway widths, and roadway entry angles,
among others. Roundabouts can accommodate any number of legs as long as all approach
centerlines pass through the center of the inscribed circle and the angles between the legs are
equally spaced (1). Pedestrian and bicycle traffic can be accommodated at roundabouts when
necessary.
Figure 1.1 Key Roundabout Features (8)
Page 21
4
The use of roundabouts in the United States is relatively new, beginning in the 1990s.
Much research has documented the operation and safety aspects of their implementation. Further,
research has shown that drivers are initially opposed to roundabout construction and frequently
cite confusion of roundabout negotiation as a cause for this opposition. However, driver
opposition and their confusion decrease after the construction of a roundabout (3, 4, 9).
Roundabouts have been constructed on Nebraska roadways starting with the first
construction of a roundabout along a major urban arterial in 2002 at the intersection of 33rd
Street
and Sheridan Boulevard in Lincoln. A study conducted by Kirkham Michael (funded by the City
of Lincoln) analyzed operational and safety characteristics at this roundabout (10) showing that
crash rate and average intersection delay decreased when the intersection was converted to a
roundabout from a traditional four-legged signalized intersection. Although delay and safety
were improved, the Nebraska Department of Roads (NDOR) remains concerned about drivers’
potential for incorrect roundabout negotiation.
1.3 Research Statement and Objectives
This research hypothesized that drivers’ potential for incorrect roundabout negotiation
depends on roundabout design elements and drivers’ characteristics. Roundabout design
elements that contribute to incorrect driver negotiation and driver characteristics influencing the
potential for incorrect roundabout negotiation are unidentified in the literature. While it is
reasonable to expect that different groups of drivers (e.g. drivers of specialty vehicles, passenger
car drivers, etc.) will have different potentials for incorrect roundabout negotiation, such
differences are unknown.
The main objective of this research was the identification of user issues and confusing
elements of roundabouts via survey questionnaires and development of mitigation measures for
Page 22
5
safer usage of arterial roundabouts in Nebraska. Specifically, the research was to identify
roundabout elements that play a role in incorrect roundabout negotiation, ascertain driver
characteristics prominent in incorrect roundabout negotiation, assess the relative potential for
incorrect negotiation amongst different groups of drivers, and suggest measures for improving
drivers’ abilities to properly negotiate roundabouts. For this research, potential for incorrect
roundabout negotiation was measured by asking drivers to illustrate their knowledge of proper
roundabout negotiation procedures. Drivers who correctly answered more questions related to
proper roundabout negotiation procedures were deemed to have less potential for incorrect
negotiation.
1.4 Research Hypotheses
This research tested the following hypotheses to determine driver characteristics
prominent in correct negotiation of roundabouts.
Hypothesis 1
Unfamiliar roundabout users have a greater potential for incorrect roundabout negotiation
compared to drivers familiar with roundabouts. Roundabout users were deemed familiar if they
used a roundabout at least once per month.
Hypothesis 2
Passenger vehicle drivers have a greater potential for incorrect roundabout negotiation compared
to specialty vehicle drivers. For this research, specialty vehicles were defined as: ambulance,
police vehicle, snowplow, municipal bus, school bus, large (semi) truck, fire ladder truck, and
garbage/delivery vehicle.
Page 23
6
Hypothesis 3
Drivers in Nebraska cities without roundabouts have a greater potential for incorrect roundabout
negotiation compared to drivers in Nebraska cities with roundabouts.
Hypothesis 4
Older drivers (≥ 60 years) have a greater potential for incorrect roundabout negotiation compared
to younger drivers.
Hypothesis 5
Drivers who make fewer daily trips have a greater potential for incorrect roundabout negotiation
compared to drivers who make five or more daily trips.
Hypothesis 6
Drivers who dislike roundabouts have a greater potential for incorrect roundabout negotiation
compared to those that approve of roundabout use.
Hypothesis 7
Drivers that do not feel confident they can drive through a roundabout in the correct manner have
a greater potential for incorrect roundabout negotiation compared to those that feel confident
they can drive through a roundabout in the correct manner.
Page 24
7
Chapter 2 Literature Review
Topics covered in the literature review were: roundabout safety and operations, modeling
of roundabouts, public opinions, public information, and driver confusion. In addition, a review
of archived video of the opening of a roundabout at 33rd
Street and Sheridan Boulevard in
Lincoln, Nebraska was performed.
2.1 Roundabout Safety and Operations
Persaud et al. and Waddell and Albertson have analyzed the safety of roundabouts
constructed throughout the country using before-and-after studies (2, 11). This research has
shown safety improvements when converting two-way stop, four-way stop, and signalized
controlled intersections to roundabouts. Crash rates have decreased, especially fatal crashes, at
converted roundabout intersections. Persaud et al. showed a 40 % reduction in total crash rates,
80 % reduction in injury crash rates, and 90 % reduction in fatal crash rates for converted
roundabout intersections (2). Most crashes on roundabouts are not usually associated with
serious injuries (e.g. they are rear-end or sideswipe crashes).
Retting et al. analyzed operational aspects of roundabouts constructed throughout the
country and showed that roundabouts reduce delay for converted intersections (3, 4).
Roundabouts improve operations at problem intersections where other traffic control has failed
(11, 12, 13). Transportation agencies are turning to roundabouts more often to solve delay
problems that could not easily be solved by other traffic control measures.
Roundabouts improve corridor operations as well as single intersection operations (14).
Use of roundabouts along a corridor can improve safety and operations by eliminating conflict
points from left-turning movements at intersections and mid-block two-way left-turn lanes.
Delay and travel time through a corridor can be improved by eliminating all left-turning
Page 25
8
movements and having right-in, right-out operation at mid-block driveways. Drivers wishing to
turn left mid-block can perform a U-turn at a roundabout intersection to get to their final
destination (14). A summary of literature documenting the safety and operations research in
roundabouts discussed in this literature review is shown in table 2.1.
Page 26
9
Table 2.1 Roundabout Safety and Operations Literature Summary
2.2 Roundabout Modeling
Researchers have developed different modeling techniques for roundabout analysis since
their use has become common in the US (13, 15, 16, 17, 18). For example, Kittelson &
Research Objective Author Methodology Major Findings/Results
Determine crash rate
changes after
roundabout
conversion
Persaud
et al.,
2001
Empirical Bayes
crash data
analysis
40% reduction for all crash severities
80% reduction for injury crashes
90% reduction for fatal injury crashes
Determine crash rate
changes after 4
roundabout
conversions along a
business corridor
Ariniello
et al.,
2005
Before/after
crash data
analysis
Even with an increase in traffic, an
88% reduction in crashes (93%
reduction in injury crashes) was
experienced on the corridor
Evaluate impact of
roundabout
construction on
traffic flow at three
sites
Retting
et al.,
2002
Before/after
traffic flow
video data
analysis using
SIDRA
Vehicle stops reduced by 14, 34, and
37 %
Traffic saturation reduced by 56, 62,
and 59 %
Evaluate impact of
roundabout
construction on
traffic flow at three
sites
Retting
et al.,
2006
Before/after
traffic flow
video data
analysis using
SIDRA
Average intersection delays reduced
by 83-93 %
Congestion (v/c ratio used) reduced by
58-84 %
Evaluate delay of
mini-roundabout vs.
AWSC
Waddell
et al.,
2005
HCM delay
models using
RODEL-1
Delay reduced by 63% (measured in
delay hours)
Determine travel
time changes after 4
roundabout
conversions along a
business corridor
Ariniello
et al.,
2005
Before/after data
analysis
Corridor travel time was reduced from
103 to 68 seconds
Access point delay reduced from 28 to
13 seconds
Page 27
10
Associates, Inc. have developed computer modeling software and regression models to predict
crash rates and operational characteristics of roundabouts (13). Analysts can apply these models
to evaluate proposed conversions to roundabouts. In addition to models, Chapman and
Benekohal developed a set of four roundabout warrants (16). These warrants work much like the
warrants for implementing a traffic signal and transportation officials can use them to justify
roundabout construction. The four warrants include pedestrian volume, horizontal alignment,
vertical alignment, and unbalanced flow. Table 2.2 presents a summary of literature documenting
roundabout modeling techniques.
Page 28
11
Table 2.2 Roundabout Model Development Literature Summary
Research Objective Author Analysis Tool Major Findings/Results
Develop roundabout
safety prediction
models
Kittelson
&
Associates,
Inc., 2006
Empirical Bayes
method, regression
analysis used to create
a working table
Percent reduction in
accidents for different
conversion situations
Develop
performance index
for comparing delay
at differing
intersection types
Kennedy
et al., 2005
Conflict opportunity
software
The model accurately
predicts crash rates for
intersection conversion
Develop roundabout
installation warrants
Chapman
et al., 2002
Research review Four warrants were
identified: pedestrian
volume, horizontal
alignment, vertical
alignment, and
unbalanced flow
Develop roundabout
operation prediction
models
Kittelson
&
Associates,
Inc., 2006
Calibrated regression
analysis used to create
a critical lane flow
equation
Capacity models for
analyzing roundabout
operations and proposed
LOS critical lane flow
values
Investigate
relationship between
geometric design
and speeds
Asma et
al., 2006
Correlation analysis
of multiple variables
85th percentile speed
prediction models at
approach, entry,
circulating and exiting
2.3 Public Opinion, Involvement and Impact
Researchers have conducted studies on public opinion of roundabouts in the US (3, 4, 9,
19, 20). Many transportation agencies have experienced public resistance when implementing
roundabouts. Public opinion polls of drivers in Hutchinson, Kansas; Harford County, Maryland;
and Reno, Nevada (communities where roundabout construction was planned) show that more
Page 29
12
than half of surveyed drivers (55%) were opposed to roundabout construction and were not
aware of their operational characteristics (3). Drivers surveyed stated safety, confusion, or that
they would rather have a traffic signal as the main reasons for opposing roundabouts both before
and after construction (3). The reasons given for opposing roundabouts were the same before and
after roundabout construction, but the overall proportion of drivers opposed to roundabouts
decreased by 27% after roundabout construction (3). Other research has achieved similar results
in driver opinion of roundabouts; table 2.3 summarizes these results.
Page 30
13
Table 2.3 Public Opinion, Involvement, and Impact Literature Summary
Research Objective Author Methodology Major Findings/Results
Identify if drivers
are confused at
roundabouts
Doucet,
2006
Paper survey Alternate signage recommended,
favorable public opinion of
operations and safety
Measure public
opinion before and
after roundabout
construction
Retting
et al.,
2002
Before/after
telephone
survey
Before: 31% favor, 55% oppose
After: 63% favor, 28% oppose
Measure public
opinion before and
after roundabout
construction
Retting
et al.,
2006
Before/after
telephone
survey
Before: 36% support roundabout
After: 50% support roundabout
Measure long term
public opinion in
communities with
roundabouts
Retting
et al.,
2007
Telephone
survey Favor: before: 17%, 6-weeks
after: 57%, 1-5 years after: 69%
Oppose: before: 54%, 6-weeks
after: 32%, 1-5 years after: 24%
To gather input from
residents regarding
roundabout
perceptions
ETC
Institute,
2006
Mail Out/
Telephone
Survey
62% of residents were satisfied
while 15% were dissatisfied.
Residents believe travel time is
reduced and prefer roundabouts to
other intersection types
Show improved
roadway operations
lead to economic
growth for area
business
Ariniello
et al.,
2005
Before/after
economic
data analysis
Economic growth was shown for
the corridor that had roundabouts
constructed and all area businesses
supported their construction
because of this growth
Review roundabout
design process used
in different local
projects
Kliska et
al., 2005
Project
review
High public involvement and
education in advance of
roundabout construction leads to
less opposition
Page 31
14
Many of the studies conducted on roundabout opinion were in communities where
roundabout construction was new. Therefore, many drivers were not familiar with roundabout
operations, and the result that drivers opposed roundabouts before construction and supported
them after was reasonable. Drivers surveyed in communities that had more exposure to
roundabouts, for longer periods, were much more accepting of roundabouts and had favorable
opinions of their construction (20). Public opinion improved over time as higher proportions of
drivers were in favor of roundabouts one to five years after construction (9).
Roundabouts are effective in improving the economic vitality of a region by decreasing
overall delay to allow customers better access to businesses (14). Businesses and community
members may oppose roundabout construction because they feel that roundabouts will cause
more congestion and safety problems affecting the economy of the region. Ariniello showed
roundabouts constructed along a corridor of businesses decreased delay and travel times, which
led to more economic growth for those businesses (14).
Roundabout projects with high levels of public involvement and education have led to
successful roundabout construction. Involving the public reduces driver misconceptions and
promotes joint gain for all parties, meaning that all parties can be satisfied with the outcome of
the decisions made. Explaining the benefits of roundabouts to drivers will help them know why a
roundabout is proposed (12). A summary of literature documenting public opinion, involvement
and impact in roundabout construction discussed in this literature review is shown in table 2.3.
2.4 Roundabout Information Dissemination to the Public
Transportation agencies have employed different roundabout information dissemination
techniques such as brochures and websites. Informing drivers on safety aspects of roundabouts,
as well as proper driving techniques, help drivers understand the proposed construction of a
Page 32
15
roundabout in their community and how they should drive when negotiating the roundabout.
Other information distribution methods include public meetings and demonstrations. Researchers
have shown that providing information to the public is vital to the acceptance of a roundabout
project. More information given to drivers in as many ways as possible has resulted in better
roundabout operations and greater acceptance by communities (12, 21, 22, 23). The proper
information technique used for a certain project should be determined individually to best serve
the needs of a community. For example, a special demonstration may be the best method for a
retirement community that will be directly affected by roundabout construction (12).
The State of Nebraska has produced a brochure detailing the benefits and operational
characteristics of roundabouts to use when opening roundabouts throughout the state (24). In
addition, at the opening of the first arterial roundabout in the City of Lincoln, NE, officials used
variable message signs on a temporary basis to help better inform drivers approaching the
roundabout of the proper operating procedure.
2.5 Driver Confusion and Error
As transportation agencies construct roundabouts, they can expect issues at these
intersections. Research in roadway design elements such as roundabouts that confuse drivers is
sparse. Roundabouts have design elements that go against common rules-of-the-road operation
that can lead to confusion and error for unfamiliar drivers. Traffic circulates in a
counterclockwise direction, and drivers must yield to a vehicle to the left when at the approach
waiting to enter the circular roadway. This activity goes against the common rule-of-the-road
expectancy to yield to vehicles on the right when at an intersection. Figure 1.1 shows the
geometric layout of a typical roundabout with the locations of the approaches and the circular
roadway. In addition, drivers wanting to make a left turn will not take the most direct route to
Page 33
16
attain their desired change of direction. Both of these elements go against common driver
practice at intersecting roadways, and can lead to driver confusion or error. An unfamiliar driver
approaching a roundabout can cause operational as well as safety problems.
Geometric features of roundabouts vary with the different applications of roundabouts.
Research has recommended geometric features of roundabouts to fall within certain parameters,
such as having four legs. However, agencies can design roundabouts to fit a particular
application (1, 8, 25). Differences in the geometric design of roundabouts can lead to driver
confusion and erroneous negotiation.
Retting et al. conducted three before-and-after telephone driver opinion studies reporting
on driver confusion at roundabouts (3, 4, 9). Drivers cited confusion as a reason for opposing
roundabouts more frequently after the construction of a roundabout in their community. Results
of these studies showed increases of 6% (3) and 1% (4) directly after the construction of a
roundabout, and a 7% (9) long-term increase in drivers that cited confusion for opposing
roundabouts. The authors did not define driver confusion and only reported it as a response to
why participants opposed roundabouts. A summary of this literature documenting how other
researchers have described driver confusion at roundabouts discussed in this literature review is
shown in table 2.4.
Page 34
17
Table 2.4 Driver Confusion Literature Summary
Research Objective Author Driver Confusion Survey Results
Measure public opinion
before and after roundabout
construction
Retting et
al., 2002
21% before and 27% after construction
opposed roundabouts because of
confusion
Measure public opinion
before and after roundabout
construction
Retting et
al., 2006
20% before and 21% after construction
opposed roundabouts because of
confusion
Measure long term public
opinion after roundabout
construction at previously
studied sites
Retting et
al., 2007
28% of respondents cited confusion as
reason for opposition 1 to 5 years after
construction
2.6 Review of Roundabout Operations Video
In addition to the literature review, the research team conducted a review of operations at
the 33rd Street and Sheridan Boulevard roundabout in Lincoln. A previous NDOR-funded study
performed by the Mid-America Transportation Center (MATC) included video surveillance after
opening of the roundabout to document operations, safety and driver conflicts (26). Video
surveillance data used in that project was used in this review to document driver conflicts. Table
2.5 shows a summary of documented driver conflicts.
Page 35
18
Table 2.5 Video Review Conflict Summary
Right-of-way
conflicts
Vehicle on circular roadway yields to vehicle on approach
Approaching vehicle does not yield to vehicle within the circular
roadway
Vehicle-pedestrian
conflicts
Pedestrian walks in the circular roadway instead of using the
crosswalks
Vehicle stops on the circular roadway instead of at the crosswalk stop
bar to wait for pedestrians
Driver error conflicts One vehicle turns wide to exit the roundabout while the next vehicle
turns tightly causing the two vehicles to be side by side at the exit
Vehicle stops on the circular roadway and backs up to turn onto the
proper exit
Tractor-trailer drives onto the central island past the truck apron since
unprepared to drive the tight turns of the roundabout
Emergency vehicle
procedure conflicts
Vehicle stops on the circular roadway to wait for an emergency
vehicle approaching the roundabout instead of exiting the roundabout
Driver behaviors shown in table 2.5 represent the range of driver conflicts experienced at
the 33rd
Street and Sheridan Boulevard roundabout. Conflicts documented included right-of-way
issues such as drivers within the circular roadway yielding to entering traffic and drivers on the
approaches not yielding to those in the circular intersection. The video review showed vehicle-
pedestrian conflicts as well, such as vehicles waiting for pedestrians on the roundabout instead of
at the stop-bar locations. The conflicts documented do not represent every possible conflict but
represent easily identifiable conflicts that can be related to incorrect roundabout negotiation as
defined in this research. The research team performed a review of all driver conflict types of the
time period from 5 to 6 PM on opening day compared with the same time period three months
Page 36
19
later. Both dates were weekdays, with a nearby school not in session during the first date and in
session during the second. Again, video from the previous MATC study was used for this
analysis. The total number of driver conflicts was documented for each time period. There were
six more driver conflicts on the opening date (seven over one hour) than approximately three
months later (one over one hour). Table 2.6 presents a list of the observed conflicts. Although the
cause of each conflict is not known, these conflicts represent incorrect roundabout negotiation as
previously defined.
Table 2.6 Conflict Comparison
Date Time Conflict
6/2/2002 5:06 Approaching vehicle does not yield to vehicle within the
circular roadway
5:07 Vehicle on circular roadway yields to vehicle on approach
5:11 Vehicle on circular roadway yields to vehicle on approach
5:20 Vehicle on circular roadway yields to vehicle on approach
5:31 Vehicle on circular roadway yields to vehicle on approach
5:32 Vehicle on circular roadway yields to vehicle on approach
5:48 Vehicle on circular roadway yields to vehicle on approach
8/28/2002 5:22 Vehicle on circular roadway yields to vehicle on approach
The research team also performed a review of crash data from this intersection. As
stated earlier, the construction of a roundabout at the intersection of 33rd
Street and Sheridan
Boulevard has decreased crash frequencies (9). In a before-and-after study of the intersection,
Page 37
20
police-reported crash frequency decreased from 33 to 6 (both 2.5-year periods). Of those six
crashes reported in the time after the construction of the roundabout, two were reported in the
first six months, three the following year, and one during the last year of the study. Figure 2.1
shows the general trend of the crashes reported at the 33rd
Street and Sheridan Boulevard
roundabout in Lincoln over the study period. In observing this trend, traffic volume changes and
the impacts of other factors (e.g. weather, etc.) were not taken into account. Crashes reduced
over the observed period even though traffic volume would be expected to increase, which
would have resulted in a greater number of crashes, all else being equal. This is a simple
comparison of frequencies with no statistical validity so it only serves as background information
for this study.
Figure 2.1 Total Crashes after the Construction of the 33rd
and Sheridan Roundabout
Page 38
21
2.7 Literature Review Summary
Researchers have analyzed many aspects of roundabouts. The appropriate construction of
a roundabout intersection can improve the safety and operational characteristics of the
intersection. For application to this research specifically, researchers have analyzed driver
perception and opinion of roundabouts. While no literature documented in this review directly
measured driver confusion or incorrect negotiation at roundabouts, researchers have found that
drivers cite confusion as a reason for opposing roundabouts both before and after a roundabout is
constructed in their community. Retting et al. showed that the percentage of drivers opposed to
roundabouts due to confusion increased after roundabout construction. A review of operations at
a Nebraska roundabout showed how driver conflicts can be attributed to incorrect roundabout
negotiation as defined by this research.
Page 39
22
Chapter 3 Survey Design
A comprehensive survey was designed to solicit information on drivers’ knowledge of
roundabout negotiation along with their characteristics. Survey design criteria included clarity,
appropriateness of content, and proper length. Input from NDOR on the survey questionnaire
was incorporated and a pilot survey was conducted to ensure the survey was appropriate. The
University of Nebraska-Lincoln Institutional Review Board (IRB) reviewed and approved the
final survey questionnaire for distribution to human subjects after the survey questionnaire met
University policy. A discussion of the designed survey follows.
3.1Survey Questionnaire
The survey questionnaire is shown in appendix A. There were four sections of the survey
questionnaire: roundabout information, attitude and opinion, roundabout operations, and general
information. In addition to the four sections, there was a one-page consent form to inform survey
participants about the research and their part in the study. This consent form was one of the
requirements of the IRB process and serves as part of the introduction to the survey for the
respondents. There is also background information about the study on the first page with
directions on completing the questionnaire.
The first section of the survey questionnaire (section A) is a roundabout information
section. This section asks for information on drivers’ experience with roundabouts. The first two
questions ask respondents how frequently they drive through a roundabout. The next several
questions ask respondents how they get information about roundabouts and what information
technique would be the best way to inform drivers. This section also includes a question to
determine if the respondent drives a specialty vehicle (ambulance, police vehicle, snowplow,
etc.). This section concludes with several questions about the drivers’ experience with variable
Page 40
23
message signs at roundabouts and if they feel that variable message signs would be a valuable
information technique at newly constructed roundabouts.
The second section of the survey questionnaire is an attitude and opinion section
(section B). Respondents provide a level of agreement or disagreement with a series of
statements. This section is included to determine the opinion of respondents toward different
aspects of roundabouts, such as safety and delay. There are also several questions just for
specialty vehicle drivers about specific design elements of roundabouts, such as turning needs of
specialty vehicles.
The third section of the survey questionnaire is about roundabout operations (section
C). This section asks questions regarding the act of negotiating a roundabout. Questions in this
section assess the survey participants’ knowledge of correctly negotiating a roundabout. Many of
the questions of this section have correct and incorrect answers. The content covered in this
section includes proper negotiation techniques, such as right-of-way, turn signal use, and
emergency vehicle procedures.
The last section of the survey questionnaire is a general information section (section
D). This section solicits driver characteristics from survey participants, such as age, gender, and
city of residence. In addition, questions seeking information, such as number of daily trips,
commute time, and typical driving speed, are included in this section.
3.2 Survey Questionnaire Data Analysis Use
Questions from section A (Roundabout Information) were intended to define the four
survey respondent types: familiar and unfamiliar roundabout users, as well as specialty vehicle
and passenger vehicle drivers. Familiar users were defined as respondents that indicated driving
through a roundabout once or more per month (questions A1 or A2). All other respondents were
Page 41
24
considered unfamiliar users of roundabouts. Response to Question A5 was used to classify
drivers as specialty vehicle drivers or passenger vehicle drivers.
Responses to section B provided data for analysis of drivers’ opinion toward
roundabouts. The research used nine questions from section C to assess the survey respondent’s
knowledge of correctly negotiating a roundabout. More correct responses to these questions were
deemed to indicate a higher level of roundabout knowledge. These questions are shown in table
3.1 and can be seen in full, along with the correct answers, within the survey questionnaire
shown in appendix A.
Table 3.1 Questions that Assess Knowledge of Roundabout Negotiation
C2 If vehicles A and B arrive at their current positions at the same
time, which vehicle should yield?
C4 If you are trying to get from point A to point B through a
roundabout intersection, which image represents the
appropriate behavior?
C5 While driving through a roundabout, if you miss the exit you
wanted, what should you do?
C6 Should you use your turn signal while waiting at the yield line
of a roundabout?
C7 Should you use your right turn signal when exiting the
roundabout?
C8 If you are waiting at the yield line of a roundabout and an
emergency vehicle arrives at one of the other approaches, what
should you do?
C9 If you are driving in a roundabout when an emergency vehicle
approaches, what should you do?
C10 Where should vehicles wait for pedestrian and bicycle traffic
when encountered?
C11 What is the purpose of the ring-shaped paved area of a
roundabout which is shown in the figure and image?
Page 42
25
The analysis used driver characteristics that can define different driver groups, such as
age or community, to test the hypotheses of this research. Responses to section D provided
information on driver characteristics.
3.3 Survey Distribution Sites
Five cities with different population and roadway characteristics were selected for
distribution of the survey questionnaire. Selection criteria included assurance of capturing the
four driver populations (familiar and unfamiliar drivers, as well as specialty and passenger
vehicle drivers), presence and absence of roundabouts, and proximity to the City of Lincoln,
from where the research was being conducted.
The selected five cities were Lincoln, Omaha, Blair, Norfolk, and Plattsmouth.
Lincoln, Omaha, Blair, and Norfolk currently have roundabouts while Plattsmouth does not.
Using four cities that have roundabouts ensured the survey will solicit enough familiar drivers.
Most survey participants in Plattsmouth probably would be unfamiliar drivers since there is no
roundabout in that city. However, drivers in cities that do have roundabouts are not necessarily
familiar drivers since some drivers may not be using roundabouts more than once per month (the
definition of familiar drivers in this research was those using a roundabout more than once per
month). Therefore, these drivers, although in cities with roundabouts, would still be unfamiliar
roundabout users.
Page 43
26
Chapter 4 Data Collection
4.1 Survey Distribution Methodology
Surveys were distributed at major activity centers in the five selected cities. Printed
survey questionnaires were given to a person at the activity center who then distributed them to
respondents. The same person received completed questionnaires from respondents and returned
them to the research team. For example, the research team coordinated with the principal of
Skutt Catholic High School in Omaha to have the surveys distributed to students at the school.
The team left surveys with the principal and returned several weeks later to collect the completed
survey questionnaires.
A total of 2,500 surveys were distributed in the five cities. Of the 500 surveys designated
for each city, 100 targeted specialty vehicle drivers while the remainder targeted passenger
vehicle drivers. Surveys for specialty vehicle drivers were distributed at police stations,
firehouses, school transportation services, city transportation offices, trucking agencies, and
other activity centers to ensure drivers of specialty vehicles would respond to the survey.
Surveys for passenger vehicle drivers were distributed at different public activity centers. Bias in
survey distribution cannot be completely eliminated, but distribution at public activity centers
such as banks, doctors’ offices, hair salons, local businesses, community centers, and retail stores
helped to minimize it.
4.2 Survey Distribution
The survey distribution and collection effort occurred over a two-month period starting
with distribution in the City of Plattsmouth. The research team distributed the first set of surveys
on March 12th
, 2007. Table 4.1 shows activity centers where surveys were distributed, as well as
the number of surveys distributed and collected at each activity center.
Page 44
27
Table 4.1 Plattsmouth Survey Distribution Activity Centers
Name Location Distributed Collected
# Date
2007
# Date
2007
Specialty Vehicle Drivers
Plattsmouth Police Department 4th
& Main 30 12-Mar 6 6-Apr
Plattsmouth Volunteer Fire
Dept.
5th
& Ave A 15 Unable to Participate
Plattsmouth Street Dept. 444 N 13th St 15 12-Mar 6 20-Mar
Schmidt Transportation 108 E Bay Rd 15 12-Mar 0 6-Apr
Kerns Excavating Co. 2507 Smith Av 10 12-Mar 9 23-Mar
Plattsmouth School Admin. 1912 E Hwy 34 15 12-Mar 7 20-Mar
Other Drivers
McKnight Family Dental Hwy 34 & 8th
Ave 70 12-Mar 48 6-Apr
Plattsmouth High School 1916 Hwy 34 80 13-Mar 24 23-Mar
Plattsmouth State Bank 5th
& Main 50 12-Mar 16 20-Mar
Community Rehab Hwy 34 & 8th
Ave 70 12-Mar 16 20-Mar
Headquarters for Hair 3rd
& Main 70 12-Mar 24 20-Mar
Shear Design Hwy 34 & 8th
Ave 50 12-Mar 2 23-Mar
Plattsmouth Animal Hospital Hwy 34 & 8th
Ave 10 20-Mar 9 23-Mar
The large number of uncollected surveys in Plattsmouth led the research team to diversify
survey distribution centers in other cities. For example, surveys were distributed over several
days in Lincoln. Table 4.2 shows a list of the activity centers where surveys were distributed, as
well as the number of surveys collected in Lincoln. Activity centers used for survey distribution
in Omaha, Blair, and Norfolk are shown in tables 4.3, 4.4, and 4.5, respectively.
Page 45
28
Table 4.2 Lincoln Survey Distribution Activity Centers
Name Location Distributed Collected
# Date
2007
# Date
2007
Specialty Vehicle Drivers
Lincoln Fire & Rescue 18th
& Q 25 29-Mar 24 5-Apr
Lincoln Police Department 10th
& J 20 2-Apr 16 9-Apr
StarTran 7th
& J 20 30-Mar 11 9-Apr
Street Operations 901 N 6th
15 2-Apr 15 13-Apr
LPS - Transportation Services 52nd
& O 15 3-May 0
Crete Carrier Corporation NW 56th
& O 15 2-Apr 5 13-Apr
Other Drivers
Lincoln Southeast High school 2930 South 37th
85 3-May 65 16-May
Rousseau Elementary School 3701 S 33rd St 25 3-May 14 14-May
Lincoln Council on Alcohol 9th & L 30 2-Apr 24 19-Apr
Encompass Architects 7th & O 10 2-Apr 5 19-Apr
University Health Center 15th
& U 20 2-Apr 15 17-Apr
Clark Enersen Partners 11th & J 20 2-Apr 5 14-May
Catholic Family Life 37th
& Sheridan 30 30-Mar 11 13-Apr
Calvert Street Professional
Center
36th
& Calvert 37 30-Mar 6 13-Apr
Calvert Senior Center 4500 Stockwell St 25 30-Mar 1 19-Apr
Cathedral of Risen Christ
School
37th
& Sheridan 25 30-Mar 8 13-Apr
33rd & Sheridan Center 33rd
& Sheridan 25 30-Mar 12 13-Apr
33rd & Pioneers Center 33rd
& Pioneers 28 30-Mar 5 13-Apr
Gauntlet Games 13th
& High 30 30-Mar 4 13-Apr
Page 46
29
Table 4.3 Omaha Survey Distribution Activity Centers
Name Location Distributed Collected
# Date
2007
# Date
2007
Specialty Vehicle Drivers
Omaha Police Department 505 S 15th
St 25 Unable to Participate
Omaha Fire Headquarters 1516 Jackson St 20 9-Apr 19 30-Apr
Omaha Street Maintenance 5225 Dayton St. 20 9-Apr 19 30-Apr
Metro Area Transit 2222 Cuming Street 15 9-Apr 15 30-Apr
Laidlaw Transit Inc. 14001 L St 20 30-Apr 5 14-May
Other Drivers
Gordmans Retail Store 120th
& Center 100 6-Apr 95 7-May
Fiserv Financial Services 132nd
& Q 30 8-Apr 19 30-Apr
Dr. Elvira Rios’ Office 1 Lakeside Hills Bldg 10 9-Apr 3 30-Apr
Alegent Physical Therapy 1 Lakeside Hills Bldg 10 9-Apr 0 30-Apr
NP Dodge Realtors Lakeside Drive 30 9-Apr 15 30-Apr
Bangs Hair Salon Lakeside Hills Plz 30 9-Apr 0 30-Apr
Hair By Tami Lakeside Hills Plz 30 9-Apr 1 30-Apr
Avant Salon & Day Spa Lakeside Hills Plz 30 9-Apr 6 30-Apr
Immanuel Lakeside Village Lakeside Hills 50 9-Apr 8 30-Apr
Skutt Catholic High School 156th
& Center 80 30-Apr 49 14-May
Page 47
30
Table 4.4 Blair Survey Distribution Activity Centers
Name Location Distributed Collected
# Date
2007
# Date
2007
Specialty Vehicle Drivers
Blair Community Schools 440 N 10th
15 25-Apr 4 22-May
Blair Police Department 17th
& Lincoln 25 20-Apr 12 8-May
Blair Volunteer Fire Department 16th
& Lincoln 25 20-Apr 17 17-May
Street Department 3rd
& Grant 10 20-Apr 6 8-May
STS Trucking 270 E Grant 40 20-Apr 15 8-May
Other Drivers
Washington County Bank 16th
& Lincoln 25 20-Apr 8 8-May
City Hall 16th
& Lincoln 5 20-Apr 4 8-May
Blair High School Students 440 N 10th
St 60 25-Apr 54 8-May
Blair High School Teachers 440 N 10th
St 25 25-Apr 24 17-May
Heartland Family Dentistry 261 S 19th
St 25 20-Apr 4 8-May
Hair Designs Unlimited 662 S 19th
St 30 20-Apr 0 8-May
Alegent Health Immanuel Clinic 718 S 19th
St 25 20-Apr 4 8-May
Blair Dental Clinic 17th
& Lincoln 25 20-Apr 8 8-May
Jim & Connie's Blair Bakery 17th
& Lincoln 25 20-Apr 0 8-May
Woodhouse Ford At Roundabout 35 20-Apr 1 8-May
Washington County Courthouse 15th
& Colfax 30 20-Apr 25 8-May
Enterprise Publishing 16th
& Front 25 20-Apr 7 8-May
DL Blair Corporation 16th
& Front 25 20-Apr 14 8-May
Post Office 16th
& Front 25 20-Apr 4 8-May
Page 48
31
Table 4.5 Norfolk Survey Distribution Activity Centers
Name Location Distributed Collected
# Date
2007
# Date
2007
Specialty Vehicle Drivers
Affiliated Foods 13th
& Omaha 20 7-May 4 17-May
Norfolk Fire Division 7th
& Koenigstein 25 7-May 3 17-May
Norfolk Police 7th
& Koenigstein 20 7-May 15 17-May
Norfolk Street Division 10th
& Michigan 15 7-May 14 17-May
Norfolk Schools
Transportation
Blaine & Nwestern 20 7-May 7 17-May
Other Drivers
St. Joseph Rehabilitation
Center
18th
& Prospect 25 7-May 6 17-May
Crafts Incorporated 2602 S 13th
St 15 7-May 7 17-May
Family Dental/Floral
Expressions
13th
& Taylor 15 7-May 4 17-May
Charles Sintek DDS 13th
& Nebraska 10 7-May 3 17-May
Square Turn Professional
Plaza
1502 N 13th
17 7-May 3 17-May
Northstar Services 7th
& Nebraska 25 7-May 16 17-May
Norfolk HHS 6th
& Koenigstein 25 7-May 23 17-May
Orthodontists 5th
& Nebraska 25 7-May 5 17-May
JEO Engineering 8th
& Norfolk 25 7-May 10 17-May
The Daily News 6th
& Norfolk 30 7-May 10 17-May
Workforce Development 1st & Norfolk 15 7-May 8 17-May
Norfolk Senior Center 3rd
& Prospect 30 7-May 27 17-May
Norfolk Public Library 3rd
& Prospect 25 7-May 17 17-May
VFW 3rd& Braasch 25 7-May 0 17-May
Norfolk Senior High 801 Riverside Blvd 85 23-Apr 78 17-May
State Farm Insurance 902 Riverside Blvd 8 7-May 5 17-May
Activity centers in each city provided a diverse group of respondents for the survey.
With any self-completion survey, return rates vary with the type of application. Self-completion
surveys are expected to have return rates between five and twenty percent when participants are
asked to return surveys by mail (27). By delivering and collecting surveys by hand to the activity
centers, the research team hoped to achieve a 20% return rate. However, an overall return rate of
Page 49
32
45.7% was achieved, which exceeded the team’s expectations. Table 4.6 details the return rate
for different driver groups within each survey city as well as the overall return rate.
As can be seen in the table, the first distribution city, Plattsmouth, had a lower return rate
than the other cities. The return rate of 33.4% for the Plattsmouth site was still higher than the
expected return rate of 20%. Norfolk, the final distribution site, achieved the highest return rate
with an overall return rate of 53.0%. The research team attributes the increased return rate at the
later distribution cities to the diversification of activity centers solicited after the high number of
unreturned surveys during the Plattsmouth distribution.
Table 4.6 Return Rate for Survey Distribution Cities
Site All Driver Types Specialty Vehicle
Drivers
Passenger Vehicle
Drivers
Dis
trib
ute
d
Coll
ecte
d
Ret
urn
Rat
e
%
Dis
trib
ute
d
Coll
ecte
d
Ret
urn
Rat
e
%
Dis
trib
ute
d
Coll
ecte
d
Ret
urn
Rat
e
%
Plattsmouth 500 167 33.4 100 28 28.0 400 139 34.8
Lincoln 500 246 49.2 110 71 64.5 390 175 44.9
Omaha 500 254 50.8 100 58 58.0 400 196 49.0
Blair 500 211 42.2 115 54 47.0 385 157 40.8
Norfolk 500 265 53.0 100 43 43.0 400 222 55.5
Total 2500 1143 45.7 525 250 47.6 1975 889 45.0
Page 50
33
4.3 Data Reduction
Data from collected surveys was recorded in Microsoft Excel software using the coding
scheme shown in appendix B. As can be expected with any self-completion survey, some
respondents returned the survey incomplete or filled out incorrectly. Survey respondents were
allowed to skip any question they were not comfortable answering. The research team recorded
surveys that had unanswered questions or incorrectly filled out questions, but marked them for
further review. Upon review of the full data set, twenty surveys were judged to be severely
erroneous or incomplete and were subsequently discarded. Appendix B provides details of the
discarded surveys and the reasons for discarding them. The final sample size was 1,116.
Page 51
34
Chapter 5 Data Analysis
5.1 Data Analysis Methodology
The research team used cross tabulation analyses to individually test the seven
hypotheses, t-tests to test the total correct answers against the seven hypotheses, and estimated an
ordinal regression model to determine driver characteristics prominent in incorrect roundabout
negotiation. Additionally, the research team looked at roundabout elements that were of concern
to drivers and informational techniques that would help with negotiating roundabouts. Table 5.1
summarizes the variables used in this analysis while appendix B provides more detailed
definitions.
Table 5.1 Variables Used in Analyses
Variable Variable
Name
Definition Coding Definition
familiar Driver
familiarity
Defines if respondent is a
familiar or unfamiliar
roundabout user
0 if unfamiliar roundabout user, 1 if
familiar
site Respondent
site response
Defines what community
respondent marked
1 if Lincoln, 2 if Omaha, 3 if
Norfolk, 4 if Plattsmouth, 5 if Blair,
6 if Other
drvr.type Driver type Defines if respondent is a
specialty vehicle or
passenger vehicle driver
0 if passenger vehicle driver, 1 if
specialty vehicle driver
dislike Driver opinion Defines if respondent likes
roundabouts or not
0 if strongly like, like, or are
indifferent to roundabouts, 1 if
strongly dislike or dislike
roundabouts
high.trips Number of
daily trips
Defines if respondent makes
a high number of daily trips
0 if respondent makes fewer than 5
daily trips, 1 if 5 or more daily trips
older Older driver Defines if respondent is an
older driver
0 if respondent is under 60, 1 if 60
or older
Page 52
35
Table 5.1 Variables Used in Analyses (cont.)
Variable Variable
Name
Definition Coding Definition
can.drv Confidence in
negotiation
Defines if respondent is
confident they can
negotiate a roundabout
0 if not confident, 1 if confident
tot.ans Total correct
answers
The sum of the 9
roundabout knowledge
assessment question
responses
Represents the total number of correct
responses to questions C2, C4, C5, C6,
C7, C8, C9, C10, C11
platts City with
roundabout or
not
Defines if respondent is
from a city with a
roundabout or not
0 if from a city with roundabouts, 1 if
not
grpd.ans Grouping of
correct
answers
Groups total correct
answers of respondents
into four categories
0 if 0-3, 1 if 4-5, 2 if 6-7, 3 if 8-9
correct answers
gender Gender Defines respondent
gender
0 if female, 1 if male
commute Commute time The time in minutes of
respondents commute
time
Scale values
drv.spd Typical
driving speed
Respondents typical
driving speed
1 if more than 5 mph below posted, 2 if
5 mph below to posted, 3 if at posted, 4
if posted to 5 mph above, 5 if more than
5 mph above posted
hv.pssngr Driver has
passengers
Defines if respondent
typically has passengers
0 if does not typically have passengers,
1 if does
seat.belt Driver wears
seatbelt
Defines if respondent
typically wears seatbelt
0 if does not typically wear seatbelt, 1 if
does
avd.sfty Avoids due to
safety
Defines if respondent
avoids roadways because
of safety
0 if does not avoid due to safety, 1 if
does
avd.cong Avoids due to
congestion
Defines if respondent
avoids roadways because
of congestion
0 if does not avoid due to congestion, 1
if does
Cross tabulation compares two variables that have a limited number of distinct values
(e.g. the integers 0 through 5), and produces a table that divides the distribution of one of the
variable’s outcomes according to the distribution of the other variable’s outcomes. Each cell in
Page 53
36
this table represents the frequency of the combination of those outcomes. In addition, cross
tabulation analysis can measure the relationship between the variables. A chi-square test can
measure the discrepancy between the observed cell counts and what would be expected if the
rows and columns of the cross tabulation were unrelated. The chi-squared test compares two
attributes in a sample of data to determine if there is any relationship between them. The test
shows the level of difference between the observed distributions of outcomes and the expected
equally distributed outcomes. The test assumes the samples to be independent, have the same
distribution, and have mutually exclusive event outcomes.
The chi-squared test statistic is calculated by finding the difference between each
observed and theoretical frequency for each outcome, squaring them, dividing each by the
theoretical frequency, and taking the sum of the results (28):
5.1
where,
Oi = observed frequency;
Ei = expected frequency (all outcomes equally distributed).
The output of the chi-squared test reports the significance value of the chi-squared
statistic compared with the expected chi-squared test value from the chi-squared distribution. If
this significance value is below a threshold of acceptable statistical significance, the test proves
that the rows and columns (variable outcomes) of the cross tabulation table are related.
For this research, a significance threshold of 0.05 was used, meaning that a 95%
confidence level was used for the statistical analysis. A 95% level of confidence implies that if
independent samples are taken repeatedly from the same population, then 95% of the intervals
Page 54
37
will include the unknown population parameter. Higher confidence levels give more confidence
that the results are correct (28).
The researchers used t-tests to test the total correct answers against the seven
hypotheses. A t-test was used to examine a hypothesis such as two means being equal, or a mean
being statistically equal to some value (typically zero). This test assumes observations are
independent and a random sample without outliers from a normal distribution. The data collected
in this research met these assumptions. The equation used to calculate the test statistic for a t-test
is (28):
( )
√(
⁄ ) (
⁄ )
5.2
where,
and are the means being tested,
and
represent the variances, and
m and n represent the sample sizes pertaining to the two means.
The test statistic is compared to a standard value based on a user-defined confidence
level (a confidence level of 95% was used). The test statistic is used to determine if a null
hypothesis regarding equality of two sample means should be rejected. If the test rejects the null
hypothesis, it implies that the two sample means are statistically different from one another. For
a 95% confidence level, the absolute value of the test statistic must be greater than 1.96.
An ordinal regression model was estimated to identify driver characteristics prominent
in incorrect roundabout negotiation. Typical linear regression does not work when the dependent
variable is measured on the ordinal scale. A variable measured on the ordinal scale has values
that are ordered (e.g. levels of patient discomfort during a hospital stay or student grades). The
Page 55
38
only information available is that one category is greater than another; the real difference
between the categories is unknown. The ordinal regression model works by grouping results into
an order with cutoff points (thresholds) that can be defined by an estimated or user-inputted
distribution, with no regard to the results fitting any predefined distribution such as the normal
distribution. The regression model is (29):
( ) [ ] 5.3
where,
( ) is the link function that is user defined,
is the threshold constant,
are the prediction coefficients, and
are parameters (independent variable).
The distribution of outcomes that are being predicted dictate what function should be
used for the link function. When modeling, multiple link functions can be analyzed to determine
the most appropriate function. The appropriateness of the model and goodness of fit is measured
using a chi-squared test as defined previously in the methodology section. The assumption of this
model is that the relationship between the ordinal outcome (dependent variable) and the
explanatory variables (independent variables) is independent of the categories (cutoff points).
This assumption implies that the corresponding regression coefficients are equal for each cut-off
point.
5.2 Results of Questions Assessing Knowledge of Roundabout Negotiation
The overall results for the nine questions that assess knowledge of correct roundabout
negotiation are shown in table 5.2 and figure 5.1. The full question, choices, and correct answers
Page 56
39
(marked) for each of these nine questions are shown in appendix A (the survey questionnaire).
Less than 10% of respondents incorrectly answered questions C2, C4, and C5, while more than
85% of respondents incorrectly answered questions C6 and C11. Many respondents understood
the basic ideas of the direction of travel around a roundabout and right-of-way at entry points.
Many respondents did not know the purpose of the center truck apron as well as proper turn-
signal use. The following sections will discuss driver characteristics prominent in incorrectly
answering these questions.
Table 5.2 Responses to Questions Assessing Knowledge of Correct Negotiation
Question Incorrect
Responses
Correct
Responses
Percent
Incorrect
(%)
C2: Which vehicle should yield? 97 1019 8.7
C4. Which is the correct left turn? 47 1069 4.2
C5. What to do if missed exit? 76 1040 6.8
C6. Use turn signal when entering? 958 158 85.8
C7. Use turn signal when exiting? 353 763 31.6
C8. What to do if emergency vehicle (at yield
line)?
155 961 13.9
C9. What to do if emergency vehicle (in
roundabout)?
572 544 51.3
C10. Where to wait for pedestrians? 334 782 29.9
C11. What is the truck apron? 980 136 87.8
Page 57
40
Figure 5.1 Responses to Questions Assessing Knowledge of Roundabout Negotiation
5.3 Cross Tabulation of Individual Questions Results
The research team conducted a cross tabulation analysis for questions that assessed
knowledge of correct roundabout negotiation resulting in a total of 63 cross tabulations (nine
questions for seven hypotheses). The variables used in this analysis are defined in table 5.3 and
are detailed in appendix B. Appendix C provides the cross tabulation table, as well as the chi-
squared test results for each of these analyses. Table 5.3 summarizes the results of these tests
including the chi-squared test value significance. The table highlights those values that are below
0.05 since they are significant chi-squared values. The following sections will discuss each
significant value from this table.
0
200
400
600
800
1000
1200
C2 C4 C5 C6 C7 C8 C9 C10 C11
Nu
mb
er
of
Re
spo
nse
s
Question
Incorrect
Correct
Page 58
41
Table 5.3 Chi-Squared Significance Values from Cross Tabulation Analyses
Chi-Squared Statistic Significance for Each Question
C2 C4 C5 C6 C7 C8 C9 C10 C11
Hypothesis
1
0.000 0.048 0.198 0.442 0.000 0.090 0.000 0.000 0.000
Hypothesis
2
0.473 0.793 0.341 0.228 0.000 0.052 0.070 0.147 0.000
Hypothesis
3
0.000 0.017 0.194 0.030 0.000 0.101 0.000 0.000 0.000
Hypothesis
4
0.000 0.000 0.064 0.464 0.190 0.619 0.204 0.008 0.556
Hypothesis
5
0.570 0.210 0.654 0.363 0.085 0.205 0.319 0.419 0.118
Hypothesis
6
0.003 0.271 0.001 0.028 0.001 0.986 0.507 0.004 0.008
Hypothesis
7
0.000 0.000 0.000 0.292 0.003 0.000 0.000 0.000 0.011
Hypothesis 1: Unfamiliar roundabout users have a greater potential for incorrect roundabout
negotiation compared to drivers familiar with roundabouts.
The research team tested this hypothesis for each of the nine questions assessing
knowledge of correct roundabout negotiation. Each cross tabulation analysis involved the
variable “familiar” as defined in table 5.1. Table 5.3 summarizes the results of the cross
tabulations and appendix C shows the full analyses. These analyses resulted in six significant
cross tabulation chi-squared values. Question C2, C4, C7, C9, C10, and C11 had significant chi-
square test statistic values. Table 5.4 summarizes the frequency of incorrect and correct answers
for each of these questions based on driver familiarity. As can be seen in this table, frequencies
of incorrect answers by unfamiliar drivers are higher (compared to familiar drivers) for questions
C2, C4, C9, C10 and C11. The frequency of incorrect answers by familiar drivers is higher
Page 59
42
(compared to unfamiliar drivers) only for question C7. Appendix D presents a graphical
representation of the results shown in table 5.4.
Table 5.4 Frequency of Responses for Hypothesis 1
Incorrect Correct Total %
Incorrect
Question C2. Which vehicle should yield?
Unfamiliar 50 302 352 14.2%
Familiar 47 717 764 6.2%
Question C4. Which is the correct left turn?
Unfamiliar 21 331 352 6.0%
Familiar 26 738 764 3.4%
Question C7. Use turn signal when exiting?
Unfamiliar 81 271 352 23.0%
Familiar 272 492 764 35.6%
Question C9. What to do if emergency vehicle (in
roundabout)?
Unfamiliar 262 90 352 74.4%
Familiar 310 454 764 40.6%
Question C10. Where to wait for pedestrians?
Unfamiliar 142 210 352 40.3%
Familiar 192 572 764 25.1%
Question C11. What is the truck apron?
Unfamiliar 327 25 352 92.9%
Familiar 653 111 764 85.5%
Hypothesis 2: Passenger vehicle drivers have a greater potential for incorrect roundabout
negotiation compared to specialty vehicle drivers.
The research team tested this hypothesis for each of the nine questions assessing
knowledge of correct roundabout negotiation. Each cross tabulation analysis involved the
variable “drvr.type” as defined in table 5.1. Table 5.3 summarizes the results of the cross
tabulations and appendix C shows the full analyses. These analyses resulted in two significant
Page 60
43
cross tabulation chi-squared values. Question C7 and C11 had significant chi-square test statistic
values. Table 5.5 summarizes the frequency of incorrect and correct answers for each of these
questions based on driver familiarity. The frequencies of incorrect answers by passenger vehicle
drivers are higher for questions C7 and C11. Appendix D presents a graphical representation of
the results shown in table 5.5.
Table 5.5 Frequency of Responses for Hypothesis 2
Incorrect Correct Total %
Incorrect
Question C7. Use turn signal when exiting?
Passenger Vehicle
Driver
302 559 861 35.1%
Specialty Vehicle
Driver
51 204 255 20.0%
Question C11. What is the truck apron?
Passenger Vehicle
Driver
774 87 861 89.9%
Specialty Vehicle
Driver
206 49 255 80.8%
Hypothesis 3: Drivers in Nebraska cities without roundabouts have a greater potential for
incorrect roundabout negotiation compared to drivers in Nebraska cities with roundabouts.
The research team tested this hypothesis for each of the nine questions assessing
knowledge of correct roundabout negotiation. Each cross tabulation analysis involved the
variable “site” as defined in table 5.1. Table 5.3 summarizes the results of the cross tabulations
and appendix C shows the full analyses. These analyses resulted in seven significant cross
tabulation chi-squared values. Question C2, C4, C6, C7, C9, C10 and C11 had significant chi-
square test statistic values. Table 5.6 summarizes the frequency of incorrect and correct answers
Page 61
44
for each of these questions based on community. Appendix D presents a graphical representation
of the results shown in table 5.6.
Page 62
45
Table 5.6 Frequency of Responses for Hypothesis 3 In
corr
ect
Corr
ect
Tota
l
%
Inco
rrec
t
Inco
rrec
t
Corr
ect
Tota
l
%
Inco
rrec
t
Question C2. Which vehicle should yield? Question C4. Which is the correct left turn?
Lincoln 12 220 232 5.2% Lincoln 8 224 232 3.4%
Omaha 23 214 237 9.7% Omaha 6 231 237 2.5%
Norfolk 15 229 244 6.1% Norfolk 8 236 244 3.3%
Plattsmout
h
25 108 133 18.8% Plattsmouth 12 121 133 9.0%
Blair 10 162 172 5.8% Blair 5 167 172 2.9%
Other 10 81 91 11.0% Other 7 84 91 7.7%
Question C6. Use turn signal when entering? Question C7. Use turn signal when exiting?
Lincoln 210 22 232 90.5% Lincoln 69 163 232 29.7%
Omaha 208 29 237 87.8% Omaha 60 177 237 25.3%
Norfolk 198 46 244 81.1% Norfolk 93 151 244 38.1%
Plattsmout
h
109 24 133 82.0% Plattsmouth 30 103 133 22.6%
Blair 152 20 172 88.4% Blair 78 94 172 45.3%
Other 76 15 91 83.5% Other 19 72 91 20.9%
Question C9. What to do - emergency vehicle
(in roundabout)?
Question C10. Where to wait for
pedestrians?
Lincoln 85 147 232 36.6% Lincoln 37 195 232 15.9%
Omaha 147 90 237 62.0% Omaha 86 151 237 36.3%
Norfolk 68 176 244 27.9% Norfolk 50 194 244 20.5%
Plattsmout
h
108 25 133 81.2% Plattsmouth 60 73 133 45.1%
Blair 103 69 172 59.9% Blair 70 102 172 40.7%
Other 56 35 91 61.5% Other 29 62 91 31.9%
Question C11. What is the truck apron?
Lincoln 191 41 232 82.3%
Omaha 225 12 237 94.9%
Norfolk 203 41 244 83.2%
Plattsmout
h
128 5 133 96.2%
Blair 149 23 172 86.6%
Other 77 14 91 84.6%
Page 63
46
Hypothesis 4: Older drivers have a greater potential for incorrect roundabout negotiation
compared to younger drivers.
The research team tested this hypothesis for each of the nine questions assessing
knowledge of correct roundabout negotiation. Each cross tabulation analysis involved the
variable “older” as defined in table 5.1. Table 5.3 summarizes the results of the cross tabulations
and appendix C shows the full analyses. These analyses resulted in three significant cross
tabulation chi-squared values. Questions C2, C4, and C10 had significant chi-square test statistic
values. Table 5.7 summarizes the frequency of incorrect and correct answers for each of these
questions based on respondents being older or younger drivers. Older drivers more frequently
incorrectly answered the three questions found significant. Appendix D presents a graphical
representation of the results shown in table 5.7.
Table 5.7 Frequency of Responses for Hypothesis 4
Incorrect Correct Total % Incorrect
Question C2. Which vehicle should yield?
Drivers under 60 70 913 983 7.1%
Drivers over 60 26 96 122 21.3%
Question C4. Which is the correct left turn?
Drivers under 60 32 951 983 3.3%
Drivers over 60 14 108 122 11.5%
Question C10. Where to wait for pedestrians?
Drivers under 60 280 703 983 28.5%
Drivers over 60 49 73 122 40.2%
Page 64
47
Hypothesis 5: Drivers who make fewer daily trips have a greater potential for incorrect
roundabout negotiation compared to drivers who make five or more daily trips.
The research team tested this hypothesis for each of the nine questions assessing
knowledge of correct roundabout negotiation. Each cross tabulation analysis involved the
variable “high.trips” as defined in table 5.1. Table 5.3 summarizes the results of the cross
tabulations and appendix C shows the full analyses. These analyses resulted in no significant
cross tabulation chi-squared values. Since none of the cross tabulation calculations resulted in
significant chi-squared test statistics, none of the questions had a significant difference between
those respondents that make high numbers of trips per day and those that make fewer trips.
Hypothesis 6: Drivers who dislike roundabouts have a greater potential for incorrect
roundabout negotiation compared with those that approve of roundabouts.
The research team tested this hypothesis for each of the nine questions assessing
knowledge of correct roundabout negotiation. Each cross tabulation analysis involved the
variable “dislike” as defined in table 5.1. Table 5.3 summarizes the results of the cross
tabulations and appendix C shows the full analyses. These analyses resulted in six significant
cross tabulation chi-squared values. Question C2, C5, C6, C7, C10, and C11 had significant chi-
square test statistic values. Table 5.8 summarizes the frequency of incorrect and correct answers
for each of these questions based on respondents liking roundabouts or not. As can be seen in
table 5.8, drivers that like or are neutral to roundabouts more frequently incorrectly answered
question C6 but more frequently answered the other questions correctly. Appendix D presents a
graphical representation of the results shown in table 5.8.
Page 65
48
Table 5.8 Frequency of Responses for Hypothesis 6
Incorrect Correct Total %
Incorrect
Question C2. Which vehicle should yield?
Neutral or Like 65 814 879 7.4%
Dislike 32 205 237 13.5%
Question C5. What to do if missed exit?
Neutral or Like 48 831 879 5.5%
Dislike 28 209 237 11.8%
Question C6. Use turn signal when entering?
Neutral or Like 765 114 879 87.0%
Dislike 193 44 237 81.4%
Question C7. Use turn signal when exiting?
Neutral or Like 257 622 879 29.2%
Dislike 96 141 237 40.5%
Question C10. Where to wait for pedestrians?
Neutral or Like 245 634 879 27.9%
Dislike 89 148 237 37.6%
Question C11. What is the truck apron?
Neutral or Like 760 119 879 86.5%
Dislike 220 17 237 92.8%
Hypothesis 7: Drivers that do not feel confident they can drive through a roundabout in the
correct manner have a greater potential for incorrect roundabout negotiation compared with
those that feel confident they can drive through a roundabout in the correct manner.
The research team tested this hypothesis for each of the nine questions assessing
knowledge of correct roundabout negotiation. Table 5.3 summarizes the results of the cross
tabulations and appendix C shows the full analyses. These analyses resulted in eight significant
cross tabulation chi-squared values. Question C2, C4, C5, C7, C8, C9, C10, and C11 had
significant chi-square test statistic values. Only question C6 resulted in a non-significant chi-
squared value. Table 5.9 summarizes the frequency of incorrect and correct answers for those
Page 66
49
questions found to have a significant difference between those that said they know how to drive
through a roundabout and those that said they do not. As can be seen in table 5.9, drivers that
said they can confidently drive through a roundabout more frequently answered questions
correctly. Appendix D presents a graphical representation of the results shown in table 5.9.
Page 67
50
Table 5.9 Frequency of Responses for Hypothesis 7
Incorrect Correct Total %
Incorrect
Question C2. Which vehicle yields?
Not Confident Could Drive 30 99 129 23.3%
Confident Could Drive 63 906 969 6.5%
Question C4. Which is the correct left turn?
Not Confident Could Drive 22 107 129 17.1%
Confident Could Drive 22 947 969 2.3%
Question C5. What to do if missed exit?
Not Confident Could Drive 29 100 129 22.5%
Confident Could Drive 44 925 969 4.5%
Question C7. Use turn signal when exiting?
Not Confident Could Drive 55 74 129 42.6%
Confident Could Drive 289 680 969 29.8%
Question C8. What to do if emergency vehicle (at yield line)?
Not Confident Could Drive 43 86 129 33.3%
Confident Could Drive 107 862 969 11.0%
Question C9. What to do if emergency vehicle (in roundabout)?
Not Confident Could Drive 93 36 129 72.1%
Confident Could Drive 469 500 969 48.4%
Question C10. Where to wait for pedestrians?
Not Confident Could Drive 70 59 129 54.3%
Confident Could Drive 257 712 969 26.5%
Question C11. What is the truck apron?
Not Confident Could Drive 122 7 129 94.6%
Confident Could Drive 841 128 969 86.8%
Summary of Cross Tabulation Analysis
Table 5.10 summarizes the results of the significant hypotheses tested using cross tabulations.
Page 68
51
Table 5.10 Hypotheses Significant Cross Tabulation Results
Question Potential for incorrect roundabout negotiation
C2. Which
vehicle should
yield?
Unfamiliar drivers have a greater potential compared to familiar drivers
Plattsmouth drivers have a greater potential compared to other cities
Older drivers have a greater potential compared to younger drivers
Drivers that dislike roundabout have a greater potential compared to drivers
that like roundabouts
Drivers who are not confident they can drive through a roundabout have a
greater potential compared to drivers that are confident they can drive
through a roundabout
C4. Which is the
correct left turn?
Unfamiliar drivers have a greater potential compared to familiar drivers
Plattsmouth drivers have a greater potential compared to other cities
Older drivers have a greater potential compared to younger drivers
Drivers who are not confident they can drive through a roundabout have a
greater potential compared to drivers that are confident they can drive
through a roundabout
C5. What to do if
missed exit?
Drivers that dislike roundabout have a greater potential compared to drivers
that like roundabouts
Drivers who are not confident they can drive through a roundabout have a
greater potential compared to drivers that are confident they can drive
through a roundabout
C6. Use turn
signal when
entering?
Lincoln drivers have a greater potential compared to other cities
Drivers that like roundabout have a greater potential compared to drivers that
dislike roundabouts
C7. Use turn
signal when
exiting?
Familiar drivers have a greater potential compared to unfamiliar drivers
Passenger vehicle drivers have a greater potential compared to specialty
vehicle drivers
Blair drivers have a greater potential compared to other cities
Drivers that dislike roundabout have a greater potential compared to drivers
that like roundabouts
Drivers who are not confident they can drive through a roundabout have a
greater potential compared to drivers that are confident they can drive
through a roundabout
Page 69
52
Table 5.10 Hypotheses Significant Cross Tabulation Results (cont.)
Question Potential for incorrect roundabout negotiation
C8. What to do if
emergency
vehicle (at yield
line)?
Drivers who are not confident they can drive through a roundabout have a
greater potential compared to drivers that are confident they can drive
through a roundabout
C9. What to do if
emergency
vehicle (in
roundabout)?
Unfamiliar drivers have a greater potential compared to familiar drivers
Plattsmouth drivers have a greater potential compared to other cities
Drivers who are not confident they can drive through a roundabout have a
greater potential compared to drivers that are confident they can drive
through a roundabout
C10. Where to
wait for
pedestrians?
Unfamiliar drivers have a greater potential compared to familiar drivers
Plattsmouth drivers have a greater potential compared to other cities
Older drivers have a greater potential compared to younger drivers
Drivers that dislike roundabout have a greater potential compared to drivers
that like roundabouts
Drivers who are not confident they can drive through a roundabout have a
greater potential compared to drivers that are confident they can drive
through a roundabout
C11. What is the
truck apron?
Unfamiliar drivers have a greater potential compared to familiar drivers
Passenger vehicle drivers have a greater potential compared to specialty
vehicle drivers
Plattsmouth drivers have a greater potential compared to other cities
Drivers that dislike roundabout have a greater potential compared to drivers
that like roundabouts
Drivers who are not confident they can drive through a roundabout have a
greater potential compared to drivers that are confident they can drive
through a roundabout
Although the research team conducted each cross tabulation independently, many of
the results of table 5.10 are comparable. Many drivers of Plattsmouth are unfamiliar roundabout
users, so it is only fitting that many of the significant test results between Hypothesis 1 and
Hypothesis 3 are similar. The frequencies of incorrect answers from unfamiliar drivers and
Plattsmouth respondents were often higher for the same questions.
Page 70
53
5.4 Analysis of Roundabout Knowledge
Two analyses were conducted to assess roundabout knowledge, a t-test and ordinal
regression estimation. The t-tests were conducted to test the variable “tot.ans” as defined in table
5.1 (the total number of correct answers for the nine questions assessing knowledge of
roundabout negotiation) for each of the seven hypotheses. The ordinal regression model was
estimated to determine which driver characteristics are prominent in incorrect roundabout
negotiation. The model used the variables representing each of the hypotheses as independent
variables, and the total number of correct answers as the dependent variable. Additional
independent variables (not included in the defined hypotheses) that could influence the total
correct responses from survey participants were included in model development. The following
sections discuss these two analyses.
5.5 T-test Analysis Results
T-tests were conducted for each hypothesis; the results of the tests are shown in table
5.11. They tested if the mean number of correct answers for the questions assessing knowledge
of correct roundabout negotiation were statistically different from each other when grouped by
the defined driver populations for each hypothesis. As shown in the table, six of the seven
hypotheses were found to have statistically different mean total correct answers. The t-value for
Hypothesis 5 (number of daily trips) was below 1.96 so was not significant at a 95% confidence
level. The results of the t-tests confirmed the initial expectations of each hypothesis.
Page 71
54
Table 5.11 T-test Results for Hypotheses
Hypothesis Number
of
Responses
Mean Std.
Dev.
t-value Significance
1 Unfamiliar User 352 5.40 1.607
-6.100 0.000 Familiar User 764 5.98 1.437
2 Passenger Vehicle Driver 861 5.70 1.489
-4.079 0.000 Specialty Vehicle Driver 255 6.14 1.563
3 Have Roundabout in City 885 5.91 1.416
5.600 0.000 Do not have Roundabouts in City 133 5.14 1.841
4 Respondent under 60 983 5.86 1.467
3.342 0.001 Respondent over 60 122 5.38 1.774
5 Fewer than 5 daily trips 633 5.76 1.440
-1.247 0.213 5 or more daily trips 457 5.88 1.568
6 Respondent likes roundabouts 879 5.88 1.449
3.464 0.001 Respondent dislikes roundabouts 237 5.50 1.714
7
Not confident can drive through
roundabout 129 4.57 2.168
-
10.400 0.000
Confident can drive through
roundabout 969 5.98 1.314
5.6 Ordinal Regression Model Estimation Results
To run the ordinal regression model, the total answers variable (“tot.ans” used in the t-test
analysis) was redefined to include only four ordinal categories instead of the 10 initially used.
The ordinal variable used for the analysis had four categories: 0 to 3 correct responses, 4 or 5
correct responses, 6 or 7 correct responses, and 8 or 9 responses. The variables tested in this
model were shown in table 5.1 (page 33). To complete the analysis, the various link function
options were tested and the model with the best chi-squared test statistic was used for analysis.
For this analysis, the logit link function was found to be the most significant from this
comparison. When using the logit link function, the ordinal regression model performs as an
Page 72
55
ordered logit model. By including all variables in the model, all factors are tested
simultaneously. After the initial model was estimated with all variables, those found not to be
significant were removed for the final model for parsimony. This model is shown in table 5.12.
Appendix C shows the initial estimated model. The parameters found significant in the final
model are discussed in table 5.12.
Table 5.12 Ordinal Regression Model Results
Model Fitting Information
Chi-Square 145.096
Degrees of
Freedom 7
Significance 0.000
Parameter Variable Coding Estimate Std.
Error
t-
value
familiar 0 – Unfamiliar
1 - Familiar 0.474 0.134 3.549
drvr.type 0 - Passenger vehicle drivers
1 - Specialty vehicle drivers 0.499 0.163 3.063
older 0 - Under 60
1 - Over 60 -0.446 0.194 -2.301
can.drv 0 –Said cannot negotiate roundabout
1 – Said can negotiate roundabout 1.318 0.191 6.906
gender 0 – Female
1 - Male 0.600 0.134 4.472
seat.belt 0 - Does not wear seatbelt
1 - Wears seatbelt 0.798 0.177 4.510
avd.cong
0 - Doesn't avoid roadways because of
congestion
1 – Avoids roadways because of
congestion
0.294 0.124 2.378
Page 73
56
Table 5.13 Significant Parameters from Regression Analysis
Parameter Estimate Variable Coding Result
familiar 0.474 0 – Unfamiliar
1 - Familiar
Familiar drivers displayed greater
knowledge of roundabout
negotiation
drvr.type 0.499
0 - Passenger vehicle
drivers
1 - Specialty vehicle
drivers
Specialty vehicle drivers showed
greater knowledge of roundabout
negotiation
older -0.446 0 - Under 60
1 - Over 60
Younger drivers exhibited greater
knowledge of roundabout
negotiation
can.drv 1.318
0 –Said cannot negotiate
roundabout
1 – Said can negotiate
roundabout
Drivers that said they can
negotiate roundabouts displayed
greater knowledge of roundabout
negotiation
gender 0.600 0 – Female
1 - Male
Male respondents showed greater
knowledge of roundabout
negotiation
seat.belt 0.798
0 - Does not wear
seatbelt
1 - Wears seatbelt
Drivers that wore a seatbelt
indicated greater knowledge of
roundabout negotiation
avd.cong 0.294
0 - Doesn't avoid
roadways because of
congestion
1 – Avoids roadways
because of congestion
Drivers that avoid roadways
because of congestion have
greater knowledge of roundabout
negotiation
The variables found significant in the model that correspond with any of the seven
hypotheses had similar significant results as the initial cross tabulation results as well as the t-
tests. The results of the analyses presented above were used in the following chapter to make
conclusions regarding the characteristics of drivers that lead to incorrect roundabout negotiation
as well as commenting on what elements of roundabouts are most commonly incorrectly
negotiated by drivers.
Page 74
57
5.7 Roundabout Elements of Concern to Drivers
The survey asked drivers to indicate what elements of roundabouts were of concern to
them (Question C1). Figure 5.2 tabulates the responses received (respondents could indicate
multiple elements of concern to them). Results show that respondents were most concerned
about other drivers, waiting or not waiting for other vehicles entering the roundabout, and the
procedure when an emergency vehicle is approaching the roundabout.
Figure 5.2 Elements of Concern to Drivers
5.8 Helpful Informational Techniques
Survey respondents were asked what type of informational techniques would help them
understand how to drive through a roundabout (Question A4). Respondents could choose
multiple informational techniques when answering Question A4. Figure 5.3 presents the results
of Question A4. Most of the respondents chose the driver’s manual followed by on-site signage
C 1. E lements that are of c onc ern
0100200300400500600700800900
S igns
E nterin
g
Wa itin
gP eds
Turn d
irectio
n
When to
ex it
Which la
ne to b
e in
When to
us e s
ignal
Oth
er driv
ers
E merg
ency v
ehicle
s
Oth
er
Nu
mb
er
of
Re
sp
on
se
s
Page 75
58
and brochures as the preferred technique that would help them understand how to drive through a
roundabout.
Figure 5.3 Preferred Helpful Informational Techniques
A4. What information would you like?
0
50
100
150
200
250
300
350
400
None
B rochure
Drivers
ed
Demos
V ideo
Websit
e
P ublic m
eetings
Driver's
manual
On-s
ite s
ignage
P ublic s
ervice
Oth
er
Nu
mb
er
of
Re
sp
on
se
s
Page 76
59
Chapter 6 Conclusions and Recommendations
The objectives of this research were to identify roundabout elements that play a role in
incorrect roundabout negotiation, ascertain driver characteristics prominent in incorrect
roundabout negotiation, assess the relative potential for incorrect negotiation amongst different
groups of drivers, and suggest measures for improving drivers’ abilities to properly negotiate
roundabouts. The following conclusions are drawn based on the findings.
6.1 Conclusions
In summary, to achieve the stated objectives, a survey was designed and administered to
drivers in five different Nebraska cities. Collected surveys were analyzed to achieve the
objectives of this research. Nine questions assessed knowledge of correct roundabout
negotiation. Drivers incorrectly answered questions regarding the purpose of the truck apron,
turn signal use, and emergency vehicle procedures at roundabouts. These elements play a role in
incorrect roundabout negotiation. The analysis of survey responses confirmed six of the seven
hypotheses regarding driver characteristics prominent in incorrect roundabout negotiation. These
are the conclusions from the hypothesis testing:
Unfamiliar roundabout users have a greater potential for incorrect roundabout negotiation
compared to familiar roundabout users.
Passenger vehicle drivers have a greater potential for incorrect roundabout negotiation
compared to specialty vehicle drivers.
Drivers in different cities in Nebraska have different potential for incorrect roundabout
negotiation. Drivers in Plattsmouth, a community without a roundabout, have a greater
potential for incorrect roundabout negotiation.
Page 77
60
Older drivers have a greater potential for incorrect roundabout negotiation compared to
younger drivers.
Drivers that disfavor roundabouts have a greater potential for incorrect roundabout
negotiation compared to drivers who favor roundabouts.
Drivers that are not confident they can drive through a roundabout in the correct way
have a greater potential for incorrect roundabout negotiation compared to drivers who are
confident they can drive through a roundabout in the correct way.
No significant conclusions could be made for hypothesis 5 regarding drivers that make a
higher number of daily trips. The ordinal regression analysis showed that factors not included in
the initial hypotheses influence the level of roundabout knowledge. The following are the
conclusions based on these factors:
Drivers that do not generally wear their seat belt when driving have a greater potential
for incorrect roundabout negotiation compared to drivers that generally wear a seat
belt.
Drivers that generally do not avoid certain roadways and intersections because of
traffic congestion have a greater potential for incorrect roundabout negotiation
compared to drivers that generally avoid certain roadways and intersections because
of traffic congestion.
Drivers were concerned about the behavior of other drivers, emergency vehicle
procedures, and wanted to receive information on roundabouts via driver’s manual, brochures
and on-site signage. The researchers reviewed information on roundabouts in the Nebraska
Driver’s Manual (details in appendix E) and suggest updates to the roundabout section.
Page 78
61
6.2 Recommendations
This research shows that driver knowledge of roundabout negotiation in Nebraska has
room for improvement. However, the potential for improvement varies across different types of
drivers. Given that non-specialty vehicle drivers exhibited greater potential for incorrect
negotiation of roundabouts, it may be prudent to first focus on improving their knowledge of
roundabouts. In addition, this research showed that several roundabout elements (truck apron
purpose, turn signal use, emergency vehicle procedures) have low levels of driver knowledge.
Knowledge of these elements will help toward reducing incorrect roundabout negotiation and
therefore should be a priority for transportation agencies.
The research team recommends updating information on roundabouts contained in the
Nebraska Driver’s Manual. The updated information pertains to both single- and multi-lane
roundabouts, as shown in figures 6.1 and 6.2.
Page 79
62
Figure 6.1 Suggested Update to NE Driver’s Manual on Driving Single-Lane Roundabouts
Page 80
63
Figure 6.2 Suggested Update to NE Driver’s Manual on Driving Multi-Lane Roundabouts
Page 81
64
6.3 Future Work
While this research identified roundabout elements prominent in incorrect roundabout
negotiation, driver groups with greater potential for incorrect roundabout negotiation, and
improvement measures, research into the effectiveness of different methods for providing
roundabout information is needed. For example, some education techniques may be more
effective for certain driver populations, such as older drivers responding better to educational
demonstrations than a website.
Since the Plattsmouth site was a city without a roundabout during this analysis, future
research can measure changes in incorrect roundabout negotiation or opinion of roundabouts
after a planned roundabout in that community opens. A comparison of responses from
Plattsmouth drivers before and after roundabout construction may reveal changes in driver
knowledge, attitudes, and opinions regarding roundabouts.
There is need to monitor drivers’ behavior in roundabouts on a relatively long-term
basis to observe safety issues faced by drivers. This is especially true for multi-lane roundabouts,
which require knowing correct lanes to use in addition to knowledge of other roundabout
pertinent rules.
Page 82
65
References
1. Robinson, B. W. 2000. Roundabouts: An informational Guide. Publication FHWA-RD-
00-067. FHWA, U.S. Department of Transportation.
2. Persaud, B. N., R. A. Retting, P. E. Garder, and D. Lord. 2001. Safety Effect of
Roundabout Conversions in the United States: Empirical Bayes Observational
Before-After Study. Transportation Research Record: Geometric Design and the
Effects on Traffic Operations, no. 1751:1-8.
3. Retting, R. A., G. Luttrell, and E. R. Russell. 2002. Public Opinion and Traffic Flow
Impacts of Newly Installed Modern Roundabouts in the United States. TRB 2002
Annual Meeting CD-ROM. Transportation Research Board, Washington, D.C.
4. Retting, R. A., S. Mandavilli, E. R. Russell, and A. T. McCartt. 2006. Traffic Flow and
Public Opinion: Newly Installed Roundabouts in New Hampshire, New York, and
Washington. TRB 2006 Annual Meeting CD-ROM. Transportation Research
Board, Washington, D.C.
5. AASHO. 1954. A Policy on Geometric Design of Rural Highways, Washington, D.C.
6. AASHO. 1965. A Policy on Geometric Design of Rural Highways, Washington, D.C.
7. AASHTO. 1984. A Policy on the Geometric Design of Highways and Streets, Washington,
D.C.
8. AASHTO. 2004. A Policy on Geometric Design of Highways and Streets, Washington,
D.C.
9. Retting, R. A., S. Y. Kyrychenko, and A. T. McCartt. 2007. Long-Term Trends in Public
Opinion Following Construction of Roundabouts. TRB 2007 Annual Meeting CD-
ROM. CD-ROM. Transportation Research Board, Washington, D.C.
10. Kirkham Michael. 2006. 2003-2004 Crash Study City of Lincoln, Nebraska. City of
Lincoln, Lincoln, NE.
11. Waddell, E., and J. Albertson. 2005. The Dimondale Mini: America’s First Mini-
Roundabout. Paper presented at the National Roundabout Conference 2005, Vail,
CO.
12. Kliska, J., and K. Winn. 2005. The ‘Sock Puppet’ and other Lessons Learned in Grand
Junction, CO. Paper presented at the National Roundabout Conference 2005, Vail,
CO.
Page 83
66
13. Kittelson & Associates, Inc. 2006. Applying Roundabouts in the United States. NCHRP
Project No. 3-65, Transportation Research Board, Washington, D.C.
14. Ariniello, A. J. 2005. Are Roundabouts Good for Business? Paper presented at the
National Roundabout Conference 2005, Vail, CO.
15. Kennedy, D. R., and K. M. Taylor. 2005. Estimating Roundabout Performance using
Delay and Conflict Opportunity Crash Prediction. Paper presented at the National
Roundabout Conference 2005, Vail, CO.
16. Chapman, J. R., and R. F. Benekohal. 2002. Roundabout Warrants: A Proposed
Framework for Future Development. TRB 2002 Annual Meeting CD-ROM.
Transportation Research Board, Washing, D.C.
17. Asma, T. A., and A. Flannery. 2006. Modeling Driver Selected Speeds at Single Lane
Roundabouts. Paper presented at the ITE 2006 Annual Meeting and Exhibit,
Milwaukee, WI.
18. Transportation Research Board. 2000. Highway Capacity Manual. National Research
Council. Washington, D.C.
19. Doucet, J. 2006. Holistic Design of Roundabout Intersections. Special Project at
University of Nebraska-Lincoln, Lincoln, NE.
20. ETC Institute. 2006. 2006 Roundabout Survey. Prepared for the City of Olathe, KS.
21. Sarkar, S., D. Burden, and M. Wallwork. 1999. Are Drivers well informed about Non-
conventional Traffic Controls at Intersections? TRB 1999 Annual Meeting CD-
ROM. Transportation Research Board, Washing, D.C.
22. Rusell, E. R., M. Rys, and G. Luttrell. 2002. Kansas Roundabout Reluctance. TRB 2002
Annual Meeting CD-ROM. Transportation Research Board, Washington, D.C.
23. Inman, V. W. and B. J. Katz. 2005. Navigation Signing for Roundabouts. Paper presented
at the National Roundabout Conference 2005, Vail, CO.
24. Nebraska Department of Roads. 2005. Roundabouts. Lincoln NE.
25. FHWA. 2003. Manual on Uniform Traffic Control Devices for Highways and Streets.
U.S. Department of Transportation
26. Schurr, K. S., and J. Abos-Sanchez. 2005. Effects of Central Island Landscape Treatments
at Single-Lane Roundabouts. NDOR Research Project Number SPR-P1 (03)
P550, Lincoln, NE.
Page 84
67
27. Richardson, A. J., E. S. Ampt, and A. H. Meyburg. 2005. Survey Methods for Transport
Planning. 2nd
ed. Melbourne, Australia: Eucalyptus Press.
28. Devore, J. 1991. Probability & Statistics for Engineering and Sciences. 3rd
ed. Pacific
Grove, CA: Brooks/Cole Publishing.
29. Noonan, J. 2006. SPSS 14.0 [Computer software]. Chicago: SPSS Inc.
30. Social Security Online. 2006. Normal Retirement Age. July.
http://www.ssa.gov/OACT/ProgData/nra.html.
31. Nebraska Department of Motor Vehicles. 2008. Nebraska Driver’s Manual (English).
Page 86
69
Appendix A Survey Questionnaire
The following pages show the complete survey questionnaire. The consent form had a
perforated edge so that respondents could keep the page for their records if they chose. Correct
answers for the nine questions assessing knowledge of correct roundabout use are marked in the
survey questionnaire.
Page 98
81
Appendix B Data Coding & Reduction
To ease data analysis, the research team numerically coded survey responses. This
appendix details the assignment of coding values for the survey questionnaire. In addition to
defining how survey responses were coded, this appendix details how invalid survey responses
were identified and treated.
The research team brought collected surveys back to the University of Nebraska-
Lincoln campus for analysis. Microsoft Excel software was used for data entry and reduction. A
numeric coding system was used to enter the data of each survey. The variables coded for use in
analysis for this research are shown in table B.1. This table defines how the research team coded
each variable used in analysis.
Page 99
82
Table B.1 Variable Coding for Analysis
Var. Variable
Name
Definition Coding
familiar Familiar
Driver
Dummy
Defines if respondent is a
familiar or unfamiliar
roundabout user
0 if unfamiliar roundabout user, 1
if familiar (more than once per
month)
site Respondent
Site
Response
Defines what community
respondent marked
1 if Lincoln, 2 if Omaha, 3 if
Norfolk, 4 if Plattsmouth, 5 if
Blair, 6 if Other
drvr.
type
Driver Type
Dummy
Defines if respondent is a
specialty vehicle or
passenger vehicle driver
0 if passenger vehicle driver, 1 if
specialty vehicle driver
dislike Driver
Opinion
Dummy
Defines if respondent favors
roundabouts or not
0 if strongly favor, favor, or are
neutral to roundabouts, 1 if
strongly dislike or dislike
roundabouts
high.
trips
Number of
Trips
Dummy
Defines if respondent makes
a high number of daily trips
0 if respondent makes fewer than
5 daily trips, 1 if 5 or more daily
trips
older Older Driver
Dummy
Defines if respondent is an
older driver
0 if respondent is under 60, 1 if
60 or older
can.drv Said Can
Drive
Dummy
Defines if respondent said
they can drive through a
roundabout
0 if strongly disagree, disagree or
are neutral, 1 if strongly agree or
agree
platts Respondent
city does not
have
roundabouts
Defines if a respondent is
from a community without a
roundabout
0 if from a city with a
roundabout, 1 if from city with
roundabouts
tot.ans Total Correct
Answers
Sum of the total number of
correct responses to the 9
questions used for analysis
Integers 0 through 9
C2.ans Question C2
Answer
Defines if respondent
correctly answered question
C2
0 if incorrect, 1 if correct
C4.ans Question C4
Answer
Defines if respondent
correctly answered question
C4
0 if incorrect, 1 if correct
C5.ans Question C5
Answer
Defines if respondent
correctly answered question
C5
0 if incorrect, 1 if correct
Page 100
83
Table B.1 Variable Coding for Analysis (cont.)
Var. Variable
Name
Definition Coding
C7.ans Question C7
Answer
Defines if respondent
correctly answered question
C7
0 if incorrect, 1 if correct
C8.ans Question C8
Answer
Defines if respondent
correctly answered question
C8
0 if incorrect, 1 if correct
C9.ans Question C9
Answer
Defines if respondent
correctly answered question
C9
0 if incorrect, 1 if correct
C10.ans Question C10
Answer
Defines if respondent
correctly answered question
C10
0 if incorrect, 1 if correct
C11.ans Question C11
Answer
Defines if respondent
correctly answered question
C11
0 if incorrect, 1 if correct
grpd.ans Grouping of
correct
answers
Groups total correct answers
of respondents into four
categories
0 if 0-3, 1 if 4-5, 2 if 6-7, 3 if 8-9
correct answers
gender Gender Defines respondent gender 0 if female, 1 if male
commute Commute
time
The time in minutes of
respondents commute time
Scale values
drv.spd Typical
driving speed
Respondents typical driving
speed
1 if 5 below posted, 2 if 5 below
to posted, 3 if at posted, 4 if
posted to 5 above, 5 if 5 above
posted
hv.pssng
r
Driver has
passengers
Defines if respondent
typically has passengers
0 if does not typically have
passengers, 1 if does
seat.belt Driver wears
seatbelt
Defines if respondent
typically wears seatbelt
0 if does not typically wear
seatbelt, 1 if does
avd.sfty Avoids due
to safety
Defines if respondent avoids
roadways because of safety
0 if does not avoid due to safety,
1 if does
avd.cong Avoids due
to congestion
Defines if respondent avoids
roadways because of
congestion
0 if does not avoid due to
congestion, 1 if does
Page 101
84
The variables in table B.1 were used throughout the analysis. The first seven variables
of the table represent the variables used for each of the six hypotheses and the driver perception
analysis. For example, the variable “familiar” was used in conjunction with each of the nine
questions assessing knowledge of correct roundabout negotiation to test hypothesis 1: familiar
roundabout users will have less potential for incorrect roundabout negotiation. The research team
coded these seven variables to categorize the respondents into different groups according to the
goals of the research.
The research team defined the variable “familiar” for hypothesis 1 using question A1
and A2 from the survey questionnaire. Respondents had a choice of responses representing the
number of times they drive through a single-lane (A1) or multi-lane (A2) roundabout. The
research team categorized those respondents that marked “I have never driven through a
roundabout;” “A few times when visiting another place;” “About once per month;” or “I don’t
know” as unfamiliar roundabout users. The research team categorized those that responded with
“Several times per month;” “Several times per week;” or “At least once per day” as familiar
roundabout users. If a respondent was categorized as a familiar driver from either question A1 or
A2, a one value was assigned to the variable “familiar.” If the respondent was categorized as an
unfamiliar driver in both questions, a zero value was assigned.
The research team defined the variable “drv.typ” for hypothesis 2 using question A5
from the survey questionnaire. The survey asked for specialty vehicle drivers to mark the type of
specialty vehicle they drive. If a survey respondent marked down any of the specialty vehicle
types, the research team assigned a one value to the variable “drv.typ.” If the respondent left the
question blank, the research team categorized those respondents as passenger vehicle drivers and
assigned a zero value to the variable “drv.typ.”
Page 102
85
The research team defined the variable “site” for hypothesis 3 using question D3 from
the survey questionnaire. The survey asked respondents to mark the community that they are of a
resident of. Each of the five survey cities were included along with a sixth choice of “other” for
those respondents that did not live in the community they were responding to the survey in. This
variable represents the community the respondent marked down as a resident of, regardless of
the city where the survey was distributed. The research team coded the variable “site” to assign
an integer value from 1 to 6 for each of the choices, as can be seen in table B.1.
The research team defined the variable “older” for hypothesis 4 using question D2
from the survey questionnaire. The survey asked respondents to mark their age range in 5-year
increments. The research team defined an older driver as being over 60 years old, as many
Americans are preparing to retire between the ages of 60 and 65 (30). The variable “older”
assigned a one value to those respondents that marked age ranges 60 or over and a zero value to
respondents that marked age ranges below 60.
The research team defined the variable “high.trip” for hypothesis 5 using question D5
from the survey questionnaire. The survey asked respondents how many daily trips they make,
where a trip is any time a vehicle is driven between two points. The variable “high.trip” assigned
a one value to those respondents that make five or more trips per day and a zero value to those
respondents that make less than five trips per day. The research team defined a respondent
making five or more trips as making a high number of daily trips. The median response to this
question was 4 trips, so a respondent making 5 or more trips is a more frequent driver.
The research team defined the variable “dislike” for hypothesis 6 using question B1
from the survey questionnaire. The survey asked respondents if they like roundabouts on a five-
point scale (Strongly agree, agree, neutral, disagree, and strongly disagree). The variable
Page 103
86
“dislike” assigned a one value to those respondents that marked “Disagree” or “Strongly
Disagree,” and a zero value to those respondents that marked “Strongly Agree,” “Agree,” or
“Neutral.”
The research team defined the variable “can.drv” for hypothesis 7 using question B7
from the survey questionnaire. The survey asked respondents if they felt confident that they
could drive through a roundabout in the correct way using a five-point scale (Strongly agree,
agree, neutral, disagree, and strongly disagree). The variable “can.drv” assigned a one value to
those respondents that marked “Strongly Agree” or “Agree” and a zero value to those
respondents that marked “Strongly Disagree,” “Disagree,” or “Neutral.”
The research team defined the variable “platts” for the regression analysis using
question D3 from the survey questionnaire. Similar to the “site” variable used in the cross
tabulation analyses, this variable simply defines the respondent as either being from a
community with roundabouts or not, as all communities other than Plattsmouth have
roundabouts. If a survey respondent marked down they were from Plattsmouth, the research team
assigned a one value to the variable “platts” otherwise a zero was assigned.
The research team defined the variable “tot.ans” for the final analysis combining the
hypotheses. This variable represents the total number of correct answers to the nine questions
assessing knowledge of correct roundabout negotiation. For example, if a respondent correctly
answers six of these nine questions, the “tot.ans” variable will be a six.
The rest of the variables defined in table B.1 represent the responses to each of the
questions assessing knowledge of correct roundabout negotiation and the extra variables used for
the ordinal regression model analysis. The research team coded each of the nine variables
representing the nine questions assessing knowledge of correct roundabout negotiation to
Page 104
87
produce a zero if the respondent incorrectly answered the question and a one if the respondent
correctly answered the question. Responses of “I don’t know” or if the question was left blank
were coded as zeros also. The research team will use these variables in conjunction with the
seven variables discussed above to conduct the analyses of this research.
This initial data entry included every survey returned to the research team. Some
survey respondents incorrectly responded to the survey or did not complete the entire survey.
The research team reviewed the full data set and eliminated the data from several returned
surveys. An example of an eliminated survey due to incompleteness and one due to incorrect
response is discussed below.
The research team eliminated survey response number 84 from the final data set due to
incompleteness. Of the total 39 questions of the survey, this respondent only completed 28. Of
those 11 questions unanswered, seven of them were questions assessing knowledge of correct
roundabout negotiation. Since the respondent’s intent could not be determined, the research team
did not use the results of this survey for analysis.
The research team eliminated survey response number 71 from the final data set due to
inaccuracy. This respondent marked that they drove every type of specialty vehicle in question
A5.
Of the total 1,136 surveys entered, the research team removed a total of 20 survey
responses from the final data set because they were not useable. The 20 deleted survey responses
and the reasons for deletion are shown in table B.2. The final data set used for analysis had 1,116
survey responses.
Page 105
88
Table B.2 Deleted Survey Responses
Response
number Reason for deletion
38 No response to Section A
68 No response to Section C
69 No response to Section C
71 Responded as every type of specialty
vehicle driver
157 No response to Section D
160 Did not complete the survey after question
C7
179 No response to Section C
298 No response to Section C
357 No response to Section C
456 No response to Section C
521 No response to Section C
547 Multiple Responses to Section B
549 No response to Section C
608 No response to Section C
683 No response to Section C
687 Did not complete the survey after question
C7
771 Did not complete the survey after question
C1
807 Did not complete the survey after question
C7
819 Did not complete the survey after question
C7
877 Did not complete the survey after Section
A
Page 106
89
Appendix C Cross Tabulation Results
Hypothesis 1
The following cross tabulation results determine if unfamiliar roundabout users have
greater potential for incorrect roundabout negotiation than familiar roundabout users.
Table C.1 Hypothesis 1 Cross Tabulation Results for Question C2
Question C2. Which vehicle should yield?
Incorrect Correct Total
Unfamiliar User 50 302 352
Familiar User 47 717 764
Total 97 1019 1116
Chi-Squared Value 19.690
Significance 0.000
Table C.2 Hypothesis 1 Cross Tabulation Results for Question C4
Question C4. Which is the correct left turn?
Incorrect Correct Total
Unfamiliar User 21 331 352
Familiar User 26 738 764
Total 47 1069 1116
Chi-Squared Value 3.923
Significance 0.048
Page 107
90
Table C.3 Hypothesis 1 Cross Tabulation Results for Question C5
Question C5. What to do if missed exit?
Incorrect Correct Total
Unfamiliar User 29 323 352
Familiar User 47 717 764
Total 76 1040 1116
Chi-Squared Value 1.654
Significance 0.198
Table C.4 Hypothesis 1 Cross Tabulation Results for Question C6
Question C6. Use turn signal when entering?
Incorrect Correct Total
Unfamiliar User 298 54 352
Familiar User 660 104 764
Total 958 158 1116
Chi-Squared Value 0.592
Significance 0.442
Table C.5 Hypothesis 1 Cross Tabulation Results for Question C7
Question C7. Use turn signal when exiting?
Incorrect Correct Total
Unfamiliar User 81 271 352
Familiar User 272 492 764
Total 353 763 1116
Chi-Squared Value 17.665
Significance 0.000
Page 108
91
Table C.6 Hypothesis 1 Cross Tabulation Results for Question C8
Question C8. What to do if emergency vehicle (at
yield)?
Incorrect Correct Total
Unfamiliar User 58 294 352
Familiar User 97 667 764
Total 155 961 1116
Chi-Squared Value 2.880
Significance 0.090
Table C.7 Hypothesis 1 Cross Tabulation Results for Question C9
Question C9. What to do if emergency vehicle
(in circle)?
Incorrect Correct Total
Unfamiliar User 262 90 352
Familiar User 310 454 764
Total 572 544 1116
Chi-Squared Value 110.554
Significance 0.000
Table C.8 Hypothesis 1 Cross Tabulation Results for Question C10
Question C10. Where to wait for pedestrians?
Incorrect Correct Total
Unfamiliar User 142 210 352
Familiar User 192 572 764
Total 334 782 1116
Chi-Squared Value 26.583
Significance 0.000
Page 109
92
Table C9 Hypothesis 1 Cross Tabulation Results for Question C11
Question C11. What is the truck apron?
Incorrect Correct Total
Unfamiliar User 327 25 352
Familiar User 653 111 764
Total 980 136 1116
Chi-Squared Value 12.420
Significance 0.000
Hypothesis 2
The following cross tabulation results determine if passenger vehicle drivers have greater
potential for incorrect roundabout negotiation than specialty vehicle drivers.
Table C.10 Hypothesis 2 Cross Tabulation Results for Question C2
Question C2. Which vehicle should yield?
Incorrect Correct Total
Passenger Vehicle Driver 72 789 861
Specialty Vehicle Driver 25 230 255
Total 97 1019 1116
Chi-Squared Value 0.515
Significance 0.473
Table C.11 Hypothesis 2 Cross Tabulation Results for Question C4
Question C4. Which is the correct left turn?
Incorrect Correct Total
Passenger Vehicle Driver 37 824 861
Specialty Vehicle Driver 10 245 255
Total 47 1069 1116
Chi-Squared Value 0.069
Significance 0.793
Page 110
93
Table C.12 Hypothesis 2 Cross Tabulation Results for Question C5
Question C5. What to do if missed exit?
Incorrect Correct Total
Passenger Vehicle Driver 62 799 861
Specialty Vehicle Driver 14 241 255
Total 76 1040 1116
Chi-Squared Value 0.907
Significance 0.341
Table C.13 Hypothesis 2 Cross Tabulation Results for Question C6
Question C6. Use turn signal when entering?
Incorrect Correct Total
Passenger Vehicle Driver 745 116 861
Specialty Vehicle Driver 213 42 255
Total 958 158 1116
Chi-Squared Value 1.455
Significance 0.228
Table C.14 Hypothesis 2 Cross Tabulation Results for Question C7
Question C7. Use turn signal when exiting?
Incorrect Correct Total
Passenger Vehicle Driver 302 559 861
Specialty Vehicle Driver 51 204 255
Total 353 763 1116
Chi-Squared Value 20.675
Significance 0.000
Page 111
94
Table C.15 Hypothesis 2 Cross Tabulation Results for Question C8
Question C8. What to do if emergency vehicle (at yield)?
Incorrect Correct Total
Passenger Vehicle Driver 129 732 861
Specialty Vehicle Driver 26 229 255
Total 155 961 1116
Chi-Squared Value 3.769
Significance 0.052
Table C.16 Hypothesis 2 Cross Tabulation Results for Question C9
Question C9. What to do if emergency vehicle (in circle)?
Incorrect Correct Total
Passenger Vehicle Driver 454 407 861
Specialty Vehicle Driver 118 137 255
Total 572 544 1116
Chi-Squared Value 3.281
Significance 0.070
Table C.17 Hypothesis 2 Cross Tabulation Results for Question C10
Question C10. Where to wait for pedestrians?
Incorrect Correct Total
Passenger Vehicle Driver 267 594 861
Specialty Vehicle Driver 67 188 255
Total 334 782 1116
Chi-Squared Value 2.104
Significance 0.147
Page 112
95
Table C.18 Hypothesis 2 Cross Tabulation Results for Question C11
Question C11. What is the truck apron?
Incorrect Correct Total
Passenger Vehicle Driver 774 87 861
Specialty Vehicle Driver 206 49 255
Total 980 136 1116
Chi-Squared Value 15.261
Significance 0.000
Hypothesis 3
The following cross tabulation results determine if drivers in communities that do not
have roundabouts have greater potential for incorrect roundabout negotiation than drivers in
communities that have roundabouts.
Table C.19 Hypothesis 3 Cross Tabulation Results for Question C2
Question C2. Which vehicle should yield?
Incorrect Correct Total
Lincoln 12 220 232
Omaha 23 214 237
Norfolk 15 229 244
Plattsmouth 25 108 133
Blair 10 162 172
Other 10 81 91
Total 95 1014 1109
Chi-Squared
Value 25.745
Significance 0.000
Page 113
96
Table C.20 Hypothesis 3 Cross Tabulation Results for Question C4
Question C4. Which is the correct left turn?
Incorrect Correct Total
Lincoln 8 224 232
Omaha 6 231 237
Norfolk 8 236 244
Plattsmouth 12 121 133
Blair 5 167 172
Other 7 84 91
Total 46 1063 1109
Chi-Squared
Value 13.797
Significance 0.017
Table C.21 Hypothesis 3 Cross Tabulation Results for Question C5
Question C5. What to do if missed exit?
Incorrect Correct Total
Lincoln 10 222 232
Omaha 14 223 237
Norfolk 18 226 244
Plattsmouth 15 118 133
Blair 10 162 172
Other 7 84 91
Total 74 1035 1109
Chi-Squared
Value 7.382
Significance 0.194
Page 114
97
Table C.22 Hypothesis 3 Cross Tabulation Results for Question C6
Question C6. Use turn signal when entering?
Incorrect Correct Total
Lincoln 210 22 232
Omaha 208 29 237
Norfolk 198 46 244
Plattsmouth 109 24 133
Blair 152 20 172
Other 76 15 91
Total 953 156 1109
Chi-Squared
Value 12.340
Significance 0.030
Table C.23 Hypothesis 3 Cross Tabulation Results for Question C7
Question C7. Use turn signal when exiting?
Incorrect Correct Total
Lincoln 69 163 232
Omaha 60 177 237
Norfolk 93 151 244
Plattsmouth 30 103 133
Blair 78 94 172
Other 19 72 91
Total 349 760 1109
Chi-Squared
Value 34.473
Significance 0.000
Page 115
98
Table C.24 Hypothesis 3 Cross Tabulation Results for Question C8
Question C8. What to do if emergency vehicle
(at yield)?
Incorrect Correct Total
Lincoln 32 200 232
Omaha 33 204 237
Norfolk 26 218 244
Plattsmouth 27 106 133
Blair 27 145 172
Other 8 83 91
Total 153 956 1109
Chi-Squared
Value 9.198
Significance 0.101
Table C.25 Hypothesis 3 Cross Tabulation Results for Question C9
Question C9. What to do if emergency vehicle
(in circle)?
Incorrect Correct Total
Lincoln 85 147 232
Omaha 147 90 237
Norfolk 68 176 244
Plattsmouth 108 25 133
Blair 103 69 172
Other 56 35 91
Total 567 542 1109
Chi-Squared
Value 140.953
Significance 0.000
Page 116
99
Table C.26 Hypothesis 3 Cross Tabulation Results for Question C10
Question C10. Where to wait for pedestrians?
Incorrect Correct Total
Lincoln 37 195 232
Omaha 86 151 237
Norfolk 50 194 244
Plattsmouth 60 73 133
Blair 70 102 172
Other 29 62 91
Total 332 777 1109
Chi-Squared
Value 60.839
Significance 0.000
Table C.27 Hypothesis 3 Cross Tabulation Results for Question C11
Question C11. What is the truck apron?
Incorrect Correct Total
Lincoln 191 41 232
Omaha 225 12 237
Norfolk 203 41 244
Plattsmouth 128 5 133
Blair 149 23 172
Other 77 14 91
Total 973 136 1109
Chi-Squared
Value 32.362
Significance 0.000
Hypothesis 4
The following cross tabulation results determine if older drivers have a greater potential
for incorrect roundabout negotiation compared with younger drivers.
Page 117
100
Table C.28 Hypothesis 4 Cross Tabulation Results for Question C2
Question C2. Which vehicle should yield?
Incorrect Correct Total
Respondent under 60 70 913 983
Respondent over 60 26 96 122
Total 96 1009 1105
Chi-Squared Value 27.549
Significance 0.000
Table C.29 Hypothesis 4 Cross Tabulation Results for Question C4
Question C4. Which is the correct left turn?
Incorrect Correct Total
Respondent under 60 32 951 983
Respondent over 60 14 108 122
Total 46 1059 1105
Chi-Squared Value 18.381
Significance 0.000
Table C.30 Hypothesis 4 Cross Tabulation Results for Question C5
Question C5. What to do if missed exit?
Incorrect Correct Total
Respondent under 60 61 922 983
Respondent over 60 13 109 122
Total 74 1031 1105
Chi-Squared Value 3.440
Significance 0.064
Page 118
101
Table C.31 Hypothesis 4 Cross Tabulation Results for Question C6
Question C6. Use turn signal when entering?
Incorrect Correct Total
Respondent under 60 846 137 983
Respondent over 60 102 20 122
Total 948 157 1105
Chi-Squared Value 0.537
Significance 0.464
Table C.32 Hypothesis 4 Cross Tabulation Results for Question C7
Question C7. Use turn signal when exiting?
Incorrect Correct Total
Respondent under 60 305 678 983
Respondent over 60 45 77 122
Total 350 755 1105
Chi-Squared Value 1.721
Significance 0.190
Table C.33 Hypothesis 4 Cross Tabulation Results for Question C8
Question C8. What to do if emergency vehicle (at
yield)?
Incorrect Correct Total
Respondent under 60 137 846 983
Respondent over 60 15 107 122
Total 152 953 1105
Chi-Squared Value 0.247
Significance 0.619
Page 119
102
Table C.34 Hypothesis 4 Cross Tabulation Results for Question C9
Question C9. What to do if emergency vehicle (in
circle)?
Incorrect Correct Total
Respondent under 60 496 487 983
Respondent over 60 69 53 122
Total 565 540 1105
Chi-Squared Value 1.616
Significance 0.204
Table C.35 Hypothesis 4 Cross Tabulation Results for Question C10
Question C10. Where to wait for pedestrians?
Incorrect Correct Total
Respondent under 60 280 703 983
Respondent over 60 49 73 122
Total 329 776 1105
Chi-Squared Value 7.081
Significance 0.008
Table C.36 Hypothesis 4 Cross Tabulation Results for Question C11
Question C11. What is the truck apron?
Incorrect Correct Total
Respondent under 60 860 123 983
Respondent over 60 109 13 122
Total 969 136 1105
Chi-Squared Value 0.347
Significance 0.556
Page 120
103
Hypothesis 5
The following cross tabulation results determine if drivers that make less than five daily
trips have a greater potential for incorrect roundabout negotiation than drivers that make five or
more daily trips.
Table C.37 Hypothesis 5 Cross Tabulation Results for Question C2
Question C2. Which vehicle should yield?
Incorrect Correct Total
Fewer than 5 daily trips 56 577 633
5 or more daily trips 36 421 457
Total 92 998 1090
Chi-Squared Value 0.323
Significance 0.570
Table C.38 Hypothesis 5 Cross Tabulation Results for Question C4
Question C4. Which is the correct left turn?
Incorrect Correct Total
Fewer than 5 daily trips 21 612 633
5 or more daily trips 22 435 457
Total 43 1047 1090
Chi-Squared Value 1.568
Significance 0.210
Page 121
104
Table C.39 Hypothesis 5 Cross Tabulation Results for Question C5
Question C5. What to do if missed exit?
Incorrect Correct Total
Fewer than 5 daily trips 40 593 633
5 or more daily trips 32 425 457
Total 72 1018 1090
Chi-Squared Value 0.201
Significance 0.654
Table C.40 Hypothesis 5 Cross Tabulation Results for Question C6
Question C6. Use turn signal when entering?
Incorrect Correct Total
Fewer than 5 daily trips 551 82 633
5 or more daily trips 389 68 457
Total 940 150 1090
Chi-Squared Value 0.829
Significance 0.363
Table C.41 Hypothesis 5 Cross Tabulation Results for Question C7
Question C7. Use turn signal when exiting?
Incorrect Correct Total
Fewer than 5 daily trips 214 419 633
5 or more daily trips 132 325 457
Total 346 744 1090
Chi-Squared Value 2.969
Significance 0.085
Page 122
105
Table C.42 Hypothesis 5 Cross Tabulation Results for Question C8
Question C8. What to do if emergency vehicle (at
yield)?
Incorrect Correct Total
Fewer than 5 daily trips 80 553 633
5 or more daily trips 70 387 457
Total 150 940 1090
Chi-Squared Value 1.605
Significance 0.205
Table C.43 Hypothesis 5 Cross Tabulation Results for Question C9
Question C9. What to do if emergency vehicle (in
circle)?
Incorrect Correct Total
Fewer than 5 daily trips 331 302 633
5 or more daily trips 225 232 457
Total 556 534 1090
Chi-Squared Value 0.992
Significance 0.319
Table C.44 Hypothesis 5 Cross Tabulation Results for Question C10
Question C10. Where to wait for pedestrians?
Incorrect Correct Total
Fewer than 5 daily trips 193 440 633
5 or more daily trips 129 328 457
Total 322 768 1090
Chi-Squared Value 0.652
Significance 0.419
Page 123
106
Table C.45 Hypothesis 5 Cross Tabulation Results for Question C11
Question C11. What is the truck apron?
Incorrect Correct Total
Fewer than 5 daily trips 563 70 633
5 or more daily trips 392 65 457
Total 955 135 1090
Chi-Squared Value 2.450
Significance 0.118
Hypothesis 6
The following cross tabulation results determine if drivers that dislike roundabouts have a
greater potential for incorrect roundabout negotiation compared to drivers that like roundabouts.
Table C.46 Hypothesis 6 Cross Tabulation Results for Question C2
Question C2. Which vehicle should yield?
Incorrect Correct Total
Favor roundabouts 65 814 879
Dislike roundabouts 32 205 237
Total 97 1019 1116
Chi-Squared Value 8.773
Significance 0.003
Table C.47 Hypothesis 6 Cross Tabulation Results for Question C4
Question C4. Which is the correct left turn?
Incorrect Correct Total
Favor roundabouts 34 845 879
Dislike roundabouts 13 224 237
Total 47 1069 1116
Chi-Squared Value 1.210
Significance 0.271
Page 124
107
Table C.48 Hypothesis 6 Cross Tabulation Results for Question C5
Question C5. What to do if missed exit?
Incorrect Correct Total
Favor roundabouts 48 831 879
Dislike roundabouts 28 209 237
Total 76 1040 1116
Chi-Squared Value 11.874
Significance 0.001
Table C.49 Hypothesis 6 Cross Tabulation Results for Question C6
Question C6. Use turn signal when entering?
Incorrect Correct Total
Favor roundabouts 765 114 879
Dislike roundabouts 193 44 237
Total 958 158 1116
Chi-Squared Value 4.810
Significance 0.028
Table C.50 Hypothesis 6 Cross Tabulation Results for Question C7
Question C7. Use turn signal when exiting?
Incorrect Correct Total
Favor roundabouts 257 622 879
Dislike roundabouts 96 141 237
Total 353 763 1116
Chi-Squared Value 10.961
Significance 0.001
Page 125
108
Table C.51 Hypothesis 6 Cross Tabulation Results for Question C8
Question C8. What to do if emergency vehicle (at
yield)?
Incorrect Correct Total
Favor roundabouts 122 757 879
Dislike roundabouts 33 204 237
Total 155 961 1116
Chi-Squared Value 0.000
Significance 0.986
Table C.52 Hypothesis 6 Cross Tabulation Results for Question C9
Question C9. What to do if emergency vehicle (in
circle)?
Incorrect Correct Total
Favor roundabouts 446 433 879
Dislike roundabouts 126 111 237
Total 572 544 1116
Chi-Squared Value 0.439
Significance 0.507
Table C.53 Hypothesis 6 Cross Tabulation Results for Question C10
Question C10. Where to wait for pedestrians?
Incorrect Correct Total
Favor roundabouts 245 634 879
Dislike roundabouts 89 148 237
Total 334 782 1116
Chi-Squared Value 8.341
Significance 0.004
Page 126
109
Table C.54 Hypothesis 6 Cross Tabulation Results for Question C11
Question C11. What is the truck apron?
Incorrect Correct Total
Favor roundabouts 760 119 879
Dislike roundabouts 220 17 237
Total 980 136 1116
Chi-Squared Value 7.067
Significance 0.008
Hypothesis 7
The following cross tabulation results determine if drivers that are not confident that they
can negotiate a roundabout in the correct way have a greater potential for incorrect roundabout
negotiation compared to drivers that are confident that they can negotiate a roundabout in the
correct way.
Table C.55 Hypothesis 7 Cross Tabulation Results for Question C2
Question C2. Which vehicle should yield?
Incorrect Correct Total
Not confident can drive through roundabout 30 99 129
Confident can drive through roundabout 63 906 969
Total 93 1005 1098
Chi-Squared Value 41.221
Significance 0.000
Page 127
110
Table C.56 Hypothesis 7 Cross Tabulation Results for Question C4
Question C4. Which is the correct left turn?
Incorrect Correct Total
Not confident can drive through roundabout 22 107 129
Confident can drive through roundabout 22 947 969
Total 44 1054 1098
Chi-Squared Value 64.684
Significance 0.000
Table C.57 Hypothesis 7 Cross Tabulation Results for Question C5
Question C5. What to do if missed exit?
Incorrect Correct Total
Not confident can drive through roundabout 29 100 129
Confident can drive through roundabout 44 925 969
Total 73 1025 1098
Chi-Squared Value 59.035
Significance 0.000
Table C.58 Hypothesis 7 Cross Tabulation Results for Question C6
Question C6. Use turn signal when entering?
Incorrect Correct Total
Not confident can drive through roundabout 107 22 129
Confident can drive through roundabout 837 132 969
Total 944 154 1098
Chi-Squared Value 1.112
Significance 0.292
Page 128
111
Table C.59 Hypothesis 7 Cross Tabulation Results for Question C7
Question C7. Use turn signal when exiting?
Incorrect Correct Total
Not confident can drive through roundabout 55 74 129
Confident can drive through roundabout 289 680 969
Total 344 754 1098
Chi-Squared Value 8.685
Significance 0.003
Table C.60 Hypothesis 7 Cross Tabulation Results for Question C8
Question C8. What to do if emergency vehicle (at yield)?
Incorrect Correct Total
Not confident can drive through roundabout 43 86 129
Confident can drive through roundabout 107 862 969
Total 150 948 1098
Chi-Squared Value 47.960
Significance 0.000
Table C.61 Hypothesis 7 Cross Tabulation Results for Question C9
Question C9. What to do if emergency vehicle (in circle)?
Incorrect Correct Total
Not confident can drive through roundabout 93 36 129
Confident can drive through roundabout 469 500 969
Total 562 536 1098
Chi-Squared Value 25.576
Significance 0.000
Page 129
112
Table C.62 Hypothesis 7 Cross Tabulation Results for Question C10
Question C10. Where to wait for pedestrians?
Incorrect Correct Total
Not confident can drive through roundabout 70 59 129
Confident can drive through roundabout 257 712 969
Total 327 771 1098
Chi-Squared Value 41.896
Significance 0.000
Table C.63 Hypothesis 7 Cross Tabulation Results for Question C11
Question C11. What is the truck apron?
Incorrect Correct Total
Not confident can drive through roundabout 122 7 129
Confident can drive through roundabout 841 128 969
Total 963 135 1098
Chi-Squared Value 6.395
Significance 0.011
Page 130
113
Ordinal Regression Model
The results of the initial ordinal regression model are reported in table C.64.
Table C.64 Initial Ordinal Regression Analysis
Model Fitting Information
Chi-Square 137.119
Degrees of
Freedom
14
Significance 0.000
Parameter Estimate Std. Error t-value
familiar 0.397 0.173 2.289
drvr.type 0.520 0.179 2.909
platts -0.334 0.229 -1.462
older -0.465 0.212 -2.197
high.trips 0.113 0.135 0.833
dislike -0.273 0.165 -1.656
can.drv 1.235 0.210 5.871
gender 0.580 0.142 4.081
commute 0.002 0.003 0.799
driv.spd -0.120 0.090 -1.332
hv.pssngr -0.120 0.141 -0.857
seat.belt 0.654 0.188 3.471
avd.sfty -0.053 0.172 -0.311
avd.cong 0.265 0.140 1.894
Variables were removed from the model if their respective t-values were below the 95%
confidence level threshold. The final model with parameter effects on the model can be seen in
Chapter 5.
Page 131
114
Appendix D Graphical Representation of Significant Results
Hypothesis 1
Figure D.1 Question C2 Graphical Results for Hypothesis 1
0
100
200
300
400
500
600
700
800
Incorrect Correct
Nu
mb
er o
f R
esp
on
ses
Unfamiliar Familiar
0%
20%
40%
60%
80%
100%
Unfamiliar Familiar
Cu
mm
ula
tiv
e P
erce
nt
of
Res
po
nse
s W
ith
in D
riv
er G
rou
p
Incorrect Correct
Page 132
115
Figure D.2 Question C4 Graphical Results for Hypothesis 1
0
100
200
300
400
500
600
700
800
Incorrect Correct
Nu
mb
er o
f R
esp
on
ses
Unfamiliar Familiar
0%
20%
40%
60%
80%
100%
Unfamiliar Familiar
Cu
mm
ula
tiv
e P
erce
nt
of
Res
po
nse
s W
ith
in D
riv
er G
rou
p
Incorrect Correct
Page 133
116
Figure D.3 Question C7 Graphical Results for Hypothesis 1
0
100
200
300
400
500
600
Incorrect Correct
Nu
mb
er o
f R
esp
on
ses
Unfamiliar Familiar
0%
20%
40%
60%
80%
100%
Unfamiliar Familiar
Cu
mm
ula
tiv
e P
erce
nt
of
Res
po
nse
s W
ith
in D
riv
er G
rou
p
Incorrect Correct
Page 134
117
Figure D.4 Question C9 Graphical Results for Hypothesis 1
0
50
100
150
200
250
300
350
400
450
500
Incorrect Correct
Nu
mb
er o
f R
esp
on
ses
Unfamiliar Familiar
0%
20%
40%
60%
80%
100%
Unfamiliar Familiar
Cu
mm
ula
tiv
e P
erce
nt
of
Res
po
nse
s W
ith
in D
riv
er G
rou
p
Incorrect Correct
Page 135
118
Figure D.5 Question C10 Graphical Results for Hypothesis 1
0
100
200
300
400
500
600
700
Incorrect Correct
Nu
mb
er o
f R
esp
on
ses
Unfamiliar Familiar
0%
20%
40%
60%
80%
100%
Unfamiliar Familiar
Cu
mm
ula
tiv
e P
erce
nt
of
Res
po
nse
s W
ith
in D
riv
er G
rou
p
Incorrect Correct
Page 136
119
Figure D.6 Question C11 Graphical Results for Hypothesis 1
0
100
200
300
400
500
600
700
Incorrect Correct
Nu
mb
er o
f R
esp
on
ses
Unfamiliar Familiar
0%
20%
40%
60%
80%
100%
Unfamiliar Familiar
Cu
mm
ula
tiv
e P
erce
nt
of
Res
po
nse
s W
ith
in D
riv
er G
rou
p
Incorrect Correct
Page 137
120
Hypothesis 2
Figure D.7 Question C7 Graphical Results for Hypothesis 2
0
100
200
300
400
500
600
Incorrect Correct
Nu
mb
er o
f R
esp
on
ses
Common Driver Specialty Vehicle Driver
0%
20%
40%
60%
80%
100%
Common Driver Specialty Vehicle Driver
Cu
mm
ula
tiv
e P
erce
nt
of
Res
po
nse
s W
ith
in D
riv
er G
rou
p
Incorrect Correct
Page 138
121
Figure D.8 Question C11 Graphical Results for Hypothesis 2
0
100
200
300
400
500
600
700
800
900
Incorrect Correct
Nu
mb
er o
f R
esp
on
ses
Common Driver Specialty Vehicle Driver
0%
20%
40%
60%
80%
100%
Common Driver Specialty Vehicle Driver
Cu
mm
ula
tiv
e P
erce
nt
of
Res
po
nse
s W
ith
in D
riv
er G
rou
p
Incorrect Correct
Page 139
122
Hypothesis 3
Figure D.9 Question C2 Graphical Results for Hypothesis 3
0
50
100
150
200
250
Incorrect Correct
Nu
mb
er o
f R
esp
on
ses
Lincoln Omaha Norfolk Platts. Blair Other
0%
20%
40%
60%
80%
100%
Lincoln Omaha Norfolk Platts. Blair Other
Cu
mm
ula
tiv
e P
erce
nt
of
Res
po
nse
s W
ith
in D
riv
er G
rou
p
Incorrect Correct
Page 140
123
Figure D.10 Question C4 Graphical Results for Hypothesis 3
0
50
100
150
200
250
Incorrect Correct
Nu
mb
er o
f R
esp
on
ses
Lincoln Omaha Norfolk Platts. Blair Other
0%
20%
40%
60%
80%
100%
Lincoln Omaha Norfolk Platts. Blair Other
Cu
mm
ula
tiv
e P
erce
nt
of
Res
po
nse
s W
ith
in D
riv
er G
rou
p
Incorrect Correct
Page 141
124
Figure D.11 Question C6 Graphical Results for Hypothesis 3
0
50
100
150
200
250
Incorrect Correct
Nu
mb
er o
f R
esp
on
ses
Lincoln Omaha Norfolk Platts. Blair Other
0%
20%
40%
60%
80%
100%
Lincoln Omaha Norfolk Platts. Blair Other
Cu
mm
ula
tiv
e P
erce
nt
of
Res
po
nse
s W
ith
in D
riv
er G
rou
p
Incorrect Correct
Page 142
125
Figure D.12 Question C7 Graphical Results for Hypothesis 3
0
20
40
60
80
100
120
140
160
180
200
Incorrect Correct
Nu
mb
er o
f R
esp
on
ses
Lincoln Omaha Norfolk Platts. Blair Other
0%
20%
40%
60%
80%
100%
Lincoln Omaha Norfolk Platts. Blair Other
Cu
mm
ula
tiv
e P
erce
nt
of
Res
po
nse
s W
ith
in D
riv
er G
rou
p
Incorrect Correct
Page 143
126
Figure D.13 Question C9 Graphical Results for Hypothesis 3
0
20
40
60
80
100
120
140
160
180
200
Incorrect Correct
Nu
mb
er o
f R
esp
on
ses
Lincoln Omaha Norfolk Platts. Blair Other
0%
20%
40%
60%
80%
100%
Lincoln Omaha Norfolk Platts. Blair Other
Cu
mm
ula
tiv
e P
erce
nt
of
Res
po
nse
s W
ith
in D
riv
er G
rou
p
Incorrect Correct
Page 144
127
Figure D.14 Question C10 Graphical Results for Hypothesis 3
0
50
100
150
200
250
Incorrect Correct
Nu
mb
er o
f R
esp
on
ses
Lincoln Omaha Norfolk Platts. Blair Other
0%
20%
40%
60%
80%
100%
Lincoln Omaha Norfolk Platts. Blair Other
Cu
mm
ula
tiv
e P
erce
nt
of
Res
po
nse
s W
ith
in D
riv
er G
rou
p
Incorrect Correct
Page 145
128
Figure D.15 Question C11 Graphical Results for Hypothesis 3
0
50
100
150
200
250
Incorrect Correct
Nu
mb
er o
f R
esp
on
ses
Lincoln Omaha Norfolk Platts. Blair Other
0%
20%
40%
60%
80%
100%
Lincoln Omaha Norfolk Platts. Blair Other
Cu
mm
ula
tiv
e P
erce
nt
of
Res
po
nse
s W
ith
in D
riv
er G
rou
p
Incorrect Correct
Page 146
129
Hypothesis 4
Figure D16 Question C2 Graphical Results for Hypothesis 4
0
100
200
300
400
500
600
700
800
900
1000
Incorrect Correct
Nu
mb
er o
f R
esp
on
ses
Drivers under 60 Drivers over 60
0%
20%
40%
60%
80%
100%
Drivers under 60 Drivers over 60
Cu
mm
ula
tiv
e P
erce
nt
of
Res
po
nse
s W
ith
in D
riv
er G
rou
p
Incorrect Correct
Page 147
130
Figure D.17 Question C4 Graphical Results for Hypothesis 4
0
100
200
300
400
500
600
700
800
900
1000
Incorrect Correct
Nu
mb
er o
f R
esp
on
ses
Drivers under 60 Drivers over 60
0%
20%
40%
60%
80%
100%
Drivers under 60 Drivers over 60
Cu
mm
ula
tiv
e P
erce
nt
of
Res
po
nse
s W
ith
in D
riv
er G
rou
p
Incorrect Correct
Page 148
131
Figure D.18 Question C10 Graphical Results for Hypothesis 4
0
100
200
300
400
500
600
700
800
Incorrect Correct
Nu
mb
er o
f R
esp
on
ses
Drivers under 60 Drivers over 60
0%
20%
40%
60%
80%
100%
Drivers under 60 Drivers over 60
Cu
mm
ula
tiv
e P
erce
nt
of
Res
po
nse
s W
ith
in D
riv
er G
rou
p
Incorrect Correct
Page 149
132
Hypothesis 6
Figure D.19 Question C2 Graphical Results for Hypothesis 6
0
100
200
300
400
500
600
700
800
900
Incorrect Correct
Nu
mb
er o
f R
esp
on
ses
Neutral or Like Dislike
0%
20%
40%
60%
80%
100%
Neutral or Like Dislike
Cu
mm
ula
tiv
e P
erce
nt
of
Res
po
nse
s W
ith
in D
riv
er G
rou
p
Incorrect Correct
Page 150
133
Figure D.20 Question C5 Graphical Results for Hypothesis 6
0
100
200
300
400
500
600
700
800
900
Incorrect Correct
Nu
mb
er o
f R
esp
on
ses
Neutral or Like Dislike
0%
20%
40%
60%
80%
100%
Neutral or Like Dislike
Cu
mm
ula
tiv
e P
erce
nt
of
Res
po
nse
s W
ith
in D
riv
er G
rou
p
Incorrect Correct
Page 151
134
Figure D.21 Question C6 Graphical Results for Hypothesis 6
0
100
200
300
400
500
600
700
800
900
Incorrect Correct
Nu
mb
er o
f R
esp
on
ses
Neutral or Like Dislike
0%
20%
40%
60%
80%
100%
Neutral or Like Dislike
Cu
mm
ula
tiv
e P
erce
nt
of
Res
po
nse
s W
ith
in D
riv
er G
rou
p
Incorrect Correct
Page 152
135
Figure D.22 Question C7 Graphical Results for Hypothesis 6
0
100
200
300
400
500
600
700
Incorrect Correct
Nu
mb
er o
f R
esp
on
ses
Neutral or Like Dislike
0%
20%
40%
60%
80%
100%
Neutral or Like Dislike
Cu
mm
ula
tiv
e P
erce
nt
of
Res
po
nse
s W
ith
in D
riv
er G
rou
p
Incorrect Correct
Page 153
136
Figure D.23 Question C10 Graphical Results for Hypothesis 6
0
100
200
300
400
500
600
700
Incorrect Correct
Nu
mb
er o
f R
esp
on
ses
Neutral or Like Dislike
0%
20%
40%
60%
80%
100%
Neutral or Like Dislike
Cu
mm
ula
tiv
e P
erce
nt
of
Res
po
nse
s W
ith
in D
riv
er G
rou
p
Incorrect Correct
Page 154
137
Figure D.24 Question C11 Graphical Results for Hypothesis 6
0
100
200
300
400
500
600
700
800
Incorrect Correct
Nu
mb
er o
f R
esp
on
ses
Neutral or Like Dislike
60%
80%
100%
Neutral or Like Dislike
Cu
mm
ula
tiv
e P
erce
nt
of
Res
po
nse
s W
ith
in D
riv
er G
rou
p
Incorrect Correct
Page 155
138
Hypothesis 7
Figure D.25 Question C2 Graphical Results for Hypothesis 7
0
100
200
300
400
500
600
700
800
900
1000
Incorrect Correct
Nu
mb
er o
f R
esp
on
ses
Said Could Not Drive Said Could Drive
0%
20%
40%
60%
80%
100%
Said Could Not Drive Said Could Drive
Cu
mm
ula
tiv
e P
erce
nt
of
Res
po
nse
s W
ith
in D
riv
er G
rou
p
Incorrect Correct
Page 156
139
Figure D.26 Question C4 Graphical Results for Hypothesis 7
0
100
200
300
400
500
600
700
800
900
1000
Incorrect Correct
Nu
mb
er o
f R
esp
on
ses
Said Could Not Drive Said Could Drive
0%
20%
40%
60%
80%
100%
Said Could Not Drive Said Could Drive
Cu
mm
ula
tiv
e P
erce
nt
of
Res
po
nse
s W
ith
in D
riv
er G
rou
p
Incorrect Correct
Page 157
140
Figure D.27 Question C5 Graphical Results for Hypothesis 7
0
100
200
300
400
500
600
700
800
900
1000
Incorrect Correct
Nu
mb
er o
f R
esp
on
ses
Said Could Not Drive Said Could Drive
0%
20%
40%
60%
80%
100%
Said Could Not Drive Said Could Drive
Cu
mm
ula
tiv
e P
erce
nt
of
Res
po
nse
s W
ith
in D
riv
er G
rou
p
Incorrect Correct
Page 158
141
Figure D.28 Question C7 Graphical Results for Hypothesis 7
0
100
200
300
400
500
600
700
800
Incorrect Correct
Nu
mb
er o
f R
esp
on
ses
Said Could Not Drive Said Could Drive
0%
20%
40%
60%
80%
100%
Said Could Not Drive Said Could Drive
Cu
mm
ula
tiv
e P
erce
nt
of
Res
po
nse
s W
ith
in D
riv
er G
rou
p
Incorrect Correct
Page 159
142
Figure D.29 Question C8 Graphical Results for Hypothesis 7
0
100
200
300
400
500
600
700
800
900
1000
Incorrect Correct
Nu
mb
er o
f R
esp
on
ses
Said Could Not Drive Said Could Drive
0%
20%
40%
60%
80%
100%
Said Could Not Drive Said Could Drive
Cu
mm
ula
tiv
e P
erce
nt
of
Res
po
nse
s W
ith
in D
riv
er G
rou
p
Incorrect Correct
Page 160
143
Figure D.30 Question C9 Graphical Results for Hypothesis 7
0
100
200
300
400
500
600
Incorrect Correct
Nu
mb
er o
f R
esp
on
ses
Said Could Not Drive Said Could Drive
0%
20%
40%
60%
80%
100%
Said Could Not Drive Said Could Drive
Cu
mm
ula
tiv
e P
erce
nt
of
Res
po
nse
s W
ith
in D
riv
er G
rou
p
Incorrect Correct
Page 161
144
Figure D.31 Question C10 Graphical Results for Hypothesis 7
0
100
200
300
400
500
600
700
800
Incorrect Correct
Nu
mb
er o
f R
esp
on
ses
Said Could Not Drive Said Could Drive
0%
20%
40%
60%
80%
100%
Said Could Not Drive Said Could Drive
Cu
mm
ula
tiv
e P
erce
nt
of
Res
po
nse
s W
ith
in D
riv
er G
rou
p
Incorrect Correct
Page 162
145
Figure D.32 Question C11 Graphical Results for Hypothesis 7
0
100
200
300
400
500
600
700
800
900
Incorrect Correct
Nu
mb
er o
f R
esp
on
ses
Said Could Not Drive Said Could Drive
0%
20%
40%
60%
80%
100%
Said Could Not Drive Said Could Drive
Cu
mm
ula
tiv
e P
erce
nt
of
Res
po
nse
s W
ith
in D
riv
er G
rou
p
Incorrect Correct
Page 163
146
Appendix E Roundabout Information from Nebraska Driver’s Manual
Information on roundabout negotiation in the 2008 Nebraska Driver’s Manual (English)
was reviewed and discussed with the project technical advisory committee. The survey data
analysis indicated that respondents wanted to receive roundabout information via the driver’s
manual. The research team and TAC members felt that the current information on roundabouts in
the manual (section 4A-4, page 42; see Figure E.1) was limited and discussed supplementing
existing information with guidelines on proper response when emergency vehicles are
encountered in roundabouts and guidelines on proper usage of roundabout aprons. Section 4A-6
may need clarification with respect to roundabouts and emergency vehicles as pulling as close as
possible to the curb or edge of the roadway and that stopping is not appropriate in a roundabout
when an emergency vehicle is encountered.
Additionally, the research team reviewed the current Nebraska Manual for Commercial
Driver’s Licensing, the Nebraska Motorcycle Operator Manual (both supplements to the
Nebraska Driver’s Manual), and manuals from surrounding Midwestern states to identify
presence of roundabout-related information in those documents.
Page 164
147
Figure E.1 Existing Information in Nebraska Driver’s Manual (31)


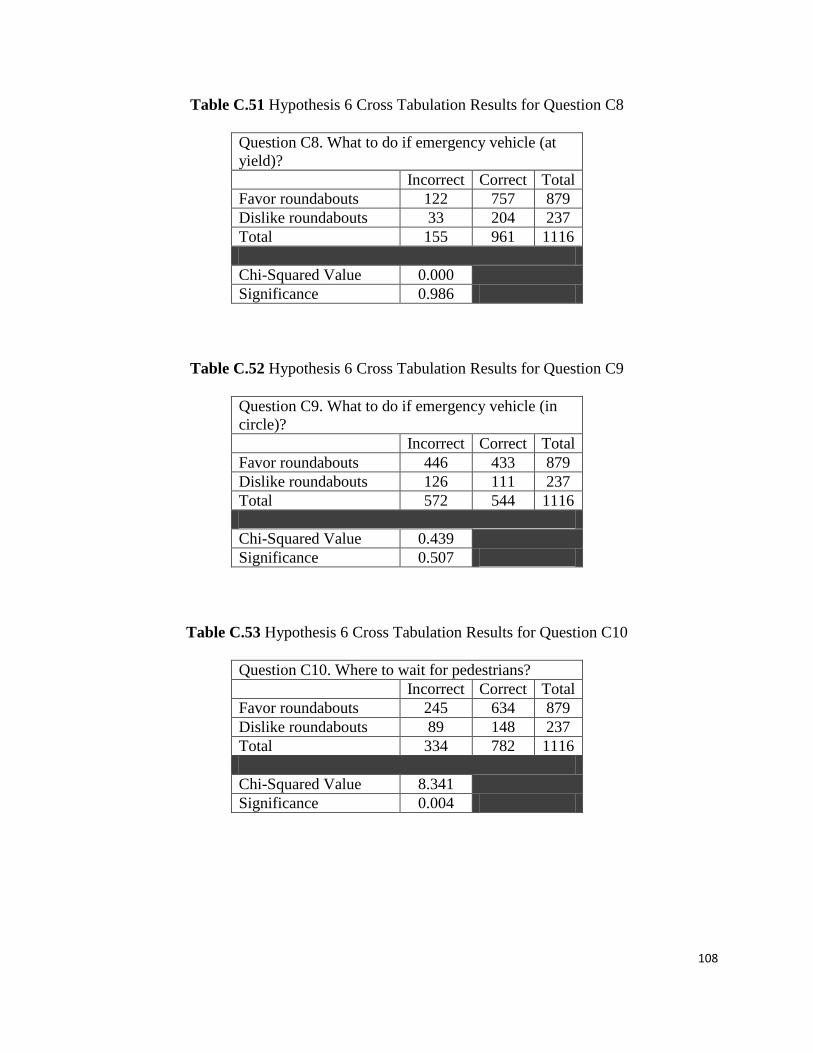


![Why Roundabouts? [Infographic]](https://static.documents.pub/doc/80x56/5479635fb479599f098b4744/why-roundabouts-infographic.jpg)


