21
NEDBANK GROUP LIMITED 19th Annual UBS South African Financial Services Conference NEDBANK GROUP LIMITED The Technology Frontier 13 October 2016 Fred Swanepoel, CIO A Member of the Group

NEDBANK GROUP LIMITED
19th Annual UBS South African Financial Services Conference
NEDBANK GROUP LIMITED
The Technology Frontier
13 October 2016
Fred Swanepoel, CIO
A Member of the Group

2
Macro themes driving change in banking
Cost efficiencies
Changing banking environment
Changing client expectations
Increasing innovation
Mobile
Agenda Digitisation
Big data Cloud computing
Rise of Fintechs
3
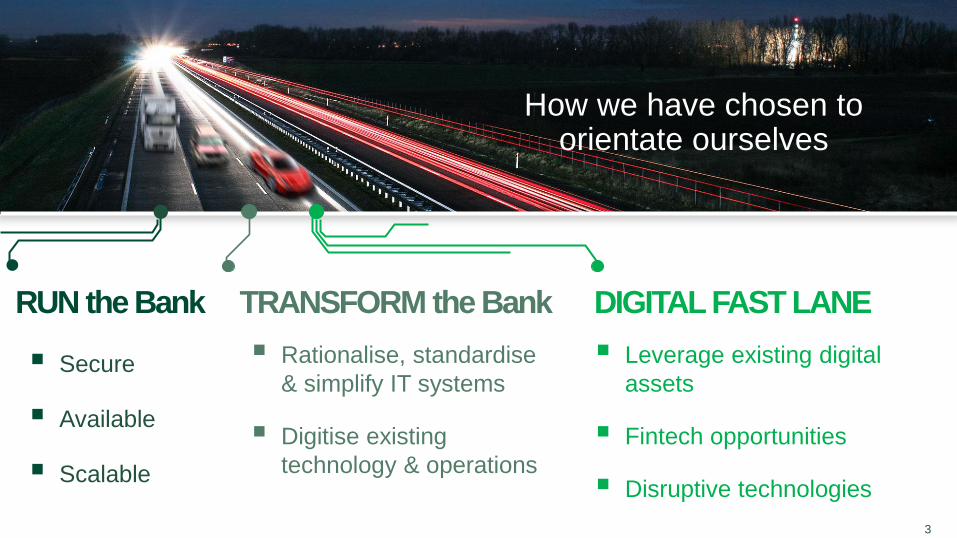
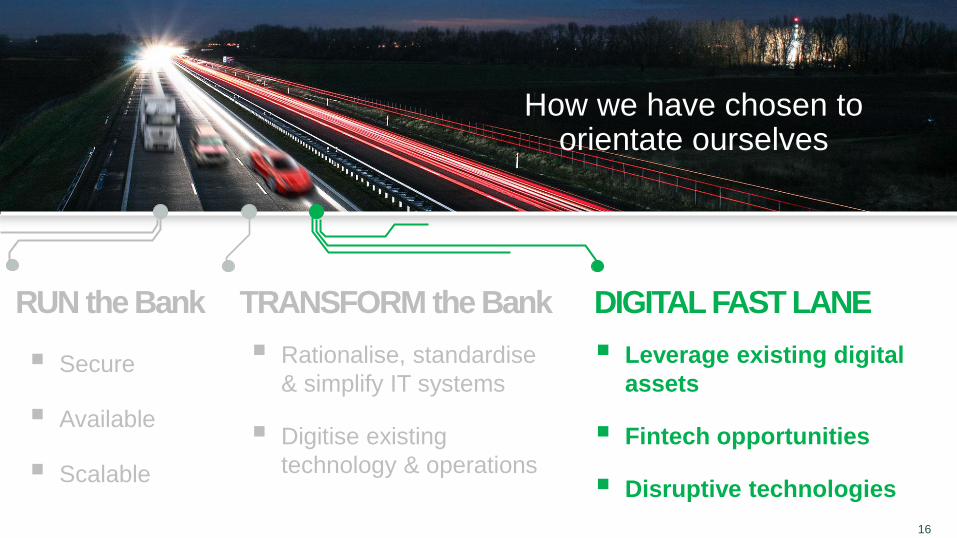
DIGITAL FAST LANE
Agenda Managed Evolution strategy Step change in business value & client experience
RUN the Bank
How we have chosen to orientate ourselves
Secure
Available
Scalable
TRANSFORM the Bank
Rationalise, standardise
& simplify IT systems
Digitise existing
technology & operations
Leverage existing digital
assets
Fintech opportunities
Disruptive technologies
4
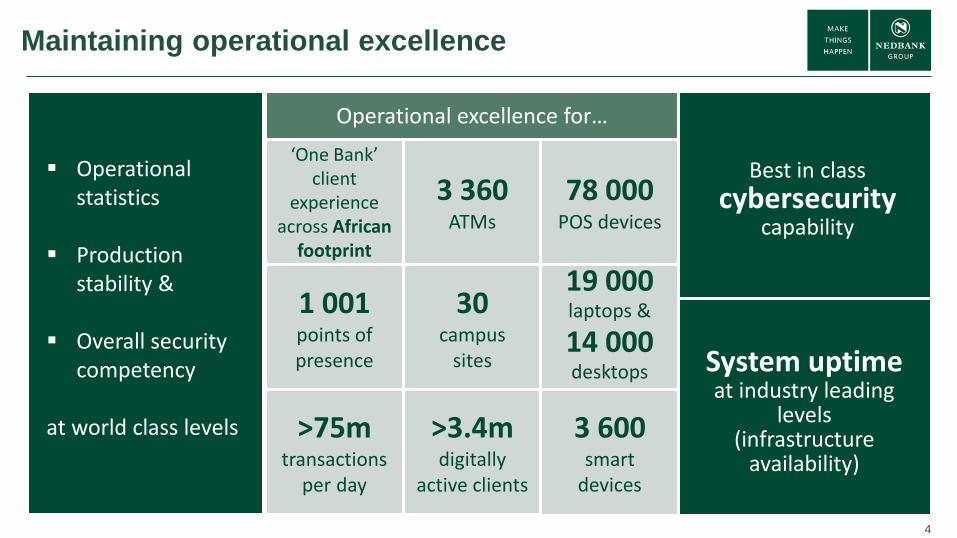
Maintaining operational excellence
Operational statistics
Production stability &
Overall security competency
at world class levels
Best in class
cybersecurity capability
Operational excellence for…
‘One Bank’ client
experience across African
footprint
3 360 ATMs
78 000 POS devices
1 001 points of presence
30 campus
sites
19 000 laptops &
14 000 desktops
>75m transactions
per day
>3.4m digitally
active clients
3 600 smart
devices
System uptime at industry leading
levels (infrastructure
availability)

5
Nedbank has highly efficient & effective IT systems
Source: Hackett IT Value Grid™
0
40
80
120
160
200
0
3000
6000
9000
12000
2011 2012 2013 2014 2015
Number of changes implemented Unplanned downtime
Independent Hackett IT assessment
Efficiency
Eff
ective
ness
Source: Hackett IT Value Grid™ | Note 1: 635m transactions processed on average per month in 2011 & 1.4bn transactions processed in June 2016
Reduction in downtime despite increased number of changes & transaction volumes
1.4bn transactions
/ month1
635m transactions
/ month1
+42%
-46%
6
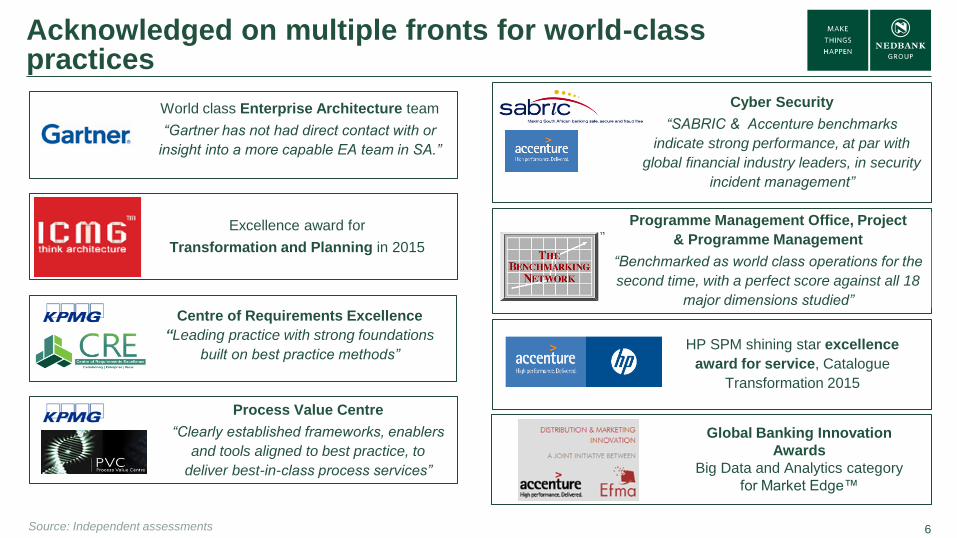
Acknowledged on multiple fronts for world-class practices
Source: Hackett IT Value Grid™
Source: Independent assessments
Centre of Requirements Excellence
“Leading practice with strong foundations
built on best practice methods”
Process Value Centre
“Clearly established frameworks, enablers
and tools aligned to best practice, to
deliver best-in-class process services”
World class Enterprise Architecture team
“Gartner has not had direct contact with or
insight into a more capable EA team in SA.”
Excellence award for
Transformation and Planning in 2015
Programme Management Office, Project
& Programme Management
“Benchmarked as world class operations for the
second time, with a perfect score against all 18
major dimensions studied”
HP SPM shining star excellence
award for service, Catalogue
Transformation 2015
Cyber Security
“SABRIC & Accenture benchmarks
indicate strong performance, at par with
global financial industry leaders, in security
incident management”
Global Banking Innovation
Awards
Big Data and Analytics category
for Market Edge™

7
DIGITAL FAST LANE
Agenda Managed Evolution strategy Step change in business value & client experience
RUN the Bank
How we have chosen to orientate ourselves
Secure
Available
Scalable
TRANSFORM the Bank
Rationalise, standardise
& simplify IT systems
Digitise existing
technology & operations
Leverage existing digital
assets
Fintech opportunities
Disruptive technologies

8
Various options to core system transformation
Business Value
I
T T
ran
sfo
rmati
on
Opportunistic (“Patching”)
Driven by business demands
“Big bang”
High risk of
business
disruption
Meets & adapts to business
needs, produces immediate
benefits Managed
Evolution
Robust & flexible
IT landscape
Legacy
systems

9
Managed Evolution – “Hollowing out the core”
Benefits of Managed Evolution
“Hollows out core systems on a prioritised approach, balancing business value delivery with
technology renewal & digitisation while providing for regulatory requirements”
Removes “spaghetti” / complexity in structured approach
Balances business needs & technology advancement
Adaptive to environmental realities
Reduces project failure risk & less disruptive to the
organisation & clients
Seamless integration of new digital offering alongside
existing solutions
Builds enterprise capabilities which improves reusability

10
Managed Evolution – good progress to date, with core banking replacement only at the end of the journey
Omnichannel
Digitisation
Single Client view
Core and Supporting Backend Systems
Core
Security and Infrastructure
Branch of the Future Digital Experience Mgnt Contact Centre
Process ) Content Service Oriented Architecture
) CRM Profile and Mandates
Client 360
Core Banking Product Lifecycle Management
Loyalty Systems
Rest of Africa Wealth
CIB
Client Onboarding & Servicing
Enterprise Data Programme
Credit Lifecycle Enterprise Strategic Payments
Supporting
Procurement Human Resources Finance BPC
Strategic Security
Agile operations to Cloud
Legend: Almost Complete In Progress Complete

11
Managed Evolution – rationalise, standardise & simplify our IT systems
# of core systems*
“250 to 60” core systems Examples of core systems replaced to date
Front Arena
7 to 1 system
Postilion Switch
8 to 1 system
SAP ERP
43 to 1
system
Wallstreet
9 to 2
systems
Flexcube
1
core banking
platform in Rest of
Africa
250
231
211 194
174
154 143
60
2010 2011 2012 2013 2014 2015 2016YTD
2020
* Reflects latest status as at October 2016, including newly classified core systems
Target

12
Managed Evolution – minimises the cost impact & reduces risk
Capitalised IT costs1 (Rbn) Nedbank project cashflow (Rbn)
5.1 5.4
3.1
23.7
Nedbank Bank A Bank B Bank C
0.7
0.9 1.0 1.0
1.2
2011 2012 2013 2014 2015
Note 1: As at 31 Dec 2015, including software & development costs, as well as computer equipment
13
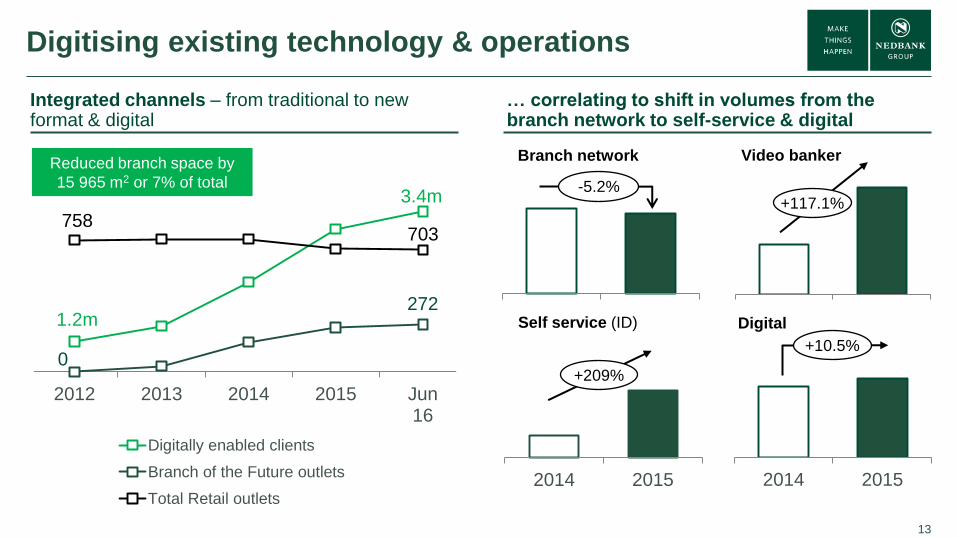
Digitising existing technology & operations
1.2m
3.4m
0
272
758 703
2012 2013 2014 2015 Jun16
Digitally enabled clients
Branch of the Future outlets
Total Retail outlets
Integrated channels – from traditional to new format & digital
… correlating to shift in volumes from the branch network to self-service & digital
Branch network
2014 2015
Self service (ID)
2014 2015
Digital
-5.2%
+209%
Video banker
+117.1%
+10.5%
Reduced branch space by
15 965 m2 or 7% of total

14
Digitising existing technology & operations
Digitisation
Elimination of duplicate processes
Straight through processing
New mobile & digital offerings
Lower cost to serve
Improved client service
Managed evolution
Reduce number of systems, licensing fees,
maintenance costs, etc.
Integrated channels
Branch of the future – targeted reduction of
branch floor space by 30 000m2 (by 2020)
58
.2
57
.8
60
.1
60
.7
50
.5
43
.9
50
.6
55
.2
56
.1
38
.4
63
.4
62
.8
Group CIB RBB Rest of Africa
Peer high Peer low Nedbank
Nedbank Group target
50 - 53%
Focus on improving RBB
& RoA’s efficiency ratios
Source: SA big 4 banks as reported at 31 December 2015
Efficiency ratios vs. peer group Cost to income ratio, %
Key drivers

15
Value creating innovation (examples)
Source: Nedbank analysis
Valu
e t
o c
lien
ts
Valu
e t
o N
ed
ban
k
Inn
ov
ati
on
Efficient - quick turnaround
time of 3 hours on average
Convenient - access
anytime & on any device
Regular status updates
R2.9bn¹ of loans registered
since inception (Sep ’12)
Equal to 11%¹ of granted
business
Attracts new clients with
good risk quality
Convenient & secure
Do not need bank account
Affordable - flat rate to send
money & no withdrawal fee
New revenue stream
Cross-sell to non-Nedbank
clients
Simplified payment
capability
Increases digital scale
Rewards automatically
available, accessible via
Amex merchants / ATMs
Attractive redemption values
(1,2% of spend)
16%¹ year-on-year increase
in membership
Enhances brand & CVP
Higher client ‘stickiness’
Additional client data
analytics
Valuable client analytics for
sales strategies
Reduces reliance on costly
data research companies
New CVP & revenue
Improved client retention
Cross-sell & conversion to
primary clients
Low implementation cost &
secure
16
DIGITAL FAST LANE
Agenda Managed Evolution strategy Step change in business value & client experience
RUN the Bank
How we have chosen to orientate ourselves
Secure
Available
Scalable
TRANSFORM the Bank
Rationalise, standardise
& simplify IT systems
Digitise existing
technology & operations
Leverage existing digital
assets
Fintech opportunities
Disruptive technologies

17
In a fast changing world we need to change faster…
Years it took to reach 100 million users
THE RULES OF
THE GAME HAVE
CHANGED,
BUSINESS MODELS
NEED TO ADAPT
ACCORDINGLY
Source: Business Insider from Boston Consulting Group

18
Leveraging existing
digital assets
(eg. AppSuite & Single client
portal)
Fintech
opportunities
(including social media
platform wallets)
Emerging technology
disruptors
(eg. Blockchain, Machine
learning, Cognitive computing,
Artificial intelligence)
Digital Fast Lane – speed to market with commercialised innovations for value delivery
Cognitive
computing
Machine
Learning

19
In conclusion
Rate of technological change & adoption is unprecedented
Run the Bank – Secure, stable & scalable systems
Transform the Bank – Managed evolution approach
− Rationalise, standardise & simplify IT systems
− Minimises cost impact & reduces risk
− Digitise existing technology & operations to improve efficiency ratio
− It’s all about creating the bank as a platform
Digital Fast Lane
− New innovation capabilities required to compete in the digital ecosystem
− Speed to market with commercialised innovations for value delivery

20
THANK YOU Q&A
Please address all questions pertaining to this presentation to:
Investor Relations: [email protected]
21
Disclaimer
Nedbank Group has acted in good faith and has made every reasonable effort to ensure the accuracy and completeness of the
information contained in this document, including all information that may be defined as 'forward-looking statements' within the
meaning of United States securities legislation.
Forward-looking statements may be identified by words such as ‘believe’, 'anticipate', 'expect', 'plan', 'estimate', 'intend', 'project',
'target', 'predict' and 'hope'.
Forward-looking statements are not statements of fact, but statements by the management of Nedbank Group based on its
current estimates, projections, expectations, beliefs and assumptions regarding the group's future performance.
No assurance can be given that forward-looking statements will prove to be correct and undue reliance should not be placed on
such statements.
The risks and uncertainties inherent in the forward-looking statements contained in this document include, but are not limited to:
changes to IFRS and the interpretations, applications and practices subject thereto as they apply to past, present and future
periods; domestic and international business and market conditions such as exchange rate and interest rate movements;
changes in the domestic and international regulatory and legislative environments; changes to domestic and international
operational, social, economic and political risks; and the effects of both current and future litigation.
Nedbank Group does not undertake to update any forward-looking statements contained in this document and does not assume
responsibility for any loss or damage whatsoever and howsoever arising as a result of the reliance by any party thereon,
including, but not limited to, loss of earnings, profits or consequential loss or damage.


