1 NedNamibia Holdings Highlights for the Year 1 Profile, Vision, Mission and Values 2 NedNamibia Holdings Group Structure 3 Branch Network 4 Board of Directors 5 Executive Committee of Nedbank Namibia 7 Chairman’s Report 11 Managing Director’s Review 15 Value Added Statement 19 Corporate Governance Report 20 Directors’ Responsibility 39 Independent Auditor’s Report 40 Statement of Actuarial Value of Assets and Liabilities of Coversure Limited 41 Report of the Directors 43 Balance Sheets 47 Income Statements 48 Statements of Changes in Equity 49 Cash Flow Statements 51 Notes to the Annual Financial Statements 52 Contact Details 145
Transcript
1
NedNamibia Holdings Highlights for the Year 1Profile, Vision, Mission and Values 2NedNamibia Holdings Group Structure 3Branch Network 4Board of Directors 5Executive Committee of Nedbank Namibia 7Chairman’s Report 11Managing Director’s Review 15Value Added Statement 19Corporate Governance Report 20Directors’ Responsibility 39Independent Auditor’s Report 40Statement of Actuarial Value of Assets and Liabilities of Coversure Limited 41Report of the Directors 43Balance Sheets 47Income Statements 48Statements of Changes in Equity 49Cash Flow Statements 51Notes to the Annual Financial Statements 52Contact Details 145
1
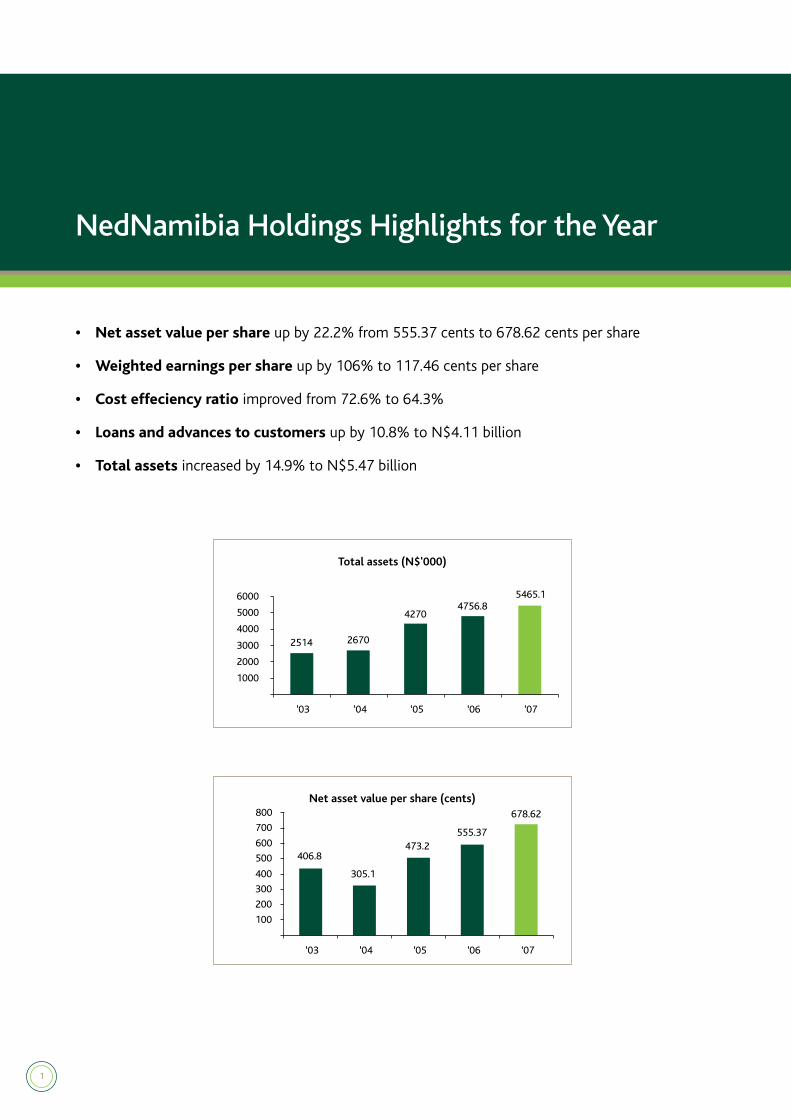
NedNamibia Holdings Highlights for the Year
• Netassetvaluepershare up by 22.2% from 555.37 cents to 678.62 cents per share
• Weightedearningspershare up by 106% to 117.46 cents per share
• Costeffeciencyratio improved from 72.6% to 64.3%
• Loansandadvancestocustomers up by 10.8% to N$4.11 billion
• Totalassets increased by 14.9% to N$5.47 billion
2
Profile, Vision, Mission and Values
PROFILE
NedNamibia Holdings Limited (“Ned-
Namibia Holdings” or “the Company”) is the
holding company for the subsidiaries (“the
Group”) offering a wide range of financial
services including commercial banking,
micro lending and wealth management with
total assets of N$5,47 billion (2006: N$4,76
billion). The principal subsidiary is Nedbank
Namibia Limited (“Nedbank Namibia” or
“the Bank”).
Nedbank Namibia is a registered Namibian
bank, with its head office based in Windhoek.
Well capitalised by international standards,
the Bank has assets of N$5,07 billion (2006:
N$4,24 billion).
Nedbank Namibia provides a comprehensive
range of domestic and global services to
individual, corporate and international clients
through a growing branch network. The
combination of an intensive understanding
of the Namibian market and the strong
support of its shareholder makes it a
uniquely competitive force in its market.
VISION
We are committed to be our nation’s
number one choice in banking.
MISSION
• Provide our existing and potential clients
with innovative banking solutions that
meet their needs.
• Create an environment conductive
to the development and growth of all
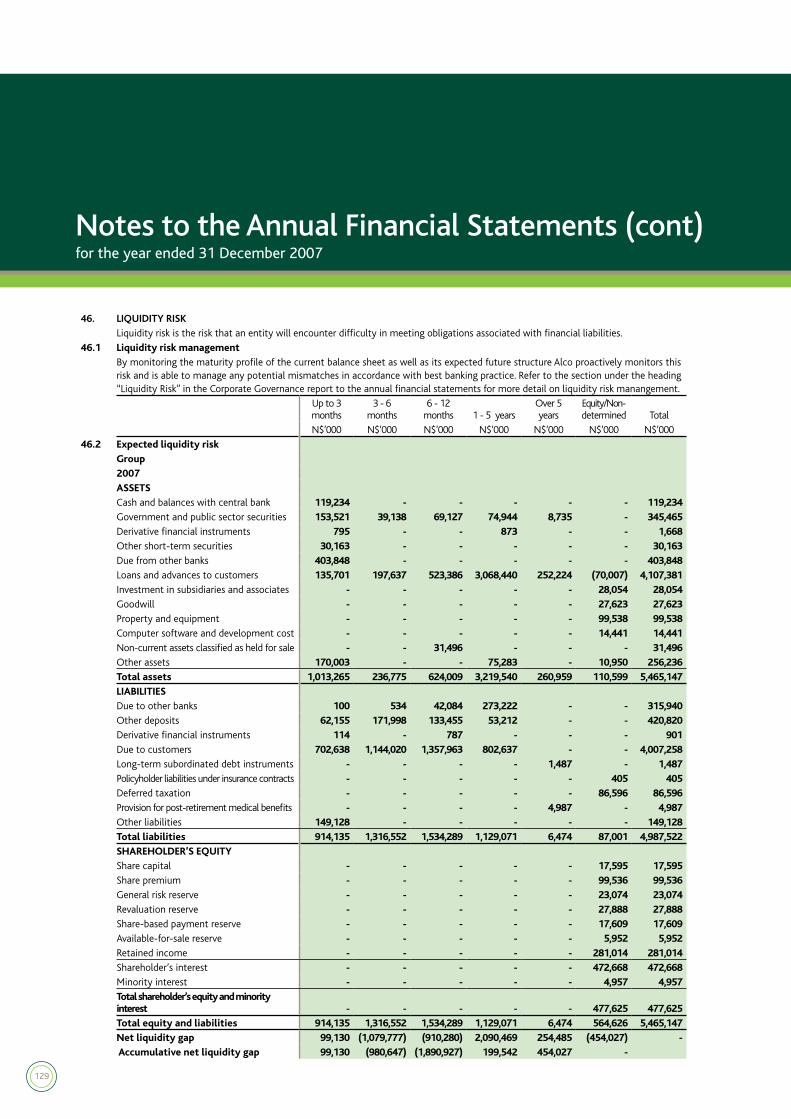
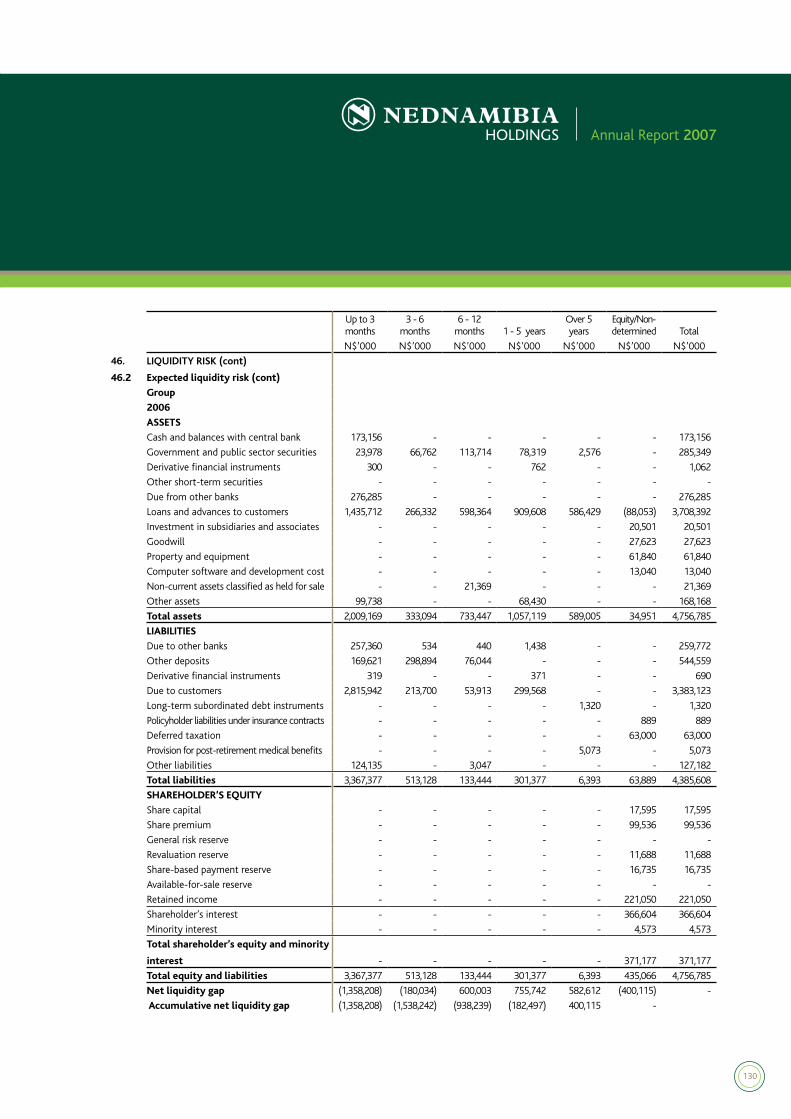
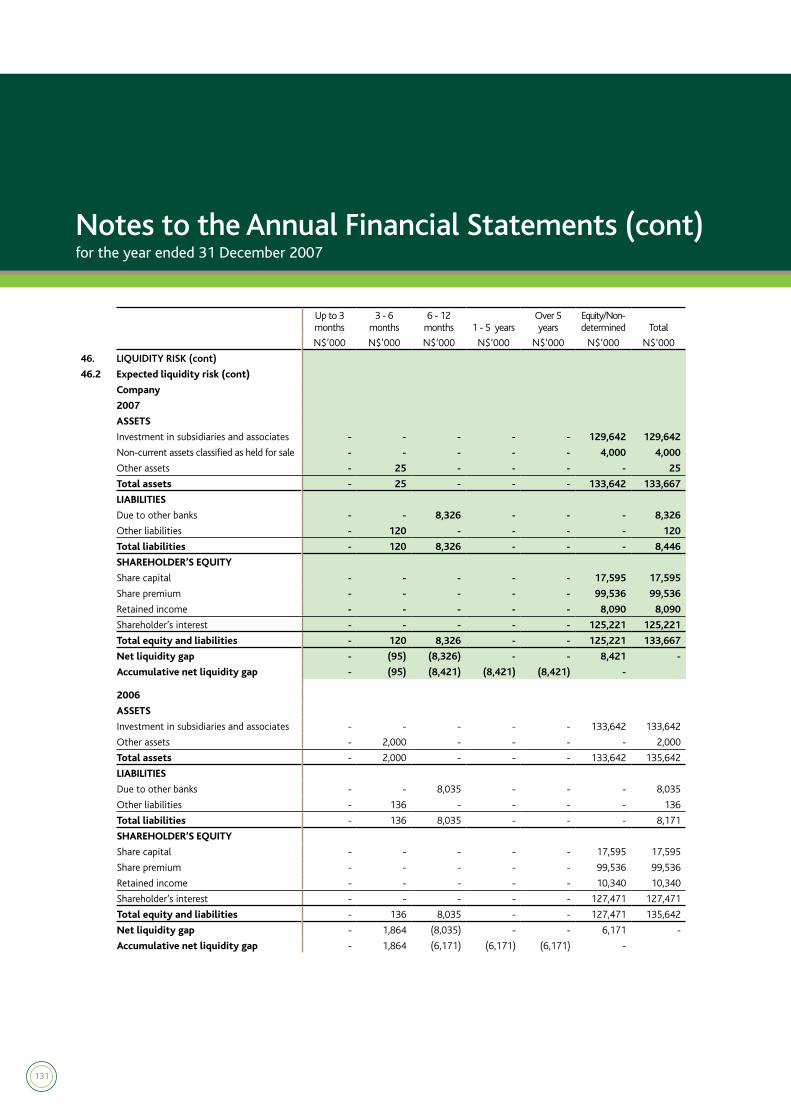
employees that will create value for all
our stakeholders.
• Sustainably grow our business through
the expertise and commitment of our
people and shareholders.
• Commit ourselves to diversity - our
strength is in our people.
VALUES
Accountability - To be prepared to make
commitments and be judged against
our commitments, to deliver on those
commitments and to be responsible for our
actions.
Integrity - To be honest, trustworthy,
truthful, consistent and open in all of our
conduct and decisions.
Pushingbeyondboundaries - To recognise
our obligation to the entire organisation - to
push beyond the limits of what is best for us
individually, or as a Group or unit and strive
to break new ground, fuelled by our passion
and commitment.
Respect - To recognise the inherent worth
of every human being and to treat all people
accordingly.
People-centred - We invest in our people and
create empowering environments through
development, support, mentoring, coaching,
valuing diversity, recognition and reward.
3
NedNamibia Holdings Group Structureas at 31 December 2007
Nedbank Group Limited
NedNamibia Holdings Limited
100%
NIB Mining Finance(Proprietary) Limited
Special purpose vehicle for a project
finance transaction
Manco Management Company(Proprietary) Limited*
*Dormant Company
100%100%100%
African Mining Company Limited*Mining private equity fund
THEOJFRANK-ChairmanIndependentnon-executivedirector*BA Law, LLB, Dip in Bus Man, Cert Tax Law
Senior counsel and former judge of the High Court
of Namibia and chairs companies in the fishing and
short-term insurance industry. He is the chairperson of
both NedNamibia Holdings and Nedbank Namibia.
WILLIAMETURTON-ManagingDirector(outgoing)Exec Dev Prog (Stellenbosch Business School), Sen Man Dev Prog (Wits Business School), BTech (Bus Admin) (Cape Technikon), MTech (Bus Admin) (Cape Technikon), Certificated associate and elected fellow of Institute of Bankers SA.
A seasoned banker who has held various positions in Nedbank Group Limited over the past 28 years. William was regional manager of Nedbank Group’s business banking division for five years and subsequently became the managing director of both NedNamibia Holdings and Nedbank Namibia for a period of 18 months. He resigned as managing director of both companies with effect from 31 December 2007.
ERASTUSTHOVEKA-ManagingDirector(incoming)CPA (Illinois, USA); MBA (Bradley University, Peoria, Illinois USA); B.S.(Acc) (Bradley University, Peoria, Illinois, USA)
Has held the position of Chief Financial Officer of the
Development Bank of Namibia prior to his appointment
as Deputy Managing Director of Nedbank Namibia on
1 April 2007 and subsequently as Managing Director
of NedNamibia Holdings and Nedbank Namibia, both
with effect from 1 January 2008.
DENYSDENYANon-executivedirectorBAcc (Hons), MBA (University of Zimbabwe), ACIS, CA (Z)
Has a thorough knowledge of the merchant banking
and finance sectors in Africa, developed over a 12
year career, which includes his previous appointment
as managing director of MBCA Bank Limited. Denys
is presently the managing director of Nedbank Africa,
member of the board of the Namibian Stock Exchange.
Johannes has extensive experience in the financial
services industry. In addition to his current position,
he is also managing director of Old Mutual’s African
operations.
SEBULONIKANKONDIIndependentnon-executivedirector*BTech (Unisa); Sen Man Prog (USB); Exec Dev Prog (USB); Market Man Prog (UCT); Nat. Dip in Mech Eng (Peninsula Technikon)
Managing director of Namport. Sebulon has vast
expertise in logistics and freight management.
6
HEINZMWEILERTIndependentnon-executivedirector*BCom; BCom (Hons); CA (SA); MCom; FII (SA)
Currently Chief Operating Officer of Development
Bank of Southern Africa. Previously Divisional Director:
Strategy for Nedbank Corporate. He has particular
experience in business development and customer
value management.
MARKRWESTONNon-executivedirectorBCA, CA (New Zealand), AMP (Harvard)
Has extensive experience in investment banking and
strategic planning as well as governance and regulatory
Over 30 years’ experience in the banking industry and
a former managing director of Nedbank Investment
Bank Limited.
ROLFHPETERSIndependentnon-executivedirector*BCom, BCompt (Hons), CA (SA), CA (Namibia)
Managing partner of Grant Thornton Neuhaus, with
over 30 years experience in the auditing profession
across all sectors of the Namibian economy. Rolf is
also advisor to several foreign investors. He is a past
president of the Public Accountants and Auditors Board
of Namibia.
MARTINKSHIPANGAIndependentnon-executivedirector*BCom (Wits); MSc Public Policy and Administration (ISS); Leadership and Management (University of Virginia); Exec Dev Prog (Harvard)
Executive Chairman of Smartswitch Namibia
(Proprietary) Limited and Vice President of Net 1
Inc. Martin has over 11 years executive management
experience in both the public and private sectors.
7
WILLIAMETURTON-ManagingDirector
(Until31December2007)
A seasoned banking professional. William was appointed
managing director in July 2006 to head the team managing the
Bank. In a career spanning 28 years with the Nedbank group,
William has held a number of challenging positions. William
has both a BTech and MTech in business administration, and
has completed a number of executive development courses
with the universities of Witwatersrand and Stellenbosch. He is
also a fellow of the Institute of Bankers in South Africa.
the Sales team to optimise financing solutions for clients.
9
Executive Committee of Nedbank Namibia (cont)
ELINAHAIPINGE-Executive:HumanResources
Elina is spearheading the initiative to entrench global best practice in the performance management and talent development within the Bank. She has a masters degree in corporate strategy and economic policy from the School of Maastricht, Netherlands.
JOHANNESCJURGENS-ChiefFinancialOfficer
Johannes has 20 years banking experience, mostly in the
finance division. Johannes holds a BCompt (Unisa) degree
and has been a member of the Bank’s senior management
team since 1991.
10
RECTORMUTELO-Executive:MarketingandCommunications
Rector holds a masters degree in management from Emerson College, Boston, USA. In a lengthy career with the Namibian Broadcasting Corporation, Rector was general manager for corporate marketing, communication and business development. He is spearheading an active marketing campaign in the Bank, in tandem with an expanding branch network and broadening customer base. Rector has been seconded to South Africa for a period of 12 months training on a skills exchange basis with Nedbank South Africa.
Phil has a Bachelor of Arts degree, which he obtained at Rhodes University, Grahamstown, South Africa and has attended a wide variety of post-graduate management development programmes. He has 20 years experience in banking (about 12 with Nedbank) in various roles. His extensive experience in the marketing environment, particularly in the retail, banking and research fields, has made him a valuable member of the executive team and he hasbeen instrumental in re-establishing pride in the Nedbank brand in Namibia.
ANDREJVENTER-ChiefRiskOfficer
Responsible for credit risk, internal audit, operational risk and legal services and compliance. Over the past 15 years Andre has developed broad expertise in finance and risk management, particularly in business banking and micro lending. He has a BCom - managerial accounting degree and has completed various management and leadership courses in recent years.
MARKVIVIER-Executive:Retail
Mark has 23 years experience in the banking industry, mainly in the retail environment. His banking career has afforded him the opportunity to work in the United Kingdom, Belgium and France on various projects and assignments. Mark’s responsibilities for retail banking operations include the branch network, micro lending, SMEs, external sales and branch conformance. He holds an MBA degree (cum laude) from the University of Stellenbosch, an Honours in Financial Management (University of Cape Town), an Honours in Business Administration (University of Stellenbosch) and a BCom (Unisa). He has also completed a number of Development and Leadership courses with Nedbank.
11
FOREWORD
In spite of competition in the market,
Nedbank Namibia Limited has not only
held its ground but managed to advance its
branch network.
As part of efforts to rapidly expand our
branch network throughout the country, we
opened new branches at Eenhana, Katima
Mulilo, Grootfontein and Outapi as well
as setting up a much-needed automatic
teller machine (“ATM”) facility at Okongo. A
significant increase of our ATMs and point-
of-sale (“POS”) devices is in the offing for
the next few years, which will enhance
banking convenience for our clients. By
2010, we expect to have 58 ATMs (up from
33 currently) and 320 POS devices, of which
we had 288 at the end of 2007, located
country-wide. Perhaps more importantly,
some 120 relationship managers will be
employed by 2010, which represents an
increase of over 50%, underpinning the
emphasis that we place on efficient and
quality customer service.
The Bank was successful in securing the
NamPost tender, which could facilitate a joint
venture offering Nedbank’s lending products
to the NamPost client base via the entity’s
120 network. Our appointment as NamPost’s
preferred banking partner followed a stringent
selection process in which six banks vied for
this sought-after banking initiative. We trust
that this relationship will prosper as there
are many benefits the venture can bring to
the “un-banked” people in Namibia.
During the year under review Nedbank
Group Limited became the sole share-
holder of NedNamibia Holdings Limited.
This followed an implementation of a
Scheme of Arrangement whereby minority
shareholders exchanged or relinquished
their NedNamibia Holdings shares for
either Nedbank Group Limited shares or
cash. Nedbank Group Limited subsequently
acquired all shares previously held by
Nedbank Limited (90.50%) and by NIB
Holdings (Namibia) (Proprietary) Limited
(3.39%).
Nedbank Namibia also prides itself on a
commitment to maintaining the Bank’s
status as a good corporate citizen. We fully
appreciate our obligation towards those
communities that have welcomed Nedbank
Namibia so warmly into their fold. Our
Social Report is submitted with this annual
report, reflecting our humble contributions
towards sustainable development initiatives
around the country.
GLOBAL TRENDS
The global economic climate started changing
in late 2007 after a positive start to the year.
Although developing countries continued to
be assisted by a Chinese-led commodities
boom, the world’s largest economy, the
United States (“US”), is showing signs of
vulnerability. A full-blown banking crisis
developed in the wake of a flagging US
housing market and the onset of the sub-
prime mortgage market crisis, forcing major
central banks to pump massive amounts of
liquidity into money markets to support the
banking system. The size and spread of the
difficulties has reduced the availability of
credit and damaged confidence, ironically
among the very consumers who had earlier
been the mainstay of the boom. Although
initial expectations were that the US would
bear the brunt of the crisis, it soon became
clear that other major economies will also
be affected.
Markets generally gained significantly in
2007, but started to reflect the uncertainty
as the year drew to a close. On equity
markets, emerging markets again shone, with
massive additional gains being extended
largely on the back of strong commodity
prices and the Asian boom.
Chairman’s ReportTheo Frank
12
The so-called “decoupling” theory helped
sustain much of the optimism as funds
switched into markets that would supposedly
not be affected by a possible US downturn.
However, the momentum started to fade
over the last quarter, although not to the
same extent as in developed markets where
sub-prime woes hit sentiment earlier.
Commodity prices generally held their
levels or improved further. Energy markets
were driven by supply-side fears, with coal
being helped by soaring oil prices. Precious
metals were boosted by financial market
uncertainty and the reflationary policies
followed by central banks. Food prices gained
the most after lagging other commodities
considerably in the early phases of the
bull market. Adverse weather conditions
affected several grain crops, but the new
focus on biofuels as a solution to energy
needs provided the catalyst for the strong
price rises. In contrast, certain base metals
began either to stabilise or ease after several
years of very strong performance.
Global prospects for 2008 are uncertain. The
US economy will continue to be battered
by weak construction and housing activity,
while lower house prices and reduced
confidence levels will moderate consumer
spending. The authorities have responded
by cutting interest rates significantly and
by introducing stimulatory fiscal measures.
However, much will depend on how quickly
financial sector conditions start to normalise
and credit conditions to ease. In the United
Kingdom, there has also been monetary
easing in response to recent weaker data.
Europe has been slow to respond to signs
of slowdown and the conventional wisdom
is that it will weaken as the US emerges
from its downturn late in 2008. Emerging
markets are expected to do better than
developed countries, helped by growing
internal momentum and strong Chinese
demand for commodities. However, China
itself is dependent on the US and Europe for
its export demand and is likely to slow after
several years of massive expansion.
LOCAL DEVELOPMENTS
The Namibian economy showed estimated
growth of just under 4% in 2007 following
growth of 4,1% in 2006. A key reason for
the slight drop in growth was the poor
performance of the mining sector, where
diamond production contracted off the high
base established in 2006. Other metals,
including gold, silver and copper, recorded
only a modest improvement in production.
Other areas of primary production faired
little better. The agricultural sector continued
to struggle, despite the fact that poor
grazing conditions meant that more cattle
were brought to market. Fishing conditions
remained depressed as low fish stocks
ensured that quotas remained in place.
Secondary activity was mixed. The
manufacturing sector was held back by
reduced fishing and farming output. The
tertiary sector was adversely affected by
higher interest rates and rising prices, which
constrained consumer demand, putting a
damper on the performance of wholesale
and retail sales as well as other services.
Namibia’s interest rate policy remains largely
tied to events in South Africa due to its
membership of the Common Monetary Area.
After mirroring the South African Reserve
Bank’s tightening for most of 2007, the
Bank of Namibia left rates unchanged
in December. The Namibian dollar has
benefited from persistent dollar weakness
over the past year. More recently, however,
heightened risk aversion and more modest
growth prospects in South Africa have left
the local currency weaker against most
major currencies.
13
Chairman’s Report (cont)
LOCAL DEVELOPMENTS (cont)
The current account remained in surplus.
Export earnings benefited from high
commodity prices, while weaker domestic
demand contained imports.
OUTLOOK
The economy is expected to grow by 4.5%
during 2008 as mining production expands
more rapidly, driven by higher uranium
output. Manufacturing output will benefit
from additional copper smelting capacity
and the increased production of locally cut
and polished diamonds. An above average
rainy season will boost activity in the
agricultural sector. The construction sector
will benefit from the development of the
new Kudu gas fields. Unfortunately, fishing
will remain depressed, given that quotas
are likely to remain unchanged. Tighter
monetary conditions will continue to cool
consumer and business spending, with
interest rates likely to peak in 2008.
The Namibian economy remains vulnerable
to adverse weather conditions, swings in
commodity prices and developments in
South Africa and the global economy. This
emphasises the importance of further
diversifying the Namibian economy.
APPRECIATION
On behalf of the entire board of directors,
we wish to express our gratitude to
William Turton for his contribution to the
performance of Nedbank Namibia during
his tenure as managing director.
Furthermore, Erastus Hoveka’s appointment
as deputy managing director in April 2007
and subsequently as managing director
with effect from 1 January 2008, has given
new impetus to grow our presence in the
Namibian banking environment.
In conclusion, I wish to extend my
appreciation to my fellow members of
the board of directors for their insights
and collective wisdom, as well as to the
management and staff for their hard work
and dedication. Your support throughout the
year has aptly demonstrated your willingness
to “Make Things Happen”.
Theo Frank
Chairman
14
15
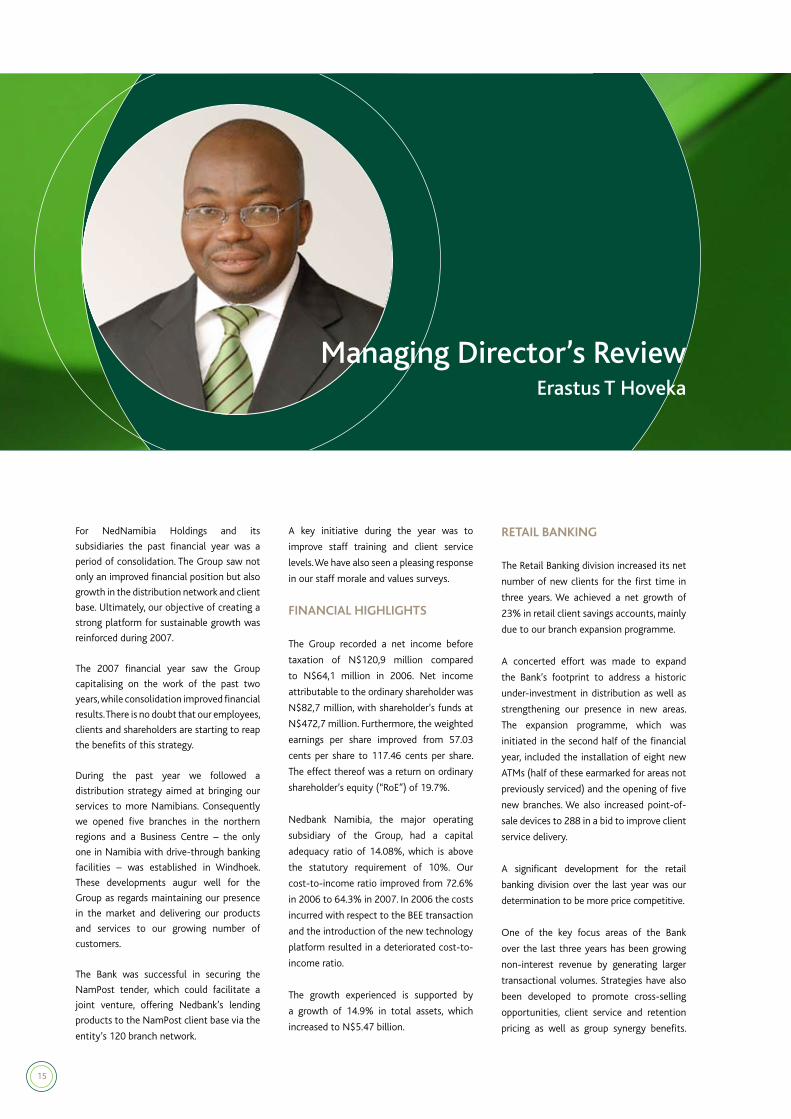
Managing Director’s ReviewErastus T Hoveka
For NedNamibia Holdings and its
subsidiaries the past financial year was a
period of consolidation. The Group saw not
only an improved financial position but also
growth in the distribution network and client
base. Ultimately, our objective of creating a
strong platform for sustainable growth was
reinforced during 2007.
The 2007 financial year saw the Group
capitalising on the work of the past two
years, while consolidation improved financial
results. There is no doubt that our employees,
clients and shareholders are starting to reap
the benefits of this strategy.
During the past year we followed a
distribution strategy aimed at bringing our
services to more Namibians. Consequently
we opened five branches in the northern
regions and a Business Centre – the only
one in Namibia with drive-through banking
facilities – was established in Windhoek.
These developments augur well for the
Group as regards maintaining our presence
in the market and delivering our products
and services to our growing number of
customers.
The Bank was successful in securing the
NamPost tender, which could facilitate a
joint venture, offering Nedbank’s lending
products to the NamPost client base via the
entity’s 120 branch network.
A key initiative during the year was to
improve staff training and client service
levels. We have also seen a pleasing response
in our staff morale and values surveys.
FINANCIAL HIGHLIGHTS
The Group recorded a net income before
taxation of N$120,9 million compared
to N$64,1 million in 2006. Net income
attributable to the ordinary shareholder was
N$82,7 million, with shareholder’s funds at
N$472,7 million. Furthermore, the weighted
earnings per share improved from 57.03
cents per share to 117.46 cents per share.
The effect thereof was a return on ordinary
shareholder’s equity (“RoE”) of 19.7%.
Nedbank Namibia, the major operating
subsidiary of the Group, had a capital
adequacy ratio of 14.08%, which is above
the statutory requirement of 10%. Our
cost-to-income ratio improved from 72.6%
in 2006 to 64.3% in 2007. In 2006 the costs
incurred with respect to the BEE transaction
and the introduction of the new technology
platform resulted in a deteriorated cost-to-
income ratio.
The growth experienced is supported by
a growth of 14.9% in total assets, which
increased to N$5.47 billion.
RETAIL BANKING
The Retail Banking division increased its net
number of new clients for the first time in
three years. We achieved a net growth of
23% in retail client savings accounts, mainly
due to our branch expansion programme.
A concerted effort was made to expand
the Bank’s footprint to address a historic
under-investment in distribution as well as
strengthening our presence in new areas.
The expansion programme, which was
initiated in the second half of the financial
year, included the installation of eight new
ATMs (half of these earmarked for areas not
previously serviced) and the opening of five
new branches. We also increased point-of-
sale devices to 288 in a bid to improve client
service delivery.
A significant development for the retail
banking division over the last year was our
determination to be more price competitive.
One of the key focus areas of the Bank
over the last three years has been growing
non-interest revenue by generating larger
transactional volumes. Strategies have also
been developed to promote cross-selling
opportunities, client service and retention
pricing as well as group synergy benefits.
16
The specialised transactional banking teams
and fundamental philosophy of ‘personal
relationship’ bankers also contributed to the
growth in retail business.
CORPORATE AND BUSINESS BANKING
This division, which is segmented into
corporate and business banking teams,
focuses on large and mid-sized companies.
The opening of the Business Centre
and appointment of experienced staff
in Corporate banking were two of the
highlights for the year. Corporate banking
also gained a number of new clients, most
notably new business from the Public Sector.
The establishment of a close alliance with
NedCapital Namibia (Proprietary) Limited,
our investment bank, has seen a number of
joint initiatives.
The outlook for 2008 is positive for
Corporate and Business banking with the
division poised to benefit from Nedbank
Namibia’s competitive edge in this area.
TREASURY AND INTERNATIONAL
This division experienced a particularly
buoyant second half, and remains well
positioned for the 2008 financial year.
One of the major achievements was
improving unit performance, including
the foreign exchange desk and the control
environment. The division also saw greater
client interaction in a bid to improve service
delivery and drive business volumes.
RISK MANAGEMENT
Improved and diligent credit risk monitoring
curbed arrears and excesses, resulting
in a marked improvement in the Bank’s
non-performing loans (NPL) as well as
strengthened risk controls.
The division also attracted experienced and
competent staff after a restructuring of the
Risk Management division.
In anticipation of increased volumes in the
2008 financial year, we have automated
credit scoring in the retail environment
and implemented a new collections
management system.
As a subsidiary of Nedbank Group Limited,
incorporated in South Africa, we comply
with reporting in terms of Basel II to the
South African Reserve Bank. We have joined
the local task team established by the Bank
of Namibia to prepare for Basel II by July
2009. Staff have received training in the
areas of good corporate governance, anti-
money laundering as well as enterprise risk
and security.
SHARED SERVICES
The core objective of establishing a Shared
Services division was to consolidate all business
support units, which created a complete
partner support network to the Nedbank
Namibia business units. The division includes
Centralised Operations, Internal Support,
Security Information, Electronic Banking and
a newly established Project Office.
A significant achievement was the impor-
tant contribution to the development and
enhancement of our customer footprint
with the opening of the Business Centre,
new branches and ATMs.
MARKETING AND COMMUNICATIONS
In the past financial year we invested in
changing perceptions and re-positioning the
Nedbank Namibia brand as an accessible
and aspirational bank for all Namibians.
In 2008 the Marketing and Communication
division will continue to contribute to our
brand building goal to become the “bank of
choice for all Namibians”.
17
Managing Director’s Review (cont)
MARKETING AND COMMUNICATIONS (cont)
The brand building campaigns focused on
making Nedbank Namibia more relevant and
approachable, reflecting us as a group that
really understands its clients’ financial needs
and cares about the communities it serves.
We intensified our national advertising
campaigns around our brand expression,
‘Make Things Happen’.
Repositioning the brand extends beyond
just a marketing effort. It is part of a
broader strategy that includes pricing,
distribution and product innovation. The
campaign included internal and external
communications and public relations events.
Our presence at public and selected regional
events, shows, business representations and
social investment and sponsorship events
was maintained.
Nedbank Namibia also successfully partici-
pated in the inaugural annual Banking Week.
HUMAN RESOURCES
Efforts in the Human Resources department
focused on streamlining processes and
systems as well as enhancing appropriate
training for all employees.
A review and implementation of a revised
job grading system was also completed.
NEDLOANS (MICRO LENDING)
This micro lending initiative, in which
Nedbank Namibia is a major shareholder,
is one of the largest formally regulated
providers of micro-loans in Namibia. The
business progressed steadily during the
2007 financial year.
CHALLENGES
The past financial year, even though it
was challenging, saw Nedbank Namibia
achieving its objectives through the
dedication and commitment of all its
employees. This is clearly evident in the
enhancement of our client service and
relationships as well as the improvement in
our financial results.
Naturally, further increases in the interest
rate environment will mean increased
vigilance with regard to ongoing and
appropriate risk management controls and
the monitoring process.
Your bank – through the increased capital
investment and broader branch distribution
network - is well positioned to take
advantage of business opportunities and
challenges in 2008.
Before concluding, special thanks must
be made to all our BEE partners for their
continuous support and commitment to
the development and achievement of our
ongoing business goals. Our appreciation
and gratitude is also extended to every one
of our employees for their hard work and to
clients for their loyalty and support.
Finally, I wish to acknowledge the support
and guidance of the board of directors
throughout the year.
ErastusTHoveka
Managing Director
18
19
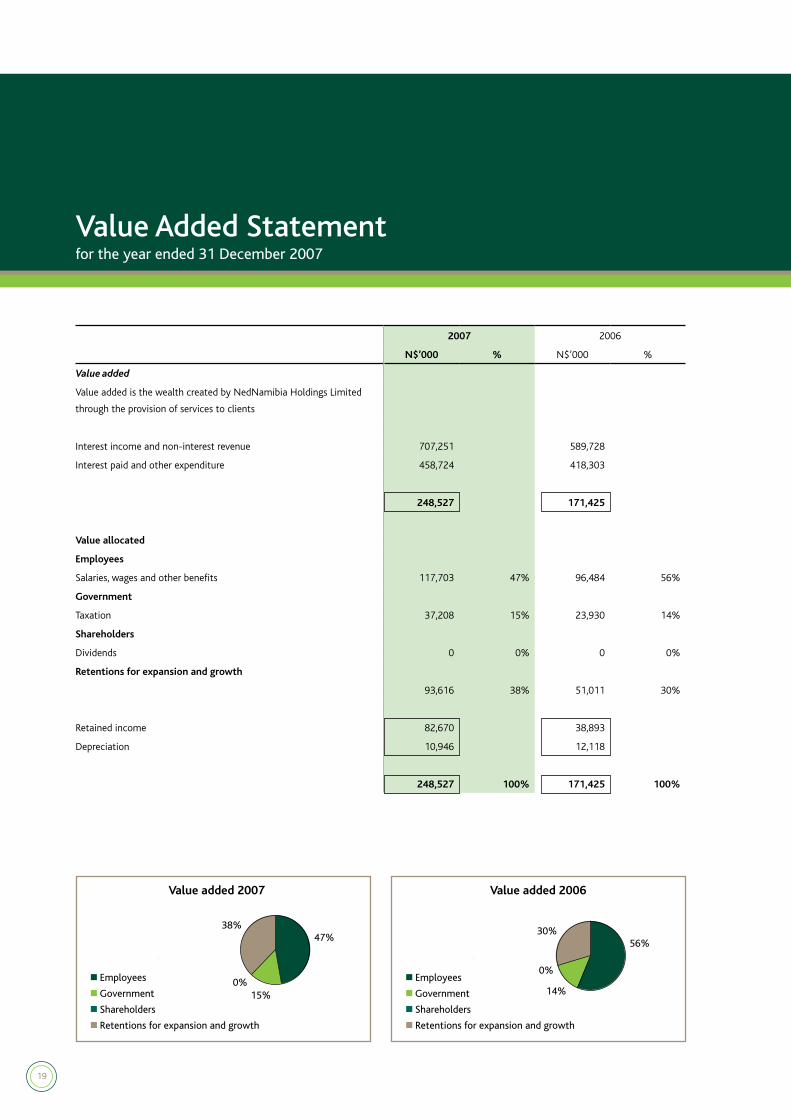
Value Added Statementfor the year ended 31 December 2007
2007 2006
N$’000 % N$’000 %
Value added
Value added is the wealth created by NedNamibia Holdings Limited
through the provision of services to clients
Interest income and non-interest revenue 707,251 589,728
Interest paid and other expenditure 458,724 418,303
248,527 171,425
Value allocated
Employees
Salaries, wages and other benefits 117,703 47% 96,484 56%
Government
Taxation 37,208 15% 23,930 14%
Shareholders
Dividends 0 0% 0 0%
Retentions for expansion and growth
93,616 38% 51,011 30%
Retained income 82,670 38,893
Depreciation 10,946 12,118
248,527 100% 171,425 100%
20
Corporate Governance Report
This governance and compliance report
covers mainly the governance and compliance
structures/functions of Nedbank Namibia,
being the main operational entity within the
NedNamibia Holdings Group.
The NedNamibia Holdings Group, as part of
the Nedbank Limited Group, has adopted an
enterprise governance framework that covers
both the corporate governance and business
governance aspects of an organisation. It
encompasses governance structures that
are strategically linked with performance
management, enabling companies to focus
on the key areas that drive their business.
Enterprise governance and compliance
constitute part of the entire accountability
framework of the organisation and require
a balance between accountability and
assurance (conformance) and value creation
and resource utilisation (performance).
Conformance includes corporate governance
and covers issues such as board structures
and roles. Performance includes business
governance and focuses on strategy and
value creation.
CORPORATE GOVERNANCE AND RISK MONITORING
Corporate governance can be defined as the
system in terms of which corporations are
directed and controlled. Good corporate
governance seeks to protect shareholders’
interests by balancing entrepreneurial
leadership with transparency and control
mechanisms, without compromising value
creation and efficient decision-making.
The board of directors continues to
advocate an integrated approach to
corporate governance and recognises that
good governance practices form an integral
part of developing and sustaining any
successful business.
FINANCIAL STATEMENTS
The directors are responsible for the annual
financial statements, which are prepared
in accordance with and comply with
International Financial Reporting Standards
(“IFRS”) adopted by the International
Accounting Standards Board (“IASB”),
and interpretations issued by the Inter-
national Financial Reporting Interpretations
Committee (“IFRIC”) of the IASB and the
Namibian Companies Act. The accounting
policies used are consistently applied,
appropriate and supported by reasonable
and prudent judgements and estimates. The
directors are responsible for ensuring that
the financial statements fairly present the
state of affairs of the Group at the financial
year-end and the results of its operations for
the year under review. The external auditors
are responsible for independently reviewing
and reporting on the fair presentation of
these financial statements.
BOARD OF DIRECTORS
The NedNamibia Holdings board comprises
one executive and eight non-executive
directors, five of whom are, in terms of the
Banking Institutions Act, independent non-
executive directors. The board’s diversity
and demographic mix comprises four white
and five black directors.
The Nedbank Namibia board comprises
one executive and eleven non-executive
directors, seven of whom are, in terms of
the Banking Institutions Act, independent
non-executive directors. The Nedbank
Namibia board’s diversity and demographic
mix comprises seven black directors, two of
whom are women, and five white directors.
Both boards are chaired by an independent
non-executive director. There is a clear
distinction between the roles of the
chairman of the board and the managing
director, who is in charge of day-to-day
operations and executive management.
Both boards meet quarterly, but additional
meetings may be held, when necessary.
The profiles of the members of the
NedNamibia Holdings board can be found
on pages 5 and 6 of this annual report.
The board has its own charter. The primary
objective of the board charter is to ensure that:
• all board members are aware of their
duties and responsibilities as members
of the board;
• applicable legislation and regulations
affecting directors’ conduct are clearly
understood; and
• sound principles of corporate governance
and ethical behaviour are applied in all
dealings on behalf of the Group.
The board is responsible to shareholders for
setting the direction of the Group through
the establishment of objectives, strategies
and key policies.
21
Corporate Governance Report (cont)
BOARD OF DIRECTORS (cont)
It monitors the implementation of its
strategies and policies through a structured
reporting approach, approves the annual
budget, accepts accountability and
recognises its responsibility for relationships
with various stakeholders. It ensures that
an effective enterprise-wide-risk framework
is established in the Group to properly
manage, control and mitigate risks.
The directors have a fiduciary duty to act
in good faith, with due diligence and care
and in the best interest of the Group and its
stakeholders.
BOARD APPOINTMENT
Board appointments are conducted in a
formal and transparent manner by the
board as a whole, assisted by the Directors’
Affairs committee.
In appointing directors, emphasis is placed on
retaining the balance of skills, knowledge and
experience necessary for achieving strategic
objectives. The non-executive directors are
actively involved in board deliberations and
discussions and bring independent judgement
to the board.
In general, directors are given no fixed
term of appointment. With the exception
of the managing director, who is subject
to short-term notice periods, all directors
retire by rotation and, if eligible for re-
election, submit their names for election at
the annual general meeting. The retirement
age for the managing director is 65, while a
non-executive director is required to retire
at age 70.
BOARD EFFECTIVENESS
A full assessment of the effectiveness of the
board and board committees has taken place
during 2007 to ensure constant refinement
of the Group’s governance structures and
the board’s responsibilities. Shortcomings
identified during the evaluation process
have been duly addressed by the board.
COMPANY SECRETARY
The board appoints the company secretary
who provides support and guidance to the
board in matters relating to governance
and statutory practices across the Group.
The company secretary assists the board
as a whole and directors individually with
detailed guidance on how to discharge
their responsibilities in the best interest
of the Group. All directors have access to
the advice and services of the company
secretary.
The company secretary plays a vital role in
the assessment process of the board and
board committees as well as board training.
In 2007 the directors’ training revolved
around Basel II and the Nedbank Limited
Group remuneration philosophy.
ATTENDANCE AT BOARD AND BOARD COMMITTEE MEETINGS FOR THE FINANCIAL YEAR ENDED 31 DECEMBER 2007
*Attended board committee meeting by invitation.
(1) Resigned 31/12/2007 (2) Resigned 3/10/2007
NEDNAMIBIA HOLDINGS LIMITEDBOARD OF DIRECTORS BOARD AUDIT COMMITTEE
Meetings held: 5 4
Attendance:
Frank T J 5 (Chairman)
Denya D 3 2
!Gawaxab J 0 1
Kankondi S I 3
Pearce C J 5 4
Peters R H 5 4 (Chairman)
Shipanga M K 2
*Turton W E (Managing Director)(1) 5 4
Weilert H M 3 1
Weston M R (2) 2
22
DIRECTORS’ INTEREST IN NEDNAMIBIA HOLDINGS AT 31 DECEMBER 2007
The successful implementation of the Scheme of Arrangement between
Nedbank Group Limited and the minority shareholders, resulted in Nedbank
Group Limited’s acquisition of the minority shareholders’ 6.11% shareholding in
NedNamibia Holdings and consequently the directors having no interest in the
share capital of NedNamibia Holdings.
DIRECTORS’ FEES
Directors’ and board committee fees are paid quarterly to local non-executive directors
only and the quarterly amounts payable are rounded up to the nearest N$500.
NedNamibia Holdings LimitedThe following directors’ fees were paid for the 2007 financial year:
Chairman N$22 500 per annum
Members N$15 000 per annum
NEDBANK NAMIBIA LIMITED
BOARD OF DIRECTORS BOARD AUDIT COMMITTEE RISK
COMMITTEE
REMUNERATION
NOMINATION,
EQUITY AND
SKILLS RETENTION
COMMITTEE
DIRECTORS’
AFFAIRS
COMMITTEE
Meetings held: 5 4 4 4 4
Attendance:
Frank T J 5 (Chairman) 4 4 (Chairman) 4 (Chairman)
Denya D 3 2 1 2 2
!Gawaxab J 3 4
Kankondi S I 3 2 2
Pearce C J 5 4 4 (Chairman)
Peters R H 5 4 (Chairman) 4
Shipanga M K 3
*Turton W E (Managing Director)(1) 5 4 4 4 4
Weilert H M 3 1 1 1 1
Weston M R (2) 2
*Attended board committee meetings by invitation.
(1) Resigned 31/12/2007 (2) Resigned 3/10/2007
NEDNAMIBIA HOLDINGS LIMITEDFEES PAID FOR THE 2007 FINANCIAL YEAR TO
INDIVIDUAL DIRECTORS
Name of directorN$ paid per
annum
Frank T J (Chairman) 24 000
Denya D NIL
!Gawaxab J 16 000
Kankondi S I 16 000
Pearce C J NIL
Peters R H 16 000
Shipanga M K 16 000
Turton W E (Managing Director) NIL
Weilert H M NIL
Weston M R NIL
23
Corporate Governance Report (cont)
DIRECTORS’ FEES (cont)
Nedbank Namibia Limited
Board committees are categorised as A and
B committees.
The following directors’ and board
committee fees were paid for the financial
year 2007:
NEDBANK NAMIBIA LIMITEDANNUAL DIRECTORS’ AND BOARD COMMITTEE REMUNERATION
CHAIRMAN
(fees per annum)
MEMBERS
(fees per annum)
Directors’ fees N$104 000 N$56 000
A committee fees
• Audit committee
• Risk committee
N$70 000 N$35 000
B committee fees
• Remuneration, nomination, equity and skills
retention committee
• Directors’ Affairs committee
N$60 000 N$30 000
Fees for time spent by directors on bank related
matters that fall outside the normal course of
board/board committee business/preparation
N$1 000 per hour
NEDBANK NAMIBIA LIMITEDFEES PAID FOR THE 2007 FINANCIAL YEAR TO INDIVIDUAL DIRECTORS
Name of director N$ paid per annum
Frank T J (Chairman) 279 500
Denya D NIL
!Gawaxab J 92 000
Hoveka E T (Deputy Managing Director) *675 000 (salary)
Kankondi S I 116 000
Pearce C J NIL
Peters R H 215 000
Shipanga M K 56 000
Turton W E (Managing Director) 927 000 (salary)
Weilert H M NIL
Weston M R NIL
*Salary paid as from 1 April 2007 (date of appointment as deputy managing director)
24
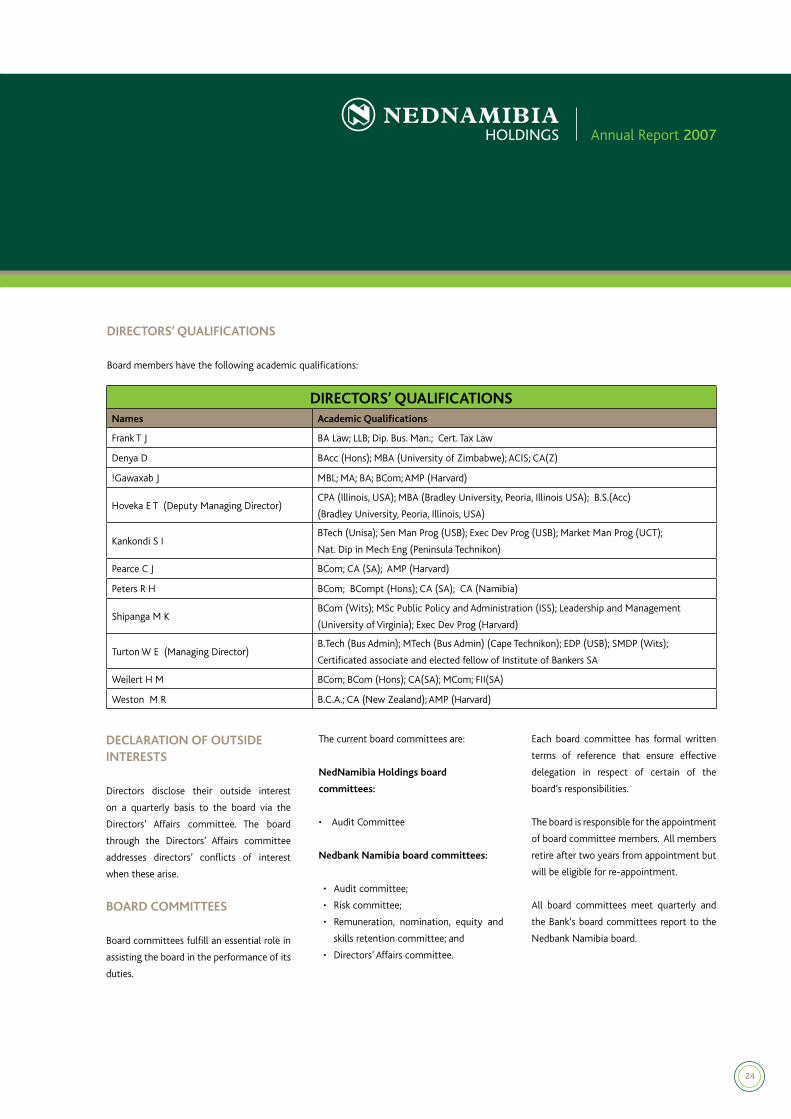
DIRECTORS’ QUALIFICATIONS
Board members have the following academic qualifications:
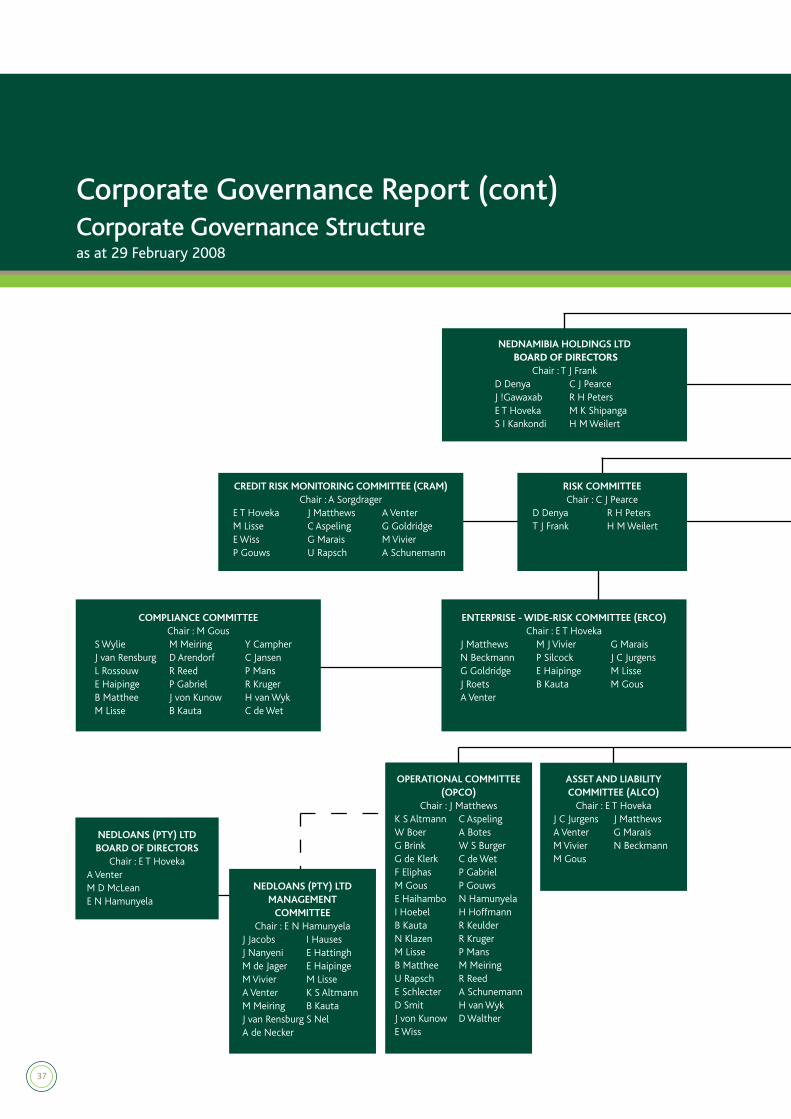
Chair : T J FrankD Denya C J PearceJ !Gawaxab R H PetersE T Hoveka M K ShipangaS I Kankondi H M Weilert
RISK COMMITTEEChair : C J Pearce
D Denya R H Peters T J Frank H M Weilert
CREDIT RISK MONITORING COMMITTEE (CRAM)Chair : A Sorgdrager
E T Hoveka J Matthews A VenterM Lisse C Aspeling G GoldridgeE Wiss G Marais M Vivier P Gouws U Rapsch A Schunemann
Corporate Governance Report (cont)Corporate Governance Structure as at 29 February 2008
ENTERPRISE - WIDE-RISK COMMITTEE (ERCO)Chair : E T Hoveka
J Matthews M J Vivier G MaraisN Beckmann P Silcock J C JurgensG Goldridge E Haipinge M LisseJ Roets B Kauta M GousA Venter
COMPLIANCE COMMITTEE Chair : M Gous
S Wylie M Meiring Y CampherJ van Rensburg D Arendorf C JansenL Rossouw R Reed P MansE Haipinge P Gabriel R KrugerB Matthee J von Kunow H van WykM Lisse B Kauta C de Wet
OPERATIONAL COMMITTEE (OPCO)
Chair : J MatthewsK S Altmann C Aspeling W Boer A Botes G Brink W S Burger G de Klerk C de Wet F Eliphas P Gabriel M Gous P GouwsE Haihambo N Hamunyela I Hoebel H Hoffmann B Kauta R Keulder N Klazen R Kruger M Lisse P Mans B Matthee M MeiringU Rapsch R Reed E Schlecter A SchunemannD Smit H van Wyk J von Kunow D WaltherE Wiss
ASSET AND LIABILITY COMMITTEE (ALCO)
Chair : E T HovekaJ C Jurgens J Matthews A Venter G Marais M Vivier N BeckmannM Gous
NEDLOANS (PTY) LTD BOARD OF DIRECTORS
Chair : E T HovekaA Venter M D McLeanE N Hamunyela
NEDLOANS (PTY) LTD MANAGEMENT
COMMITTEEChair : E N Hamunyela
J Jacobs I HausesJ Nanyeni E HattinghM de Jager E HaipingeM Vivier M LisseA Venter K S AltmannM Meiring B KautaJ van Rensburg S Nel A de Necker
38
NEDBANKNAMIBIALTDBOARDOFDIRECTORS
Chair : T J FrankD Denya L M Muatunga J !Gawaxab A T M Gebhardt R H Peters C J PearceE T Hoveka M K Shipanga K WhitfieldS I Kankondi H M Weilert
DIRECTORS’ AFFAIRS COMMITTEE
Chair : T J FrankS I Kankondi D Denya H M Weilert
REMUNERATION, NOMINATION, EQUITY AND SKILLS RETENTION
COMMITTEE Chair : T J Frank
D Denya H M WeilertS I Kankondi
AUDIT COMMITTEE Chair : R H Peters
D Denya C J PearceJ !Gawaxab H M Weilert
NEDBANK NAMIBIA LTD EXECUTIVE COMMITTEE (EXCO)
Chair : E T HovekaG Goldridge E Haipinge J C JurgensP Silcock G Marais N BeckmannJ Matthews A Venter M Vivier
CREDIT COMMITTEEChair : A Struchtemeier
E T Hoveka M VivierE Wiss Y CampherN Hayward A VenterM Grobler P GouwsJ Damon H LinderG Marais A Schunemann
OPERATIONAL DISTRIBUTION
COMMITTEEChair : G Goldridge
G Marais A VenterM Vivier H HoffmannI Hoebel M Gous
PRICING COMMITTEEChair : J Matthews
J C Jurgens M VivierG Marais A VenterG Goldridge P SilcockE T Hoveka N Beckmann
SOCIAL INVESTMENT COMMITTEE
Chair : J C Jurgens E T Hoveka J MatthewsA Venter P SilcockE Haipinge G de Klerk
PRODUCT COMMITTEEChair : G Goldridge
J Matthews M VivierG Marais A VenterP Silcock N BeckmannM Lisse G BrinkJ C Jurgens
INFORMATION TECHNOLOGY
COMMITTEEChair : G Goldridge
J Matthews G BrinkA Venter A Hart
CUSTOMER SERVICECOMMITTEE
Chair : M VivierP Silcock G GoldridgeA Venter G Marais
GLOBUS PRIORITISATIONCOMMITTEE
Chair : G GoldridgeJ Matthews G BrinkA Venter J C JurgensM Lisse M VivierG Marais
39
Directors’ Responsibilityfor the year ended 31 December 2007
The directors are responsible for the integrity and fair presentation of the annual financial statements and related information included in this
annual report. The annual financial statements presented on pages 26 to 31 and 43 to 144 have been prepared in accordance with and comply
with International Financial Reporting Standards (“IFRS”) adopted by the International Accounting Standards Board (“IASB”), and interpretations
issued by the International Financial Reporting Interpretations Committee of the IASB and the Namibian Companies Act and include amounts
based on judgements and estimates made by management. The directors have also prepared the other information included in the annual report
and are responsible for both its accuracy and its consistency with the annual financial statements.
To enable the board to discharge its responsibilities management has developed and continues to maintain a system of internal financial control.
The board has ultimate responsibility for this system of internal control and reviews the effectiveness of its operation primarily through the Audit
and Risk Committees and other risk monitoring functions.
The internal financial controls include risk-based systems of accounting and administrative controls designed to provide reasonable, but not
absolute, assurance that assets are safeguarded and that transactions are executed and recorded in accordance with generally accepted business
practices and the Group’s written policies and procedures. These controls are implemented by trained, skilled staff, with clearly defined lines of
accountability and an appropriate segregation of duties. The controls are monitored by management and include a comprehensive budgeting
and reporting system operating within strict deadlines and an appropriate control framework. As part of the system of internal financial control
Nedbank Namibia’s internal audit function conducts operational, financial and specific audits and coordinates audit coverage with the external
auditors.
The annual financial statements have been audited by the independent auditors, Deloitte & Touche, who were given unrestricted access to all
financial records and related data, including minutes of all meetings of shareholders, the board of directors and committees of the board. The
directors believe that all representations made to the independent auditors during the audit are valid and appropriate.
The going-concern basis has been adopted in preparing the financial statements. The directors have no reason to believe that the Group or any
company within the Group will not be a going concern in the foreseeable future, based on forecasts and available cash resources. These annual
financial statements support the viability of the Company and the Group.
The audit report of the independent auditors is presented on page 40.
The annual financial statements were approved and authorised for issue by the board of directors on 20 May 2008 and are signed on its behalf
by:
T J Frank E T Hoveka
Chairman Managing Director
40
Independent Auditor’s Report to the members of NedNamibia Holdings Limited
We have audited the annual financial statements and group annual financial statements of NedNamibia Holdings Limited, which comprise
the report of the directors, the balance sheet and the consolidated balance sheet as at 31 December 2007, and the income statement and the
consolidated income statement, the statement of changes in equity and the consolidated statement of changes in equity, and cash flow statement
and the consolidated cash flow statement for the year then ended, and a summary of significant accounting policies and other explanatory notes,
as set out on pages 26 to 31 (section relating to financial risk management) and 43 to 144.
Directors’ responsibility for the financial statements
The NedNamibia Holdings Limited directors are responsible for the preparation and fair presentation of these financial statements in accordance
with International Financial Reporting Standards and in the manner required by the Companies Act in Namibia. This responsibility includes:
designing, implementing and maintaining internal control relevant to the preparation and fair presentation of financial statements that are
free from material misstatement, whether due to fraud or error; selecting and applying appropriate accounting policies; and making accounting
estimates that are reasonable in the circumstances.
Auditor’s responsibility
Our responsibility is to express an opinion on these financial statements based on our audit. We conducted our audit in accordance with
International Standards on Auditing. Those standards require that we comply with ethical requirements and plan and perform the audit to obtain
reasonable assurance about whether the financial statements are free of material misstatement.
An audit involves performing procedures to obtain audit evidence about the amounts and disclosures in the financial statements. The procedures
selected depend on the auditor’s judgement, including the assessment of the risks of material misstatement of the financial statements, whether due
to fraud or error. In making those risk assessments, the auditor considers internal control relevant to the entity’s preparation and fair presentation
of the financial statements in order to design audit procedures that are appropriate in the circumstances, but not for the purpose of expressing an
opinion on the effectiveness of the entity’s internal control. An audit also includes evaluating the appropriateness of accounting principles used
and reasonableness of accounting estimates made by the directors, as well as evaluating the overall financial statement presentation.
We believe that the audit evidence we have obtained is sufficient and appropriate to provide a basis for our audit opinion.
Opinion
In our opinion, the financial statements present fairly, in all material respects, the financial position of NedNamibia Holdings Limited and its
subsidiaries at 31 December 2007 and their financial performance and their cash flows for the year then ended in accordance with International
Financial Reporting Standards and in the manner required by the Companies Act in Namibia.
Deloitte & Touche
Registered Accountants and Auditors
Chartered Accountants (Namibia)
PerDJCilliers
Partner
Windhoek
20 May 2008
41
2007 2006
Notes N$’000 N$’000
Assets 2 6,211 7,912
Total assets per balance sheet 6,211 7,912
Liabilities 3,4 406 2,894
Actuarial value of policy liabilities 405 889
Current liabilities 1 2,005
Excess of assets over liabilities 5,805 5,018
Analysis of change in excess assets:
Excess assets as at end of reporting year 5,805 5,018
Excess assets as at beginning of reporting year 5,018 5,561
Change in excess assets over the reporting year 787 (543)
This change is due to the following factors:
Investment return on excess assets 441 431
Operating profit 414 1,097
Change in valuation methods or assumptions 5 - -
Taxation (68) (71)
Total earnings 787 1,457
Capital raised - -
Dividends paid - 2,000
Total change in excess assets 787 (543)
Reconciliation to reported earnings:
Total earnings as per the above table 787 1,457
Less: Surplus in life fund - -
Reported earnings in annual financial statements 787 1,457
NOTES
1. FINANCIAL SOUNDNESS BASIS/VALUATION PRINCIPLES
The assets and liabilities of Coversure Limited have been calculated in accordance with the Actuarial Society of South Africa’s guidelines and
in particular PGN103 and PGN104. However, no Capital Adequacy Requirement was calculated as this is not required in terms of Namibian
Law. The Financial Soundness Valuation, stipulated in PGN104, is a gross premium method of valuation. The liability has been based on cash
flow projections, on a per policy basis, using the assumptions contained in note 3 below.
2. VALUATION OF ASSETS
All assets have been taken at balance sheet values as described in the notes to the financial statements.
Statement of Actuarial Value of Assets and Liabilities of Coversure Limitedfor the year ended 31 December 2007
42
3. VALUATION OF POLICY LIABILITIES The valuation of the policy liabilities was conducted on a basis consistent with the valuation of the assets.The assumptions are based on best estimates of the expected experience. The main assumptions, before allowing for prescribed margins (see note 4 below), were as follows:
Investment return 7.25% per annum
Mortality SA85/90 Heavy (ULT) + 50% of AIDS extra mortality (High risk group males with 2 year progression)
Permanent disability CSI skilled lives x 1.25
Dread disease CSI 1997 dread disease x 1.25
Temporary disability CMIR12 inception rates (4 week deferred period) x 0.5, 6 months payment on average
Retrenchment 5% inception rate, 6 months payment on average
Withdrawals
Year 1 = 15%
Year 2 = 10%
Year 3+ = 5%
NAMFISA levy 0.15% of outstanding liability
Taxation 40% investment income is taxed at 35%. All investment income assumed to be taxable
• Negative reserves were eliminated such that no policy was treated as an asset – this is required in terms of Namibian law. However, there were no such negative reserves.• An incurred but not reported reserve of 2/12ths of the annual expected claims was established.• We were advised that the company will be closed to new business and therefore a separate expense reserve was established based on
the expected future expenses and remaining policy term. An expense inflation assumption of 5% p.a. was used. 4. PRESCRIBED MARGINS
Prescribed margins have been allowed for as outlined in the Actuarial Society of South Africa’s guidance note – PGN 104. There were no discretionary margins added.
5. CHANGES IN VALUATION BASISThere were no changes to the valuation assumptions since the previous valuation.
6. REPORT BY THE STATUTORY ACTUARY I hereby certify that:
• the valuation of Coversure Limited as at 31 December 2007, the results of which are summarised above, has been conducted in accordance with, and this statutory actuary’s report has been produced in accordance with, applicable Actuarial Society of South Africa Professional Guidance Notes;
• I have accepted that the annual financial statements comply with the requirements of the Namibian Companies Act and the Long-Term Insurance Act;
• my statutory actuary’s report, read together with the annual financial statements, fairly presents the financial position of the company; and• the company was financially sound as at the valuation date, and in my opinion is likely to remain financially sound for the foreseeable
future.
RD WILLIAMSStatutory Actuary Fellow of the Institute of ActuariesFellow of the Actuarial Society of South Africa24 January 2008
43
Report of the Directorsfor the year ended 31 December 2007
The directors have pleasure in submitting their report together with the annual financial statements of NedNamibia Holdings Limited and its
subsidiaries for the year ended 31 December 2007.
NATURE OF THE BUSINESSNedNamibia Holdings is a registered holding company that, through its subsidiaries, provides a wide range of financial services, including corporate
and retail banking, property and asset finance, private banking, micro lending, insurance and foreign exchange and securities trading. The Group’s
head office is in Windhoek and its operations are confined to Namibia.
HOLDING COMPANYThe holding company of NedNamibia Holdings is Nedbank Group Limited, a South African incorporated company that holds 100% of the issued
ordinary shares, and its ultimate controlling shareholder is Old Mutual plc, incorporated in England and Wales.
The group structure of NedNamibia Holdings is set out on page 3 of this report.
RESULTS FOR THE YEAR The financial results of the Company and the Group are fully set out in the annual financial statements.
The net income after taxation for the Group for the year amounted to N$83,7 million, compared with N$40,2 million for the previous year. Total
assets of the Group increased by 14,89% from N$4 756,8 million to N$5 465,1 million.
SHARE CAPITALAs a result of the successful implementation of a Scheme of Arrangement between Nedbank Group Limited and the minority shareholders,
the Company’s shareholding structure was reorganised into a unitary structure and Nedbank Group Limited became the sole shareholder of
NedNamibia Holdings.
NedNamibia Holdings has an authorised share capital of 80 000 000 ordinary shares of 25 cents each. The Company’s issued share capital
comprises 70 381 644 ordinary shares.
The shareholders have placed the unissued share capital of 9 618 356 ordinary shares under the control of the directors until the next annual
general meeting.
SPECIAL RESOLUTIONSNo special resolutions were passed during the year under review.
DIVIDENDSThe board resolved not to declare a dividend for the 2007 financial year (2006: nil).
ACCOUNTING TREATMENT OF LOANS AND ADVANCESThe accounting treatment of loans and advances disclosed in the annual financial statements complies with IFRS. The impairment determined
in compliance with the requirements of BID-2 (Determinations on the Classification of Loans and the Suspension of Interest on Non-Performing
Loans and the Provisions for Bad and Doubtful Debts) issued pursuant to Section 71(3) of the Banking Institutions Act, 1998 is recorded in the
returns to the Bank of Namibia. The excess impairment determined in compliance with BID-2 over the impairment determined based on IFRS is
recorded as a general risk reserve in the annual financial statements.
44
BOARD OF DIRECTORS AND SECRETARYMr William E Turton, who remained the managing director of both NedNamibia Holdings and Nedbank Namibia during the year under review
has tendered his resignation, which became effective 31 December 2007. Mr Erastus Hoveka succeeded Mr Turton as managing director of both
companies with effect from 1 January 2008, after having been appointed as deputy managing director of Nedbank Namibia on 1 April 2007.
Mr Mark R Weston resigned as director on 3 October 2007.
The following directors who retired by rotation in terms of the Articles of Association, were reappointed as directors on 29 June 2007.
Messrs: Theo J Frank
Sebulon I Kankondi
Martin K Shipanga
The following directors who were appointed prior to the annual general meeting, retired in terms of the Articles of Association of the Company and
were reappointed by the shareholders on 29 June 2007.
Messrs: Denys Denya
William E Turton
The Company’s board of directors currently comprises the following members:
Appointed Resigned
Frank Theo J (chairman) 11 February 2005
*Beyers Stanley H 15 November 2007
**Denya Denys 31 October 2006
!Gawaxab Johannes 11 February 2005
Hoveka Erastus T (managing director) 1 January 2008
Kankondi Sebulon I 11 February 2005
Turton William E (managing director) 1 July 2006 31 December 2007
***Pearce Christopher J 23 March 2000
****Peters Rolf H 11 February 2005
Shipanga Martin K 1 January 2004
***Weilert Heinz M 23 May 2006
*****Weston Mark R 13 May 2004 3 October 2007
* Alternate director to Denys Denya
** Zimbabwean
***South African
****German
*****New Zealander
The board conveys its appreciation to Messrs Turton and Weston for the valuable services rendered during their terms of office.
45
Report of the Directors (cont)for the year ended 31 December 2007
SECRETARY AND REGISTERED OFFICE
The secretary of the Company is Mrs Mechthild Meiring, whose business address as well as that of the registered office is 12-20 Dr Frans Indongo
Street, Windhoek. The postal address of the registered office is P O Box 1, Windhoek, and the Company’s registration number is 91/075.
TRANSFER SECRETARIES
Transfer Secretaries (Proprietary) Limited will remain the Company’s transfer secretaries until such time that most of the minority shareholders
have surrendered their original documents of title as defined in the Scheme of Arrangement that was concluded between Nedbank Group Limited
and the minority shareholders. Their business address is Shop 8, Kaiserkrone Centre, Post Street Mall, Windhoek, Namibia, P O Box 2401, Windhoek,
Namibia.
INTEREST OF DIRECTORS IN THE CAPITAL OF THE COMPANY
The successful implementation of the Scheme of Arrangement between Nedbank Group Limited and the minority shareholders resulted in Nedbank
Group Limited’s acquisition of the minority shareholders’ 6.11% shareholding in NedNamibia Holdings and consequently no directors having an
interest in the share capital of the Company.
INTEREST OF DIRECTORS IN CONTRACTS
Nedbank Namibia is presently leasing the premises on which the Oshikango and Outapi branches are located from Tusk Investments (Proprietary)
Limited. The sole shareholder of Tusk Investments (Proprietary) Limited is the M&N Shipanga Family Trust, of which Mr Martin Shipanga, a director
of Nedbank Namibia and of the Tusk Investments (Proprietary) Limited, is a trustee/beneficiary. Mr Shipanga has declared his interest in Tusk
Investments (Proprietary) Limited to the board of directors.
46
SUBSIDIARIES
NedNamibia Holdings has the following directly held subsidiaries:
NAME OF SUBSIDIARY TYPE OF BUSINESS ISSUED SHARE CAPITAL PROPORTION HELD
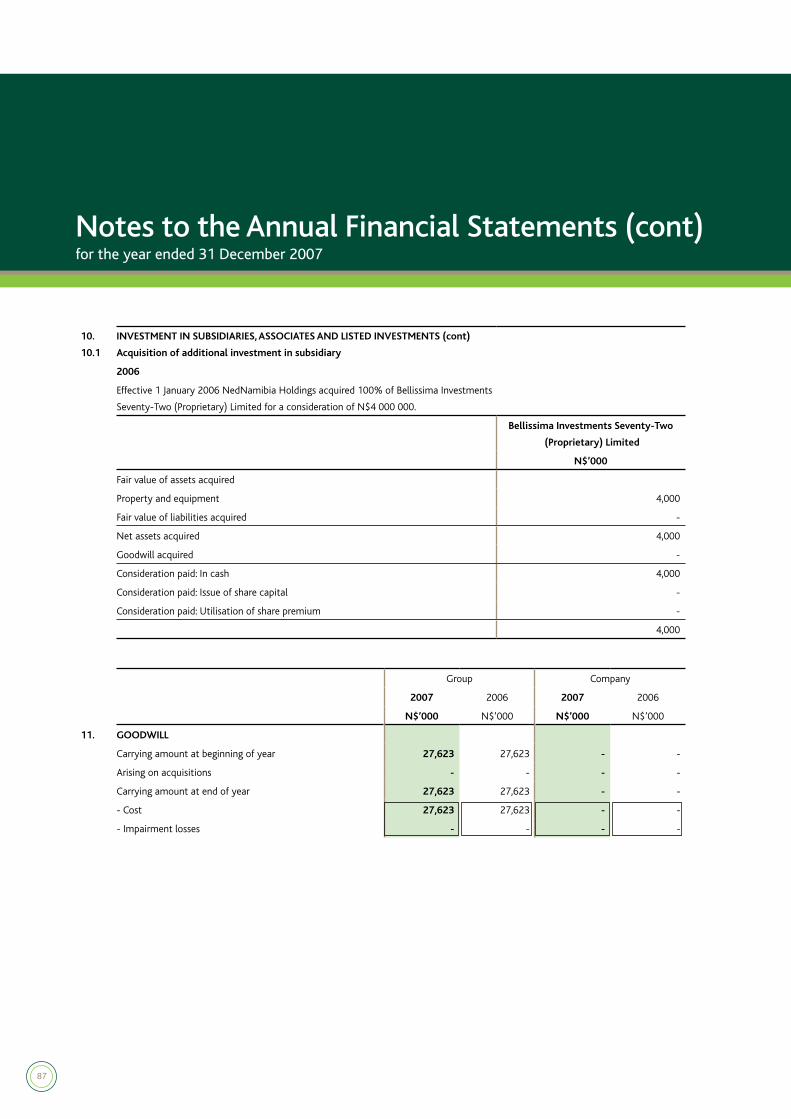
Bellissima Investments Seventy Two (Proprietary) Limited Property holding company 100 ordinary shares 100%
More details on direct and indirect subsidiaries of the Group are set out in note 10 of the annual financial statements.
POST BALANCE SHEET EVENTS
The directors are not aware of any material post-balance sheet events that have occurred.
APPRECIATION
The board of directors extends its sincere appreciation to all the employees and esteemed clients of the Group and the Company for their loyalty
and continued support.
Its appreciation is also extended to the Ministry of Finance, the Bank of Namibia, the local authorities, the Namibia Financial Institutions Supervisory
Authority (“Namfisa”) and our attorneys and auditors for their assistance and co-operation.
47
Balance Sheetsas at 31 December 2007
Group Company
2007 2006 2007 2006
Notes N$’000 N$’000 N$’000 N$’000
ASSETS
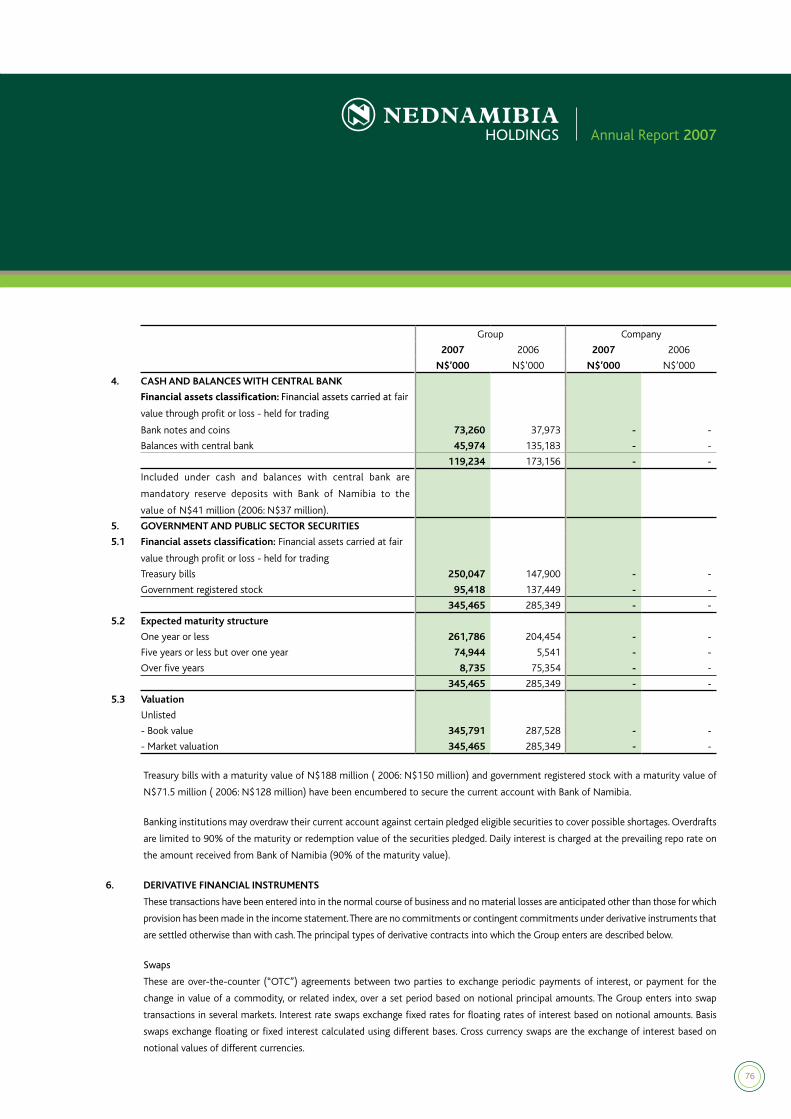
Cash and balances with central bank 4 119,234 173,156 - -
Government and public sector securities 5 345,465 285,349 - -
Information regarding land and buildings required in terms of the Namibian Companies Act is available for inspection, by the shareholder or duly authorised agents, at the Group’s registered office.
Independent valuations of freehold land and buildings were performed by John S. Lofty-Eaton (National diploma: Property Valuation- UNISA, Member: SA Institute of Valuers) and P.J. Scholtz (National diploma: Property Valuation - Technikon SA). The effective date of the valuation is 31 December 2007. The previous valuation was performed on 1 January 2004. The revaluation of properties has been done, where appropriate for the specific property being valued, with reference to one of:- income capitalisation method using a capitalisation rate of 11%; and- the depreciated replacement cost method. The valuation conforms to International Valuation Standards.
89
Development cost Computer software Total
N$’000 N$’000 N$’000
13. COMPUTER SOFTWARE AND DEVELOPMENT COST
Group
2007
Carrying amount at 1 January 2007 196 12,844 13,040
- at cost 196 28,662 28,858
- accumulated amortisation - (15,818) (15,818)
Additions at cost - 3,553 3,553
Development cost incurred 2,434 - 2,434
Transfers to property and equipment - (3,201) (3,201)
Transfers at cost - 1,445 1,445
Accumulated amortisation of transfers - (4,646) (4,646)
Amortisation for the year - (1,385) (1,385)
Carrying amount at 31 December 2007 2,630 11,811 14,441
- at cost 2,630 33,660 36,290
- accumulated amortisation - (21,849) (21,849)
2006
Carrying amount at 1 January 2006 1,827 7,686 9,513
- at cost 1,827 17,202 19,029
- accumulated amortisation - (9,516) (9,516)
Additions at cost - 9,274 9,274
Development cost incurred 555 - 555
Transfers to computer software (2,186) 2,186 -
Amortisation for the year - (6,302) (6,302)
Carrying amount at 31 December 2006 196 12,844 13,040
- at cost 196 28,662 28,858
- accumulated amortisation - (15,818) (15,818)
Group Company
2007 2006 2007 2006
N$’000 N$’000 N$’000 N$’000
14. NON-CURRENT ASSETS CLASSIFIED AS HELD FOR SALE
Opening balance at the beginning of the year 21,369 - - -
Land held for sale 7,350 - - -
Building held for sale 14,019 - - -
Purchase of land - 3,350 - -
Construction of building 4,117 14,019 - -
Revaluation of land - 4,000 - -
Revaluation of building 6,010 - - -
Transfer from investments in subsidiaries 4,000
Closing balance at the end of the year 31,496 21,369 4,000 -
Land held for sale (i) 7,350 7,350 - -
Building held for sale (i) 24,146 14,019 - -
Investment in subsidiary (i) - - 4,000 -
(i) The Group intends to dispose of the land and the building in the next 12 months. The primary business of the Group is not to invest in property and a business decision has been taken to dispose of this property. In 2006 the search was underway for a buyer. At the end of 2006 a buyer was identified, but negotiations were not completed by year end. It is anticipated that the disposal will be completed by 31 December 2008. No impairment loss was recognised on the reclassification of the land as held for sale.
Notes to the Annual Financial Statements (cont)for the year ended 31 December 2007
90
Group Company
2007 2006 2007 2006
N$’000 N$’000 N$’000 N$’000
15. OTHER ASSETS
Financialassetsclassification: Loans and receivables
Remittances in transit 110,124 16,188 - -
Zero coupon bonds 75,283 65,266 - -
Sundry debtors and other accounts 38,340 60,542 25 -
Deposits and borrowings from other banks 315,940 259,772 8,326 8,035
17. OTHER DEPOSITS
Financialliabilitiesclassification: Other liabilities
Negotiable certificates of deposits 420,820 544,559 - -
18. DUE TO CUSTOMERS
Financialliabilitiesclassification: Other liabilities
18.1 Category analysis
Current accounts 847,231 825,816 - -
Savings accounts 149,638 138,991 - -
Other deposits and loan accounts 2,843,451 2,360,487 - -
Foreign currency liabilities 166,938 57,829 - -
4,007,258 3,383,123 - -
18.2 Sectoral analysis
Government and quasi government 490,200 168,697 - -
Insurance and pension funds 243,563 418,876 - -
Companies and close corporations 2,197,876 1,065,181 - -
Individuals and other 1,075,619 1,730,369 - -
4,007,258 3,383,123 - -
18.3 Maturity structure
Repayable on demand 579,028 473,594 - -
Three months or less but not repayable on demand 640,898 342,764 - -
One year or less but over three months 2,787,332 2,266,610 - -
Five years or less but over one year - 300,155 - -
4,007,258 3,383,123 - -
18.4 Geographical analysis
Namibia 4,006,111 3,083,843 - -
South Africa 1,147 299,280 - -
4,007,258 3,383,123 - -
91
Notes to the Annual Financial Statements (cont)for the year ended 31 December 2007
Group Company
2007 2006 2007 2006
N$’000 N$’000 N$’000 N$’000
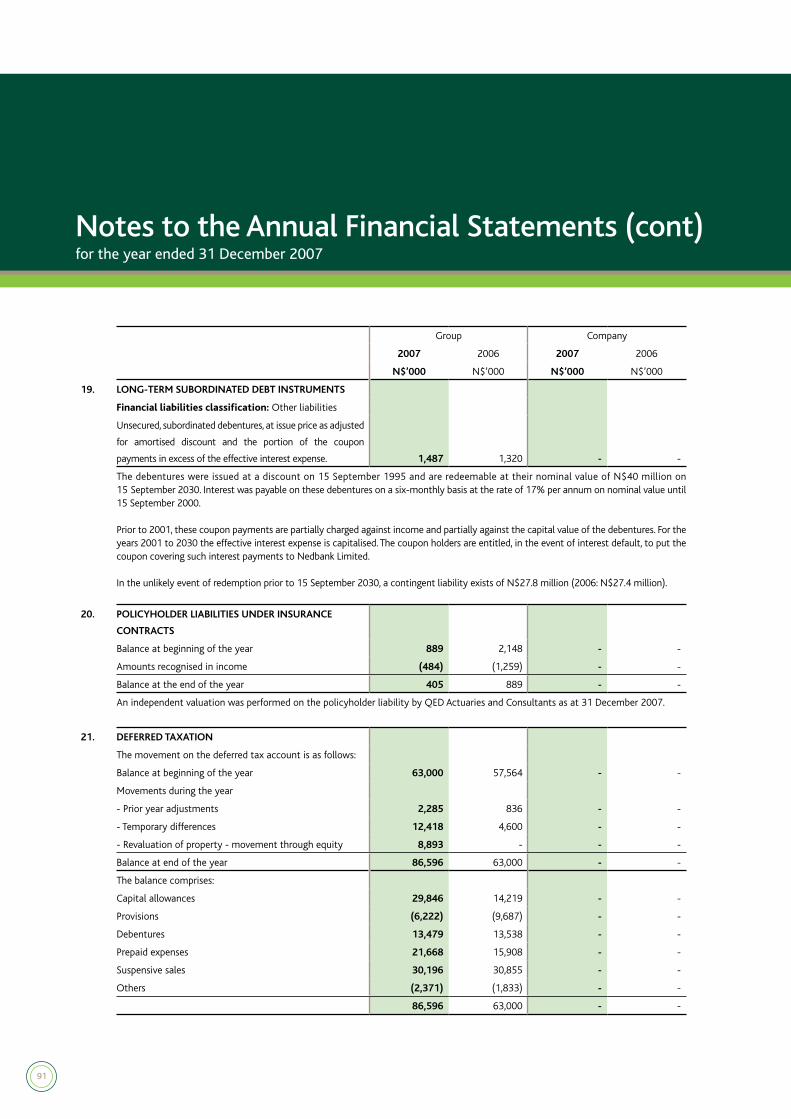
19. LONG-TERM SUBORDINATED DEBT INSTRUMENTS
Financialliabilitiesclassification: Other liabilities
Unsecured, subordinated debentures, at issue price as adjusted
for amortised discount and the portion of the coupon
payments in excess of the effective interest expense. 1,487 1,320 - -
The debentures were issued at a discount on 15 September 1995 and are redeemable at their nominal value of N$40 million on 15 September 2030. Interest was payable on these debentures on a six-monthly basis at the rate of 17% per annum on nominal value until 15 September 2000.
Prior to 2001, these coupon payments are partially charged against income and partially against the capital value of the debentures. For the years 2001 to 2030 the effective interest expense is capitalised. The coupon holders are entitled, in the event of interest default, to put the coupon covering such interest payments to Nedbank Limited.
In the unlikely event of redemption prior to 15 September 2030, a contingent liability exists of N$27.8 million (2006: N$27.4 million).
20. POLICYHOLDER LIABILITIES UNDER INSURANCE
CONTRACTS
Balance at beginning of the year 889 2,148 - -
Amounts recognised in income (484) (1,259) - -
Balance at the end of the year 405 889 - -
An independent valuation was performed on the policyholder liability by QED Actuaries and Consultants as at 31 December 2007.
21. DEFERRED TAXATION
The movement on the deferred tax account is as follows:
Balance at beginning of the year 63,000 57,564 - -
Movements during the year
- Prior year adjustments 2,285 836 - -
- Temporary differences 12,418 4,600 - -
- Revaluation of property - movement through equity 8,893 - - -
Balance at end of the year 86,596 63,000 - -
The balance comprises:
Capital allowances 29,846 14,219 - -
Provisions (6,222) (9,687) - -
Debentures 13,479 13,538 - -
Prepaid expenses 21,668 15,908 - -
Suspensive sales 30,196 30,855 - -
Others (2,371) (1,833) - -
86,596 63,000 - -
92
Group Company
2007 2006 2007 2006
N$’000 N$’000 N$’000 N$’000
22. PROVISIONFORPOST-RETIREMENTMEDICALBENEFITS
The Group subsidises 50% of the medical aid contribution of
all employees who joined Nedbank Namibia between 1 April
2000 and 31 January 2003. The subsidy does not apply to any
employees who joined Nedbank Namibia on or after 1 February
2003. Provisions are made for these costs. The charge for the year
is included in the staff costs expense in the income statement.
Valuation method and assumptions:
The actuarial valuation method used to value the liabilities is the
Projected Unit Credit Method prescribed by IAS 19 Employee
Benefits. Future benefits valued are projected using specific
actuarial assumptions and the liability for in-service members is
accrued over expected working lifetime. The actuarial valuation is
obtained once every two years on a cyclical basis. The most recent
valuation was obtained for the year ended 31 December 2007.
The most significant assumptions used are:
Valuation interest rate: 8% per annum
Medical aid contribution inflation: 6.25% per annum
Reconciliationofnetliabilityinthebalancesheet:
Balance at beginning of the year 5,073 4,939 - -
Interest cost 413 391 - -
Current service cost 119 123 - -
Benefits paid (240) (223) - -
Actuarial gain (378) (157) - -
Balance at end of the year 4,987 5,073 - -
An independent actuarial valuation has been performed by Arthur Els & Associates Consulting Actuaries on 31 December 2007.
93
Notes to the Annual Financial Statements (cont)for the year ended 31 December 2007
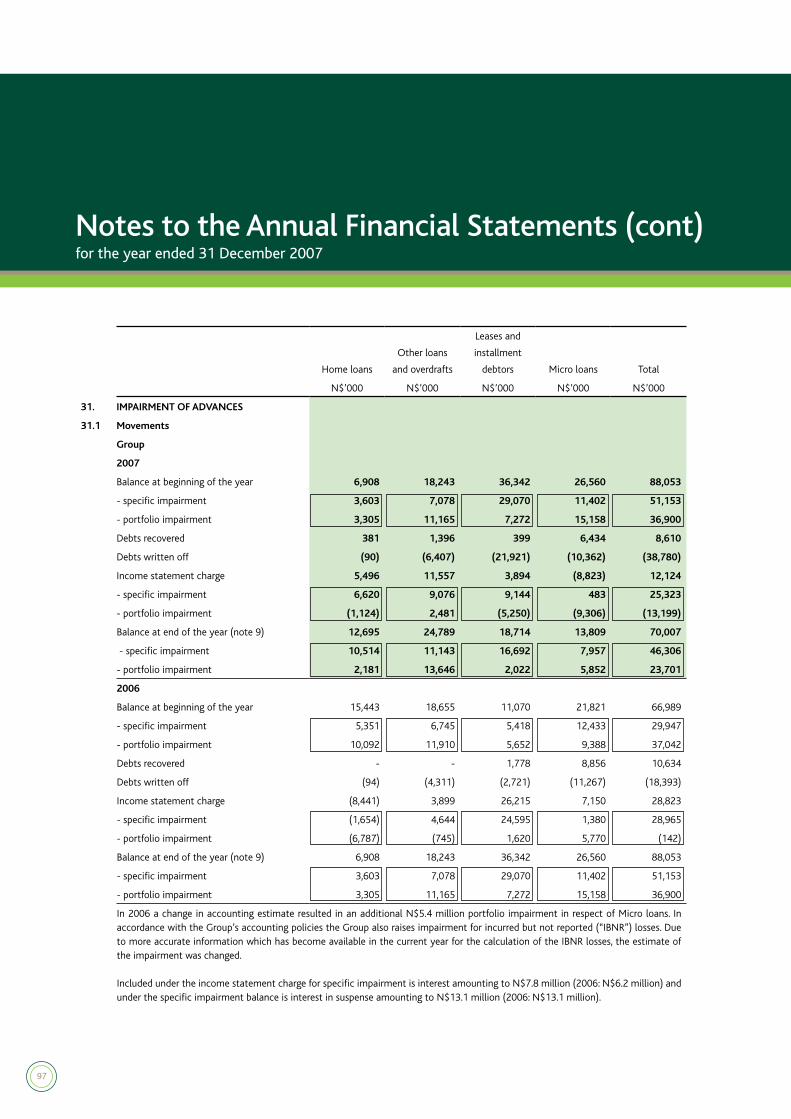
In 2006 a change in accounting estimate resulted in an additional N$5.4 million portfolio impairment in respect of Micro loans. In accordance with the Group’s accounting policies the Group also raises impairment for incurred but not reported (“IBNR”) losses. Due to more accurate information which has become available in the current year for the calculation of the IBNR losses, the estimate of the impairment was changed.
Included under the income statement charge for specific impairment is interest amounting to N$7.8 million (2006: N$6.2 million) and under the specific impairment balance is interest in suspense amounting to N$13.1 million (2006: N$13.1 million).
98
2007 2006
N$’000 N$’000
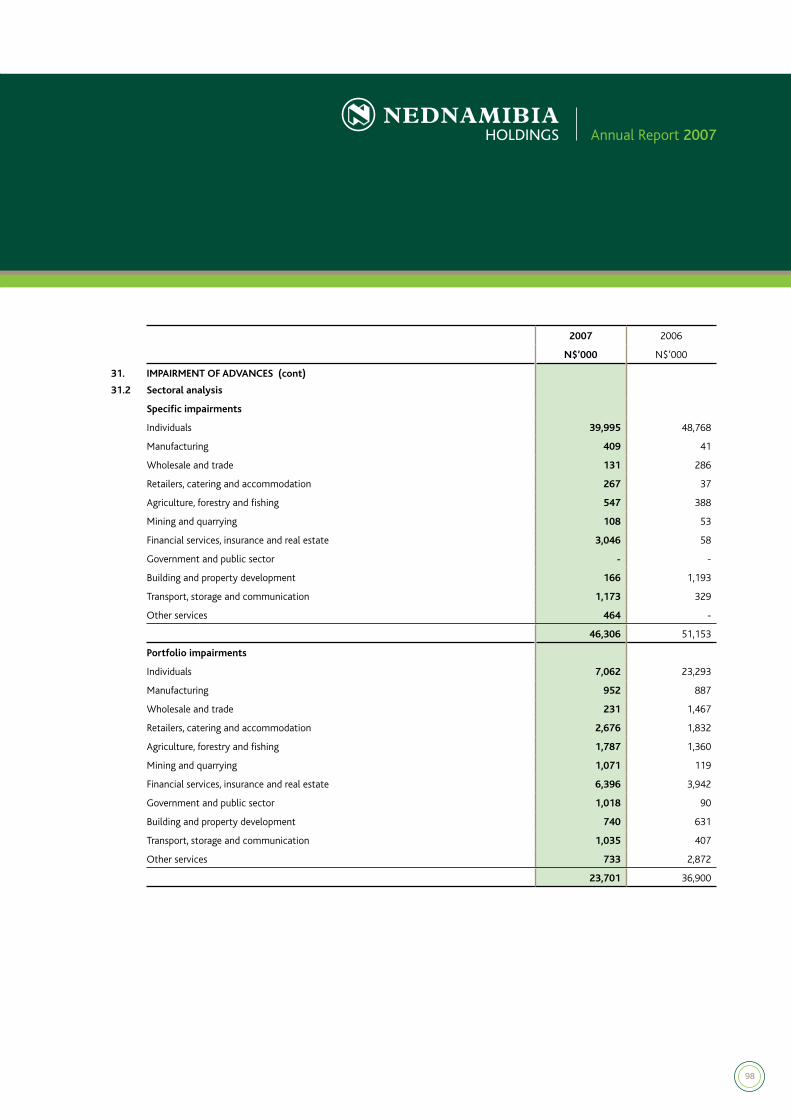
31.
31.2
IMPAIRMENT OF ADVANCES (cont)
Sectoral analysis
Specific impairments
Individuals 39,995 48,768
Manufacturing 409 41
Wholesale and trade 131 286
Retailers, catering and accommodation 267 37
Agriculture, forestry and fishing 547 388
Mining and quarrying 108 53
Financial services, insurance and real estate 3,046 58
Government and public sector - -
Building and property development 166 1,193
Transport, storage and communication 1,173 329
Other services 464 -
46,306 51,153
Portfolio impairments
Individuals 7,062 23,293
Manufacturing 952 887
Wholesale and trade 231 1,467
Retailers, catering and accommodation 2,676 1,832
Agriculture, forestry and fishing 1,787 1,360
Mining and quarrying 1,071 119
Financial services, insurance and real estate 6,396 3,942
Government and public sector 1,018 90
Building and property development 740 631
Transport, storage and communication 1,035 407
Other services 733 2,872
23,701 36,900
99
Notes to the Annual Financial Statements (cont)for the year ended 31 December 2007
Group Company
2007 2006 2007 2006
N$’000 N$’000 N$’000 N$’000
32. EXPENSES
Expenses include the following items which are separately
disclosable:
Auditors’ remuneration
- Audit fees - current year 2,104 1,853 235 -
- Audit fees - prior year 1,918 2,103 112 126
- Other services 812 152 - -
Post - retirement medical aid benefit
- Interest cost 413 391 - -
- Current service cost 119 123 - -
- Actuarial gain (378) (157) - -
Depreciation 9,561 5,816 - -
Amortisation of computer software 1,385 6,302 - -
Staff costs 114,637 96,484 345 311
Operating lease charges
- Fixed property 10,496 5,274 - -
- Other 170 1,746 - -
Remuneration other than to employees for :
- Managerial services 25,683 17,625 - -
Directors’ fees paid by the Group
- For services as directors 874 663 98 84
- Managerial services 3,066 407 - -
Key management
- Basic salary and other benefits 8,357 3,036 - -
- Employer pension contribution 602 262 - -
- Employer medical aid contribution 301 93 - -
Value-added tax charge in respect of current expenditure net
of input credits 2,271 1,600 - -
Other expenses 55,947 73,450 102 298
238,338 217,223 892 819
33. BEE TRANSACTION EXPENSES
- BEE share-based payment expenses 874 21,700 - -
- Consultation fees - 6,892 - -
874 28,592 - -
100
Group Company
2007 2006 2007 2006
N$’000 N$’000 N$’000 N$’000
34. TAXATION
34.1 Charge for the year
Taxationonincome
Normal - current year 24,790 19,330 - -
Normal - prior year (2,285) (836) - -
Deferred - current 12,418 4,600 - -
Deferred - prior 2,285 836 - -
37,208 23,930 - -
% % % %
34.2 Reconciliation of rate of taxation
Namibian normal rate of taxation 35.0 35.0 35.0 35.0
Reduction in rate for the year: (5.6) (12.3) (35.0) (36.6)
- Non - taxable income (2.7) (5.4) - (36.6)
- Prior year - (1.4) - -
- Other permanent differences (2.9) (5.5) (35.0) -
Increase in rate for the year:
- Non - deductible expenses 1.4 13.8 - 1.6
Effective rate of taxation 30.8 36.5 - -
Group Company
2007 2006 2007 2006
N$’000 N$’000 N$’000 N$’000
35. DIVIDENDS
Dividends declared - 32,945 - 32,945
2007
No dividend was declared for 2007
2006
The ordinary dividend was a capitalisation award. Each shareholder was entitled to receive a cash dividend of 49.29 cents per ordinary
share (“the cash dividend alternative”). The number of capitalisation shares to which the shareholders were entitled was determined
in the ratio that 49.29 cents per ordinary share bears to N$8.98, being the value per ordinary share which has been determined by the
Group’s advisors. This equates to 5 489 new shares for every 100 ordinary shares held.
Please refer to the directors’ report for additional information regarding the dividend.
101
Notes to the Annual Financial Statements (cont)for the year ended 31 December 2007
Group
2007 2006
Cents per share Cents per share
36. EARNINGS PER SHARE
Basic earnings per share 117.46 57.03
Diluted earnings per share 117.46 57.03
Group
2007 2006
N$’000 N$’000
Basicearningspershare
Earnings used in the calculation of basic earnings per share 82,670 38,893
Group
2007 2006
’000 ’000
Weighted average number of ordinary shares for the purpose of basic earnings per
share 70,382 68,195
Dilutedearningspershare
The earnings and the weighted average number of ordinary shares used in the calculation of all diluted earnings per share measures
are the same as those for the equivalent basic earnings per share measures, as outlined above.
102
Group Company
2007 2006 2007 2006
N$’000 N$’000 N$’000 N$’000
37. CASH FLOW INFORMATION
37.1 Reconciliation of net income before taxation to cash generated by operating activities
Net income / (loss) before taxation 120,944 64,083 (2,250) 33,408
Adjustments: 18,879 40,598 - (34,036)
- Interest accrued 9,691 1,379 - -
- Discount on government stock amortised (855) (1,869) - -
- Income from associates (572) - - -
- Capitalisation dividends - - - (32,945)
- Profit on disposal of fixed property and equipment (207) (5) - -
- Fair value adjustment to financial instruments (410) 1,462 - -
- Impairment of advances 12,124 28,823 - -
- Non-cash movement in provisions 11,781 8,408 - -
- Non-cash movement in leave pay accruals 3,088 888 - -
- Fair value movement in derivatives (395) (1,495) - -
- Non-cash movement in deferred staff compensation (4,166) (4,704) - -
- Fair value adjustment on listed investment - (932) - -
- Loss on sale of investment - 26 - -
- Share-based payment reserve movement 874 16,735 - -
- Depreciation 9,561 5,816 - -
- Computer software amortisation 1,385 6,302 - -
- Movement in long-term subordinated debt instruments 167 167 - -
- Current income tax charge (22,505) (18,494) - -
- Cash dividends (682) (1,909) - (1,091)
Movement in operating assets 59,630 264,293 2,250 4,628
- Deposit, current and other accounts 522,414 390,064 2,250 4,628
- Advances and other accounts (462,784) (125,771) - -
Cash flow from operating activities 199,453 368,974 - 4,000
37.2 Cash received from customers
Interest received 605,469 479,124 - -
Commission and fees received 76,671 59,059 - -
Other income received 22,950 30,744 - 12
705,090 568,927 - 12
37.3 Cash paid to customers
Interest paid on deposits (330,638) (239,572) (1,358) (730)
(330,638) (239,572) (1,358) (730)
37.4 Dividends paid
Amounts outstanding - beginning of year - - - -
Charge to income statement - (1,091) - (1,091)
Dividend to outside shareholders (682) (818) - -
Amounts outstanding - end of year - - - -
(682) (1,909) - (1,091)
The capitalisation award in respect of the dividend declared in 2006, N$31 854 000, is not reflected in the cash flow statement. 3 547 118 shares were issued in this regard.
103
Group Company
2007 2006 2007 2006
N$’000 N$’000 N$’000 N$’000
37. CASH FLOW INFORMATION (cont)
37.5 Taxation paid
Amounts prepaid / (outstanding) - beginning of year 8,781 (932) - -
Charge to income statement (22,505) (18,494) - -
Amounts prepaid - end of year (11,019) (8,781) - -
(24,743) (28,207) - -
37.6 Cash movements in operating liabilities
Current accounts 21,415 (3,265) 291 6,504
Savings deposits 10,647 11,610 - -
Other deposits and loan accounts 552,268 139,990 (16) 124
Foreign currency accounts 109,109 (3,476) - -
Negotiable certificates of deposit (123,739) 187,586 - -
569,700 332,445 275 6,628
37.7 Outflow on disposal of subsidiary
Assets - 3 - -
Liabilities - (34) - -
- (31) - -
Cash - 173 - -
- 142 - -
Minority - (35) - -
Total book value - 107 - -
Loss on sale of investment - (26) - -
Cash flow from acquisition - 81 - -
Bank balances - (173) - -
Total cash flow - (92) - -
37.8 Purchase of non-dealing securities
Other short-term securities (132,310) 66,236 - -
Government and public sector securities 42,031 (103,245) - -
(90,279) (37,009) - -
37.9 Cash and short-term funds
For the purpose of the cash flow statement, cash and short-
term funds comprises the following balances with less than
90 days maturity:
Bank notes and coins (note 4) 73,260 37,973 - -
Balances with central bank (note 4) 45,974 135,183 - -
Due from other banks (note 8) 403,848 276,285 - -
523,082 449,441 - -
Included under cash and balances with central bank are mandatory reserve deposits with Bank of Namibia to the value of N$41
million (2006: N$37 million).
Notes to the Annual Financial Statements (cont)for the year ended 31 December 2007
104
Group Company
2007 2006 2007 2006
N$’000 N$’000 N$’000 N$’000
38. COMMITMENTS
38.1 Capital expenditure
Not yet contracted
- Property and equipment 25,600 28,979 - -
- Intangible assets 19,500 2,164 - -
45,100 31,143 - -
Funds to meet capital expenditure will be provided from internal
resources.
38.2 Bond commitments
Bonds granted, not yet paid out 35,296 2,055 - -
38.3 Undrawn facilities
Original term of maturity of one year or less 383,023 408,711 - -
Interest and foreign exchange rate related items including swaps,
options and futures 871 1,762 - -
383,894 410,473 - -
38.4 Operating leases
Companies in the Group have entered into leases over fixed property
and other equipment for various periods. The charges will increase in
future in line with negotiated escalations and expansions.
The future minimum lease payments in respect of operating leases
are as follows:
Premises
2007 - 6,514 - -
2008 5,544 5,460 - -
2009 4,873 4,751 - -
2010 2,656 2,756 - -
2011 1,335 1,990 - -
2012 552 709 - -
Thereafter - - - -
14,960 22,180 - -
105
Group Company
2007 2006 2007 2006
N$’000 N$’000 N$’000 N$’000
39. PENSION FUND
All eligible employees are members of the Nedbank Namibia
Pension Fund and the Fined Pension Fund respectively,
being defined contribution plans registered in Namibia in
accordance with the requirements of the Pension Fund Act.
The funds are governed by the Pension Fund Act, 1956,
which requires an actuarial valuation every three years. The
findings of independent consulting actuaries, based on their
appraisal of the funds during January 2006, confirmed that
the funds were financially sound.
The total value of contributions to the pension funds during
the year amounted to:
Number of members 697 597 - -
Employer contributions 8,007 6,095 - -
Employee contributions 5,242 3,996 - -
40. CONTINGENT LIABILITIES
Confirmed letters of credit 17,931 1,825 - -
Liabilities under guarantees 230,518 175,350 - -
Legal actions against the Group 620 803 - -
249,069 177,978 - -
The major legal actions filed against the Group are detailed below:
A plea has been served and filed against Nedbank Namibia Limited by the NAMCO group in respect of damages suffered by TFDS
Offshore AS. The contingent liability was originally estimated at N$10 774 574. Nedbank Namibia Limited would have been held
accountable for their share of the participation agreement of 1.95%. Final settlement occurred in February 2007 determined at
USD 85 000 translated at a rate of 7.3843, totalling N$627 666. Nedbank Namibia Limited was only held accountable for N$12 220.
An ex-employee lodged a complaint of unfair dismissal with the District Labour Court of Oshakati and the relief claimed amounts to
N$620 000.
Notes to the Annual Financial Statements (cont)for the year ended 31 December 2007
106
41. SHARE-BASED PAYMENTS
Shares and share options are granted to employees as part of their remuneration package for services rendered, and in terms of the BEE
scheme to clients and partners as an incentive to retain business and develop growth within the Group. The following are share and
share options schemes that have been in place during the year. The BEE schemes will be treated as equity settled.
As the Group cannot estimate reliably the fair value of services received nor the value of additional business received, the Group rebuts
the presumption that such services and business can be measured reliably and, as such, measures their fair value by reference to the
fair value of the options or shares granted. The fair value of such options and shares is measured at the grant date utilising the Black-
Scholes model.
41.1 Description of arrangements
Scheme Trust Description Vesting requirements
Maximum
term
Black Economic Empowerment schemes - Business partners and affinity groups
Black Business Partner Scheme
(BBP)
Central Consortium SPV
Three Investments (Pty)
Ltd, Coastal Consortium
SPV Three Investments
(Pty) Ltd and Northern
Empowerment SPV Three
Investments (Pty) Ltd
Each SPV was issued an
equal number of restricted
shares at N$2.53 per share,
with notional funding over
a period of 10 years. The
beneficial ownership of
the shares resides with the
participants, including the
voting and dividend rights.
No dealing in the shares
during the 10-year no-
tional funding period.
10 years
Affinity Group Scheme (AG) Southern Consortium
SPV Three Investments
(Pty) Ltd and Eastern
Consortium SPV Three
Investments (Pty) Ltd
Each SPV was issued an
equal number of restricted
shares at N$1 per share,
with notional funding over
a period of 10 years. The
beneficial ownership of
the shares resides with the
participants, including the
voting and dividend rights.
No dealing in the shares
during the 10-year no-
tional funding period.
10 years
Benefit scheme in respect of
higher education (Education
Scheme)
The Old Mutual and
Nedbank Namibia
Education Trust
Each SPV was issued an
equal number of restricted
shares at N$1 per share,
with notional funding
over a period of 10 years.
The beneficial ownership
of the shares resides with
the participants, including
the voting and dividend
rights.
No dealing in the shares
during the 10-year
notional funding period.
10 years
107
Notes to the Annual Financial Statements (cont)for the year ended 31 December 2007
41.
41.1
SHARE-BASED PAYMENTS (cont)
Description of arrangements (cont)
Scheme Trust Description Vesting requirements
Maximum
term
Black Economic Empowerment schemes - Business partners and affinity groups (cont)
NedNamibia Discretionary
Scheme
NedNamibia Holdings
Discretionary Trust
Restricted shares were
granted to certain black
employees. The beneficial
ownership of the shares re-
sides with the participants,
including the voting and
dividend rights.
The trust shall hold the
scheme shares linked to
the respective Benefi-
ciary Participation Allo-
cations, for the benefit
of the Beneficiaries until
the Exercise Date.
10 years
Black Economic Empowerment schemes - Employees
Black Management Scheme (Black
Management)
Ofifiya Black
Management Trust
Restricted shares and share
options were granted to
certain black employees on
middle and senior manage-
ment level. The beneficial
ownership of the shares re-
sides with the participants,
including the voting and
dividend rights.
Participants must remain
in service for four, five
and six years, after each
of which 1/3 of the shares
become unrestricted and
1/3 of the options vest.
7 years
Broad-based Employee Scheme
(Broad-based)
Ofifiya Broad-based
Employee Trust
Restricted shares granted
to all qualifying employ-
ees who do not participate
in any other share incen-
tive scheme operating in
the group. The beneficial
ownership of the shares re-
sides with the participants,
including the voting and
dividend rights.
No dealing in the shares
during the restricted pe-
riod of 5 years.
5 years
NedNamibia Holdings Long-term
Incentive Scheme (LTIP)
NedNamibia Holdings
Long-term Incentive
Scheme Trust
Restricted shares and op-
tions awarded to all eligible
employees to promote the
continued growth of Ned-
Namibia Holdings Limited
and to attract and retain
suitably skilled and compe-
tent personnel. The benefi-
cial ownership of the shares
resides with the partici-
pants, including the voting
and dividend rights.
Participants must remain
in service of NedNamibia
Holdings Limited or any
one of its subsidiaries
to qualify as eligible
employees.
3 years
108
Share-based payments expense
Share-based payments liability/
reserve
2007 2006 2007 2006
N$’000 N$’000 N$’000 N$’000
41.
41.2
SHARE-BASED PAYMENTS (cont)
Effect on profit and financial position
Black Economic Empowerment schemes
Black Business Partners (BBP) - 8,997 8,997 8,997
Affinity Groups (AG) - 3,299 3,299 3,299
Education - 4,398 4,398 4,398
Discretionary - - - -
LTIP - - - -
Black Management 874 41 915 41
Broad-based - 4,965 - -
874 21,700 17,609 16,735
2007 2006
Number of
instruments
Weighted
average exercise
price
Number of
instruments
Weighted
average exercise
price
N$ N$
41.3 Black Economic Empowerment schemes
Black Business Partner Scheme
Outstanding at beginning of the year 199,929 278.98 - -
Granted - - 199,929 278.98
Forfeited - - - -
Exercised - - - -
Expired - - - -
Outstanding at end of year 199,929 278.98 199,929 278.98
Exercisable at end of year - - - -
Weighted average share price for options exercised (N$) - -
Affinity Group Scheme
Outstanding at beginning of the year 74,048 282.47 - -
Granted - - 74,048 282.47
Forfeited - - - -
Exercised - - - -
Expired - - - -
Outstanding at end of year 74,048 282.47 74,048 282.47
Exercisable at end of year - - - -
Weighted average share price for options exercised (N$) - -
109
2007 2006
Number of
instruments
Weighted
average exercise
price
Number of
instruments
Weighted
average exercise
price
N$ N$
41. SHARE-BASED PAYMENTS (cont)
41.3 Black Economic Empowerment schemes (cont)
Education Scheme
Outstanding at beginning of the year 98,730 282.47 - -
Granted - - 98,730 282.47
Forfeited - - - -
Exercised - - - -
Expired - - - -
Outstanding at end of year 98,730 282.47 98,730 282.47
Exercisable at end of year - - - -
Weighted average share price for options exercised (N$) - -
Discretionary Scheme
Outstanding at beginning of the year - 282.58 - -
Granted - - - 282.58
Forfeited - - - -
Exercised - - - -
Expired - - - -
Outstanding at end of year - 282.58 - 282.58
Exercisable at end of year - - - -
Weighted average share price for options exercised (N$) - -
LTIP Scheme
Outstanding at beginning of the year - 101.29 - -
Granted - - - 101.29
Forfeited - - - -
Exercised - - - -
Expired - - - -
Outstanding at end of year - 101.29 - 101.29
Exercisable at end of year - - - -
Weighted average share price for options exercised (N$) - -
Notes to the Annual Financial Statements (cont)for the year ended 31 December 2007
110
2007 2006
Number of
instruments
Weighted
average exercise
price
Number of
instruments
Weighted
average exercise
price
N$ N$
41. SHARE-BASED PAYMENTS (cont)
41.3 Black Economic Empowerment schemes (cont)
Black Management Scheme
Outstanding at beginning of the year 75,400 77.92 - -
Granted - - 75,400 77.92
Forfeited - - - -
Exercised - - - -
Expired - - - -
Outstanding at end of year 75,400 77.92 75,400 77.92
Exercisable at end of year - - - -
Weighted average share price for options exercised (N$) - -
Broad-based Scheme
Outstanding at beginning of the year 39,816 - - -
Granted - - 39,816 -
Forfeited - - - -
Exercised - - - -
Expired - - - -
Outstanding at end of year 39,816 - 39,816 -
Exercisable at end of year - - - -
Weighted average share price for options exercised (N$) - -
111
2007 2006
Number of
instruments
Weighted
average
remaining
contractual life
(years)
Number of
instruments
Weighted
average
remaining
contractual life
(years)
41.
41.4
SHARE-BASED PAYMENTS (cont)
Instruments outstanding at the end of the year by
exercise price
BlackBusinessPartnerScheme
278.98 199,929 9.00 199,929 10.00
199,929 9.00 199,929 10.00
AffinityGroupScheme
282.47 74,048 9.00 74,048 10.00
74,048 9.00 74,048 10.00
EducationScheme
282.47 98,730 9.00 98,730 10.00
98,730 9.00 98,730 10.00
DiscretionaryScheme
282.58 - 10.00 - 10.00
- 10.00 - 10.00
LTIPScheme
101.29 - 4.00 - 4.00
- 4.00 - 4.00
BlackManagementScheme
0.00 17,396 4.00 17,396 5.00
101.29 58,004 6.00 58,004 7.00
75,400 5.50 75,400 6.50
Broad-basedScheme
0.00 39,816 - 39,816 -
39,816 - 39,816 -
Notes to the Annual Financial Statements (cont)for the year ended 31 December 2007
112
41. SHARE-BASED PAYMENTS (cont)
41.5 Instruments granted during the year
The weighted average fair value has been calculated using the Black-Scholes option pricing model, using the following inputs and
* Volatility is determined using expected volatility for all shares listed on the JSE.
** The dividend yield used for the grants made has been based on forecast dividends.
113
Notes to the Annual Financial Statements (cont)for the year ended 31 December 2007
42. RELATED PARTY DISCLOSURE
42.1 Parent company
NedNamibia Holdings Limited’s majority shareholder is Nedbank Group Limited (100% ) (2006: 90.5%), which is incorporated in South Africa. The ultimate holding company is Old Mutual Plc. The subsidiaries and associates of these companies are also seen as related companies.
42.2 Identity of related parties with whom transactions have occurred
Subsidiaries and the associate of the group are identified in note 10. All of these entities are related parties. Transactions with directors and director controlled entities are related party transactions.
Group Company
2007 2006 2007 2006
Relationship Transaction type N$’000 N$’000 N$’000 N$’000
42.3 Related party transactions and balances
The following related party transactions have been entered into:
Related party
Interest income
Nedbank Group Limited Holding company Product balance 10,018 8,827 - -
Total neither past due nor impaired 449,441 362,079 19,210 29,246 106,572 47,146 74,499 130,744 3,712 710 - - 1,375,168 - 170,545 2,769,072
127
Group Company
2007 2006 2007 2006
N$’000 N$’000 N$’000 N$’000
Classification: Renegotiated
Assets
Cash and balances with central bank - - - -
Government and public sector securities - - - -
Derivative financial instruments - - - -
Other short-term securities - - - -
Due from other banks - - - -
Loans and advances to customers 6,507 458,342 - -
- Home loans 6,227 419,589 - -
- Other loans and overdrafts
(including other loans and overdrafts to subsidiary companies) 280 25,651 - -
- Preference share finance - - - -
- Net leases and installment debtors - 13,102 - -
- Micro loans - - - -
Investment in subsidiaries and associates - - - -
Goodwill - - - -
Property and equipment - - - -
Computer software and development cost - - - -
Non-current assets classified as held for sale - - - -
Other assets - - - -
Total renegotiated 6,507 458,342 - -
The renegotiated loans and advances were not readily available for the 2006 financial year due to system restraints. To obtain a com-parative figure each loan and advance for 2006 was evaluated for any change in terms, interest or installment. When either one of these variables changed without a corresponding change in the prime interest rate the loan or advance was considered to be renegotiated for IFRS 7 purposes. This might not reflect an actual renegotiation. In 2007 the new system allowed the Bank to use an indicator to track any renegotiated loans and advances.
Notes to the Annual Financial Statements (cont)for the year ended 31 December 2007
No risk AAABBB- to
BB+ BB+ to BB BB BB to BB- BB- to B+ B+ B+ to B B to B- B- to CCC CCC CCC to C DNon -IFRS7 Instruments Total
Total neither past due nor impaired - 2,000 - - - - - - - - - - - - 133,642 135,642
129
Notes to the Annual Financial Statements (cont)for the year ended 31 December 2007
46. LIQUIDITY RISK
Liquidity risk is the risk that an entity will encounter difficulty in meeting obligations associated with financial liabilities.
46.1 Liquidityriskmanagement
By monitoring the maturity profile of the current balance sheet as well as its expected future structure Alco proactively monitors this risk and is able to manage any potential mismatches in accordance with best banking practice. Refer to the section under the heading “Liquidity Risk” in the Corporate Governance report to the annual financial statements for more detail on liquidity risk manangement.
Up to 3 months
3 - 6 months
6 - 12 months 1 - 5 years
Over 5 years
Equity/Non-determined Total
N$’000 N$’000 N$’000 N$’000 N$’000 N$’000 N$’000
46.2 Expectedliquidityrisk
Group
2007
ASSETS
Cash and balances with central bank 119,234 - - - - - 119,234
Government and public sector securities 153,521 39,138 69,127 74,944 8,735 - 345,465
Provision for post-retirement medical benefits - - - - - 5,073
Other liabilities - - - - - 127,182
Totalliabilities 2,282 4,385,608
* The possible income statement effect has been determined by applying the possible change in currency to the outstanding balance
reported at year end. The possible change in currency can be either positive or negative and the figures reflected above are in absolute
format. The possible change is based on forward rates for a 12 month period instrument by applying expectations determined by
Nedbank Group Limited.
139
Notes to the Annual Financial Statements (cont)for the year ended 31 December 2007
49. INTERESTRATERISK
Interest rate risk is the risk that the fair value or future cash flows of a financial instrument will fluctuate because of changes in market interest rate.
49.1 Interestrateriskmanagement
Interest rate risk is assessed through the use of traditional gap analysis techniques. Gap analysis measures the volumes of assets and liabilities subject to repricing within a given period. For this purpose assets and liabilities are classified according to their contractual repricing characteristics. Through the use of balance sheet stress testing and net interest income scenarios the impact of interest rate movements and risk concentrations can be identified and measured. Strategies are then developed for mitigating such risks. Refer to the section under the heading “Interest Rate Risk” in the Corporate Governance report to the annual financial statements for more detail on interest rate risk manangement.
Up to 3 months
3 - 6 months
6 - 12 months
1 - 5 years
Over 5 years
Non-interestsensitive Total
N$’000 N$’000 N$’000 N$’000 N$’000 N$’000 N$’000
49.2 Interestrateriskanalysis
Group
2007
ASSETS
Cash and balances with central bank - - - - - 119,234 119,234Government and public sector securities 153,521 39,139 69,127 74,943 8,735 - 345,465Derivative financial instruments - - - 873 - 795 1,668Other short-term securities 30,163 - - - - - 30,163Due from other banks 403,848 - - - - - 403,848Loans and advances to customers 4,079,963 - - - - 27,418 4,107,381Investment in subsidiaries and associates - - - - - 28,054 28,054Goodwill - - - - - 27,623 27,623Property and equipment - - - - - 99,538 99,538Computer software and development cost - - - - - 14,441 14,441Non-current assets classified as held for sale - - - - - 31,496 31,496Other assets - - - 75,283 - 180,953 256,236Totalassets 4,667,495 39,139 69,127 151,099 8,735 529,552 5,465,147LIABILITIES