31
0 NEEDS ASSESSMENT Medical Outreach – Indigenous Chronic Disease Program July 2017

0
NEEDS ASSESSMENT
Medical Outreach – Indigenous Chronic Disease
Program
July 2017

1

2
Executive Summary
The Medical Outreach Indigenous Chronic Disease Program (MOICDP) provides funding to improve
access to general practitioners (GPs), medical specialists, allied health and other health providers for
Aboriginal and Torres Strait Islander people across Australia.
In Victoria, MOICDP is administered by the Rural Workforce Agency Victoria (RWAV), and in the
previous financial year, the program contracted 73 health providers across 24 health disciplines to
deliver 1482 occasions of service or visits across Victoria.
The recent availability of data at a local level presents a new opportunity to adopt a place-based
approach in administrating this program to target areas of high need or health inequalities. The data
suggests that there is geographic variation in health outcomes across Aboriginal and Torres Strait
Islander populations that may be linked to the misdistribution of health service provision or
interventions (e.g. an appropriate medical workforce).
The majority of the paper investigates the rate of hospital admissions as it suggests that many would
have been avoided had there been appropriate and adequate community-based or primary health
services in place. Table 1 highlights the Indigenous Areas (IARE) that had rates of hospitalisations,
per condition type, above the Victorian average. IAREs above the Victorian proportion in early
childhood development vulnerability have also been identified.
Although preliminary consultation was undertaken in the 2016-17FY, the purpose of this document
is to become a point for continued discussion and engagement with local service providers,
particularly in the context of limited regional health workforce data to truly understand demand and
supply issues. This specifically also applies to Primary Health Networks (PHN), as it presents an
opportunity to collaborate and align resources in the commissioning of primary health services to
adequately meet the health needs of the local Aboriginal and Torres Strait Islander population.
The table below provides an overview of the key findings and emerging recommendations:
Determinants of health
Key findings:
Understanding the social determinants of health provides an indication or rationale for the prevalence or incidents of current health issues faced by Aboriginal and Torres Strait Islander people.
Socioeconomic status is characterised by factors such as income, employment status and level of education attained. Low socioeconomic status is linked with poorer health outcomes and status, known as the socioeconomic gradient of health.
The socioeconomic gradient of health provides one explanation for the gap in health status between Aboriginal and Torres Strait Islander people and non-Aboriginal Australians, and the wide variation in health outcomes.
IAREs of low socioeconomic disadvantage (using the IRSEO score) appear consistently within the IAREs ranked with the highest rates of hospitalisation irrespective of condition type, and in areas with high proportion of children with developmental vulnerabilities.
Diabetes Key Findings:
Diabetes is a significant issues amongst Aboriginal and Torres Strait Islander communities, with the onset occurring at a younger age in comparison to non-Aboriginal populations
Hospitalisations due to diabetes occurs at four times the rate for Aboriginal populations compared to non-Aboriginal populations.
Of the data available, the average Victorian rate of hospitalisations per 100,000 Aboriginal persons for digestive systems was the highest for any condition/illness.

3
There is a strong association between areas of low socioeconomic disadvantage and hospitalisations for digestive system diseases.
Recommendations:
To address IAREs with high rates of hospitalisations for digestive system diseases. This may include the provision of allied health (e.g. diabetes educators, nutrition/dietetics, podiatry) and specialists (e.g. renal, endocrinology or nephrology physicians) in the following areas:
o Swan Hill o Mildura o Gippsland o Greater Dandenong
Cardiovascular disease (CVD)
Key Findings:
One in eight (13%) Aboriginal and Torres Strait Islander people reported as having some form of CVD.
Aboriginal and Torres Strait Islander people were almost twice as likely to be admitted to hospital for CVD than other Australians for every age group (except males aged 75 years and over)
The rates of circulatory system disease-related admissions to hospital by Aboriginal people were double the Victorian average in Swan Hill, Monash and Whitehorse.
Recommendations:
To address IAREs with high rates of hospitalisations for circulatory system diseases. This may include establishing, or enhancing, allied health (e.g. nutrition/dietetics, exercise physiologists) and cardiology services in the following areas:
o Swan Hill o Monash o Whitehorse
Chronic respiratory disease
Key Findings:
One third of the Aboriginal and Torres Strait Islander population reported having some form of respiratory disease, the most common being asthma.
In general, the rate of hospitalisations for COPD in Aboriginal and Torres Strait Islander people occurred at a rate five times that of non-Aboriginal people.
Recommendations:
To address IAREs with high rates of hospitalisations for respiratory system diseases. This may include the provision of allied health professionals (e.g. asthma educator) and respiratory physicians, with particular focus in the following areas:
o Swan Hill o Greater Dandenong
Chronic renal (kidney) disease (CKD)
Key Findings:
CKD is a serious health problem for many Aboriginal and Torres Strait Islander people with end state renal disease (ESRD) occurring seven times the rate of non-Aboriginal people. CKD also occurred at a younger age for Aboriginal people.
43% of the total hospital admissions among Aboriginal and Torres Strait Islander people are due to treatment for dialysis. The high rates of CKD and ESRD indicate a need for services focused on prevention and early intervention.
Recommendations:
While data on hospitalisations specifically related to CKD was not available, the significantly high rates of total hospital admissions in Swan Hill, in comparison to the rest of Victoria, instigate the need for allied health services such as nutrition, dietetics and physiotherapy, and specialist intervention from a nephrologist.

4
Cancer Key Findings:
On a national level, the age standardised rate (ASR) of all cancers was higher for Aboriginal and Torres Strait Islander people compared to their non-Aboriginal counterparts. The most common type is lung cancer, followed by breast, colorectal and prostate cancer.
Mortality rates for all cancers are higher for Aboriginal and Torres Strait Islander people than other Australians.
Recommendations:
Due to the lack of cancer specific data on Aboriginal and Torres Strait Islander people in Victoria, consultation with Victorian PHNs will need to be undertaken in order to identify and prioritise local cancer workforce needs. This is particularly relevant given that PHNs have been tasked with increasing participation in the three national cancer screening programs: breast, bowel and cervical cancer, particularly within hard-to reach groups such as Aboriginal and Torres Strait Islander people.
Mental health Key Findings:
Levels of high/very high psychological distress have been reported by a third (33%) of the Aboriginal and Torres Strait Islander population, which is three times the proportion reported by non-Aboriginal populations.
The rate of hospitalisations for mental health and behavioural problems was higher in Aboriginal and Torres Strait Islander populations located in metropolitan Victoria in comparison to regional/remote areas. Rates in Greater Dandenong were 3.5 times the Victorian average.
The rate of hospital admissions related to injury, poisoning and other external causes was highest in Ballarat and Swan Hill, which was double the Victorian average.
Recommendations:
To address IAREs with high rates of hospitalisations related to mental health and behavioural issues, and injury through the provision of mental health care providers, with particular attention in the following areas:
o Greater Dandenong o Knox o Northcote-Preston-Whittlesea o Ballarat o Swan Hill
Early childhood development
Key Findings:
The proportion of Aboriginal children (aged 0-14) was higher in rural/regional IAREs than metropolitan areas.
Although improved in recent years, the proportion of Aboriginal children developmentally vulnerable remains above that of non-Aboriginal children.
The proportion of children developmentally vulnerable was highest in Southern Grampians and Latrobe.
Recommendations:
To address IAREs with high proportions of children assessed as developmentally vulnerable, particularly in the following areas:
o Southern Grampians – Glenelg o Latrobe o Swan Hill o Mildura o Gippsland

6
Table 1: IAREs with two or more ASR of hospitalisations above the Victorian average.

7
8
Table of contents
Executive Summary ................................................................................................................................. 2
List of Tables & Figures ........................................................................................................................... 8
Acronym list ............................................................................................................................................ 9
1. Introduction .................................................................................................................................. 10
1.1. About this report ........................................................................................................................ 10
1.2. Program Overview: Medical Outreach Indigenous Chronic Disease Program .......................... 10
1.3. Other Government Initiatives .................................................................................................... 11
1.3. Needs Assessment Methodology............................................................................................... 12
2. A snapshot of 2016-17 activity and consultations ........................................................................ 13
3. The social determinants of Health ................................................................................................ 16
4. MOICDP Priority Areas .................................................................................................................. 20
4.1. Diabetes .................................................................................................................................... 21
4.2. Cardiovascular disease .............................................................................................................. 22
4.3. Chronic respiratory disease....................................................................................................... 24
4.4. Chronic renal (kidney) disease ................................................................................................... 25
4.5. Cancer ....................................................................................................................................... 26
4.6. Mental health ............................................................................................................................ 26
4.7. Paediatrics ................................................................................................................................. 29
Appendix 1 ............................................................................................................................................ 31
List of Tables & Figures
Table 1: IAREs with two or more ASR of hospitalisations above the Victorian average. ....................... 6
Figure 1: Number of providers, visits and patients seen per Victorian PHN (1 July 2016 – 30 March
2017) ..................................................................................................................................................... 14
Table 2: Overview of services provided in 2016-17 under MOICDP and the service requested, by
condition type. ...................................................................................................................................... 15
Figure 2: Number of providers per health discipline in 2016-17. ......................................................... 16
Table 3: Long-term conditions for Aboriginal people per age group (2012-13)................................... 17
Table 4: IAREs with the highest Aboriginal and Torres Strait Islander population and corresponding
proportion of population aged 15 years and over. ............................................................................... 17
Table 5: Most socioeconomic disadvantaged IAREs in Victoria according to IRSEO (2011) ................ 18
Figure 3: IAREs with the highest proportion of unemployed Indigenous adults aged 15 years and over
in Victoria (2011) ................................................................................................................................... 18
9
Figure 4: IAREs with the highest proportion of low income Aboriginal families (2011) ...................... 19
Table 6: Health behavior risk factors of Aboriginal and Torres Strait Islander people ........................ 19
Figure 5: IAREs with the highest ASR of hospital admissions per 100,000 Aboriginal persons ............ 21
Figure 6: IAREs with the highest ASR of hospital admissions for digestive system diseases per 100,000
Aboriginal persons ................................................................................................................................ 22
Figure 7: IAREs with the highest ASR of hospital admissions for circulatory system diseases per
100,000 Aboriginal persons .................................................................................................................. 23
Figure 8: IAREs with the highest ASR of hospital admissions for respiratory system diseases per
100,000 Aboriginal persons .................................................................................................................. 24
Figure 9: IAREs with the highest ASR of hospital admissions for mental health related conditions per
100,000 Aboriginal persons (2012-13) .................................................................................................. 27
Figure 10: IAREs with the highest ASR of hospital admissions for injury, poisoning or other external
causes per 100,000 Aboriginal persons ................................................................................................ 28
Figure 11: IAREs with the highest proportion of children (aged 0-14) (2016)...................................... 29
Table 7: IAREs with the highest proportion of children developmentally vulnerable (2015) .............. 30
Acronym list
AATSIHS Australian Aboriginal and Torres Strait Islander health survey
ABS Australian Bureau of Statistics
ACSQHC Australian Commission on Safety and Quality in Health Care
AEDC Australian Early Development Census
AIHW Australian Institute of Health and Welfare
ASR Age standardised rate
COPD Chronic obstructive pulmonary disease
CKD Chronic kidney disease
CVD Cardiovascular disease
ENT Ear, nose and throat infections
ERP Estimated Resident Population
ESRD End stage renal disease
GP General Practitioner
MOICDP Medical Outreach – Indigenous Chronic Disease Program
PHN Primary Health Network
RWAV Rural Workforce Agency Victoria

10
1. Introduction
Rural Workforce Agency Victoria (RWAV) is a non-government funded organisation that specialises
in the recruitment, placement and support of GPs, nurses and allied health professionals.
Established in 1998, RWAV was formed in response to the substantial general practice shortages in
rural and remote areas. RWAV is an experienced administrator of health outreach programs, having
operated the Medical Specialists Outreach Assistance Programs (MSOAP) in Victoria for over a
decade.
1.1. About this report
The purpose of this document is to articulate the health workforce needs and priorities based on the
geographic variation of health outcomes experienced by Aboriginal and Torres Strait Islander people.
Based on the 2016 Census, approximately 47,500 Aboriginal and Torres Strait Islander people live in
Victoria, equating to 0.8% of the state’s population.1 This also represents a population growth of
14.6% since the previous Census in 2011. However, as a population group, Aboriginal and Torres
Strait Islander people experience greater health disadvantage in comparison to non-Indigenous
people. For example, they are more likely to die at younger ages and have a higher prevalence to
many chronic illnesses.2
However, recently available data indicates that health disadvantage and disparities in health
outcomes occurs across Aboriginal and Torres Strait Islander communities living in Victoria.
According to the Australian Commission on Safety and Quality in Health Care (ACSQHC) (2017),
variation can indicate that people are either missing out on care they require, or are not receiving
adequate care Moreover, it represents an opportunity for the health system to improve as it
highlights:
the inequity of health access and the need to deliver services more fairly; and
inadequate system supports for appropriate care, and the need for training or financial
incentives.3
This report demonstrates that geographic health inequalities exist for Aboriginal and Torres Strait
Islander communities across Victoria and as such, offers a targeted place-based approach in
allocating resources or, more specifically, administering the Medical Outreach Indigenous Chronic
Disease Program (MOICDP).
1.2. Program Overview: Medical Outreach Indigenous Chronic Disease
Program
The MOICDP was established to increase access for Aboriginal and Torres Strait Islander people to a
range of health services to manage chronic diseases.
The objectives of the program are to:
increase access to multidisciplinary team based care in primary health care settings;
increase the range of services offered by visiting health professionals to prevent, detect and
manage chronic disease more effectively; and
1 Australian Bureau of Statistics. Australian Demographic Statistics, December 2016. Cat. No. 3101.0 (Released 27/6/2017) 2 Australian Institute of Health and Welfare. (2016). Australia’s health 2016: in brief. Cat. no. AUS 201. Canberra: AIHW. 3 Australian Commission on Safety and Quality in Health Care. (2017). The Australian Atlas of Healthcare Variation. Sydney: ACSQHC. Retrieved from: http://www.safetyandquality.gov.au
11
improve access to culturally competent clinical services in rural, remote and urban areas.
Services delivered to Aboriginal and Torres Strait Islander communities in Australian Standard
Geographic Classification – Remote Areas (ASGC-RA) 1-5 are eligible to be supported under this
program.
The focus areas of MOICDP are:
diabetes;
cardiovascular disease;
chronic respiratory disease;
chronic renal (kidney) disease; and
cancer.
Chronic diseases outside the five specified above as considered by the Australian Government on a
case-by-case basis. In previous financial years, mental health and paediatric outreach services have
also been funded by RWAV under the MOICDP. Mental health has also become increasingly, and is
significantly, prevalent in Aboriginal and Torres Strait Islander Australians. While the proportion of
Aboriginal and Torres Strait Islander children developmentally ‘on track’ has improved, it still
remains below the proportion in non-Aboriginal children. For these reasons, mental health and
paediatrics has also been considered and explored in this report.
1.3. Other Government Initiatives
When interpreting this document, it is important to acknowledge the various government initiatives
(both state and national) that are also committed to improving health outcomes for Aboriginal and
Torres Strait Islander communities across Victoria.
Specifically, there are two government initiatives that will need to be considered in actioning the
findings and, subsequent, recommendations of this document.
The MOICDP falls under the Indigenous Australians’ Health Programme that was established by the
Australian Government in July 2014 as a commitment to closing the gap in disadvantage between
Aboriginal and Torres Strait Islander people and non-Aboriginal Australians, particularly in health
outcomes. Another program funded under the Indigenous Australian’s Health Programme is the
Integrated Team Care (ITC) Activity, which is administered by the Primary Health Networks (PHNs)
and managed by the organisations they commission.
The ITC Activity consolidates the Care Condition and Supplementary Services (CCSS) and Improving
Indigenous Access to Mainstream Primary Care (IIAMPC) activities by establishing integrated
Indigenous health teams comprising of Indigenous Health Project Officers, Aboriginal and Torres
Strait Islander Outreach Workers and Care Coordinators. The team works within their PHN region to
assist Aboriginal and Torres Strait Islander people to obtain primary health care as required, provide
care coordination services, and improve access to culturally appropriate mainstream primary care.
In addition to the ITC Activity, PHNs have also been tasked with commissioning a range of primary
health services, based on community need, in the areas of mental health and suicide, chronic
disease, alcohol and other drugs (AoD), cancer screening and, broadly, Aboriginal and Torres Strait
Islander health. Commissioned health services will need to be supported by an adequate workforce
to improve the health outcomes of the community. As such, this report can provide an important
basis for discussion with rural PHNs to collaborate and channel resources to address areas most in
need.

12
On a state level, Koolin Balit represents the Victorian Government’s strategic direction for Aboriginal
Health in 2012-22. Launched in May 2012, Koolin Balit is based on the vision to significantly improve
the quality and length of life of Aboriginal and Torres Strait Islander people in Victoria. Achieving
this vision will involve investment in initiatives (or enablers) that will:
improve data and evidence to strengthen the evidence base to improve practice;
develop strong Aboriginal organisations by assisting the management capability of ACCHOs
and increasing capacity of the workforce; and
enhance the cultural responsiveness of all Victorian health services to ensure Aboriginal and
Torres Strait Islander people receive respect and high quality care.
1.3. Needs Assessment Methodology
To understand the health needs and priorities of Aboriginal and Torres Strait Islander communities
across Victoria, the following methodology was applied:
1. Consultation was undertaken with the Aboriginal community-controlled health organisations
(ACCHO) in Victoria during the 2016-17FY.
2. A desktop search was undertaken in July 2017 to source publically available data and
information. The data was then pooled and analysed according to the MOICDP priority
areas.
As per the MOICDP guidelines, data has been presented for all of Victoria according to the six PHN
regions: Murray, Western Victoria, Gippsland, North Western Melbourne, Eastern Melbourne and
South Eastern Melbourne.
As this report suggests an allocation of resources that is aligned to geographic areas of variation, a
consistent methodology has been applied to alleviate bias. Only data that was collected and
measured consistently across Victoria has been included. This limited the findings to publically-
available data, and excluded information collected specifically by each individual PHN, such as key
findings from local consultations.
Appendix 1 outlines the population health data collected to inform this report and identify the
priority areas.
Age standardised rates (ASR) and proportions, rather than absolute numbers, have been used to
enable areas across Victoria to be ranked comparatively and compared over time.
Identifying priority or ‘hotspot’ areas
In order to identify a geographic priority area, the following characteristics were considered:
the prevalence or incidence of a particular disease or health problem in the small geographic
area; and/or
an area of relatively high risk due to demographic factors such as low socio-economic status.
To identify areas of health inequality and poor health outcomes, this report has been determined by
analysing data available at the lowest level of statistical geographic area, and benchmarked against
the Victorian average. By doing so, the extent of variation between areas could be effectively
highlighted and as such, the emerging recommendations could be more specific in terms of locality.
Stakeholder input from the consultation process has been used to substantiate or support the
priority areas identified by the data.

13
Data limitations
Data that demonstrates the health of Aboriginal and Torres Strait Islander people on a localised level
is either limited or not available. This may be due to the small Aboriginal and Torres Strait islander
population groups across Victoria that are below the identifiable threshold. It may also be due to
issues relating to identification.
As such, data from the Australian Institute of Health and Welfare (AIHW) and the Australian Bureau
of Statistics (ABS) on Aboriginal and Torres Strait Islander health is primarily available at a state or
national level. That said, geographic variation in health outcomes could only be sourced from the
Aboriginal & Torres Strait Islander Social Health Atlas of Australia, which presents data by Indigenous
Area (IARE). Data was not available at a Statistical Area (SA) 3 or SA2 level. It should also be noted
that some data indicators, with the exception of population indicators, did not have data available
for every Victorian IARE, which is possibly due to the low numbers assessed or below the threshold.
Local data could not be sourced for the following health conditions or services that were requested
or highlighted by stakeholders during the consultation process: ear, nose and throat (ENT), and
musculoskeletal conditions.
Interpreting graphs:
Throughout this report, the graphs presented have been colour-coded according to the six Victorian PHNs:
Note: Some IAREs are located within two PHN regions. For example, Melbourne – Port Phillip falls within the North Western Melbourne and South Eastern Melbourne PHN region, and Melbourne-East falls within the South Eastern Melbourne and Eastern Melbourne PHN. In these circumstances, the most dominate PHN region in terms of land area has been used as a default.
2. A snapshot of 2016-17 activity and consultations
In 2016-17, RWAV funded 73 providers under 24 different medical specialties that delivered 1482
occasions of service or visits (between July 2016 – end of March 2018) to 4903 Aboriginal and Torres
Strait Islander people across Victoria.
An overview of the MOICDP activity, per PHN region, is highlighted in Figure 1. Murray PHN had the
most providers, in comparison to the other PHN regions, delivering services within its region.

14
Figure 1: Number of providers, visits and patients seen per Victorian PHN (1 July 2016 – 30 March 2017)
The total number of providers per health discipline is outlined in Figure 2. With 11 contracted
providers, the most of any health discipline, the most number of visits were completed by
podiatrists. In fact, 49% of the total providers contracted to deliver services under MOICDP were
allied health professionals (e.g. physiotherapists, psychologists, dietitians etc…), followed by 38% of
specialists (e.g. psychiatrists, endocrinologists, cardiologists etc...) and 12% of nurses.
An overview of the services provided, according to each ‘host’ organisation, is outlined in Table 2,
which also includes the types of services requested during the consultation process.

15
Table 2: Overview of services provided in 2016-17 under MOICDP and the service requested, by condition type.

16
Figure 2: Number of providers per health discipline in 2016-17.
3. The social determinants of Health
Chronic disease is a term for a group of diseases that have a prolonged course of illness with
persistent effects.
Chronic diseases are becoming increasingly more common in Australians due to an increasing and
ageing population. Improvements in medical care, and social and lifestyle changes has resulted in
people living longer with diseases and illnesses such as cancer, coronary heart disease and diabetes.4
As such, chronic disease are the leading cause of illness and death in Australia, with more than 11
million Australian having one type of chronic disease in 2014-15.5
However, the prevalence and impact of chronic disease is not the same for every Australian. Despite
the improvement in the health of Aboriginal and Torres Strait Islander people in recent years (such
as life expectancy and infant mortality), there continues to be a significant gap in health outcomes
between Indigenous and non-Indigenous Australians.6 This is particularly relevant to the prevalence
and incidence of chronic illnesses within Aboriginal and Torres Strait Islander communities, which is
distinct from early adulthood.
The most common long-term conditions, excluding mental health, for Aboriginal and Torres Strait
Islander people by age group is demonstrated in Table 3.
4 Australian Institute of Health and Welfare. (2016). Australia’s health 2016: in brief. Cat. no. AUS 201. Canberra: AIHW. 5 Australian Institute of Health and Welfare. (2016). Australia’s health 2016: in brief. Cat. no. AUS 201. Canberra: AIHW. 6 Australian Institute of Health and Welfare. (2016). Australia’s health 2016: in brief. Cat. no. AUS 201. Canberra: AIHW.
1
3
1
1
6
7
5
1
3
1
1
1
2
1
1
5
1
6
11
5
6
3
1
0 2 4 6 8 10 12
Cancer nurse
Cardiology
Community Nurse
Dermatology
Diabetes Nurse Educator
Dietitian
Endocrinologist
ENT
Exercise Physiologist
General Physician
Geriatrics
Maternal & Child Health Nurse
Nephrology
Obstetrics & Gynaecology
Occupational Therapist
Paediatrics
Phamacist
Physiotherapist
Podiatrist
Psychiatry
Psychology
Respiratory Physician
Social Worker
No. of providers
He
alth
dis
cip
line

17
Table 3: Long-term conditions for Aboriginal people per age group (2012-13)7
Age group
Rank 15 – 24 25 – 34 35 – 44 45 – 54 55+
1 Respiratory disease (29.9%)
Respiratory disease (36.9%)
Eye disease and vision problems (46.7%)
Eye disease and vision problems (87.2%)
Eye disease and vision problems (92.4%)
2 Eye disease and vision problems (22.0%)
Eye disease and vision problems (27.4%)
Respiratory disease (39.8%)
Musculoskeletal disease (47.0%)
Musculoskeletal disease (59.8%)
3 Musculoskeletal disease (12.7%)
Musculoskeletal disease (21.8)
Musculoskeletal disease (35.3%)
Respiratory disease (42.6%)
Endocrine, nutritional and metabolic diseases (47.4%)
4 Ear disease and hearing problems (8.3%)
Nervous system disease (13.7%)
Cardiovascular disease (18.9%)
Endocrine, nutritional and metabolic diseases (31.2%)
Cardiovascular disease (41.9%)
5 Nervous system disease (8.3%)
Cardiovascular disease (12.2%)
Endocrine, nutritional and metabolic diseases (16.5%)
Cardiovascular disease (28.2%)
Respiratory disease (40.7%)
In regards to population, Table 4 indicates the IAREs with the highest Aboriginal and Torres Strait
Islander population, together with the proportion of the population aged 15 years and over as
estimated by the Australian Government Department of Health in 2016.
Table 4: IAREs with the highest Aboriginal and Torres Strait Islander population and corresponding proportion of
population aged 15 years and over.
Rank IARE Total ERP (2016) Aboriginal persons,
aged 15-49 (%) Aboriginal persons
aged 50+ (%)
1 Campaspe – Shepparton – Moira 4663 59 14
2 Northcote – Preston – Whittlesea 3343 66 14
3 Mildura 2709 58 10
4 Gippsland 2656 58 14
5 Geelong – Queenscliff 2649 59 15
6 Wyndham - Altona 2395 65 15
7 Bendigo 2158 58 14
8 Cranbourne – Narre Warren 2021 66 15
9 Wodonga 1845 57 13
10 Frankston 1815 66 15
The socioeconomic gradient in health status
The social determinants of health assists to explain the gap in the average health status and the
variation in health outcomes between Aboriginal and non-Aboriginal Australians. A key determinant
of health are the social conditions in which people are born, live and work. A main component of this
is the socioeconomic gradient in health status, which implies that people with higher incomes live
longer and have better health in comparison to those with lower incomes. The socioeconomic
gradient or position is also influenced by other characteristics such as level of education attained,
employment status and occupation.
One method of assessing socioeconomic disadvantage across Aboriginal and Torres Strait Islander
communities is via the Indigenous Relative Socioeconomic Outcomes Index (IRSEO). Using Census
7 Australian Institute of Health and Welfare. (2016). Australia’s health 2016: in brief. Cat. no. AUS 201. Canberra: AIHW.

18
data, the IRSEO scores IAREs from 1 (most advantaged area) to 100 (most disadvantaged area).
There were 13 out of 34 IAREs that were above the average score of 29 for Victoria (see Table 5).
Table 5: Most socioeconomic disadvantaged IAREs in Victoria according to IRSEO (2011)
Rank IRSEO score IARE PHN
1 70 Swan Hill Murray
2 69 Mildura Murray
3 61 Wimmera Western Victoria
4 53 Latrobe Gippsland
5 50 Gippsland Gippsland
6 49 Campaspe – Shepparton - Moira Murray
7 48 Greater Dandenong South Eastern Melbourne
8 45 Warrnambool Western Victoria
9 40 Castlemaine - Kerang Murray
10 38 Wodonga Murray
11 38 Ballarat Western Victoria
12 36 Southern Grampians – Glenelg Western Victoria
13 36 Bendigo Murray
Figure 3 illustrates the IAREs with the highest proportion of unemployed Indigenous adults aged 15
years and over within the total number of Indigenous adults aged 15 years and over in the labour
force. The top nine IAREs with the highest proportion of unemployment were also areas of high
socioeconomic disadvantage identified in Table 5.
Figure 3: IAREs with the highest proportion of unemployed Indigenous adults aged 15 years and over in Victoria (2011)
Unemployment can lead to financial hardship and the reliance on financial support or benefits from
the government. Although low income status (incomes under $20,799 per annum) can also be
linked to retirement status, it provides an indication of individual wellbeing and the ability to access
services. Figure 4 highlights the ten IAREs across Victoria with the highest ratio of low income
Aboriginal families. Apart from the two areas located within the North Western Melbourne PHN
region (Northcote – Preston – Whittlesea and Brimbank), the IAREs were all ranked above the
Victorian IRSEO average.
27.30%
23.50%21.10% 20.90%
19.50% 19.30%18.10% 17.80% 17.40% 17.00%
0.00%
5.00%
10.00%
15.00%
20.00%
25.00%
30.00%
UN
EMP
LOYE
D IN
DIG
ENO
US
AD
ULT
S A
GED
1
5 Y
EAR
S A
ND
OV
ER (
%)
Victorian average

19
Figure 4: IAREs with the highest proportion of low income Aboriginal families (2011)
Health and Risk Factors
The socioeconomic gradient in health status is also used to explain why people on lower incomes are
more likely to engage in more risky health behaviours, which can lead to biomedical risk factors (e.g.
increased blood pressure or obesity) that are major contributors to the development of a chronic
disease. In general, the prevalence of major behavioural and biomedical health risk factors is
generally higher in Aboriginal and Torres Strait Islander Australians than for other Australians.8
Risky health behavior, such as excessive smoking and alcohol consumption, physical inactivity and
poor nutrition, have contributed to the poorer health status of Aboriginal Australians. This is further
explored in Table 6, which highlights the results of the Australian Aboriginal and Torres Strait
Islander survey (AATSIHS) that was conducted in 2012-13.
Table 6: Health behavior risk factors of Aboriginal and Torres Strait Islander people9
Health behavior risk Status
Smoking and alcohol consumption
In 2012-13, 44% of Aboriginal Australians aged 15 and over reported being a current smoker. Aboriginal Australians were 2.6 times more likely to smoke daily in comparison to non-Aboriginal Australians.
The smoking rate for Aboriginal Australians aged 15 years and over has decreased from 51% to 44% between 2002 and 2012-13.
In 2012-13, 54% of Aboriginal Australians aged 15 years and over drank alcohol to a level at risk of harm (more than four standard rinks on a single occasion at least once in the past 12 months). After adjusting for differences in age structure, Aboriginal Australians were 1.1 times more likely to exceed the guidelines for single-occasion risk than non-Aboriginal Australians.
Physical inactivity Aboriginal and Torres Strait Islander adults were more likely to have not undertaken the recommended activity levels of physical activity in the last week compared to non-Aboriginal adults (64% vs. 56%)
Overweight and obesity
In 2012-13, 66% of Aboriginal and Torres Strait Islander people aged 15 years and over were obese or overweight according to their BMI. 10
8 Australian Institute of Health and Welfare. (2016). Australia’s health 2016: in brief. Cat. no. AUS 201. Canberra: AIHW. 9 Australian Institute of Health and Welfare. (2016). Australia’s health 2016: in brief. Cat. no. AUS 201. Canberra: AIHW. 10 Australian Bureau of Statistics. (2013). Australian Aboriginal and Torres Strait Islander Health Survey: First Results, Australia, 2012-13. Cat.no. 4727.0.55.001
18.30% 17.60%16.50%
15.40%14.20% 14.20% 13.60% 13.20% 13.00% 12.90%
0.00%
5.00%
10.00%
15.00%
20.00%
LOW
INC
OM
E A
BO
RIG
INA
L FA
MIL
IES
(%)
Victorian average

20
Aboriginal adults were 1.2 times more likely to be either obese or overweight in comparison to non-Indigenous adults.
Poor nutrition 97% of Aboriginal adults aged 15 years and over had inadequate fruit (2 serves) and/or vegetable (5-6 serves) intake as recommended by the 2013 National Health and Medical Research Council guidelines.
Key Findings:
Understanding the social determinants of health provides an indication or rationale for the prevalence or incident of current health issues faced by Aboriginal and Torres Strait Islander people.
Socioeconomic status is characterised by factors such as income, employment status and level of education attained. Low socioeconomic status is linked with poorer health outcomes and status, known as the socioeconomic gradient of health.
The socioeconomic gradient of health provides one explanation for the gap in health status between Aboriginal and Torres Strait Islander people and non-Aboriginal Australians, and the wide variation in health outcomes.
IAREs of low socioeconomic disadvantage (using the IRSEO score) appear consistently in the IAREs ranked with the highest rates of hospitalisations irrespective of condition type, and in areas with high proportion of children with developmental vulnerabilities.
4. MOICDP Priority Areas
Although the life expectancy of Aboriginal and Torres Strait Islander people has increased annually
by 0.3 for males and 0.1 for females since 2005-7, the life expectancy continues to be approximately
10 years less in comparison to other Australians.11 In 2013, the leading causes of death in Aboriginal
and Torres Strait Islander people were cardiovascular disease, cancer and injury (including self-
harm).12
Throughout this section, the rates of hospitalisations have been used to understand the geographic
variation of health outcomes in Aboriginal and Torres Strait Islander populations across Victoria
according to the MOICDP priority areas. This is based on the premise that many hospital admissions
could have been prevented if more effective non-hospital care (e.g. community-based or primary
care) was made available, particularly at the earlier stage of the disease progression.
In 2012-13, Aboriginal and Torres Strait Islander people had 2.7 times the rate of hospital admissions
than other Australians. Approximately 86% of this difference was due to same-day admissions for
kidney dialysis.13 With the removal of admissions for kidney dialysis, Aboriginal people were
hospitalised 1.2 times the rate of non-Aboriginal people.14
Figure 5 demonstrates the IAREs in Victoria with the highest ASR of hospital admissions per 100,000
Aboriginal persons. Swan Hill had significantly high rates, which was three times the Victorian
average.
11 Australian Institute of Health and Welfare. (2016). Australia’s health 2016: in brief. Cat. no. AUS 201. Canberra: AIHW. 12 Australian Indigenous HealthInfoNet. (2017). Summary of Aboriginal and Torres Strait Islander health, 2016. Retrieved 7 July 2017 from: http://www.healthinfonet.ecu.edu.au/health-facts/summary 13 Australian Institute of Health and Welfare. (2014). Australian hospital statistics 2012-13. Health services series no. 54. Cat. no. HSE145. Canberra: AIHW 14 Australian Institute of Health and Welfare. (2016). Australia’s health 2016: in brief. Cat. no. AUS 201. Canberra: AIHW

21
Figure 5: IAREs with the highest ASR of hospital admissions per 100,000 Aboriginal persons
4.1. Diabetes
Diabetes occurs when the level of glucose (sugar) in the blood are too high, which is caused by an
impairment of the body’s ability to produce or respond to insulin (a hormone produced by the
pancreas to control blood glucose levels).15 Persistent high blood glucose levels can led to serious
complications requiring hospitalisation due to kidney damage, nerve damage, visual problems or
heart disease. As such, effective management of diabetes requires a multi-disciplinary approach to
management involving various health practitioners, including GPs, medical specialists (e.g.
endocrinologists, ophthalmologists, cardiologists, nephrologists) and allied health professionals (e.g.
diabetes educators, dietitians, pharmacists, podiatrists).16
In the 2012-13 AATSHISH, diabetes was reported by 9% of Aboriginal and Torres Strait Islander
people, the level of which is three times higher than non-Aboriginal people. Diabetes affected
Aboriginal and Torres Strait Islander people at a younger age compared to non-Aboriginal people
and increased with age, from 5% for Aboriginal people aged 25-34 years and up to 40% for those
aged 55 years and over.17
In 2012-13, Aboriginal and Torres Strait Islander people were four times more likely to be
hospitalised for diabetes than their non-Aboriginal counterparts. The prevalence of hospital
admissions due to diabetes complication for Aboriginal and Torres Strait Islander people at a local
level across Victoria is not publically available. However, Figure 6 highlights the IAREs in Victoria
that had the highest ASR of hospital admission related to conditions affecting the digestive system.
Gastrointestinal tract symptoms, a common digestive system problem, is commonly reported by
people with diabetes.18 Swan Hill and Mildura, the most socio-disadvantaged IAREs in Victoria, had
the highest rates of hospitalisations related for conditions affecting the digestive system. In 2016-
17, the three IARES with the highest rates of hospitalisation were provided diabetes-related services
(e.g. diabetes educators and podiatry) under MOICDP. Of the areas identified in Figure 6, only
15 Australian Institute of Health and Welfare. Diabetes. Retrieved from: http://www.aihw.gov.au/diabetes (last updated December 2016) 16 Australian Institute of Health & Welfare. (2004). Diabetes management and the allied health workforce: An overview of workforce mapping techniques and data related issues. Retrieved from: http://www.aihw.gov.au/WorkArea/DownloadAsset.aspx?id=6012954Lac6225 17 Australian Indigenous HealthInfoNet. (2017). Summary of Aboriginal and Torres Strait Islander health, 2016. Retrieved 7 July 2017 from: http://www.healthinfonet.ecu.edu.au/health-facts/summary 18 Bytzer et al. (2001). Prevalence of Gastrointestinal Symptoms Associated with Diabetes Mellitus. Archives of Internal Medicine, 161 (16), pp. 1989-1996.
110182
57310 5631849133
43823 43605 42479 41085 40434 40197
0
20000
40000
60000
80000
100000
120000
ASR
OF
HO
SPIT
AL
AD
MIS
SIO
NS
PER
1
00
,00
0 A
BO
RIG
INA
L P
ERSO
NS
Victorian rate

22
Campaspe-Shepparton-Moira (Njernda Aboriginal Health Clinic) and Greater Dandenong (Bunurong
Aboriginal Health Service) requested the provision of diabetes services during the consultation
process.
Figure 6: IAREs with the highest ASR of hospital admissions for digestive system diseases per 100,000 Aboriginal persons
Key Findings:
Diabetes is a significant issues amongst Aboriginal and Torres Strait Islander communities, with the onset occurring at a younger age in comparison to non-Aboriginal populations
Hospitalisations due to diabetes occurs at four times the rate for Aboriginal populations compared to non-Aboriginal populations.
Of the data available, the average Victorian rate of hospitalisations per 100,000 Aboriginal people for digestive systems was the highest for any condition/illness.
There is a strong association between areas of low socioeconomic disadvantage and hospitalisations for digestive system diseases.
Recommendations:
To address IAREs with high rates of hospitalisations for digestive system diseases. This may include the provision of allied health (e.g. diabetes educators, nutrition/dietetics, podiatry) and specialists (e.g. renal, endocrinology or nephrology physicians) in the following:
o Swan Hill o Mildura o Gippsland o Greater Dandenong
4.2. Cardiovascular disease
Cardiovascular disease (CVD) refers to a group of diseases or conditions involving the heart and
blood vessels within the cardiovascular or circulatory system. The most common types of CVD are
coronary heart disease, stroke and heart failure.19 Smoking, being overweight, poor nutrition and
being physically inactive are risk factors for CVD.
19 Australian Institute of Health and Welfare. (2011). Cardiovascular disease: Australian facts 2011. Cardiovascular disease series. Cat. no. CVD 53. Canberra: AIHW
4606 45574198
40093719 3696
34733114 3015 2955
0
500
1000
1500
2000
2500
3000
3500
4000
4500
5000
ASR
OF
HO
SPIT
AL
AD
MIS
SIO
NS
FOR
D
IGES
TIV
E SY
STEM
DIS
EASE
PER
1
00
,00
0 A
BO
RIG
INA
L P
ERSO
NS
Victorian rate

23
In the 2012-13 AATSIHS, one in eight (13%) Aboriginal and Torres Strait Islander people reported as
having some form of CVD and one in 25 (4%) indicated that they had experienced a form of heart,
stroke and/or vascular disease.20
Aboriginal and Torres Strait Islander people were almost twice more likely to be admitted to hospital
for CVD than other Australians for every age group except for males aged 75 years and over.21 The
rate of hospital admissions related to a CVD in Aboriginal and Torres Strait Islander people living in
Victoria is illustrated in Figure 7.
Three Victorian areas had rates more than double the Victorian average: Swan Hill, Monash and
Whitehorse (2455, 2442 and 2430 respectively, compared to 1153 per 100,000 Aboriginal persons).
This may suggest the need for cardiology services to meet this demand but also for services that
support prevention and early intervention such as nutrition and dietetics. In 2016-17, cardiology
services were provided in Mildura, Campaspe – Shepparton – Moira and Swan Hill.
Figure 7: IAREs with the highest ASR of hospital admissions for circulatory system diseases per 100,000 Aboriginal persons
Key Findings:
One in eight (13%) Aboriginal and Torres Strait Islander people reported as having some form of CVD.
Aboriginal and Torres Strait Islander people were almost twice as likely to be admitted to hospital for CVD than other Australians for every age group (except males aged 75 years and over)
The rates of circulatory system disease-related admissions to hospital by Aboriginal people were double the Victorian average in Swan Hill, Monash and Whitehorse.
Recommendations:
To address IAREs with high rates of hospitalisations for circulatory system diseases. This may include establishing, or enhancing, allied health (e.g. nutrition/dietetics, exercise physiologists) and cardiology services in the following areas:
o Swan Hill o Monash o Whitehorse
20 Australian Indigenous HealthInfoNet. (2017). Summary of Aboriginal and Torres Strait Islander health, 2016. Retrieved 7 July 2017
from: http://www.healthinfonet.ecu.edu.au/health-facts/summary 21 Australian Institute of Health and Welfare. (2015). Cardiovascular disease, diabetes and chronic kidney disease – Australian facts: Aboriginal and Torres Strait Islander people. Cardiovascular, diabetes and chronic disease series no. 5. Cat. no. CDK 5. Canberra: AIHW
2455 2442 2430
2021 2012
1656 1618 1595 1549 1474
0
500
1000
1500
2000
2500
3000
ASR
OF
HO
SPIT
AL
AD
MIS
SIO
NS
FOR
C
IRC
ULA
TOR
Y SY
STEM
DIS
EASE
PER
1
00
,00
0 A
BO
RIG
INA
L P
ERSO
NS
Victorian rate

24
4.3. Chronic respiratory disease
Chronic respiratory disease affects the airways and others structures of the lung. This includes
chronic obstructive pulmonary disease (COPD), which is an umbrella term for a number of lung
disease that prevent proper breathing.22 The common types of COPD are chronic asthma, chronic
bronchitis and emphysema.23 While GPs play a key role in the early intervention and management
of COPD, a respiratory physician may also be involved to provide specialist care.24
About one third of Aboriginal and Torres Strait Islander people reported having a respiratory disease
in the 2012-13 AATSIHS.25 The most common respiratory disease, asthma, was reported as twice as
common for Aboriginal and Torres Strait Islander people than non-Aboriginal people.
Hospitalisations for respiratory system diseases occurred at a rate of 2.2 times in Aboriginal people
compared to non-Aboriginal people. For COPD, the rate of hospitalisation was five times for
Aboriginal populations than for non-Aboriginal populations.26
As highlighted in Figure 8, Swan Hill and Greater Dandenong had rates of respiratory disease
hospitalisations that were more than double the Victorian average rate (3562 and 3279,
respectively, in comparison to 1608 hospitalisations per 100,000 Aboriginal persons). In 2016-17,
respiratory services were only provided in the Northcote-Preston-Whittlesea area (via Plenty Valley
Community Health) and Gippsland (Lake Tyers Aboriginal Trust).
Figure 8: IAREs with the highest ASR of hospital admissions for respiratory system diseases per 100,000 Aboriginal persons
Key Findings:
One third of the Aboriginal and Torres Strait Islander population reported having some form of respiratory disease, the most common being asthma.
In general, the rate of hospitalisations for COPD in Aboriginal and Torres Strait Islander people occurred at a rate five times that of non-Aboriginal people.
22 Australian Institute of Health and Welfare. (2017). The burden of chronic respiratory conditions in Australia: a detailed analysis of the Australian Burden of Disease Study 2011. Australian Burden of Disease Study series no. 14. BOD 15. Canberra: AIHW 23 Better Health Channel. Lung conditions – chronic obstructive pulmonary disease (COPD). Retrieved from: http://www.betterhealth.vic.gov.au (last updated November 2013) 24 Abramson et al. (2016). COPD-X Concise Guide for Primary Care. Lung Foundation Australia; Brisbane. 25 Australian Bureau of Statistics. (2013). Australian Aboriginal and Torres Strait Islander Health Survey: First Results, Australia, 2012-13. Cat.no. 4727.0.55.001 26 Steering Committee for the Review of Government Service Provision. (2016). Overcoming Indigenous Disadvantage: Key Indicators 2016. Productivity Commission: Canberra.
35623279
3091 3069 3045
26512424 2293
1837 1780
0
500
1000
1500
2000
2500
3000
3500
4000
ASR
OF
HO
SPIT
AL
AD
MIS
SIO
NS
FOR
R
ESP
IRA
TOR
Y SY
STEM
DIS
EASE
S P
ER
10
0,0
00
AB
OR
IGIN
AL
PER
SON
S
Victorian rate

25
Recommendations:
To address IAREs with high rates of hospitalisations for respiratory system diseases. This may include the provision of allied health professionals (e.g. asthma educator) and respiratory physicians, with particular focus in the following areas:
o Swan Hill o Greater Dandenong
4.4. Chronic renal (kidney) disease
Kidneys remove and filter waste from the blood. When their function is reduced or damaged for at
least three months, it is referred to as chronic kidney disease (CKD). Known as the ‘silent disease’,
symptoms may be only identifiable when kidney function is reduced up to 90%.27 However, if
detected early, the progress of CKD can either be slowed or presented by diet and medication. When
kidney function is significant reduced or has stopped working, known as end stage renal disease
(ESRD), it is treated by regular dialysis or a kidney transplant.28
CKD is a serious health problem for many Aboriginal and Torres Strait Islander people with ESRD
almost seven times more common than for non-Aboriginal people.29 While ESRD usually occurs in
older age, for Aboriginal populations, it occurs in middle age.30
In 2013-14, CKD hospitalisations rates were five times higher among Aboriginal populations as
among non-Aboriginal populations (5192 and 1069 per 100,000 people respectively). Moreover, 43%
of the total hospital admissions among Aboriginal and Torres Strait Islander people were for dialysis
for the same period. 31 While, the rate of CKD-related hospitalisations according to IAREs is not
available, the total number of hospital admissions (see Figure 5) can provide an indication due to the
high proportion attributed to same-day admissions for dialysis.
In 2016-17, the only two renal services (via a nephrologist) were contracted under MOICDP were
provided at Northcote – Preston – Whittlesea (via Plenty Valley Community health) and Swan Hill.
Key Findings:
CKD is a serious health problem for many Aboriginal and Torres Strait Islander people with ESRD occurring at a rate seven times the of non-Aboriginal people. CKD also occurred at younger age in Aboriginal people.
43% of the total hospital admissions among Aboriginal and Torres Strait Islander people are due to treatment for dialysis. The high rates of CKD and ESRD indicate a need for services focused on prevention and early intervention.
Recommendations:
While data on hospitalisations specifically related to CKD was not available, the significantly high rates of total hospital admissions in Swan Hill, in comparison to the rest of Victoria, instigate the need for allied health services such as nutrition, dietetics and physiotherapy, and specialist intervention from a nephrologist.
27 Australian Institute of Health and Welfare. (2016). Chronic kidney disease. Retrieved 7 July 2017 from: http://www.aihw.gov.au/chronic-kidney-disease/ 28 Australian Indigenous HealthInfoNet. (2017). Summary of Aboriginal and Torres Strait Islander health, 2016. Retrieved 7 July 2017 from: http://www.healthinfonet.ecu.edu.au/health-facts/summary 29 Australian Indigenous HealthInfoNet. (2017). Summary of Aboriginal and Torres Strait Islander health, 2016. Retrieved 7 July 2017
from: http://www.healthinfonet.ecu.edu.au/health-facts/summary 30 Australian Institute of Health and Welfare. (2015). Cardiovascular disease, diabetes and chronic kidney disease – Australian facts: Aboriginal and Torres Strait Islander people. Cardiovascular, diabetes and chronic disease series no. 5. Cat. no. CDK 5. Canberra: AIHW 31 Australian Institute of Health and Welfare. (2015). Cardiovascular disease, diabetes and chronic kidney disease – Australian facts: Aboriginal and Torres Strait Islander people. Cardiovascular, diabetes and chronic disease series no. 5. Cat. no. CDK 5. Canberra: AIHW

26
4.5. Cancer
Cancer is a term used to describe a disease where abnormal cells divide without control and invade
nearby tissue. Examination of the incidence rates of positive cancer detection and cancer-related
deaths may indicate a need for medical specialties such as palliative or pain medicine, oncology or
radiology.32
However, data related to the prevalence or incidence of cancer amongst Aboriginal and Torres Strait
Islander people residing in Victoria is currently not available or considered insufficient for analysis.
However, on a national level, the ASR of all cancers was higher for Aboriginal and Torres Strait
Islander people compared to their non-Aboriginal counterparts (484 and 439 per 100,000 people,
respectively). The most common cancer type was lung cancer, followed by breast, colorectal and
prostate cancer. The age-standardised mortality rate for all cancers was also higher for Aboriginal
and Torres Strait Islander people than other Australians (221 and 171 per 100,000 people
respectively). The high rates are thought to be attributed to the higher prevalence of cancer-related
modifiable risk factors such as smoking and alcohol consumption, and lower participation in cancer
screening activities.33
Although cancer outreach services were only provided in one ACCHO (Rumbalara Aboriginal
Cooperative) in 2016-17, the need for the provision of similar services in other areas was not
identified during the consultation process.
Key Findings:
On a national level, the ASR of all cancers was higher for Aboriginal and Torres Strait Islander people compared to their non-Aboriginal counterparts. The most common type is lung cancer, followed by breast, colorectal and prostate cancer.
Mortality rates for all cancers are higher for Aboriginal and Torres Strait Islander people than other Australians.
Recommendations:
Due to the lack of cancer specific data on Aboriginal and Torres Strait Islander people in Victoria, consultation with Victorian PHNs will need to be undertaken in order to identify and prioritise local cancer workforce needs. This is particularly relevant given that PHNs have been tasked with increasing participation in the three national cancer screening programs: breast, bowel and cervical cancer, particularly within hard-to reach groups such as Aboriginal and Torres Strait Islander people.
4.6. Mental health
Mental health includes both mental illness and overall mental wellbeing.
Mental illness is a term used to describe a range of behavioural and psychological conditions that
influence an individual’s mental health functioning and quality of life. The most common mental
illnesses are depression, anxiety and substance-use disorder. Mental wellbeing can be affected by a
32 Cancer Council Australia. Find a specialist. Retrieved from: http://www.cancer.org.au/about-cancer/find-a-specialist.html (last updated Marcy 2017). 33 Australian Institute of Health and Welfare. (2017). Cancer in Australia 2017. Cancer series no. 101. Cat. no. CAN 100. Canberra: AIHW.

27
range of factors such as social disadvantage, family breakdown, domestic violence or physical health
problems.34
In 2014-15, a third (33%) of Aboriginal and Torres Strait Islander adults reported high/very high
levels of psychological distress, which is an increase of 6% since 2004-5. Following adjustments to
population age structures, the proportion was three times the proportion reported by non-
Aboriginal adults.35
In, 2014-15, the rate of hospitalisations for mental and behavioural disorders for Aboriginal and
Torres Strait Islander people was 1.8 times the rate non-Aboriginal populations. The hospitalisation
rate was higher in major cities in comparison to regional and remote areas. This is also similar to the
rates highlighted in Figure 9 where eight of the top 10 IAREs were within the three metropolitan
PHN regions. The ASR of mental health related hospital admissions were 3.5 times the Victorian
average (1608 per 100,000 Aboriginal persons) in Greater Dandenong, and three times the rate in
Knox.
Figure 9: IAREs with the highest ASR of hospital admissions for mental health related conditions per 100,000 Aboriginal
persons (2012-13)
Aboriginal and Torres Strait Islander populations experience a disproportionately high rates of
suicide, which has become increasingly prevalent in recent decades, particularly in young males.
Between 2010-14, the ASR of deaths from suicide in Aboriginal populations was double the rate of
non-Aboriginal populations.36
In terms of hospitalisations related to intentional self-harm, the rate for Aboriginal and Torres Strait
Islander people had increased by 56% in the period of 2004-5 to 2014-15, while the rate for other
Australians has remained relatively stable in comparison. Figure 10 highlights the IAREs with the
highest ASR of hospital admissions due to injury, positioning or external causes, although it is unclear
what proportion was caused by intentional self-harm. The rates for Ballarat and Swan Hill were
approximately double the Victorian average rate (2077 per 100,000 Aboriginal persons). Seven of
the top 10 IAREs were also identified among the most socio-disadvantaged areas in Victoria.
34 Steering Committee for the Review of Government Service Provision. (2016). Overcoming Indigenous Disadvantage: Key Indicators
2016. Productivity Commission: Canberra. 35 Steering Committee for the Review of Government Service Provision. (2016). Overcoming Indigenous Disadvantage: Key Indicators 2016. Productivity Commission: Canberra. 36 Steering Committee for the Review of Government Service Provision. (2016). Overcoming Indigenous Disadvantage: Key Indicators 2016. Productivity Commission: Canberra.
5625
4978
4017
3360
28042498 2450 2379 2375
2135
0
1000
2000
3000
4000
5000
6000
ASR
OF
HO
SPIT
AL
AD
MIS
SIO
NS
FOR
M
ENTA
L H
EALT
H R
ELA
TED
CO
ND
ITIO
NS
PER
10
0,0
00
AB
OR
IGIN
AL
PER
SON
S
Victorian rate
28
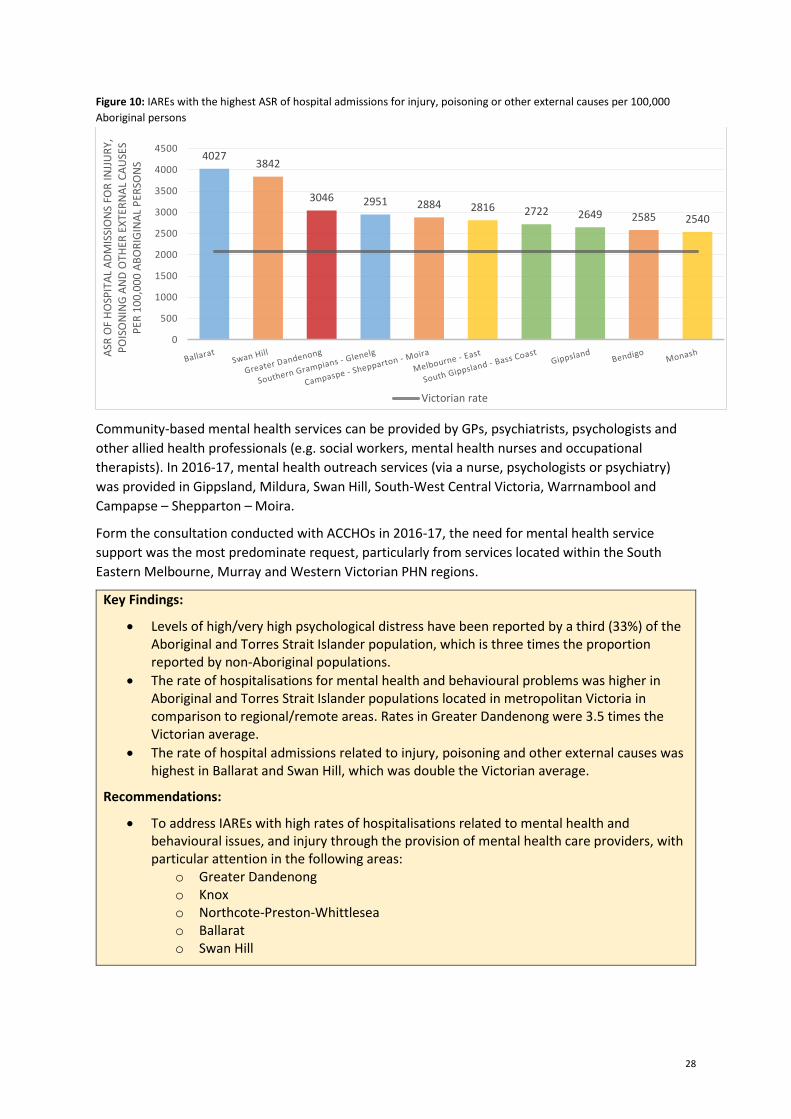
Figure 10: IAREs with the highest ASR of hospital admissions for injury, poisoning or other external causes per 100,000
Aboriginal persons
Community-based mental health services can be provided by GPs, psychiatrists, psychologists and
other allied health professionals (e.g. social workers, mental health nurses and occupational
therapists). In 2016-17, mental health outreach services (via a nurse, psychologists or psychiatry)
was provided in Gippsland, Mildura, Swan Hill, South-West Central Victoria, Warrnambool and
Campapse – Shepparton – Moira.
Form the consultation conducted with ACCHOs in 2016-17, the need for mental health service
support was the most predominate request, particularly from services located within the South
Eastern Melbourne, Murray and Western Victorian PHN regions.
Key Findings:
Levels of high/very high psychological distress have been reported by a third (33%) of the Aboriginal and Torres Strait Islander population, which is three times the proportion reported by non-Aboriginal populations.
The rate of hospitalisations for mental health and behavioural problems was higher in Aboriginal and Torres Strait Islander populations located in metropolitan Victoria in comparison to regional/remote areas. Rates in Greater Dandenong were 3.5 times the Victorian average.
The rate of hospital admissions related to injury, poisoning and other external causes was highest in Ballarat and Swan Hill, which was double the Victorian average.
Recommendations:
To address IAREs with high rates of hospitalisations related to mental health and behavioural issues, and injury through the provision of mental health care providers, with particular attention in the following areas:
o Greater Dandenong o Knox o Northcote-Preston-Whittlesea o Ballarat o Swan Hill
40273842
3046 2951 2884 2816 2722 2649 2585 2540
0
500
1000
1500
2000
2500
3000
3500
4000
4500
ASR
OF
HO
SPIT
AL
AD
MIS
SIO
NS
FOR
INJJ
UR
Y,
PO
ISO
NIN
G A
ND
OTH
ER E
XTE
RN
AL
CA
USE
S
PER
10
0,0
00
AB
OR
IGIN
AL
PER
SON
S
Victorian rate

29
4.7. Paediatrics
While not necessarily a chronic disease, assessing early childhood development identifies
opportunities to nurture young children so that they can do better in school and develop the skills to
be responsible and productive adults.37 Early childhood development can be managed and enhanced
from care provided by a paediatrician.
Approximately 34% of the Aboriginal and Torres Strait Islander population living in Victoria are
children aged between 0-14. Figure 11 highlights the IAREs with the highest proportion of children,
which were all above the Victorian proportion, specifically Mildura, Swan Hill and Wodonga.
Figure 11: IAREs with the highest proportion of children (aged 0-14) (2016)
The Australian Early Development Census (AEDC) is a population based measure that is used to
measure the development of children in Australia by the time they commence school. The AEDC
examines five domains of early childhood development: physical health and wellbeing, social
competence, emotional maturity, language and cognitive skills, and communication skills and
general knowledge. Examining the variation of the results geographical variation may provide an
indication of the need for specific health services (e.g. Paediatrician).
From 2009 to 2015, the proportion of Aboriginal and Torres Strait Islander children classified as
developmentally ‘on track’ increased from 48-61% to 59-63% in all domains. However, these results
still remains lower than those for non-Aboriginal children (between 76-86%).38
There were 13 IAREs that were above the overall Victorian proportion of children developmentally
vulnerable in one ore domains. These areas were also above the Victorian proportion of children
developmentally vulnerable in two or more domains, and areas with high proportions of Aboriginal
children. This is highlighted in Table 7. Approximately 72% of the children tested in the first year at
Southern Grampians – Glenelg were assessed as developmentally vulnerable in one or more domain.
However, almost half the children tested in Latrobe were developmentally vulnerable in two or
more domains.
In 2016-17, MOICDP provided funding to six paediatricians to deliver outreach services. These
services were delivered in Greater Dandenong, Campaspe – Shepparton – Moira and Wyndham –
Altona. A Maternal and Child nurse was also contracted to deliver services in Wimmera.
37 Steering Committee for the Review of Government Service Provision. (2016). Overcoming Indigenous Disadvantage: Key Indicators
2016. Productivity Commission: Canberra. 38 Steering Committee for the Review of Government Service Provision. (2016). Overcoming Indigenous Disadvantage: Key Indicators
2016. Productivity Commission: Canberra.
39.90% 39.30% 38.50% 38.10% 37.80% 37.40% 37.00% 37.00% 36.90% 36.70%
0.00%
5.00%
10.00%
15.00%
20.00%
25.00%
30.00%
35.00%
40.00%
45.00%
50.00%
AB
OR
IGIN
AL
PER
SON
S A
GED
0-1
4 (
%)
Victoria overall

30
Table 7: IAREs with the highest proportion of children developmentally vulnerable (2015)
PHN Area
No. of children assessed in
AEDC (first year of school)
% of children developmentally vulnerable in one or more domain
% of children developmentally vulnerable in two or more domains
Victoria (overall population in 2011-13) 19.9% 9.9%
Overall for Victorian Aboriginal and Torres Strait Islander population
40.3% 24.4%
Western Victoria Southern Grampians – Glenelg
18 72.2% 27.8%
Gippsland Latrobe 30 63.3% 46.7%
Murray Swan Hill 34 58.8% 32.4%
Gippsland Gippsland 72 58.3% 36.1%
Murray Mildura 70 55.7% 33.3%
Western Victoria Wimmera 18 55.6% 33.3%
North Western Melbourne
Moreland – Broadmeadows
18 55.6% 33.3%
Western Victoria Ballarat 38 55.3% 35.1%
Murray Wodonga 38 50.0% 26.3%
South Eastern Melbourne
Frankston 46 50.0% 34.8%
North Western Melbourne
Craigieburn – Sunbury
19 47.4% 31.6%
Murray Upper Goulburn Valley
19 47.4% 36.8%
Key Findings:
The proportion of Aboriginal children (aged 0-14) was higher in rural/regional IAREs than metropolitan areas.
Although improved in recent years, the proportion of Aboriginal children developmentally vulnerable remains above that of non-Aboriginal children.
The proportion of children developmentally vulnerable was highest in Southern Grampians and Latrobe.
Recommendations:
To address IAREs with high proportions of children assessed as developmentally vulnerable, particularly in the following areas:
o Southern Grampians – Glenelg o Latrobe o Swan Hill o Mildura o Gippsland
31
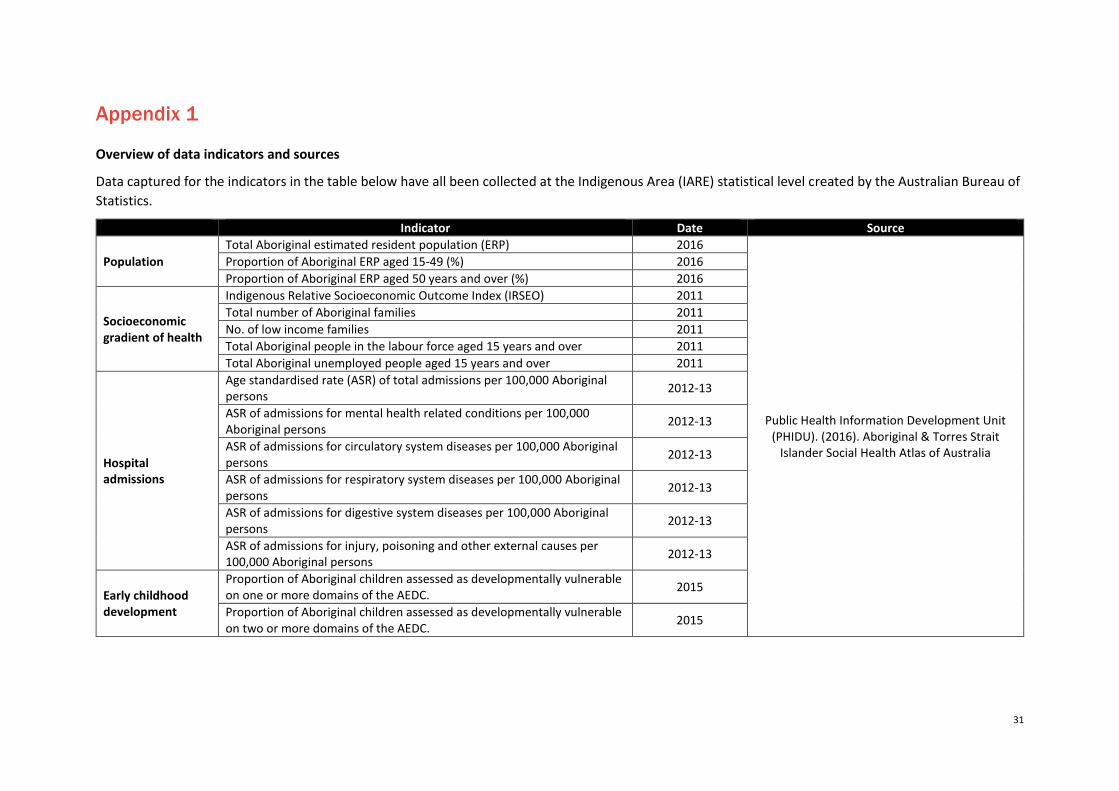
Appendix 1
Overview of data indicators and sources
Data captured for the indicators in the table below have all been collected at the Indigenous Area (IARE) statistical level created by the Australian Bureau of
Statistics.
Indicator Date Source
Population
Total Aboriginal estimated resident population (ERP) 2016
Public Health Information Development Unit (PHIDU). (2016). Aboriginal & Torres Strait
Islander Social Health Atlas of Australia
Proportion of Aboriginal ERP aged 15-49 (%) 2016
Proportion of Aboriginal ERP aged 50 years and over (%) 2016
Socioeconomic gradient of health
Indigenous Relative Socioeconomic Outcome Index (IRSEO) 2011
Total number of Aboriginal families 2011
No. of low income families 2011
Total Aboriginal people in the labour force aged 15 years and over 2011
Total Aboriginal unemployed people aged 15 years and over 2011
Hospital admissions
Age standardised rate (ASR) of total admissions per 100,000 Aboriginal persons
2012-13
ASR of admissions for mental health related conditions per 100,000 Aboriginal persons
2012-13
ASR of admissions for circulatory system diseases per 100,000 Aboriginal persons
2012-13
ASR of admissions for respiratory system diseases per 100,000 Aboriginal persons
2012-13
ASR of admissions for digestive system diseases per 100,000 Aboriginal persons
2012-13
ASR of admissions for injury, poisoning and other external causes per 100,000 Aboriginal persons
2012-13
Early childhood development
Proportion of Aboriginal children assessed as developmentally vulnerable on one or more domains of the AEDC.
2015
Proportion of Aboriginal children assessed as developmentally vulnerable on two or more domains of the AEDC.
2015


