CE Database subject headings: Storm surges; Open channel flow; Unsteady flow; Numerical models; Velocity.
Author keywords: Negative surges; Unsteady open channel flow; Physical modeling; Numerical modeling; Water depth; Velocity;Negative waves.
Introduction
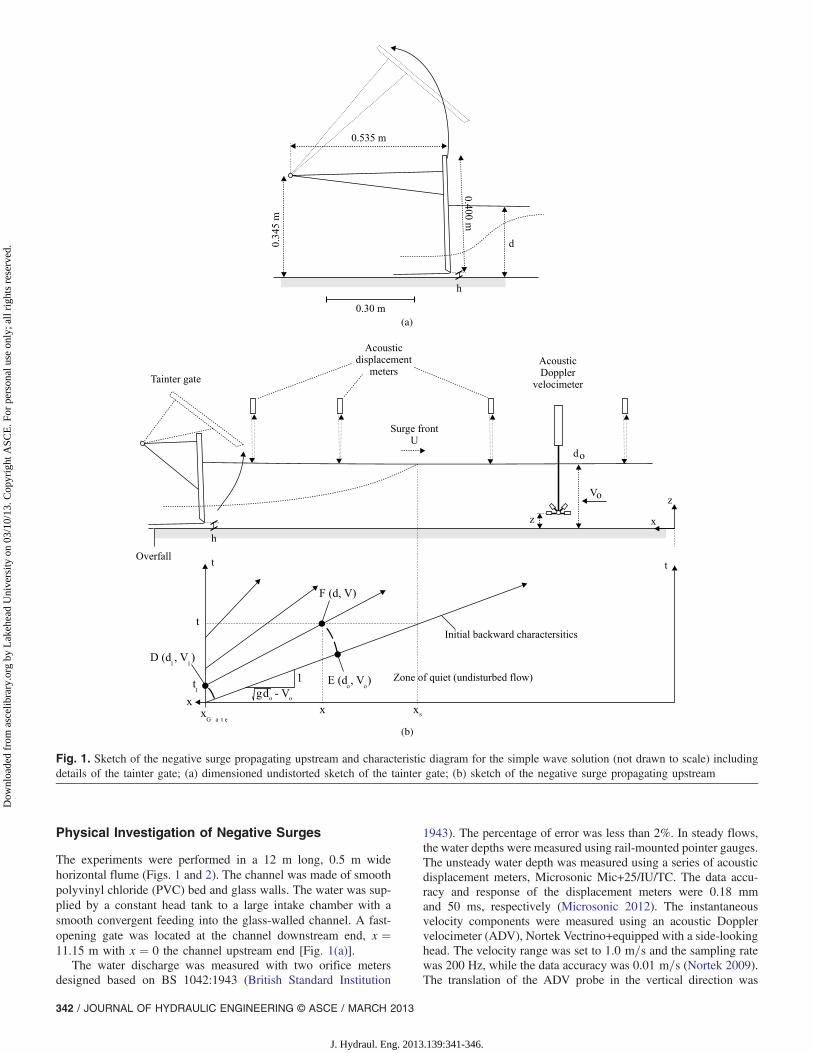
A negative surge is an unsteady open channel flow motion charac-terized by a decrease with time of the flow depth (Jaeger 1956;Henderson 1966; Montes 1998). Negative surges may occur down-streamof a control structurewhen the discharge is reducedorupstreamof a gate that is opened suddenly. For a stationary observer, the neg-ative surge appears to be a gentle lowering of the free surface (Fig. 1).
A negative surge may be solved using the one-dimensionalunsteady open channel flow equations called the Saint-Venantequations:
B∂d∂t þ
∂Q∂x ¼ 0 ð1Þ
∂V∂t þ V
∂V∂x ¼ −g ∂d∂x þ gðSo − SfÞ ð2Þ
where d and V = water depth and flow velocity, respectively;x = longitudinal coordinate positive downstream; B = free-surfacewidth; g = gravitational acceleration; So = bed slope; and Sf =friction slope (Montes 1998; Chanson 2004). When the initialflow conditions (do, Vo) are constant along a channel, and So ¼ Sfat any time and space, the solution called simple wave solutionyields the velocity and flow depth at any point (x, t) along acharacteristic line as functions of the initial flow properties(Vo, do) and the flow depth d1 at x ¼ xGate for t ¼ t1 [Fig. 1(b)]:
V ¼ Vo þ 2� ffiffiffiffiffiffiffi
gdop − ffiffiffiffiffiffiffi
gd1p �
xs < x < xGate ð3Þ
d ¼ d1 ð4Þ
Eqs. (3) and (4) provide the complete simple wave solutionwhen the boundary condition is the time variations of water depthat the gate (x ¼ xGate). Because d1 < do, Eq. (3) implies a flowacceleration. The instantaneous longitudinal profile may be derivedfrom the equation of the characteristics D-F issued from the gate:
xGate − x ¼�3
ffiffiffiffiffigd
p − 2ffiffiffiffiffiffiffigdo
p − Vo
�ðt − t1Þ xs < x < xGate
ð5Þ
which is a parabola. The negative surge propagates upstream at acelerity,
U ¼ffiffiffiffiffiffiffigdo
p − Vo ð6Þ
in a rectangular channel withU being the celerity positive upstream(Montes 1998; Chanson 2004). The characteristic diagram forms aseries of diverging lines for a negative surge generated by the rapidopening of a downstream gate as illustrated in Fig. 1(a).
To date, the knowledge of the hydraulics of negative surges inopen channels remains limited despite the classical experiments ofFavre (1935) and some well-detailed presentations in textbooks(Montes 1998; Sturm 2001; Chanson 2004). The present study in-vestigates physically and numerically the unsteady flow propertiesof negative surges against an initially steady flow. Some basicphysical modeling was performed including free-surface and un-steady velocity measurements together with surge celerity observa-tions. Both one-dimensional and two-dimensional modeling resultsare compared with the physical data. It is the aim of this work tocharacterize the propagation of negative surges against an initiallysteady open channel flow motion and to check the appropriatenessof simple analytical and numerical models.
1Graduate Student, The Univ. of Queensland, School of Civil Engineer-ing, Brisbane QLD 4072, Australia.
2Professor in Hydraulic Engineering, The Univ. of Queensland, Schoolof Civil Engineering, Brisbane QLD 4072, Australia (correspondingauthor). E-mail: [email protected]
The experiments were performed in a 12 m long, 0.5 m widehorizontal flume (Figs. 1 and 2). The channel was made of smoothpolyvinyl chloride (PVC) bed and glass walls. The water was sup-plied by a constant head tank to a large intake chamber with asmooth convergent feeding into the glass-walled channel. A fast-opening gate was located at the channel downstream end, x ¼11.15 m with x ¼ 0 the channel upstream end [Fig. 1(a)].
The water discharge was measured with two orifice metersdesigned based on BS 1042:1943 (British Standard Institution
1943). The percentage of error was less than 2%. In steady flows,the water depths were measured using rail-mounted pointer gauges.The unsteady water depth was measured using a series of acousticdisplacement meters, Microsonic Mic+25/IU/TC. The data accu-racy and response of the displacement meters were 0.18 mmand 50 ms, respectively (Microsonic 2012). The instantaneousvelocity components were measured using an acoustic Dopplervelocimeter (ADV), Nortek Vectrino+equipped with a side-lookinghead. The velocity range was set to 1.0 m=s and the sampling ratewas 200 Hz, while the data accuracy was 0.01 m=s (Nortek 2009).The translation of the ADV probe in the vertical direction was
(a)
(b)
Fig. 1. Sketch of the negative surge propagating upstream and characteristic diagram for the simple wave solution (not drawn to scale) includingdetails of the tainter gate; (a) dimensioned undistorted sketch of the tainter gate; (b) sketch of the negative surge propagating upstream
controlled by a fine adjustment traveling mechanism with an errorless than 0.1 mm. All the measurements were taken on the channelcenterline.
Two types of ADV postprocessing techniques were used. Insteady flows, communication errors, average signal-to-noise ratiodata less than 5 dB, and average correlation values less than 60%were removed, and the phase-space thresholding technique devel-oped by Goring and Nikora (2002) and extended by Wahl (2003)was applied to remove spurious points in the ADV steady flowdata set. The previously mentioned postprocessing techniques donot apply in unsteady flow conditions (Koch and Chanson 2009;Docherty and Chanson 2012). Thus, the unsteady flow postpro-cessing was limited to the removal of communication errors,although it was noted that the vertical velocity component Vz ofdata may be affected adversely by the bed proximity (Chanson et al.2007; Chanson 2010).
Avideo camera, PanasonicNV-H30 (25 frames per second), wasused to record the instantaneous free-surface profile at two differentlocations along the channel. A 20 mm squared grid was placed onthe side wall for reference and lens distortion correction (Fig. 2).The focal plane of the camera was placed slightly beneath theinitial free surface for the recorded image to show the free sur-face close to the wall rather than on the channel centerline.Additional information was recorded with a Pentax K-7 camera
with a 14 Mp resolution. Further details are reported in Reichstetterand Chanson (2011).
Inflow Conditions and Negative Surge Generation
For each run, the steady gradually varied flow conditions wereestablished prior to the measurements. The negative surge was pro-duced by opening rapidly the tainter gate [Fig. 1(b)]. Its openingtimes were less than 0.15 to 0.2 s, which were small enough to havea negligible effect on the surge propagation (Lauber 1997). Afterthe rapid opening, the gate did not intrude into the flow [Fig. 2(a)].The experimental flow conditions are summarized in Table 1 inwhich Q is the initially steady flow rate, do and Vo are the initialflow depth and velocity recorded at x ¼ 6 m, and h is the under-shoot gate height before opening.
During the unsteady flow experiments, the displacement meterswere located at x ¼ 5.6, 6.0, 6.2, 10.2, 10.5, and 10.8 m. The videocamera was centered either at x ¼ 6.0 m covering 5.8 < x < 6.3 m,or x ¼ 10.8 m covering 10.5 < x < 11.2 m (including the gate).The instantaneous velocity measurements were conducted for oneseries of flow conditions at x ¼ 10.5 m and 6 m for four verticalelevations, z ¼ 0.0067, 0.025, 0.124, and 0.135 m, where z isthe elevation above the bed (Table 1). At each sampling location,the experiments were repeated several times to ascertain the exper-imental repeatability.
Fig. 2. Photographs of the negative surge experiments; (a) negative surge generation next to the gate: initial flow conditions wereQ ¼ 0.020 m3=s, h ¼ 0; photographs are after lens distortion corrections; clockwise from top left, t ¼ 0, 0.19, 0.385, 0.577 s; the photo-graph covers 11.15 m > x > 10.2 m, and the gate is on the far left-hand side; (b) negative surge propagating upstream: initial flow condi-tions were Q ¼ 0.020 m3=s (from right to left), h ¼ 0.030 m; the photograph covers 11 m > x > 7 m, and the gate is fully opened (left-handside)
Both visual observations and water-surface profile measure-ments showed a fast drop in water depth close to the gate(e.g., 10 < x < 11.15 m) compared with the observations furtherupstream at 5.5 < x < 6.5 m. Fig. 2 presents some photographsof the upstream propagation of negative surges. Fig. 2(a) showsfour photographs of the surge generation immediately upstreamof the gate within 0.8 s. The observations highlighted the rapid gateopening and surge formation. Very rapidly (within a second), anydisturbance vanished and the instantaneous free surface exhibiteda smooth shape as shown in Fig. 2(b). Fig. 2(b) presents an instanta-neous shot of thewater surface between x ¼ 7 and 11m. The presentobservations indicated some free-surface curvature immediatelyafter the gate opening, typically for t
ffiffiffiffiffiffiffiffiffiffig=do
p< 1.5 [Fig. 2(a)]. For
larger times, the free surface was very flat and smooth [Fig. 2(b)].The water surface curvature was not discernable by eye and it isbelieved that the assumption of hydrostatic pressure was valid.
The celerity of the negative surge leading edge was deducedfrom photographic, video, and acoustic displacement meter mea-surements. The results are presented in Fig. 3 with the dimension-less surge celerity as a function of the longitudinal distance x=L,where L is the channel length (L ¼ 12 m). In Fig. 3, the down-stream gate is shown with a thick dashed line. For the investigatedflow conditions (Table 1), the celerity data highlighted two distinctphases. Very close to the gate immediately after gate opening,the negative surge formation was associated with some localdissipative process [Fig. 2(a)]. During this formation phase, thecelerity of the negative surge leading edge increased rapidly with
time. The present data sets suggested that the acceleration phasetook place within a distance 4 do from the gate. Afterward, the neg-ative surge propagated upstream in a more gradual manner. Theleading edge was very flat and barely perceptible, and its celeritytended to decrease slowly with increasing distance from the gate(Fig. 3, x=do < 40). At x ¼ 6 m, the dimensionless surge celerityðU þ VoÞ=ðgdoÞ1=2 ranged from 0.3 up to 1.0 depending on theinitial steady flow conditions (Table 1).
For comparison, the simple wave solution of the Saint-Venantequations predicts a constant dimensionless celerity ðU þ VoÞ=ðgdoÞ1=2 ¼ 1 [Eq. (6)]. In a rectangular flume, Favre (1935) mea-sured the surge celerity propagating downstream as ðU þ VoÞ=ðgdoÞ1=2 ¼ 1. Tan and Chu (2009) reanalyzed the data set of Lauberand Hager (1998) in a 3.5 m long horizontal rectangular channelinitially at rest (Vo ¼ 0), and their computational data matchedthe experimental observations:U=ðgdoÞ1=2 ¼ 1. The present results(Fig. 3, Table 1) suggest that neither the Saint-Venant equationssolution nor previous findings were comparable with the presentresults. In this research, the gradually varied phase was associatedwith some slight deceleration of the negative surge leading edge.The gradual deceleration of the surge leading edge might be pos-sibly linked with the initial (nonstill) flow conditions as well as theupstream surge propagation against an H2 backwater profile withvery slight changes in depth with increasing distance from the gate.That is, the free-surface and velocity measurements in steady flowsimplied that the flume was hydraulically smooth. It is believed thatthe upstream propagation of the negative surge against the initiallysteady flow was associated with some turbulence dissipationthroughout the water column, evidenced by the relatively highturbulent velocity fluctuations during the surge propagation. Thetransient turbulent dissipation process might be responsible forsome gradual deceleration of the surge leading edge.
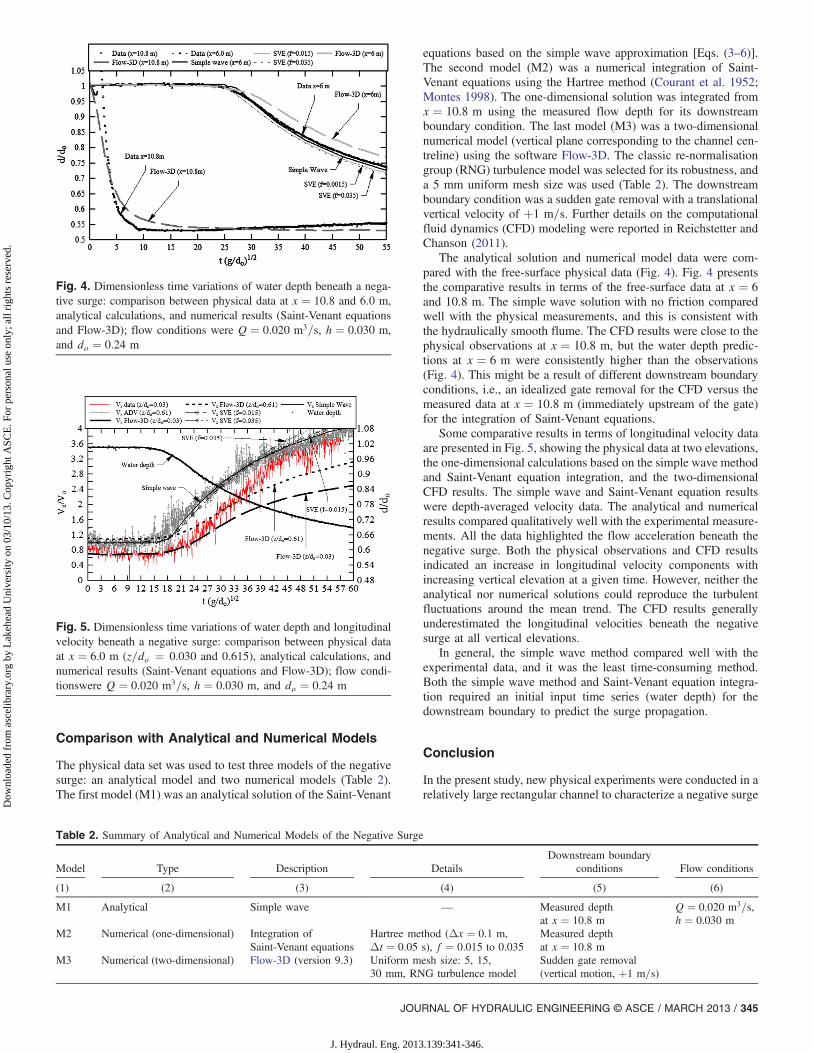
During the negative surge, the water depth decreased relativelygradually after the initial surge formation. The free-surface mea-surements showed some curvature near the surge leading edge(Fig. 4). Fig. 4 presents some typical free-surface measurementsclose to the gate (x ¼ 10.8 m) and further upstream (x ¼ 6 m).The upstream propagation of the surge was associated with anincrease in longitudinal velocity (Fig. 5). Fig. 5 includes sometypical instantaneous velocity measurements at x ¼ 6 m for twovertical elevations. At x ¼ 6 m, the velocity data showed somerelatively large fluctuations during the initial phases of the surgepropagation, compared with the steady-state data. For example,at tðg=doÞ1=2 ∼ 20 in Fig. 5, the turbulent velocity fluctuationsabout the smoothed data trend were nearly 2.5 times larger thanin the initially steady flow. Further, during the drawdown of thefree surface [21 < tðg=doÞ1=2 < 45], the velocity fluctuations wereon average 1.5 times larger than those in the initially steady flow.The increase in turbulence observed during the negative surgepropagation including at the leading edge might suggest someenhanced turbulent mixing.
Table 1. Experimental Investigations of Negative Surges
Reference So Q (m3=s) h (m)do (at x ¼ 6 m)
(m)Vo (at x ¼ 6 m)
(m=s)U (at x ¼ 6 m)
(m=s) Instrument(s)
(1) (2) (3) (4) (5) (6) (7) (8)
20–30 mm 0 0.020 0.030 0.24 0.17 0.91 Video, ADV, displacement meters20–50 mm 0.020 0.050 0.10 0.40 0.25 Video30–40 mm 0.030 0.040 0.26 0.23 0.33 Video30–50 mm 0.030 0.050 0.22 0.27 0.49 Video
Note: h = undershoot gate height before sudden opening.
Fig. 3.Dimensionless negative surge celerity as a function of the longi-tudinal distance; surge propagation is shown from right to left
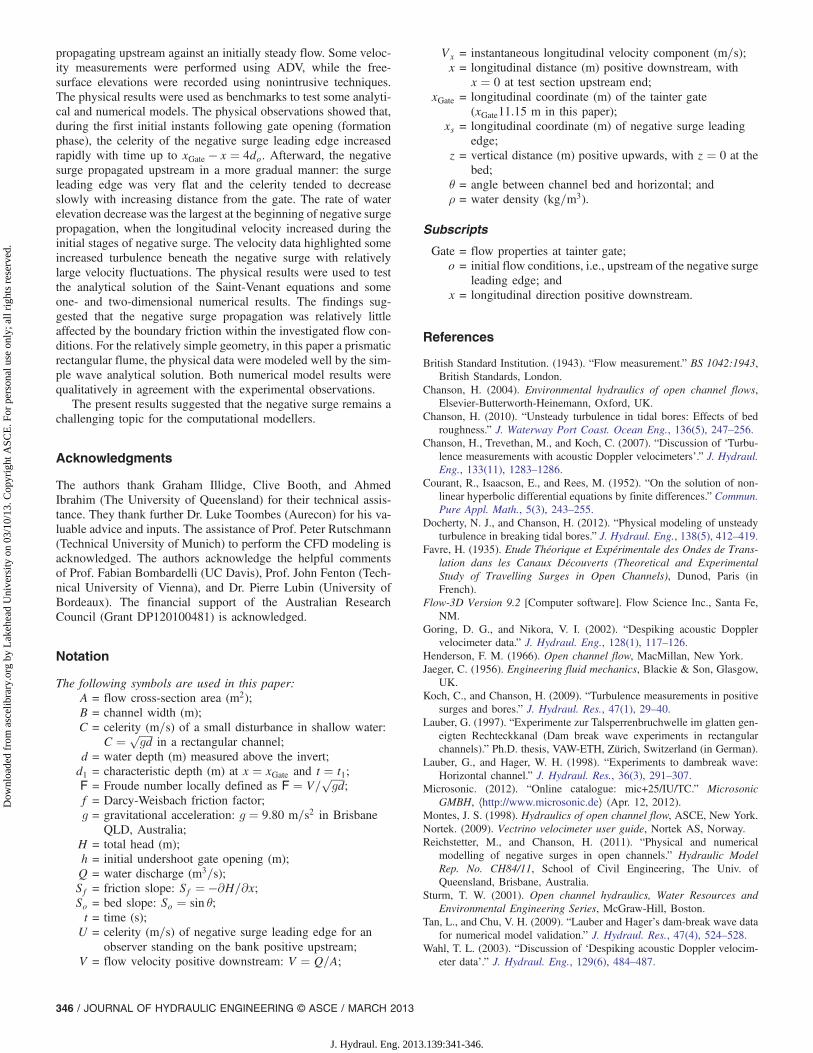
The physical data set was used to test three models of the negativesurge: an analytical model and two numerical models (Table 2).The first model (M1) was an analytical solution of the Saint-Venant
equations based on the simple wave approximation [Eqs. (3–6)].The second model (M2) was a numerical integration of Saint-Venant equations using the Hartree method (Courant et al. 1952;Montes 1998). The one-dimensional solution was integrated fromx ¼ 10.8 m using the measured flow depth for its downstreamboundary condition. The last model (M3) was a two-dimensionalnumerical model (vertical plane corresponding to the channel cen-treline) using the software Flow-3D. The classic re-normalisationgroup (RNG) turbulence model was selected for its robustness, anda 5 mm uniform mesh size was used (Table 2). The downstreamboundary condition was a sudden gate removal with a translationalvertical velocity of þ1 m=s. Further details on the computationalfluid dynamics (CFD) modeling were reported in Reichstetter andChanson (2011).
The analytical solution and numerical model data were com-pared with the free-surface physical data (Fig. 4). Fig. 4 presentsthe comparative results in terms of the free-surface data at x ¼ 6and 10.8 m. The simple wave solution with no friction comparedwell with the physical measurements, and this is consistent withthe hydraulically smooth flume. The CFD results were close to thephysical observations at x ¼ 10.8 m, but the water depth predic-tions at x ¼ 6 m were consistently higher than the observations(Fig. 4). This might be a result of different downstream boundaryconditions, i.e., an idealized gate removal for the CFD versus themeasured data at x ¼ 10.8 m (immediately upstream of the gate)for the integration of Saint-Venant equations.
Some comparative results in terms of longitudinal velocity dataare presented in Fig. 5, showing the physical data at two elevations,the one-dimensional calculations based on the simple wave methodand Saint-Venant equation integration, and the two-dimensionalCFD results. The simple wave and Saint-Venant equation resultswere depth-averaged velocity data. The analytical and numericalresults compared qualitatively well with the experimental measure-ments. All the data highlighted the flow acceleration beneath thenegative surge. Both the physical observations and CFD resultsindicated an increase in longitudinal velocity components withincreasing vertical elevation at a given time. However, neither theanalytical nor numerical solutions could reproduce the turbulentfluctuations around the mean trend. The CFD results generallyunderestimated the longitudinal velocities beneath the negativesurge at all vertical elevations.
In general, the simple wave method compared well with theexperimental data, and it was the least time-consuming method.Both the simple wave method and Saint-Venant equation integra-tion required an initial input time series (water depth) for thedownstream boundary to predict the surge propagation.
Conclusion
In the present study, new physical experiments were conducted in arelatively large rectangular channel to characterize a negative surge
Fig. 4. Dimensionless time variations of water depth beneath a nega-tive surge: comparison between physical data at x ¼ 10.8 and 6.0 m,analytical calculations, and numerical results (Saint-Venant equationsand Flow-3D); flow conditions were Q ¼ 0.020 m3=s, h ¼ 0.030 m,and do ¼ 0.24 m
Fig. 5. Dimensionless time variations of water depth and longitudinalvelocity beneath a negative surge: comparison between physical dataat x ¼ 6.0 m (z=do ¼ 0.030 and 0.615), analytical calculations, andnumerical results (Saint-Venant equations and Flow-3D); flow condi-tionswere Q ¼ 0.020 m3=s, h ¼ 0.030 m, and do ¼ 0.24 m
Table 2. Summary of Analytical and Numerical Models of the Negative Surge
Model Type Description DetailsDownstream boundary
conditions Flow conditions
(1) (2) (3) (4) (5) (6)
M1 Analytical Simple wave — Measured depthat x ¼ 10.8 m
propagating upstream against an initially steady flow. Some veloc-ity measurements were performed using ADV, while the free-surface elevations were recorded using nonintrusive techniques.The physical results were used as benchmarks to test some analyti-cal and numerical models. The physical observations showed that,during the first initial instants following gate opening (formationphase), the celerity of the negative surge leading edge increasedrapidly with time up to xGate − x ¼ 4do. Afterward, the negativesurge propagated upstream in a more gradual manner: the surgeleading edge was very flat and the celerity tended to decreaseslowly with increasing distance from the gate. The rate of waterelevation decrease was the largest at the beginning of negative surgepropagation, when the longitudinal velocity increased during theinitial stages of negative surge. The velocity data highlighted someincreased turbulence beneath the negative surge with relativelylarge velocity fluctuations. The physical results were used to testthe analytical solution of the Saint-Venant equations and someone- and two-dimensional numerical results. The findings sug-gested that the negative surge propagation was relatively littleaffected by the boundary friction within the investigated flow con-ditions. For the relatively simple geometry, in this paper a prismaticrectangular flume, the physical data were modeled well by the sim-ple wave analytical solution. Both numerical model results werequalitatively in agreement with the experimental observations.
The present results suggested that the negative surge remains achallenging topic for the computational modellers.
Acknowledgments
The authors thank Graham Illidge, Clive Booth, and AhmedIbrahim (The University of Queensland) for their technical assis-tance. They thank further Dr. Luke Toombes (Aurecon) for his va-luable advice and inputs. The assistance of Prof. Peter Rutschmann(Technical University of Munich) to perform the CFD modeling isacknowledged. The authors acknowledge the helpful commentsof Prof. Fabian Bombardelli (UC Davis), Prof. John Fenton (Tech-nical University of Vienna), and Dr. Pierre Lubin (University ofBordeaux). The financial support of the Australian ResearchCouncil (Grant DP120100481) is acknowledged.
Notation
The following symbols are used in this paper:A = flow cross-section area (m2);B = channel width (m);C = celerity (m=s) of a small disturbance in shallow water:
C ¼ ffiffiffiffiffigd
pin a rectangular channel;
d = water depth (m) measured above the invert;d1 = characteristic depth (m) at x ¼ xGate and t ¼ t1;F = Froude number locally defined as F ¼ V=
ffiffiffiffiffigd
p;
f = Darcy-Weisbach friction factor;g = gravitational acceleration: g ¼ 9.80 m=s2 in Brisbane
QLD, Australia;H = total head (m);h = initial undershoot gate opening (m);Q = water discharge (m3=s);Sf = friction slope: Sf ¼ −∂H=∂x;So = bed slope: So ¼ sin θ;t = time (s);U = celerity (m=s) of negative surge leading edge for an
observer standing on the bank positive upstream;V = flow velocity positive downstream: V ¼ Q=A;
x ¼ 0 at test section upstream end;xGate = longitudinal coordinate (m) of the tainter gate
(xGate11.15 m in this paper);xs = longitudinal coordinate (m) of negative surge leading
edge;z = vertical distance (m) positive upwards, with z ¼ 0 at the
bed;θ = angle between channel bed and horizontal; andρ = water density (kg=m3).
Subscripts
Gate = flow properties at tainter gate;o = initial flow conditions, i.e., upstream of the negative surge
leading edge; andx = longitudinal direction positive downstream.
References
British Standard Institution. (1943). “Flow measurement.” BS 1042:1943,British Standards, London.
Chanson, H. (2004). Environmental hydraulics of open channel flows,Elsevier-Butterworth-Heinemann, Oxford, UK.
Chanson, H. (2010). “Unsteady turbulence in tidal bores: Effects of bedroughness.” J. Waterway Port Coast. Ocean Eng., 136(5), 247–256.
Chanson, H., Trevethan, M., and Koch, C. (2007). “Discussion of ‘Turbu-lence measurements with acoustic Doppler velocimeters’.” J. Hydraul.Eng., 133(11), 1283–1286.
Courant, R., Isaacson, E., and Rees, M. (1952). “On the solution of non-linear hyperbolic differential equations by finite differences.” Commun.Pure Appl. Math., 5(3), 243–255.
Docherty, N. J., and Chanson, H. (2012). “Physical modeling of unsteadyturbulence in breaking tidal bores.” J. Hydraul. Eng., 138(5), 412–419.
Favre, H. (1935). Etude Théorique et Expérimentale des Ondes de Trans-lation dans les Canaux Découverts (Theoretical and ExperimentalStudy of Travelling Surges in Open Channels), Dunod, Paris (inFrench).
Flow-3D Version 9.2 [Computer software]. Flow Science Inc., Santa Fe,NM.
Goring, D. G., and Nikora, V. I. (2002). “Despiking acoustic Dopplervelocimeter data.” J. Hydraul. Eng., 128(1), 117–126.
Henderson, F. M. (1966). Open channel flow, MacMillan, New York.Jaeger, C. (1956). Engineering fluid mechanics, Blackie & Son, Glasgow,
UK.Koch, C., and Chanson, H. (2009). “Turbulence measurements in positive
surges and bores.” J. Hydraul. Res., 47(1), 29–40.Lauber, G. (1997). “Experimente zur Talsperrenbruchwelle im glatten gen-
eigten Rechteckkanal (Dam break wave experiments in rectangularchannels).” Ph.D. thesis, VAW-ETH, Zürich, Switzerland (in German).
Lauber, G., and Hager, W. H. (1998). “Experiments to dambreak wave:Horizontal channel.” J. Hydraul. Res., 36(3), 291–307.
Montes, J. S. (1998). Hydraulics of open channel flow, ASCE, New York.Nortek. (2009). Vectrino velocimeter user guide, Nortek AS, Norway.Reichstetter, M., and Chanson, H. (2011). “Physical and numerical
modelling of negative surges in open channels.” Hydraulic ModelRep. No. CH84/11, School of Civil Engineering, The Univ. ofQueensland, Brisbane, Australia.
Sturm, T. W. (2001). Open channel hydraulics, Water Resources andEnvironmental Engineering Series, McGraw-Hill, Boston.
Tan, L., and Chu, V. H. (2009). “Lauber and Hager’s dam-break wave datafor numerical model validation.” J. Hydraul. Res., 47(4), 524–528.
Wahl, T. L. (2003). “Discussion of ‘Despiking acoustic Doppler velocim-eter data’.” J. Hydraul. Eng., 129(6), 484–487.