104
Nelson Mandela Bay Metro Municipality Socio-Economic Review and Outlook 2017 NELSON MANDEL BAY METRO MUNICIPALITY SOCIO ECONOMIC REVIEW AND OUTLOOK, 2017
Nelson Mandela Bay Metro Municipality Socio-Economic Review and Outlook 2017
NELSON MANDEL BAY METRO
MUNICIPALITY SOCIO ECONOMIC
REVIEW AND OUTLOOK, 2017
Nelson Mandela Bay Metro Municipality Socio-Economic Review and Outlook 2017
Published by ECSECC
Postnet Vincent, P/Bag X9063, Suite No 302, Vincent
5247 www.ecsecc.org
© 2017 Eastern Cape Socio Economic Consultative Council
First published April 2017
Some rights reserved. Please acknowledge the author and publisher if utilising this
publication or any material contained herein. Reproduction of material in this publication
for resale or other commercial purposes is prohibited without written permission from
ECSECC.
Nelson Mandela Bay Metro Municipality Socio-Economic Review and Outlook 2017
Foreword
ECSECC was founded in July 1995 as an institutional mechanism for partnership between government,
business, labour and the NGO sector to address underdevelopment and poverty in the Eastern Cape.
The local government sector and the higher education sector joined ECSECC in 2003. ECSECC’s
mandate of stakeholder co-ordination and multi-stakeholder policy making stems from the realization
that Government cannot defeat poverty, unemployment and inequality on its own, but needs to build
deliberate and active partnerships to achieve prioritized development outcomes.
ECSECCs main partners are: the shareholder, the Office of the Premier; national, provincial and local
government; organised business and industry; organised labour; higher education; and the organised
NGO sectors that make up the board, SALGA and municipalities.
One of ECSECCs goals is to be a socio-economic knowledge hub for the Eastern Cape Province. We
seek to actively serve the Eastern Cape’s needs to socio-economic data and analysis. As part of this
ECSECC regularly issues statistical and research based publications. Publications, reports and data can
be found on ECSECCs website www.ecsecc.org.
We trust you find the 2017 series of municipal socio-economic review and outlook publications useful.
A report has been issued for each of district, local and metropolitan municipality in the province. We
would appreciate your feedback.
ECSECC acknowledges that a large part of the information and descriptive analysis in this publication
has been generated from IHS ReX Publisher, a product of IHS Information and Insight.
Regards,
Mr Andrew Murray
CEO
Nelson Mandela Bay Metro Municipality Socio-Economic Review and Outlook 2017
TABLE OF CONTENTS
1. Background ................................................................................................................................. 1
1.1. Introduction ........................................................................................................................ 1
1.2 Overview of Nelson Mandela Bay Metro Municipality ............................................................. 1
1.3 From Global to Local Economic Outlook ............................................................................. 2
1.4 National and Provincial Development Priorities ................................................................. 4
1.5 Summary of Key Demographic and Socio-Economic Highlights of Nelson Mandela Bay
Metro 9
2. Demography .............................................................................................................................. 10
2.1 Total Population ................................................................................................................ 10
2.2 Population by population group, Gender and Age ........................................................... 13
2.3 Number of Households by Population Group ................................................................... 17
2.4 HIV+ and AIDS estimates ................................................................................................... 20
3. Economy .................................................................................................................................... 23
3.1 Gross Domestic Product by Region (GDP-R) ..................................................................... 23
3.2 Gross Value Added by Region (GVA-R) ............................................................................. 28
3.3 Tress Index ........................................................................................................................ 36
3.4 Location Quotient ............................................................................................................. 37
4. Labour ....................................................................................................................................... 39
4.1 Economically Active Population (EAP) .............................................................................. 39
4.2 Total Employment ............................................................................................................. 43
4.3 Formal and Informal employment .................................................................................... 45
4.4 Unemployment ................................................................................................................. 47
5. Income and Expenditure ........................................................................................................... 51
5.1 Number of Households by Income category .................................................................... 51
5.2 Annual total Personal Income ........................................................................................... 52
5.3 Annual per Capita Income ................................................................................................. 54
5.4 Index of Buying Power ...................................................................................................... 56
6. Development ............................................................................................................................. 58
6.1 Human Development Index (HDI) ..................................................................................... 58
6.2 Gini Coefficient .................................................................................................................. 60
6.3 Poverty .............................................................................................................................. 62
6.4 Education .......................................................................................................................... 66
6.5 Functional literacy ............................................................................................................. 69
Nelson Mandela Bay Metro Municipality Socio-Economic Review and Outlook 2017
6.6 Population Density ............................................................................................................ 71
7. Crime ......................................................................................................................................... 74
7.1 IHS Composite Crime Index ............................................................................................... 74
8. Household Infrastructure .......................................................................................................... 77
8.1 Household by Dwelling Type ............................................................................................. 77
8.2 Household by Type of Sanitation ...................................................................................... 79
8.3 Households by Access to water ........................................................................................ 81
8.4 Households by Type of Electricity ..................................................................................... 83
8.5 Households by Refuse Disposal ........................................................................................ 85
9. Tourism ..................................................................................................................................... 88
9.1 Trips by purpose of trips ................................................................................................... 88
9.2 Origin of Tourists ............................................................................................................... 89
9.3 Tourism spending .............................................................................................................. 92
10. International Trade ............................................................................................................... 96
10.1 Relative Importance of international Trade...................................................................... 96
Nelson Mandela Bay Metro Municipality Socio-Economic Review and Outlook 2017 1 | P a g e
1. BACKGROUND1
1.1. INTRODUCTION
The report seeks to reflect on the current socio-economic developments in Nelson Mandela Bay
Metro Municipality with the view of providing a strong conceptual and empirical basis for policy-
making, especially in turbulent times such as these. It provides the demographic patterns, labour
dynamics, economic developments, and other socio economic indices related to the triple challenge
of poverty, inequality and unemployment. These indices highlight performance and trends of
selected development indicators and set the basis for planning, action prioritisation to improve the
lives of people in the local municipality. The report can serve as a diagnostic document that articulates
key questions which should be addressed by a long-term plan and strategy for the development of
Nelson Mandela Bay Metro Municipality. Trend analysis in this report shows the extent to which the
District has recovered from the economic meltdown in 2009.
This report draw heavily from the analysis compiled by IHS Global Insight. It uses both the data
provided by the IHS Regional Explorer and the analysis provided in the Rex Publisher. Additional
information was drawn from the International Monetary Funds (IMF) for global economic outlook
and Statistics South Africa (Census 2011 Census and 2016 Community Survey) for demographic data.
Statistics South Africa, the official data provider does not provide labour and economic statistics at
local and districts levels. Therefore, the document drew labour and economic data from IHS Global
Insight (IHS, 2017).
1.2 OVERVIEW OF NELSON MANDELA BAY METRO MUNICIPALITY
The Nelson Mandela Bay Metropolitan Municipality (Area: 1 959km2) is a Category A municipality,
established on 5 December 2000. Nelson Mandela Bay was the first city in South Africa to establish a
fully integrated democratic local authority and the only city in the world named after Nelson Mandela,
who was born and spent his formative years in the Eastern Cape.
Nelson Mandela Bay is a major seaport and automotive manufacturing centre located on the south-
eastern coast of Africa. It is the economic powerhouse of the Eastern Cape Province and one of eight
1 Section one of this report was compiled by ECSECC. The rest of the document was compiled by IHS.
Nelson Mandela Bay Metro Municipality Socio-Economic Review and Outlook 2017 2 | P a g e
metropolitan areas in South Africa. Its boundaries are formed by Cassie Mountain View in the north,
Cape Recife in the south, Sundays River Mouth in the east, and Van Stadens River Mouth in the west.
The city is a holiday hot spot for both national and international tourists. The predominant languages
spoken are English, Afrikaans and isiXhosa. The main Cities/Towns in the Nelson Mandela Bay
Metropolitan Municipality are: Bethelsdorp, Bloemendal, Blue Horizon Bay, Clarendon Marine,
Despatch, KwaNobuhle, Motherwell, Port Elizabeth, and Uitenhage. The main Economic Sectors
are: Manufacturing, community services, finance, trade, and transport.
With its world-wide renowned holiday hot spot for both national and international tourists, the
analysis of Nelson Mandela Bay Metro Municipality must be contextualised globally. The next section
provides both the global and local economic outlooks.
1.3 From Global to Local Economic Outlook
1.3.1 GLOBAL ECONOMIC OUTLOOK
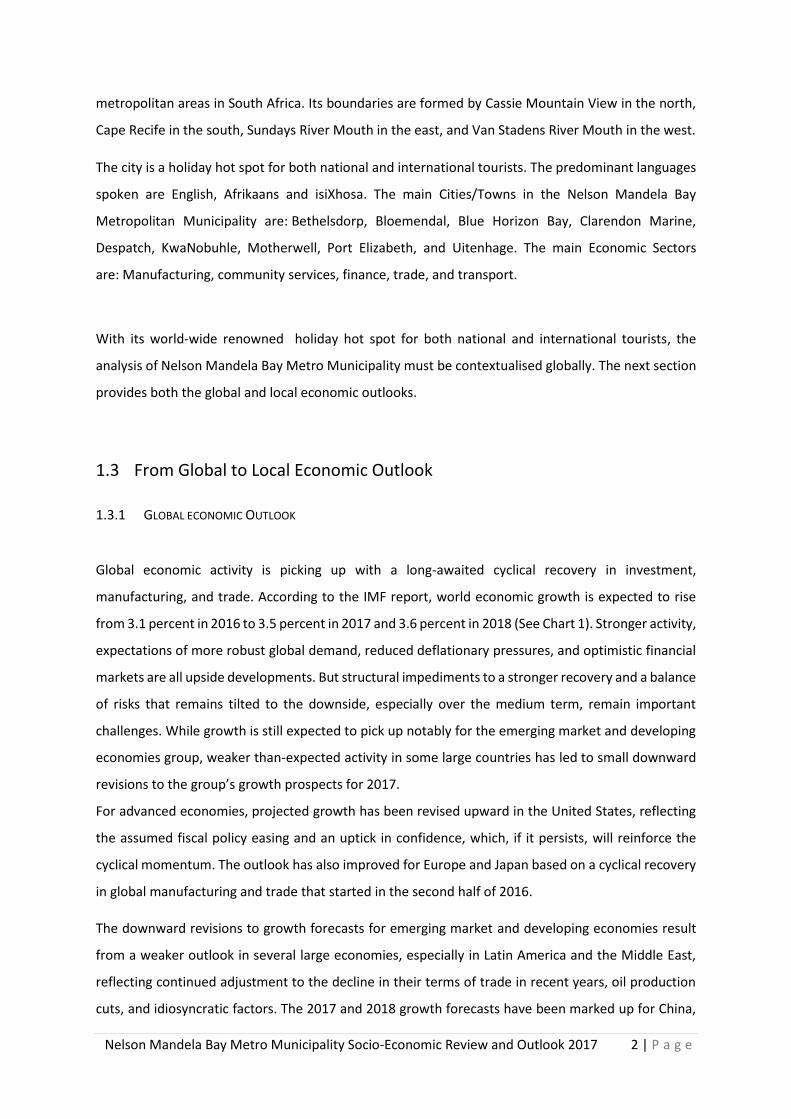
Global economic activity is picking up with a long-awaited cyclical recovery in investment,
manufacturing, and trade. According to the IMF report, world economic growth is expected to rise
from 3.1 percent in 2016 to 3.5 percent in 2017 and 3.6 percent in 2018 (See Chart 1). Stronger activity,
expectations of more robust global demand, reduced deflationary pressures, and optimistic financial
markets are all upside developments. But structural impediments to a stronger recovery and a balance
of risks that remains tilted to the downside, especially over the medium term, remain important
challenges. While growth is still expected to pick up notably for the emerging market and developing
economies group, weaker than-expected activity in some large countries has led to small downward
revisions to the group’s growth prospects for 2017.
For advanced economies, projected growth has been revised upward in the United States, reflecting
the assumed fiscal policy easing and an uptick in confidence, which, if it persists, will reinforce the
cyclical momentum. The outlook has also improved for Europe and Japan based on a cyclical recovery
in global manufacturing and trade that started in the second half of 2016.
The downward revisions to growth forecasts for emerging market and developing economies result
from a weaker outlook in several large economies, especially in Latin America and the Middle East,
reflecting continued adjustment to the decline in their terms of trade in recent years, oil production
cuts, and idiosyncratic factors. The 2017 and 2018 growth forecasts have been marked up for China,
Nelson Mandela Bay Metro Municipality Socio-Economic Review and Outlook 2017 3 | P a g e
reflecting stronger-than-expected policy support, as well as for Russia, where activity appears to have
bottomed out and higher oil prices bolster the recovery.
CHART 1: WORLD ECONOMIC OUTLOOK: 2010 - 2020
Source: IMF: World Economic Outlook (Database: October 2017)
1.3.2. SOUTH AFRICA AND EASTERN CAPE ECONOMIC OUTLOOKS
According to the IMF, South Africa’s economic growth is projected to increase to 1 percent in 2017.
This is a 0.2 of a percentage point more than an earlier projection of 0.8 percent. However, South
Africa’s National Treasury expects growth of 1.3 percent in 2017.
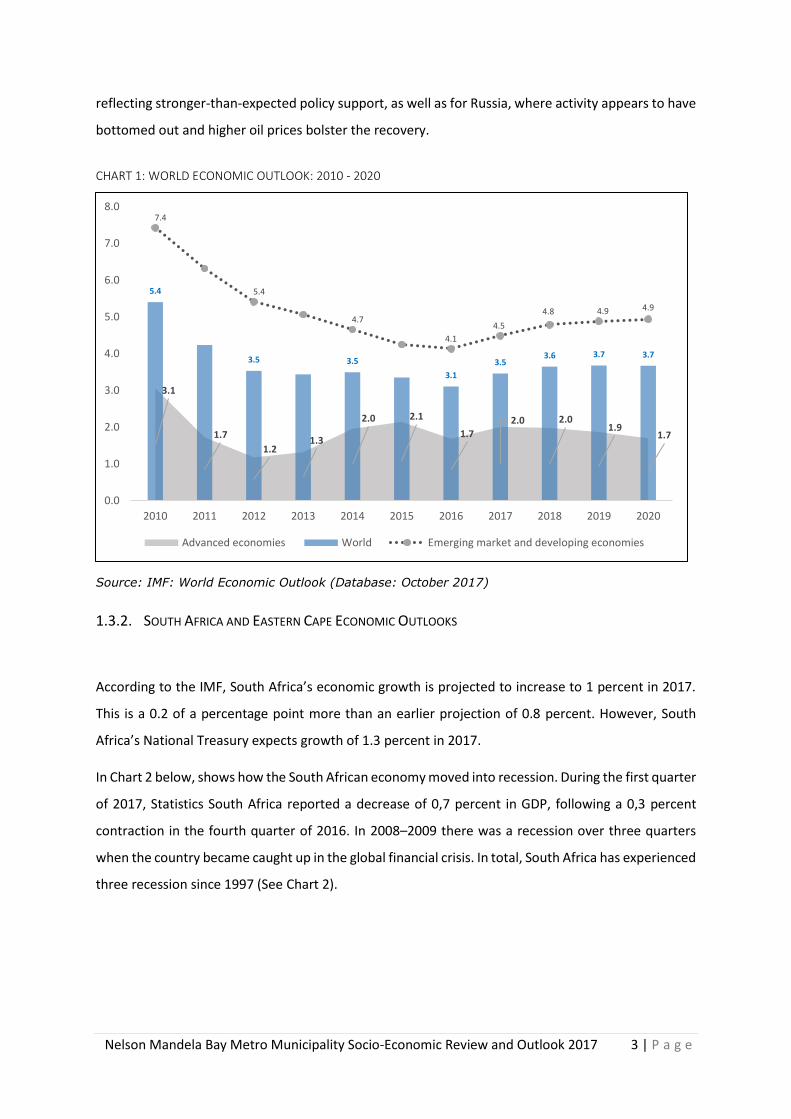
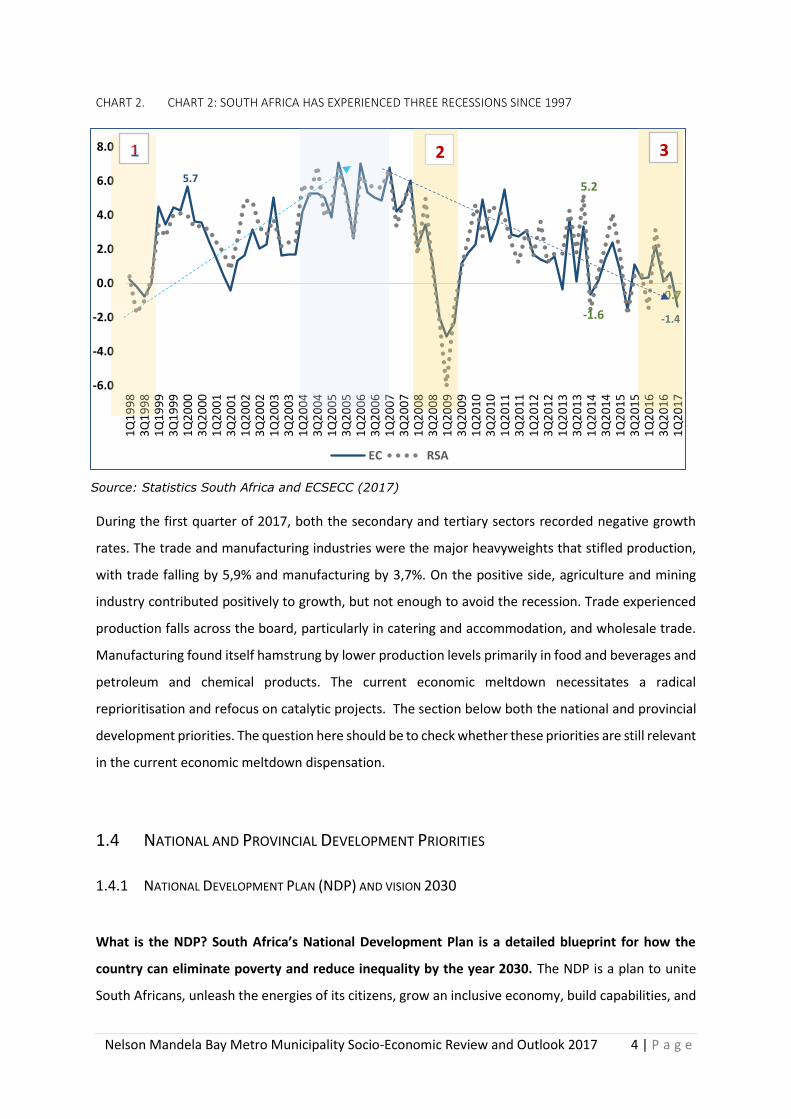
In Chart 2 below, shows how the South African economy moved into recession. During the first quarter
of 2017, Statistics South Africa reported a decrease of 0,7 percent in GDP, following a 0,3 percent
contraction in the fourth quarter of 2016. In 2008–2009 there was a recession over three quarters
when the country became caught up in the global financial crisis. In total, South Africa has experienced
three recession since 1997 (See Chart 2).
3.1
1.7
1.21.3
2.0 2.1
1.7
2.0 2.01.9
1.7
5.4
3.5 3.5
3.1
3.53.6 3.7 3.7
7.4
5.4
4.7
4.1
4.5
4.8 4.9 4.9
0.0
1.0
2.0
3.0
4.0
5.0
6.0
7.0
8.0
2010 2011 2012 2013 2014 2015 2016 2017 2018 2019 2020
Advanced economies World Emerging market and developing economies
Nelson Mandela Bay Metro Municipality Socio-Economic Review and Outlook 2017 4 | P a g e
CHART 2. CHART 2: SOUTH AFRICA HAS EXPERIENCED THREE RECESSIONS SINCE 1997
Source: Statistics South Africa and ECSECC (2017)
During the first quarter of 2017, both the secondary and tertiary sectors recorded negative growth
rates. The trade and manufacturing industries were the major heavyweights that stifled production,
with trade falling by 5,9% and manufacturing by 3,7%. On the positive side, agriculture and mining
industry contributed positively to growth, but not enough to avoid the recession. Trade experienced
production falls across the board, particularly in catering and accommodation, and wholesale trade.
Manufacturing found itself hamstrung by lower production levels primarily in food and beverages and
petroleum and chemical products. The current economic meltdown necessitates a radical
reprioritisation and refocus on catalytic projects. The section below both the national and provincial
development priorities. The question here should be to check whether these priorities are still relevant
in the current economic meltdown dispensation.
1.4 NATIONAL AND PROVINCIAL DEVELOPMENT PRIORITIES
1.4.1 NATIONAL DEVELOPMENT PLAN (NDP) AND VISION 2030
What is the NDP? South Africa’s National Development Plan is a detailed blueprint for how the
country can eliminate poverty and reduce inequality by the year 2030. The NDP is a plan to unite
South Africans, unleash the energies of its citizens, grow an inclusive economy, build capabilities, and
5.7
-1.4
5.2
-1.6
-0.7
-6.0
-4.0
-2.0
0.0
2.0
4.0
6.0
8.0
1Q
19
98
3Q
19
98
1Q
19
99
3Q
19
99
1Q
20
00
3Q
20
00
1Q
20
01
3Q
20
01
1Q
20
02
3Q
20
02
1Q
20
03
3Q
20
03
1Q
20
04
3Q
20
04
1Q
20
05
3Q
20
05
1Q
20
06
3Q
20
06
1Q
20
07
3Q
20
07
1Q
20
08
3Q
20
08
1Q
20
09
3Q
20
09
1Q
20
10
3Q
20
10
1Q
20
11
3Q
20
11
1Q
20
12
3Q
20
12
1Q
20
13
3Q
20
13
1Q
20
14
3Q
20
14
1Q
20
15
3Q
20
15
1Q
20
16
3Q
20
16
1Q
20
17
EC RSA
3 2
Nelson Mandela Bay Metro Municipality Socio-Economic Review and Outlook 2017 5 | P a g e
enhance the capability of the state and leaders working together to solve complex problems. It defines
a desired destination and identifies the role different sectors of society need to play in reaching that
goal.
What are the broad objectives of the National Development Plan? As a long-term strategic plan, the
NDP serves four broad objectives:
1. Providing overarching goals for what we want to achieve by 2030.
2. Building consensus on the key obstacles to us achieving these goals and what needs to be
done to overcome those obstacles.
3. Providing a shared long-term strategic framework within which more detailed planning can
take place in order to advance the long-term goals set out in the NDP.
4. Creating a basis for making choices about how best to use limited resources.
What is the aim of the NDP and the targets that the NDP seeks to realise? The Plan aims to ensure
that all South Africans attain a decent standard of living through the elimination of poverty and
reduction of inequality. The core elements of a decent standard of living identified in the Plan are:
Housing, water, electricity and sanitation; Safe and reliable public transport; Quality education and
skills development; Safety and security; Quality health care; Social protection; Employment;
Recreation and leisure; Clean environment and Adequate nutrition. These are some of the targets that
should be realised by 2030.
What are the main priorities articulated in the NDP? Given the complexity of national development,
the plan sets out six interlinked priorities:
1. Uniting all South Africans around a common programme to achieve prosperity and equity.
2. Promoting active citizenry to strengthen development, democracy and accountability.
3. Bringing about faster economic growth, higher investment and greater labour absorption.
4. Focusing on key capabilities of people and the state.
5. Building a capable and developmental state.
6. Encouraging strong leadership throughout society to work together to solve problems.
Implementation, monitoring and evaluation of the NDP remain a critical element if the country is to
address its challenges.
Nelson Mandela Bay Metro Municipality Socio-Economic Review and Outlook 2017 6 | P a g e
1.4.2 PROVINCIAL PLANNING PRIORITIES
What is the Eastern Cape Vision 2030 all about? The provincial vision and long-term plan are intended
to mobilise all citizens and sectors of the Eastern Cape around a common vision. The aim is to provide
an opportunity for revisiting social partnerships and development of common goals among citizens,
the state and the private sector. The plan promotes mutual accountability between the state, citizens
and private sector and enable coherence of the three spheres of the state. It sets the development
agenda and priorities for the next 15 years (2015-2030), building on the Provincial Growth and
Development Plan (PGDP) of 2004-2014.
What are the priorities articulated in the Eastern Cape Vision 2030? The plan addresses the following
priorities:
• Redistributive, inclusive and spatially equitable economic development and growth
• Quality Health
• Education, Training & Innovation
• Institutional Capabilities
This set of priorities gives rise to the following five goals of the Vision 2030 PDP:
• Goal 1: A growing, inclusive and equitable economy which seeks to ensure a larger and more
efficient provincial economy; more employment; and reduced inequalities of income and
wealth.
• Goal 2: A healthy population through an improved health care system for the Eastern Cape.
• Goal 3: An educated, innovative citizenry. This goal seeks to ensure that people are
empowered to define their identity, are capable of sustaining their livelihoods, live healthy
lives and raise healthy families, develop a just society and economy, and play an effective role
in the politics and governance of their communities and nation.
• Goal 4: Vibrant communities. This goal seeks to generate a shift from the focus on state driven
quantitative housing delivery that has trumped the need for people to make own decisions,
build their own liveable places and transform spatial patterns as basis for vibrant and unified
communities.
• Goal 5: Capable, conscientious and accountable institutions. This goal seeks to build capable,
resilient and accountable institutions to enable and champion rapid inclusive development.
Nelson Mandela Bay Metro Municipality Socio-Economic Review and Outlook 2017 7 | P a g e
It is vital that the province becomes more coherent and unified around the development agenda it
seeks to pursue. This must include strong policy co-ordination and leadership at provincial level
(located in the Office of the Premier), and the bedding down of the often complex and unwieldy multi-
level governance arrangements that hamstring development.
The provincial priorities for 2017/18 have been pronounced as follows by the Premier of the Eastern
Cape:
• Province response to the economic downturn and economic uncertainty, particularly though
improving efficiency in budget expenditure, reduction in the ratio of compensation of employees
to total budget and increased revenue generation.
• Development and implementation of a Provincial Spatial Development Framework, including
o Small town revitalization
o Local economic development
o Integrated Human Settlements and
o Improved roads network infrastructure
• Improved integration of government programmes and functional local government.
• Transforming agriculture (including aquaculture, fisheries and forestry)
• Improving the effectiveness of provincial institutions (departments and entities)
• Drive the seven-point education plan.
• Improving provincial infrastructure through the Rapid Response Team and the implementation of
the 2030 Infrastructure Plan.
• ICT in province, including: Bhisho campus network; broadband and use of transversal contracts.
• Improve health profile of province
1.4.3 LOCAL PLANNING PRIORITIES
1.4.3.1 NDP plan for local government
The NDP Plan for local government is highlights the need to strengthen the ability of local government
to fulfil its developmental role. Municipal Integrated Development Plans (IDPs) need to be used more
strategically to focus attention on critical priorities in the NDP that relate to the mandate of local
government such as spatial planning, infrastructure and basic services. Like provincial planning
processes, municipal IDPs should be used to focus on aspects of the NDP that fit within a municipality’s
core responsibilities. This would allow the IDP process to become more manageable and the
Nelson Mandela Bay Metro Municipality Socio-Economic Review and Outlook 2017 8 | P a g e
participation process more meaningful, thus helping to narrow the gap between the aspirations
contained in these documents and what can actually be achieved. To do this effectively, the IDP
process needs to be led by municipal staff, not outsourced to consultants. As for provinces, there are
also many areas where municipalities could start implementation immediately by engaging with
aspects of the Plan that speak to their core competencies and identifying how they can action
proposals for improving implementation.
Nelson Mandela Bay Metro Municipality Socio-Economic Review and Outlook 2017 9 | P a g e
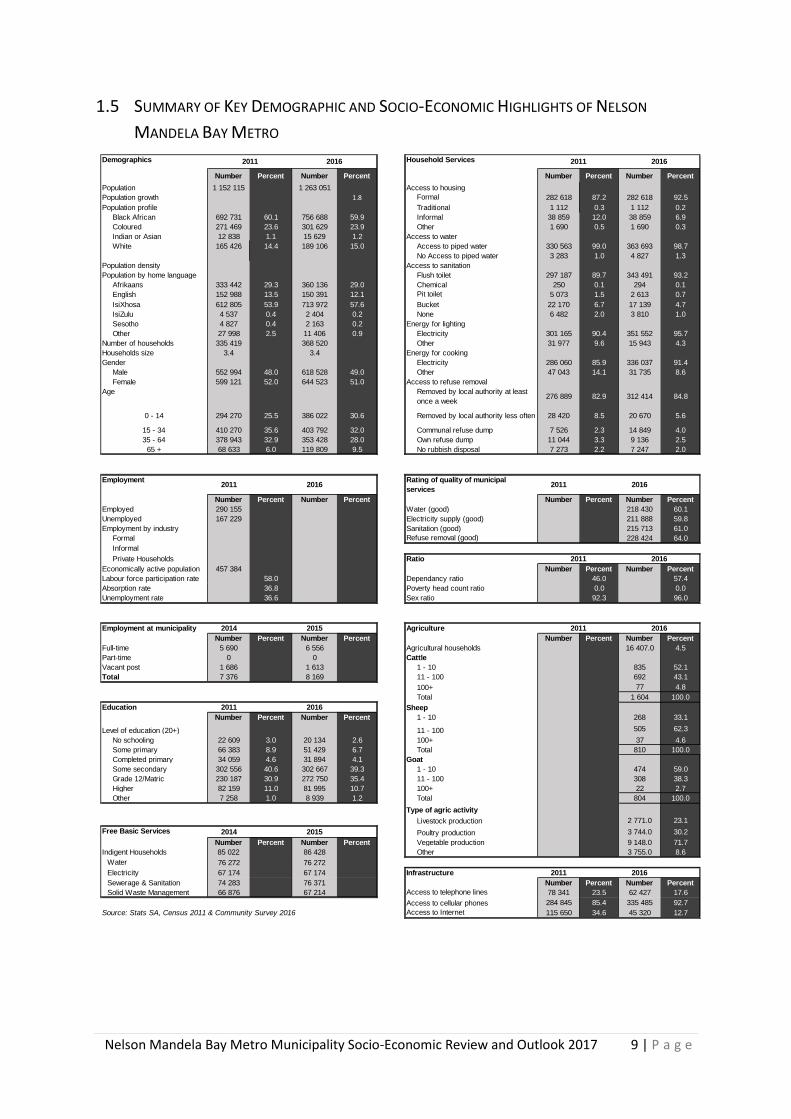
1.5 SUMMARY OF KEY DEMOGRAPHIC AND SOCIO-ECONOMIC HIGHLIGHTS OF NELSON
MANDELA BAY METRO
Demographics Household Services
Number Percent Number Percent Number Percent Number Percent
Population 1 152 115 1 263 051 Access to housing
Population growth 1.8 Formal 282 618 87.2 282 618 92.5
Population profile Traditional 1 112 0.3 1 112 0.2
Black African 692 731 60.1 756 688 59.9 Informal 38 859 12.0 38 859 6.9
Coloured 271 469 23.6 301 629 23.9 Other 1 690 0.5 1 690 0.3
Indian or Asian 12 838 1.1 15 629 1.2 Access to water
White 165 426 14.4 189 106 15.0 Access to piped water 330 563 99.0 363 693 98.7
No Access to piped water 3 283 1.0 4 827 1.3
Population density Access to sanitation
Population by home language Flush toilet 297 187 89.7 343 491 93.2
Afrikaans 333 442 29.3 360 136 29.0 Chemical 250 0.1 294 0.1
English 152 988 13.5 150 391 12.1 Pit toilet 5 073 1.5 2 613 0.7
IsiXhosa 612 805 53.9 713 972 57.6 Bucket 22 170 6.7 17 139 4.7
IsiZulu 4 537 0.4 2 404 0.2 None 6 482 2.0 3 810 1.0
Sesotho 4 827 0.4 2 163 0.2 Energy for lighting
Other 27 998 2.5 11 406 0.9 Electricity 301 165 90.4 351 552 95.7
Number of households 335 419 368 520 Other 31 977 9.6 15 943 4.3
Households size 3.4 3.4 Energy for cooking
Gender Electricity 286 060 85.9 336 037 91.4
Male 552 994 48.0 618 528 49.0 Other 47 043 14.1 31 735 8.6
Female 599 121 52.0 644 523 51.0 Access to refuse removal
Age Removed by local authority at least
once a week276 889 82.9 312 414 84.8
0 - 14 294 270 25.5 386 022 30.6 Removed by local authority less often 28 420 8.5 20 670 5.6
15 - 34 410 270 35.6 403 792 32.0 Communal refuse dump 7 526 2.3 14 849 4.0
35 - 64 378 943 32.9 353 428 28.0 Own refuse dump 11 044 3.3 9 136 2.5
65 + 68 633 6.0 119 809 9.5 No rubbish disposal 7 273 2.2 7 247 2.0
Employment2011 2016
Rating of quality of municipal
services2011 2016
Number Percent Number Percent Number Percent Number Percent
Employed 290 155 Water (good) 218 430 60.1
Unemployed 167 229 Electricity supply (good) 211 888 59.8
Employment by industry Sanitation (good) 215 713 61.0
Formal Refuse removal (good) 228 424 64.0
Informal
Private Households Ratio
Economically active population 457 384 Number Percent Number Percent
Labour force participation rate 58.0 Dependancy ratio 46.0 57.4
Absorption rate 36.8 Poverty head count ratio 0.0 0.0
Unemployment rate 36.6 Sex ratio 92.3 96.0
Employment at municipality 2014 2015 Agriculture
Number Percent Number Percent Number Percent Number Percent
Full-time 5 690 6 556 Agricultural households 16 407.0 4.5
Part-time 0 0 Cattle
Vacant post 1 686 1 613 1 - 10 835 52.1
Total 7 376 8 169 11 - 100 692 43.1
100+ 77 4.8
Total 1 604 100.0
Education 2011 2016 Sheep
Number Percent Number Percent 1 - 10 268 33.1
Level of education (20+) 11 - 100 505 62.3
No schooling 22 609 3.0 20 134 2.6 100+ 37 4.6
Some primary 66 383 8.9 51 429 6.7 Total 810 100.0
Completed primary 34 059 4.6 31 894 4.1 Goat
Some secondary 302 556 40.6 302 667 39.3 1 - 10 474 59.0
Grade 12/Matric 230 187 30.9 272 750 35.4 11 - 100 308 38.3
Higher 82 159 11.0 81 995 10.7 100+ 22 2.7
Other 7 258 1.0 8 939 1.2 Total 804 100.0
Type of agric activity
Livestock production 2 771.0 23.1
Free Basic Services 2014 2015 Poultry production 3 744.0 30.2
Number Percent Number Percent Vegetable production 9 148.0 71.7
Indigent Households 85 022 86 428 Other 3 755.0 8.6
Water 76 272 76 272
Electricity 67 174 67 174 Infrastructure 2011 2016
Sewerage & Sanitation 74 283 76 371 Number Percent Number Percent
Solid Waste Management 66 876 67 214 Access to telephone lines 78 341 23.5 62 427 17.6
Access to cellular phones 284 845 85.4 335 485 92.7
Source: Stats SA, Census 2011 & Community Survey 2016 Access to Internet 115 650 34.6 45 320 12.7
2011 2016
2011 2016
2011 201620162011
Nelson Mandela Bay Metro Municipality Socio-Economic Review and Outlook 2017 10 | P a g e
2. DEMOGRAPHY
"Demographics", or "population characteristics", includes analysis of the population of a region.
Distributions of values within a demographic variable, and across households, as well as trends over
time are of interest.
In this section, an overview is provided of the demography of the Nelson Mandela Bay Metropolitan
Municipality and all its neighbouring regions, the Eastern Cape Province and South Africa as a whole.
2.1 TOTAL POPULATION
Population statistics is important when analysing an economy, as the population growth directly and
indirectly impacts employment and unemployment, as well as other economic indicators such as
economic growth and per capita income.
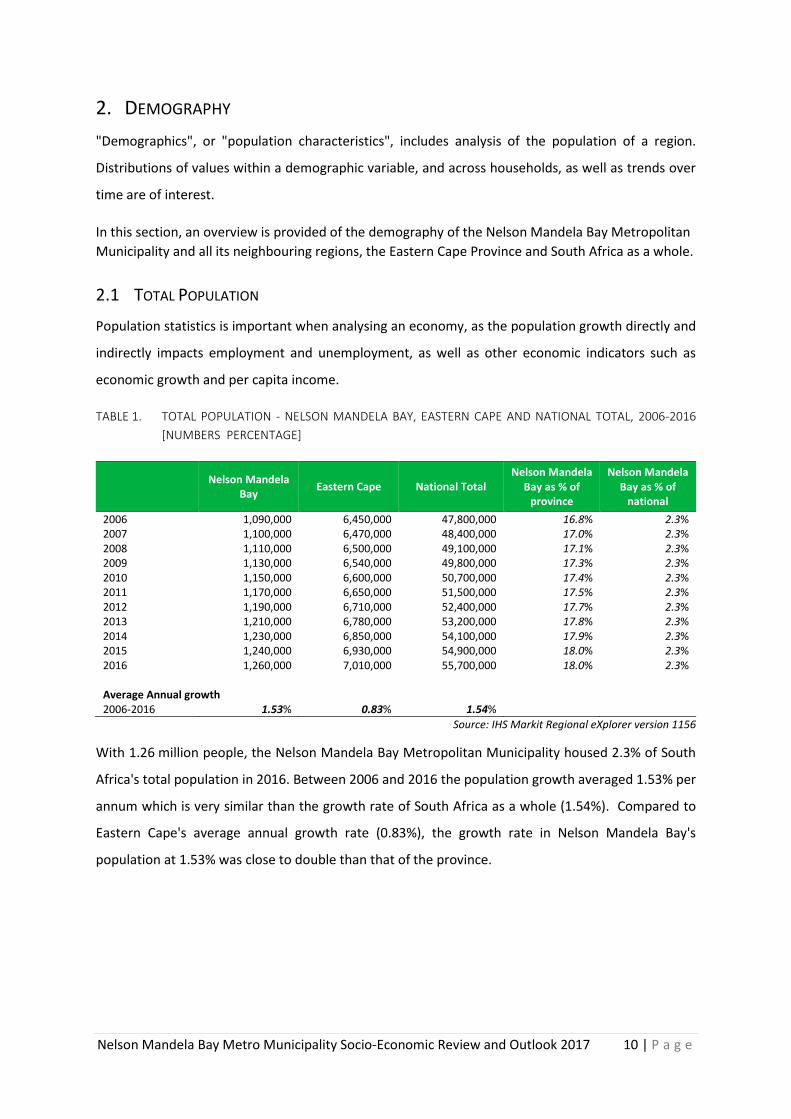
TABLE 1. TOTAL POPULATION - NELSON MANDELA BAY, EASTERN CAPE AND NATIONAL TOTAL, 2006-2016
[NUMBERS PERCENTAGE]
Nelson Mandela
Bay Eastern Cape National Total
Nelson Mandela Bay as % of
province
Nelson Mandela Bay as % of
national
2006 1,090,000 6,450,000 47,800,000 16.8% 2.3% 2007 1,100,000 6,470,000 48,400,000 17.0% 2.3% 2008 1,110,000 6,500,000 49,100,000 17.1% 2.3% 2009 1,130,000 6,540,000 49,800,000 17.3% 2.3% 2010 1,150,000 6,600,000 50,700,000 17.4% 2.3% 2011 1,170,000 6,650,000 51,500,000 17.5% 2.3% 2012 1,190,000 6,710,000 52,400,000 17.7% 2.3% 2013 1,210,000 6,780,000 53,200,000 17.8% 2.3% 2014 1,230,000 6,850,000 54,100,000 17.9% 2.3% 2015 1,240,000 6,930,000 54,900,000 18.0% 2.3% 2016 1,260,000 7,010,000 55,700,000 18.0% 2.3% Average Annual growth 2006-2016 1.53% 0.83% 1.54%
Source: IHS Markit Regional eXplorer version 1156
With 1.26 million people, the Nelson Mandela Bay Metropolitan Municipality housed 2.3% of South
Africa's total population in 2016. Between 2006 and 2016 the population growth averaged 1.53% per
annum which is very similar than the growth rate of South Africa as a whole (1.54%). Compared to
Eastern Cape's average annual growth rate (0.83%), the growth rate in Nelson Mandela Bay's
population at 1.53% was close to double than that of the province.
Nelson Mandela Bay Metro Municipality Socio-Economic Review and Outlook 2017 11 | P a g e
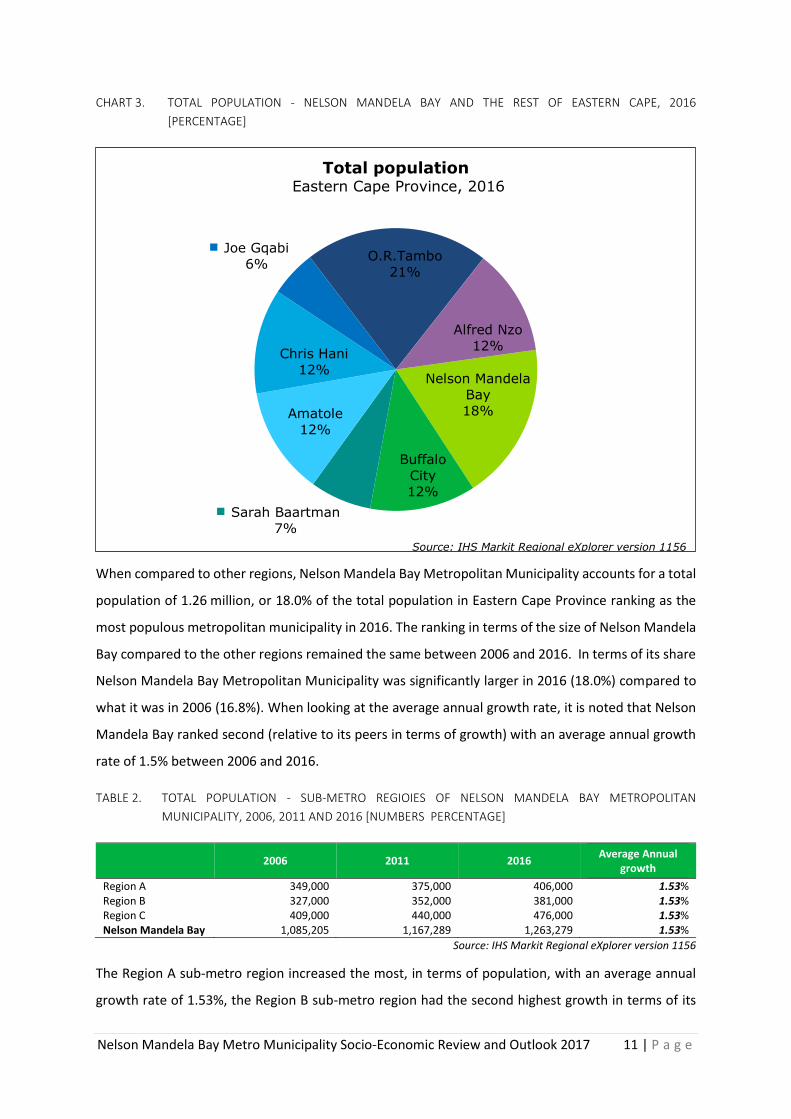
CHART 3. TOTAL POPULATION - NELSON MANDELA BAY AND THE REST OF EASTERN CAPE, 2016
[PERCENTAGE]
When compared to other regions, Nelson Mandela Bay Metropolitan Municipality accounts for a total
population of 1.26 million, or 18.0% of the total population in Eastern Cape Province ranking as the
most populous metropolitan municipality in 2016. The ranking in terms of the size of Nelson Mandela
Bay compared to the other regions remained the same between 2006 and 2016. In terms of its share
Nelson Mandela Bay Metropolitan Municipality was significantly larger in 2016 (18.0%) compared to
what it was in 2006 (16.8%). When looking at the average annual growth rate, it is noted that Nelson
Mandela Bay ranked second (relative to its peers in terms of growth) with an average annual growth
rate of 1.5% between 2006 and 2016.
TABLE 2. TOTAL POPULATION - SUB-METRO REGIOIES OF NELSON MANDELA BAY METROPOLITAN
MUNICIPALITY, 2006, 2011 AND 2016 [NUMBERS PERCENTAGE]
2006 2011 2016 Average Annual
growth
Region A 349,000 375,000 406,000 1.53% Region B 327,000 352,000 381,000 1.53% Region C 409,000 440,000 476,000 1.53% Nelson Mandela Bay 1,085,205 1,167,289 1,263,279 1.53%
Source: IHS Markit Regional eXplorer version 1156
The Region A sub-metro region increased the most, in terms of population, with an average annual
growth rate of 1.53%, the Region B sub-metro region had the second highest growth in terms of its
Nelson Mandela
Bay
18%
Buffalo
City
12%
Sarah Baartman
7%
Amatole
12%
Chris Hani
12%
Joe Gqabi
6%O.R.Tambo
21%
Alfred Nzo
12%
Total population Eastern Cape Province, 2016
Source: IHS Markit Regional eXplorer version 1156
Nelson Mandela Bay Metro Municipality Socio-Economic Review and Outlook 2017 12 | P a g e
population, with an average annual growth rate of 1.53%. The Region C sub-metro region had the
lowest average annual growth rate of 1.53% relative to the other within Nelson Mandela Bay
Metropolitan Municipality.
2.1.1 POPULATION PROJECTIONS
Based on the present age-gender structure and the present fertility, mortality and migration rates,
Nelson Mandela Bay's population is projected to grow at an average annual rate of 1.3% from
1.26 million in 2016 to 1.35 million in 2021.
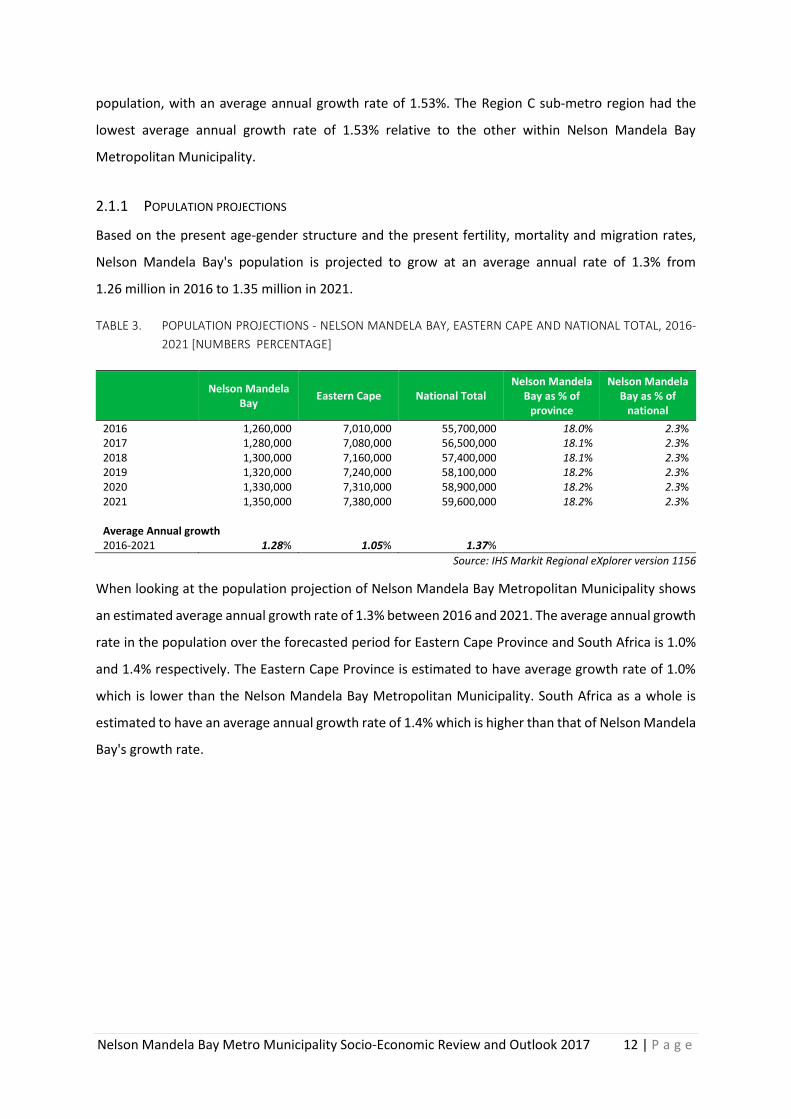
TABLE 3. POPULATION PROJECTIONS - NELSON MANDELA BAY, EASTERN CAPE AND NATIONAL TOTAL, 2016-
2021 [NUMBERS PERCENTAGE]
Nelson Mandela
Bay Eastern Cape National Total
Nelson Mandela Bay as % of
province
Nelson Mandela Bay as % of
national
2016 1,260,000 7,010,000 55,700,000 18.0% 2.3% 2017 1,280,000 7,080,000 56,500,000 18.1% 2.3% 2018 1,300,000 7,160,000 57,400,000 18.1% 2.3% 2019 1,320,000 7,240,000 58,100,000 18.2% 2.3% 2020 1,330,000 7,310,000 58,900,000 18.2% 2.3% 2021 1,350,000 7,380,000 59,600,000 18.2% 2.3% Average Annual growth 2016-2021 1.28% 1.05% 1.37%
Source: IHS Markit Regional eXplorer version 1156
When looking at the population projection of Nelson Mandela Bay Metropolitan Municipality shows
an estimated average annual growth rate of 1.3% between 2016 and 2021. The average annual growth
rate in the population over the forecasted period for Eastern Cape Province and South Africa is 1.0%
and 1.4% respectively. The Eastern Cape Province is estimated to have average growth rate of 1.0%
which is lower than the Nelson Mandela Bay Metropolitan Municipality. South Africa as a whole is
estimated to have an average annual growth rate of 1.4% which is higher than that of Nelson Mandela
Bay's growth rate.
Nelson Mandela Bay Metro Municipality Socio-Economic Review and Outlook 2017 13 | P a g e
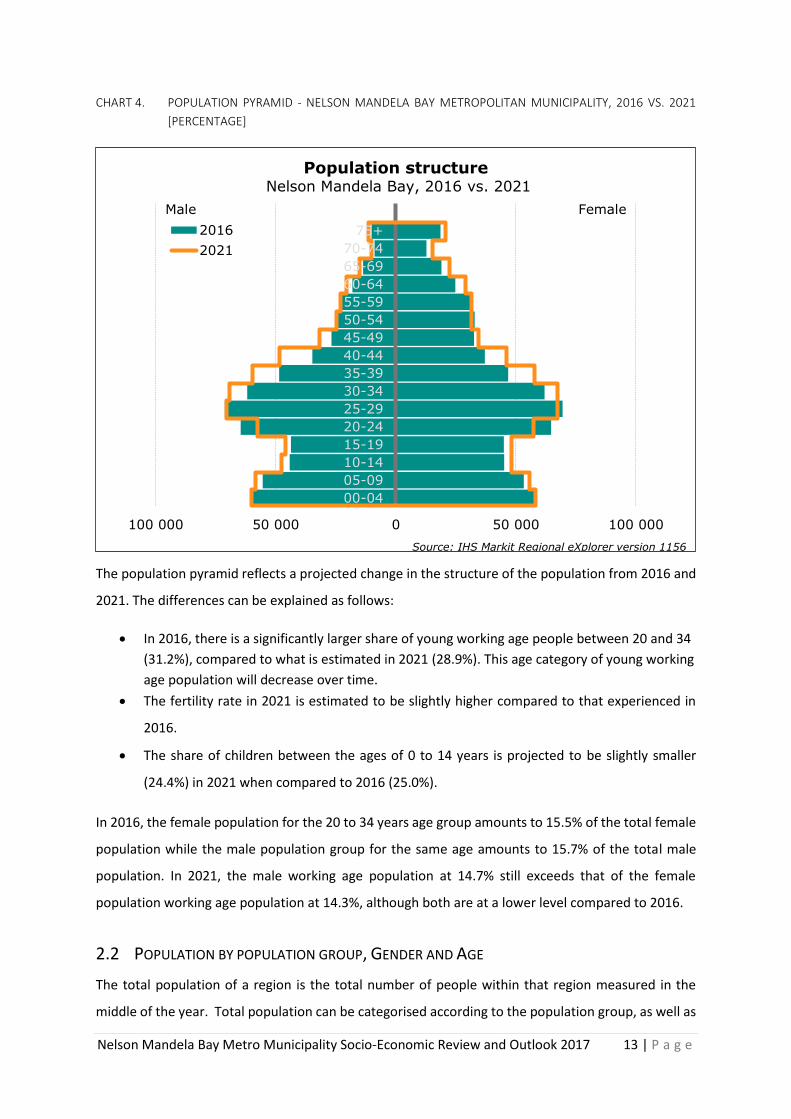
CHART 4. POPULATION PYRAMID - NELSON MANDELA BAY METROPOLITAN MUNICIPALITY, 2016 VS. 2021
[PERCENTAGE]
The population pyramid reflects a projected change in the structure of the population from 2016 and
2021. The differences can be explained as follows:
• In 2016, there is a significantly larger share of young working age people between 20 and 34
(31.2%), compared to what is estimated in 2021 (28.9%). This age category of young working
age population will decrease over time.
• The fertility rate in 2021 is estimated to be slightly higher compared to that experienced in
2016.
• The share of children between the ages of 0 to 14 years is projected to be slightly smaller
(24.4%) in 2021 when compared to 2016 (25.0%).
In 2016, the female population for the 20 to 34 years age group amounts to 15.5% of the total female
population while the male population group for the same age amounts to 15.7% of the total male
population. In 2021, the male working age population at 14.7% still exceeds that of the female
population working age population at 14.3%, although both are at a lower level compared to 2016.
2.2 POPULATION BY POPULATION GROUP, GENDER AND AGE
The total population of a region is the total number of people within that region measured in the
middle of the year. Total population can be categorised according to the population group, as well as
100 000 50 000 0 50 000 100 000
00-04
05-09
10-14
15-19
20-24
25-29
30-34
35-39
40-44
45-49
50-54
55-59
60-64
65-69
70-74
75+
Population structure Nelson Mandela Bay, 2016 vs. 2021
2016
2021
Male Female
Source: IHS Markit Regional eXplorer version 1156
Nelson Mandela Bay Metro Municipality Socio-Economic Review and Outlook 2017 14 | P a g e
the sub-categories of age and gender. The population groups include African, White, Coloured and
Asian, where the Asian group includes all people originating from Asia, India and China. The age
subcategory divides the population into 5-year cohorts, e.g. 0-4, 5-9, 10-13, etc.
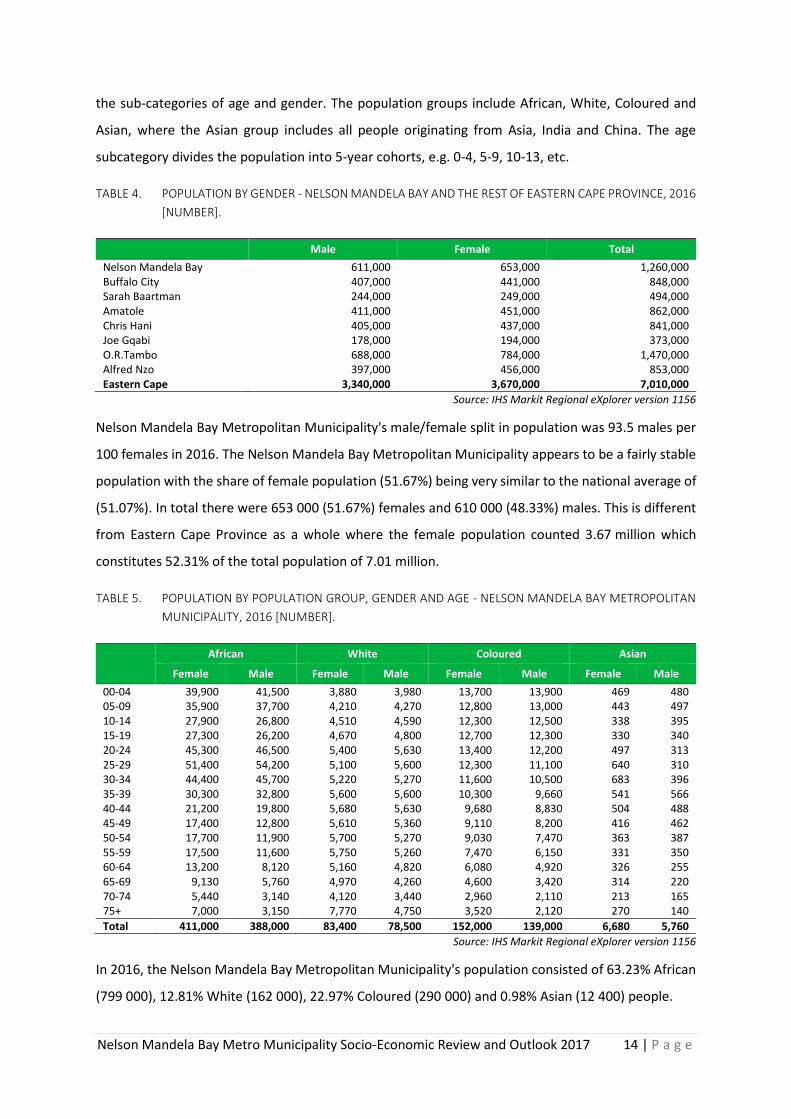
TABLE 4. POPULATION BY GENDER - NELSON MANDELA BAY AND THE REST OF EASTERN CAPE PROVINCE, 2016
[NUMBER].
Male Female Total
Nelson Mandela Bay 611,000 653,000 1,260,000 Buffalo City 407,000 441,000 848,000 Sarah Baartman 244,000 249,000 494,000 Amatole 411,000 451,000 862,000 Chris Hani 405,000 437,000 841,000 Joe Gqabi 178,000 194,000 373,000 O.R.Tambo 688,000 784,000 1,470,000 Alfred Nzo 397,000 456,000 853,000 Eastern Cape 3,340,000 3,670,000 7,010,000
Source: IHS Markit Regional eXplorer version 1156
Nelson Mandela Bay Metropolitan Municipality's male/female split in population was 93.5 males per
100 females in 2016. The Nelson Mandela Bay Metropolitan Municipality appears to be a fairly stable
population with the share of female population (51.67%) being very similar to the national average of
(51.07%). In total there were 653 000 (51.67%) females and 610 000 (48.33%) males. This is different
from Eastern Cape Province as a whole where the female population counted 3.67 million which
constitutes 52.31% of the total population of 7.01 million.
TABLE 5. POPULATION BY POPULATION GROUP, GENDER AND AGE - NELSON MANDELA BAY METROPOLITAN
MUNICIPALITY, 2016 [NUMBER].
African White Coloured Asian
Female Male Female Male Female Male Female Male
00-04 39,900 41,500 3,880 3,980 13,700 13,900 469 480 05-09 35,900 37,700 4,210 4,270 12,800 13,000 443 497 10-14 27,900 26,800 4,510 4,590 12,300 12,500 338 395 15-19 27,300 26,200 4,670 4,800 12,700 12,300 330 340 20-24 45,300 46,500 5,400 5,630 13,400 12,200 497 313 25-29 51,400 54,200 5,100 5,600 12,300 11,100 640 310 30-34 44,400 45,700 5,220 5,270 11,600 10,500 683 396 35-39 30,300 32,800 5,600 5,600 10,300 9,660 541 566 40-44 21,200 19,800 5,680 5,630 9,680 8,830 504 488 45-49 17,400 12,800 5,610 5,360 9,110 8,200 416 462 50-54 17,700 11,900 5,700 5,270 9,030 7,470 363 387 55-59 17,500 11,600 5,750 5,260 7,470 6,150 331 350 60-64 13,200 8,120 5,160 4,820 6,080 4,920 326 255 65-69 9,130 5,760 4,970 4,260 4,600 3,420 314 220 70-74 5,440 3,140 4,120 3,440 2,960 2,110 213 165 75+ 7,000 3,150 7,770 4,750 3,520 2,120 270 140
Total 411,000 388,000 83,400 78,500 152,000 139,000 6,680 5,760
Source: IHS Markit Regional eXplorer version 1156
In 2016, the Nelson Mandela Bay Metropolitan Municipality's population consisted of 63.23% African
(799 000), 12.81% White (162 000), 22.97% Coloured (290 000) and 0.98% Asian (12 400) people.
Nelson Mandela Bay Metro Municipality Socio-Economic Review and Outlook 2017 15 | P a g e
The largest share of population is within the young working age (25-44 years) age category with a total
number of 432 000 or 34.2% of the total population. The age category with the second largest number
of people is the babies and kids (0-14 years) age category with a total share of 25.0%, followed by the
teenagers and youth (15-24 years) age category with 218 000 people. The age category with the least
number of people is the retired / old age (65 years and older) age category with only 83 000 people,
as reflected in the population pyramids below.
2.2.1 POPULATION PYRAMIDS
Definition: A population pyramid is a graphic representation of the population categorised by gender
and age, for a specific year and region. The horizontal axis depicts the share of people,
where the male population is charted on the left-hand side and the female population on
the right-hand side of the vertical axis. The vertical axis is divided in 5-year age categories.
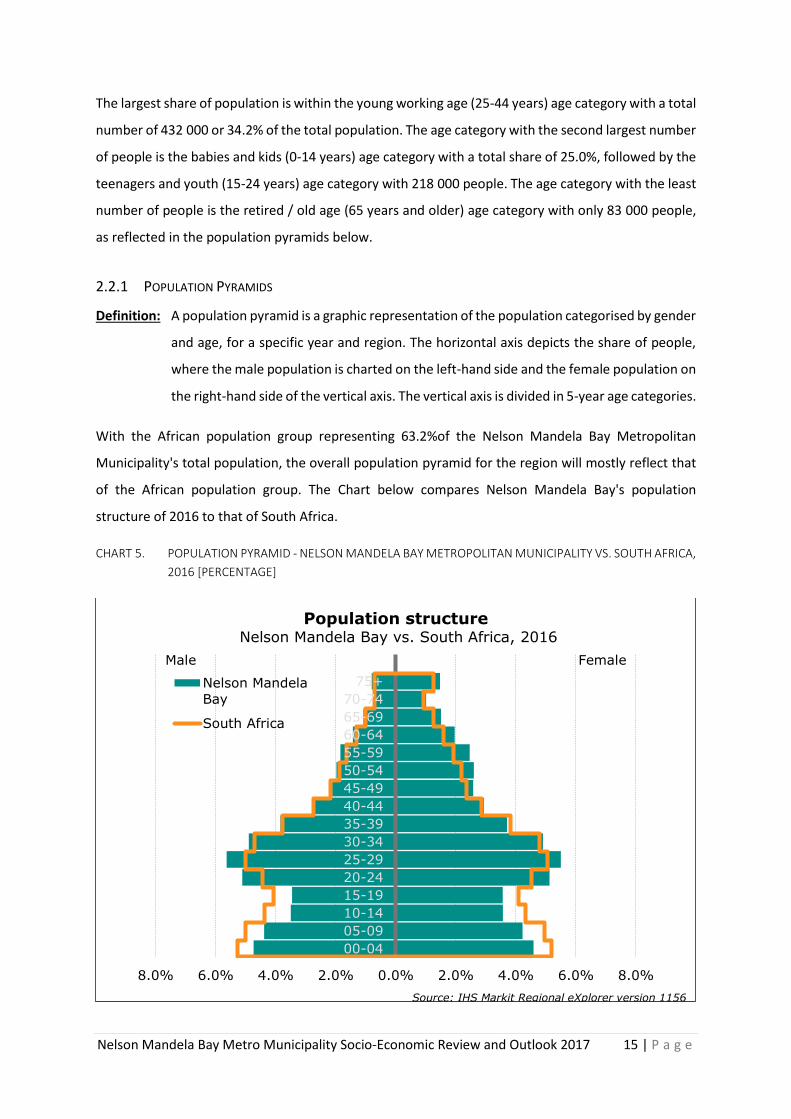
With the African population group representing 63.2%of the Nelson Mandela Bay Metropolitan
Municipality's total population, the overall population pyramid for the region will mostly reflect that
of the African population group. The Chart below compares Nelson Mandela Bay's population
structure of 2016 to that of South Africa.
CHART 5. POPULATION PYRAMID - NELSON MANDELA BAY METROPOLITAN MUNICIPALITY VS. SOUTH AFRICA,
2016 [PERCENTAGE]
8.0% 6.0% 4.0% 2.0% 0.0% 2.0% 4.0% 6.0% 8.0%
00-04
05-09
10-14
15-19
20-24
25-29
30-34
35-39
40-44
45-49
50-54
55-59
60-64
65-69
70-74
75+
Population structure Nelson Mandela Bay vs. South Africa, 2016
Nelson Mandela
Bay
South Africa
Male Female
Source: IHS Markit Regional eXplorer version 1156
Nelson Mandela Bay Metro Municipality Socio-Economic Review and Outlook 2017 16 | P a g e
By comparing the population pyramid of the Nelson Mandela Bay Metropolitan Municipality with the
national age structure, the most significant differences are:
• There is a significantly larger share of young working age people - aged 20 to 34 (31.2%) - in
Nelson Mandela Bay, compared to the national picture (28.6%).
• The area appears to be a migrant receiving area, with many of people migrating into Nelson
Mandela Bay, either from abroad, or from the more rural areas in the country looking for
better opportunities.
• Fertility in Nelson Mandela Bay is slightly lower compared to South Africa as a whole.
• Spatial policies changed since 1994.
• The share of children between the ages of 0 to 14 years is significant smaller (25.0%) in Nelson
Mandela Bay compared to South Africa (29.2%). Demand for expenditure on schooling as
percentage of total budget within Nelson Mandela Bay Metropolitan Municipality will
therefore be lower than that of South Africa.
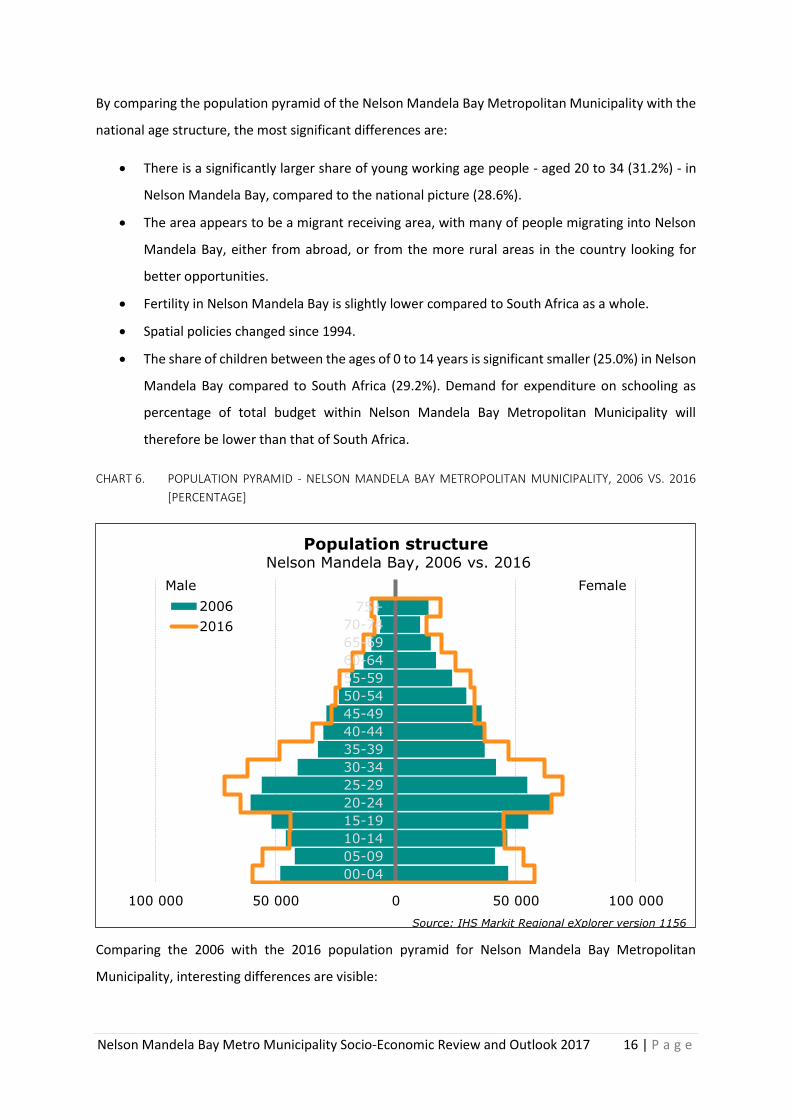
CHART 6. POPULATION PYRAMID - NELSON MANDELA BAY METROPOLITAN MUNICIPALITY, 2006 VS. 2016
[PERCENTAGE]
Comparing the 2006 with the 2016 population pyramid for Nelson Mandela Bay Metropolitan
Municipality, interesting differences are visible:
100 000 50 000 0 50 000 100 000
00-04
05-09
10-14
15-19
20-24
25-29
30-34
35-39
40-44
45-49
50-54
55-59
60-64
65-69
70-74
75+
Population structure Nelson Mandela Bay, 2006 vs. 2016
2006
2016
Male Female
Source: IHS Markit Regional eXplorer version 1156
Nelson Mandela Bay Metro Municipality Socio-Economic Review and Outlook 2017 17 | P a g e
• In 2006, there were a significant smaller share of young working age people - aged 20 to 34
(29.3%) - compared to 2016 (31.2%).
• Fertility in 2006 was slightly lower compared to that of 2016.
• The share of children between the ages of 0 to 14 years is very similar in 2006 (24.9%)
compared to 2016 (25.0%).
• Life expectancy is increasing.
In 2016, the female population for the 20 to 34 years age group amounted to 14.8% of the total female
population while the male population group for the same age amounted to 14.5% of the total male
population. In 2006 the male working age population at 15.7% still exceeds that of the female
population working age population at 15.5%.
2.3 NUMBER OF HOUSEHOLDS BY POPULATION GROUP
Definition: A household is either a group of people who live together and provide themselves jointly
with food and/or other essentials for living, or it is a single person living on his/her own.
An individual is considered part of a household if he/she spends at least four nights a
week within the household. To categorise a household according to population group,
the population group to which the head of the household belongs, is used.
If the number of households is growing at a faster rate than that of the population it means that the
average household size is decreasing, and vice versa. In 2016, the Nelson Mandela Bay Metropolitan
Municipality comprised of 353 000 households. This equates to an average annual growth rate of
1.76% in the number of households from 2006 to 2016. With an average annual growth rate of 1.53%
in the total population, the average household size in the Nelson Mandela Bay Metropolitan
Municipality is by implication decreasing. This is confirmed by the data where the average household
size in 2006 decreased from approximately 3.7 individuals per household to 3.6 persons per household
in 2016.
Nelson Mandela Bay Metro Municipality Socio-Economic Review and Outlook 2017 18 | P a g e
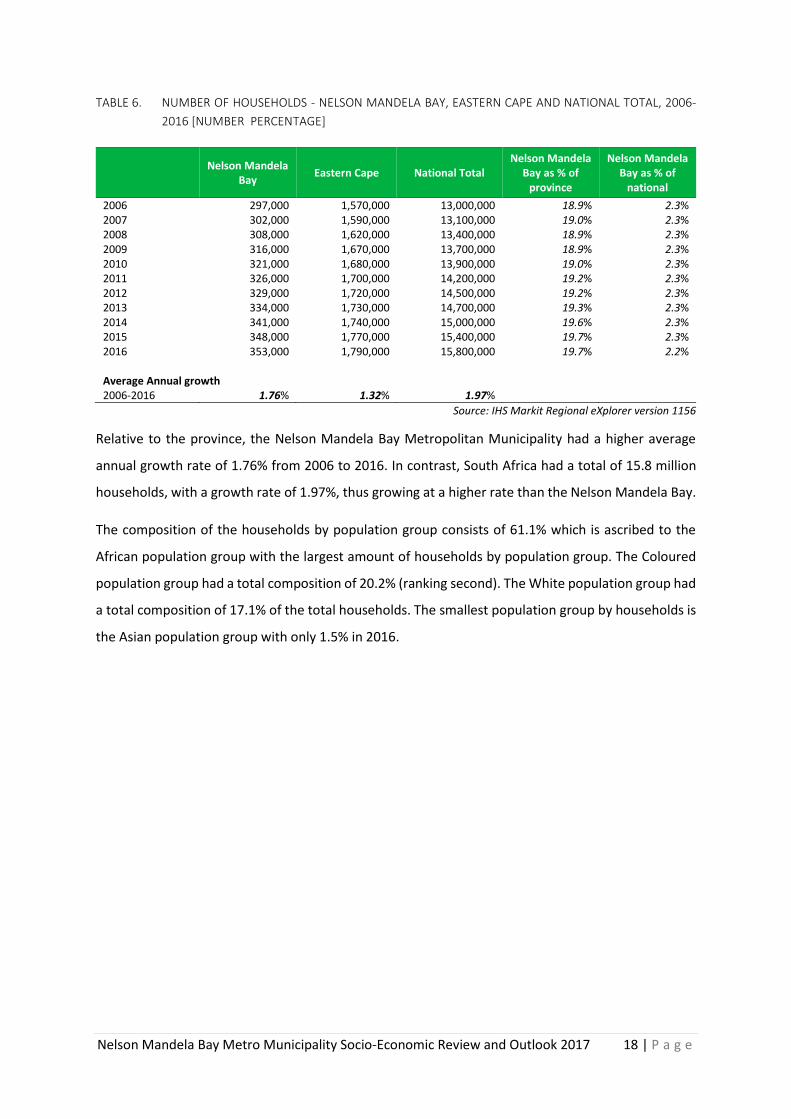
TABLE 6. NUMBER OF HOUSEHOLDS - NELSON MANDELA BAY, EASTERN CAPE AND NATIONAL TOTAL, 2006-
2016 [NUMBER PERCENTAGE]
Nelson Mandela
Bay Eastern Cape National Total
Nelson Mandela Bay as % of
province
Nelson Mandela Bay as % of
national
2006 297,000 1,570,000 13,000,000 18.9% 2.3% 2007 302,000 1,590,000 13,100,000 19.0% 2.3% 2008 308,000 1,620,000 13,400,000 18.9% 2.3% 2009 316,000 1,670,000 13,700,000 18.9% 2.3% 2010 321,000 1,680,000 13,900,000 19.0% 2.3% 2011 326,000 1,700,000 14,200,000 19.2% 2.3% 2012 329,000 1,720,000 14,500,000 19.2% 2.3% 2013 334,000 1,730,000 14,700,000 19.3% 2.3% 2014 341,000 1,740,000 15,000,000 19.6% 2.3% 2015 348,000 1,770,000 15,400,000 19.7% 2.3% 2016 353,000 1,790,000 15,800,000 19.7% 2.2% Average Annual growth 2006-2016 1.76% 1.32% 1.97%
Source: IHS Markit Regional eXplorer version 1156
Relative to the province, the Nelson Mandela Bay Metropolitan Municipality had a higher average
annual growth rate of 1.76% from 2006 to 2016. In contrast, South Africa had a total of 15.8 million
households, with a growth rate of 1.97%, thus growing at a higher rate than the Nelson Mandela Bay.
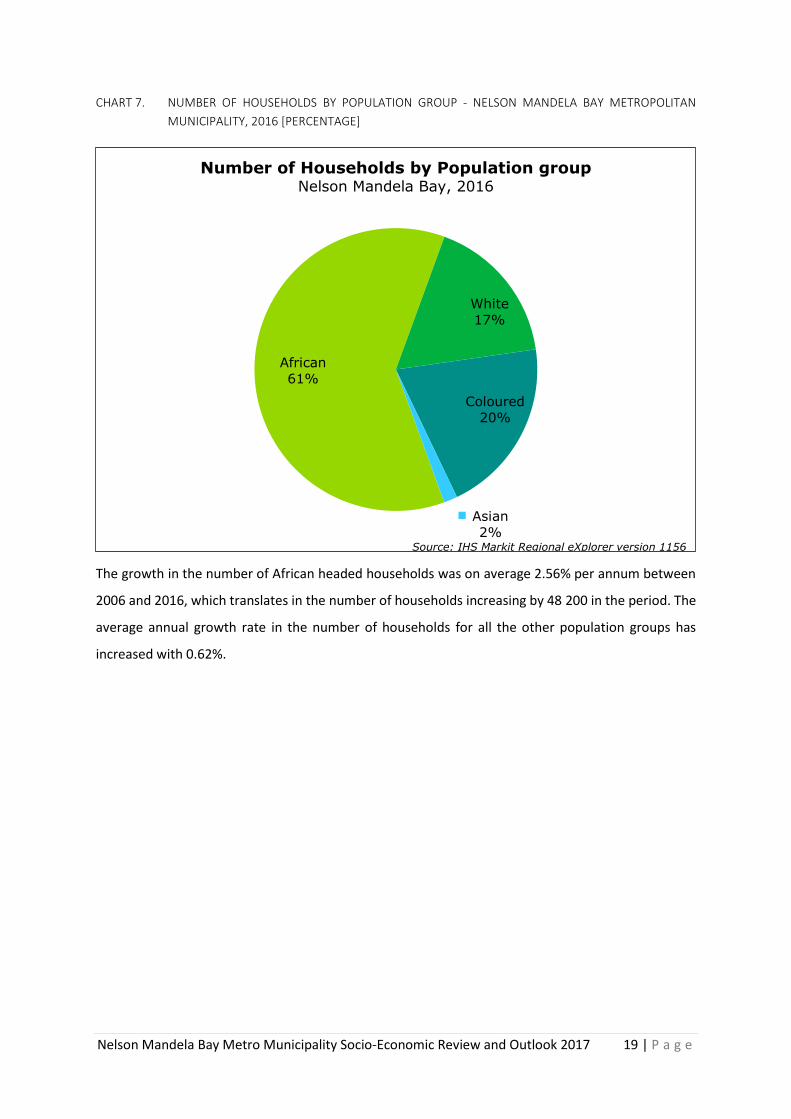
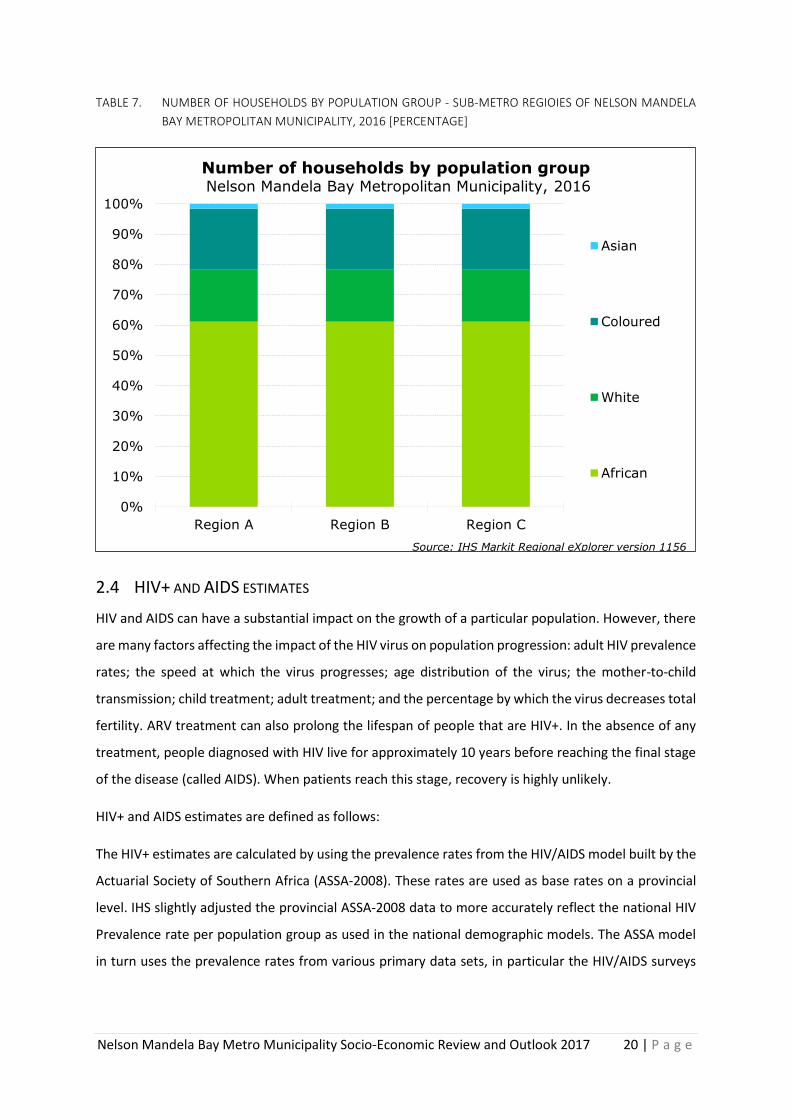
The composition of the households by population group consists of 61.1% which is ascribed to the
African population group with the largest amount of households by population group. The Coloured
population group had a total composition of 20.2% (ranking second). The White population group had
a total composition of 17.1% of the total households. The smallest population group by households is
the Asian population group with only 1.5% in 2016.
Nelson Mandela Bay Metro Municipality Socio-Economic Review and Outlook 2017 19 | P a g e
CHART 7. NUMBER OF HOUSEHOLDS BY POPULATION GROUP - NELSON MANDELA BAY METROPOLITAN
MUNICIPALITY, 2016 [PERCENTAGE]
The growth in the number of African headed households was on average 2.56% per annum between
2006 and 2016, which translates in the number of households increasing by 48 200 in the period. The
average annual growth rate in the number of households for all the other population groups has
increased with 0.62%.
African
61%
White
17%
Coloured
20%
Asian
2%
Number of Households by Population groupNelson Mandela Bay, 2016
Source: IHS Markit Regional eXplorer version 1156
Nelson Mandela Bay Metro Municipality Socio-Economic Review and Outlook 2017 20 | P a g e
TABLE 7. NUMBER OF HOUSEHOLDS BY POPULATION GROUP - SUB-METRO REGIOIES OF NELSON MANDELA
BAY METROPOLITAN MUNICIPALITY, 2016 [PERCENTAGE]
2.4 HIV+ AND AIDS ESTIMATES
HIV and AIDS can have a substantial impact on the growth of a particular population. However, there
are many factors affecting the impact of the HIV virus on population progression: adult HIV prevalence
rates; the speed at which the virus progresses; age distribution of the virus; the mother-to-child
transmission; child treatment; adult treatment; and the percentage by which the virus decreases total
fertility. ARV treatment can also prolong the lifespan of people that are HIV+. In the absence of any
treatment, people diagnosed with HIV live for approximately 10 years before reaching the final stage
of the disease (called AIDS). When patients reach this stage, recovery is highly unlikely.
HIV+ and AIDS estimates are defined as follows:
The HIV+ estimates are calculated by using the prevalence rates from the HIV/AIDS model built by the
Actuarial Society of Southern Africa (ASSA-2008). These rates are used as base rates on a provincial
level. IHS slightly adjusted the provincial ASSA-2008 data to more accurately reflect the national HIV
Prevalence rate per population group as used in the national demographic models. The ASSA model
in turn uses the prevalence rates from various primary data sets, in particular the HIV/AIDS surveys
0%
10%
20%
30%
40%
50%
60%
70%
80%
90%
100%
Region A Region B Region C
Number of households by population group Nelson Mandela Bay Metropolitan Municipality, 2016
Asian
Coloured
White
African
Source: IHS Markit Regional eXplorer version 1156
Nelson Mandela Bay Metro Municipality Socio-Economic Review and Outlook 2017 21 | P a g e
conducted by the Department of Health and the Antenatal clinic surveys. Their rates are further
adjusted for over-reporting and then smoothed.
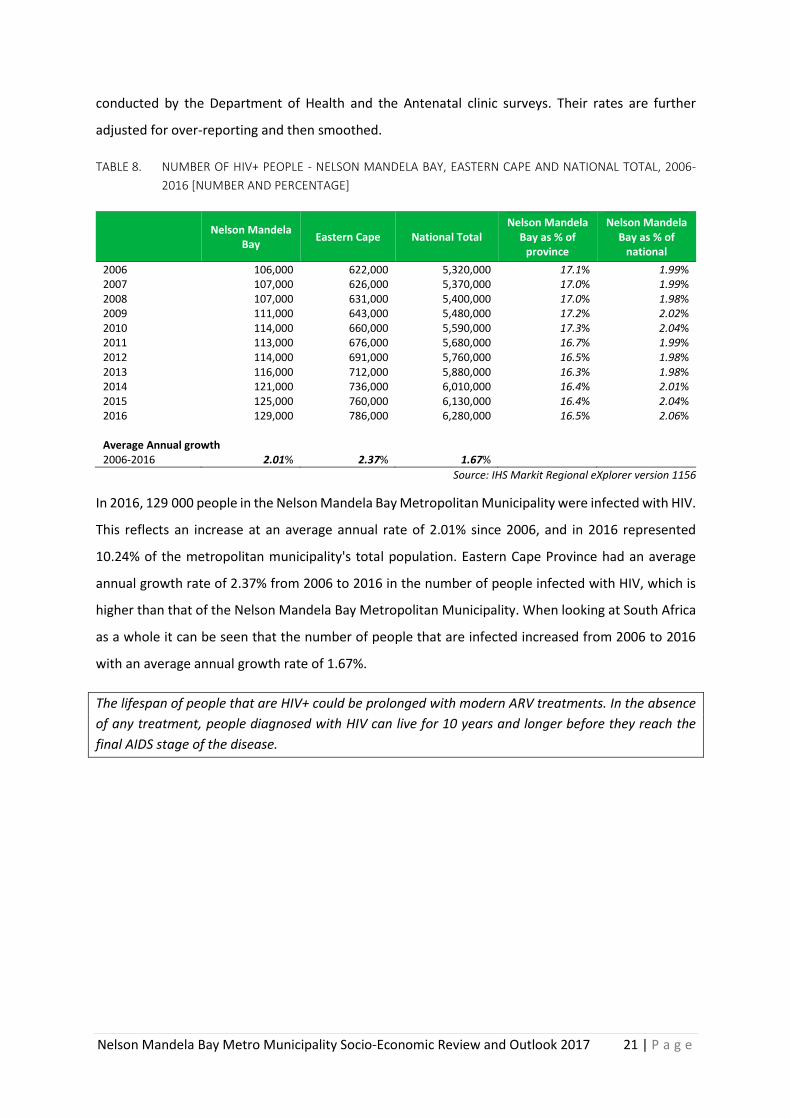
TABLE 8. NUMBER OF HIV+ PEOPLE - NELSON MANDELA BAY, EASTERN CAPE AND NATIONAL TOTAL, 2006-
2016 [NUMBER AND PERCENTAGE]
Nelson Mandela
Bay Eastern Cape National Total
Nelson Mandela Bay as % of
province
Nelson Mandela Bay as % of
national
2006 106,000 622,000 5,320,000 17.1% 1.99% 2007 107,000 626,000 5,370,000 17.0% 1.99% 2008 107,000 631,000 5,400,000 17.0% 1.98% 2009 111,000 643,000 5,480,000 17.2% 2.02% 2010 114,000 660,000 5,590,000 17.3% 2.04% 2011 113,000 676,000 5,680,000 16.7% 1.99% 2012 114,000 691,000 5,760,000 16.5% 1.98% 2013 116,000 712,000 5,880,000 16.3% 1.98% 2014 121,000 736,000 6,010,000 16.4% 2.01% 2015 125,000 760,000 6,130,000 16.4% 2.04% 2016 129,000 786,000 6,280,000 16.5% 2.06% Average Annual growth 2006-2016 2.01% 2.37% 1.67%
Source: IHS Markit Regional eXplorer version 1156
In 2016, 129 000 people in the Nelson Mandela Bay Metropolitan Municipality were infected with HIV.
This reflects an increase at an average annual rate of 2.01% since 2006, and in 2016 represented
10.24% of the metropolitan municipality's total population. Eastern Cape Province had an average
annual growth rate of 2.37% from 2006 to 2016 in the number of people infected with HIV, which is
higher than that of the Nelson Mandela Bay Metropolitan Municipality. When looking at South Africa
as a whole it can be seen that the number of people that are infected increased from 2006 to 2016
with an average annual growth rate of 1.67%.
The lifespan of people that are HIV+ could be prolonged with modern ARV treatments. In the absence
of any treatment, people diagnosed with HIV can live for 10 years and longer before they reach the
final AIDS stage of the disease.
Nelson Mandela Bay Metro Municipality Socio-Economic Review and Outlook 2017 22 | P a g e
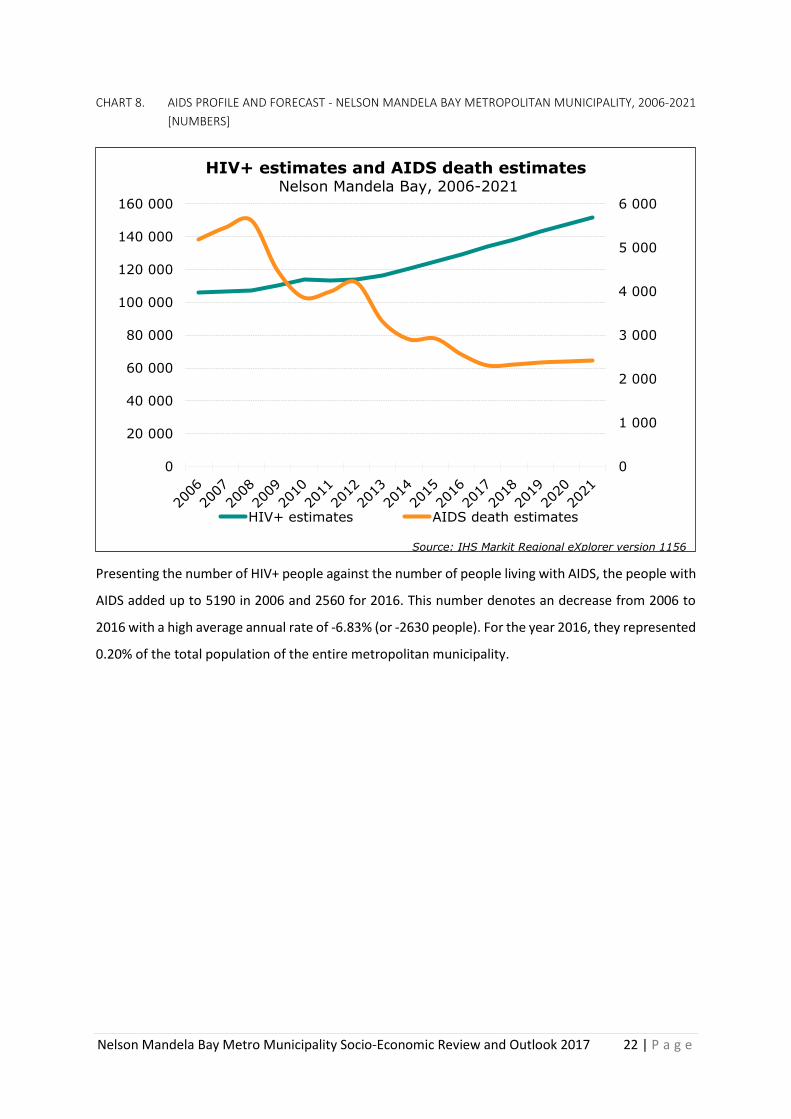
CHART 8. AIDS PROFILE AND FORECAST - NELSON MANDELA BAY METROPOLITAN MUNICIPALITY, 2006-2021
[NUMBERS]
Presenting the number of HIV+ people against the number of people living with AIDS, the people with
AIDS added up to 5190 in 2006 and 2560 for 2016. This number denotes an decrease from 2006 to
2016 with a high average annual rate of -6.83% (or -2630 people). For the year 2016, they represented
0.20% of the total population of the entire metropolitan municipality.
0
1 000
2 000
3 000
4 000
5 000
6 000
0
20 000
40 000
60 000
80 000
100 000
120 000
140 000
160 000
HIV+ estimates and AIDS death estimates Nelson Mandela Bay, 2006-2021
HIV+ estimates AIDS death estimates
Source: IHS Markit Regional eXplorer version 1156
Nelson Mandela Bay Metro Municipality Socio-Economic Review and Outlook 2017 23 | P a g e
3. ECONOMY
The economic state of Nelson Mandela Bay Metropolitan Municipality is put in perspective by
comparing it on a spatial level with its neighbouring metropolitan municipalities, Eastern Cape
Province and South Africa. The section will also allude to the economic composition and contribution
of the regions within Nelson Mandela Bay Metropolitan Municipality.
The Nelson Mandela Bay Metropolitan Municipality does not function in isolation from Eastern Cape,
South Africa and the world and now, more than ever, it is crucial to have reliable information on its
economy for effective planning. Information is needed that will empower the municipality to plan and
implement policies that will encourage the social development and economic growth of the people
and industries in the municipality respectively.
3.1 GROSS DOMESTIC PRODUCT BY REGION (GDP-R)
The Gross Domestic Product (GDP), an important indicator of economic performance, is used to
compare economies and economic states.
Definition: Gross Domestic Product by Region (GDP-R) represents the value of all goods and services
produced within a region, over a period of one year, plus taxes and minus subsidies.
GDP-R can be measured using either current or constant prices, where the current prices measures
the economy in actual Rand, and constant prices measures the economy by removing the effect of
inflation, and therefore captures the real growth in volumes, as if prices were fixed in a given base
year.
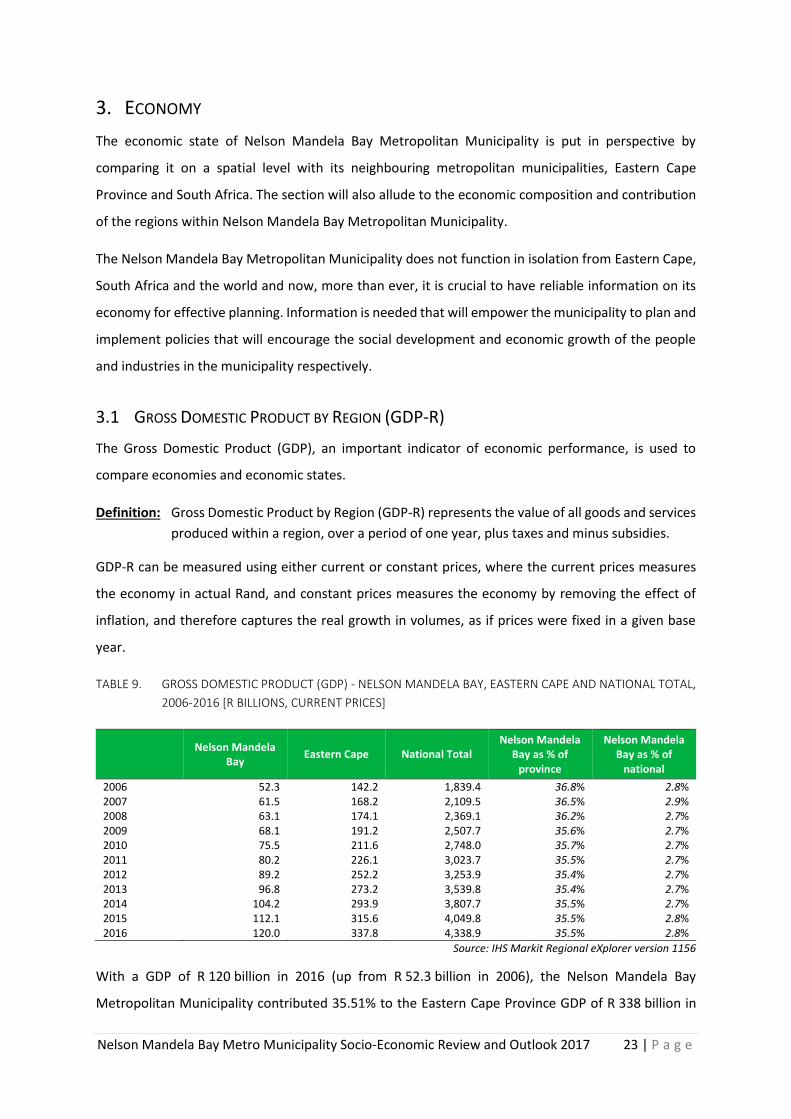
TABLE 9. GROSS DOMESTIC PRODUCT (GDP) - NELSON MANDELA BAY, EASTERN CAPE AND NATIONAL TOTAL,
2006-2016 [R BILLIONS, CURRENT PRICES]
Nelson Mandela
Bay Eastern Cape National Total
Nelson Mandela Bay as % of
province
Nelson Mandela Bay as % of
national
2006 52.3 142.2 1,839.4 36.8% 2.8% 2007 61.5 168.2 2,109.5 36.5% 2.9% 2008 63.1 174.1 2,369.1 36.2% 2.7% 2009 68.1 191.2 2,507.7 35.6% 2.7% 2010 75.5 211.6 2,748.0 35.7% 2.7% 2011 80.2 226.1 3,023.7 35.5% 2.7% 2012 89.2 252.2 3,253.9 35.4% 2.7% 2013 96.8 273.2 3,539.8 35.4% 2.7% 2014 104.2 293.9 3,807.7 35.5% 2.7% 2015 112.1 315.6 4,049.8 35.5% 2.8% 2016 120.0 337.8 4,338.9 35.5% 2.8%
Source: IHS Markit Regional eXplorer version 1156
With a GDP of R 120 billion in 2016 (up from R 52.3 billion in 2006), the Nelson Mandela Bay
Metropolitan Municipality contributed 35.51% to the Eastern Cape Province GDP of R 338 billion in
Nelson Mandela Bay Metro Municipality Socio-Economic Review and Outlook 2017 24 | P a g e
2016 increasing in the share of the Eastern Cape from 36.80% in 2006. The Nelson Mandela Bay
Metropolitan Municipality contributes 2.76% to the GDP of South Africa which had a total GDP of
R 4.34 trillion in 2016 (as measured in nominal or current prices).It's contribution to the national
economy stayed similar in importance from 2006 when it contributed 2.84% to South Africa, but it is
lower than the peak of 2.91% in 2007.
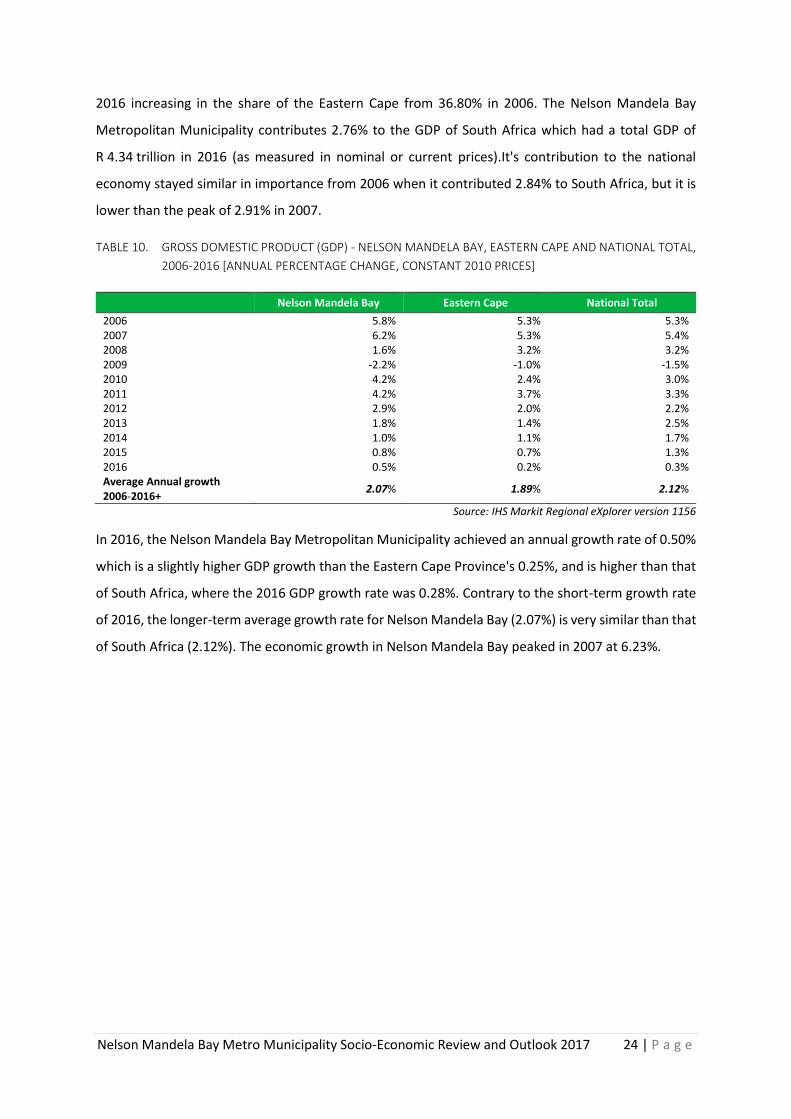
TABLE 10. GROSS DOMESTIC PRODUCT (GDP) - NELSON MANDELA BAY, EASTERN CAPE AND NATIONAL TOTAL,
2006-2016 [ANNUAL PERCENTAGE CHANGE, CONSTANT 2010 PRICES]
Nelson Mandela Bay Eastern Cape National Total
2006 5.8% 5.3% 5.3% 2007 6.2% 5.3% 5.4% 2008 1.6% 3.2% 3.2% 2009 -2.2% -1.0% -1.5% 2010 4.2% 2.4% 3.0% 2011 4.2% 3.7% 3.3% 2012 2.9% 2.0% 2.2% 2013 1.8% 1.4% 2.5% 2014 1.0% 1.1% 1.7% 2015 0.8% 0.7% 1.3% 2016 0.5% 0.2% 0.3% Average Annual growth 2006-2016+
2.07% 1.89% 2.12%
Source: IHS Markit Regional eXplorer version 1156
In 2016, the Nelson Mandela Bay Metropolitan Municipality achieved an annual growth rate of 0.50%
which is a slightly higher GDP growth than the Eastern Cape Province's 0.25%, and is higher than that
of South Africa, where the 2016 GDP growth rate was 0.28%. Contrary to the short-term growth rate
of 2016, the longer-term average growth rate for Nelson Mandela Bay (2.07%) is very similar than that
of South Africa (2.12%). The economic growth in Nelson Mandela Bay peaked in 2007 at 6.23%.
Nelson Mandela Bay Metro Municipality Socio-Economic Review and Outlook 2017 25 | P a g e
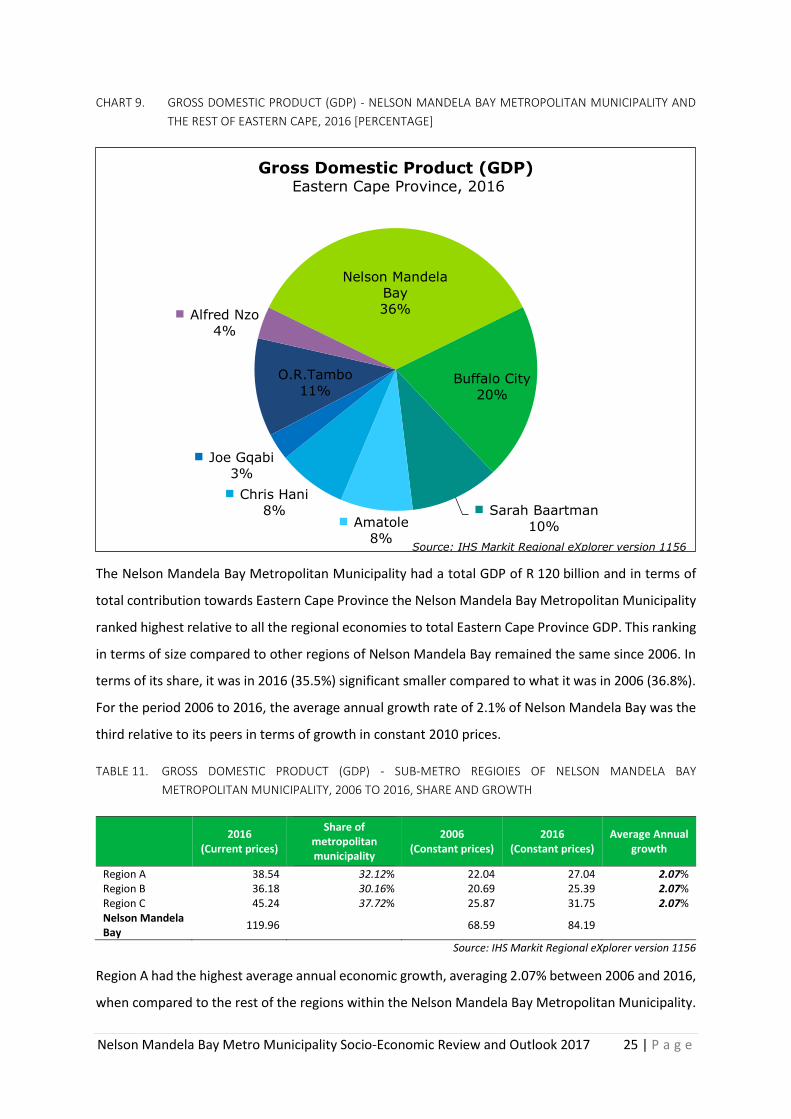
CHART 9. GROSS DOMESTIC PRODUCT (GDP) - NELSON MANDELA BAY METROPOLITAN MUNICIPALITY AND
THE REST OF EASTERN CAPE, 2016 [PERCENTAGE]
The Nelson Mandela Bay Metropolitan Municipality had a total GDP of R 120 billion and in terms of
total contribution towards Eastern Cape Province the Nelson Mandela Bay Metropolitan Municipality
ranked highest relative to all the regional economies to total Eastern Cape Province GDP. This ranking
in terms of size compared to other regions of Nelson Mandela Bay remained the same since 2006. In
terms of its share, it was in 2016 (35.5%) significant smaller compared to what it was in 2006 (36.8%).
For the period 2006 to 2016, the average annual growth rate of 2.1% of Nelson Mandela Bay was the
third relative to its peers in terms of growth in constant 2010 prices.
TABLE 11. GROSS DOMESTIC PRODUCT (GDP) - SUB-METRO REGIOIES OF NELSON MANDELA BAY
METROPOLITAN MUNICIPALITY, 2006 TO 2016, SHARE AND GROWTH
2016
(Current prices)
Share of metropolitan municipality
2006 (Constant prices)
2016 (Constant prices)
Average Annual growth
Region A 38.54 32.12% 22.04 27.04 2.07% Region B 36.18 30.16% 20.69 25.39 2.07% Region C 45.24 37.72% 25.87 31.75 2.07% Nelson Mandela Bay
119.96 68.59 84.19
Source: IHS Markit Regional eXplorer version 1156
Region A had the highest average annual economic growth, averaging 2.07% between 2006 and 2016,
when compared to the rest of the regions within the Nelson Mandela Bay Metropolitan Municipality.
Nelson Mandela
Bay
36%
Buffalo City
20%
Sarah Baartman
10%Amatole
8%
Chris Hani
8%
Joe Gqabi
3%
O.R.Tambo
11%
Alfred Nzo
4%
Gross Domestic Product (GDP) Eastern Cape Province, 2016
Source: IHS Markit Regional eXplorer version 1156
Nelson Mandela Bay Metro Municipality Socio-Economic Review and Outlook 2017 26 | P a g e
The Region B sub-metro region had the second highest average annual growth rate of 2.07%. Region
C sub-metro region had the lowest average annual growth rate of 2.07% between 2006 and 2016.
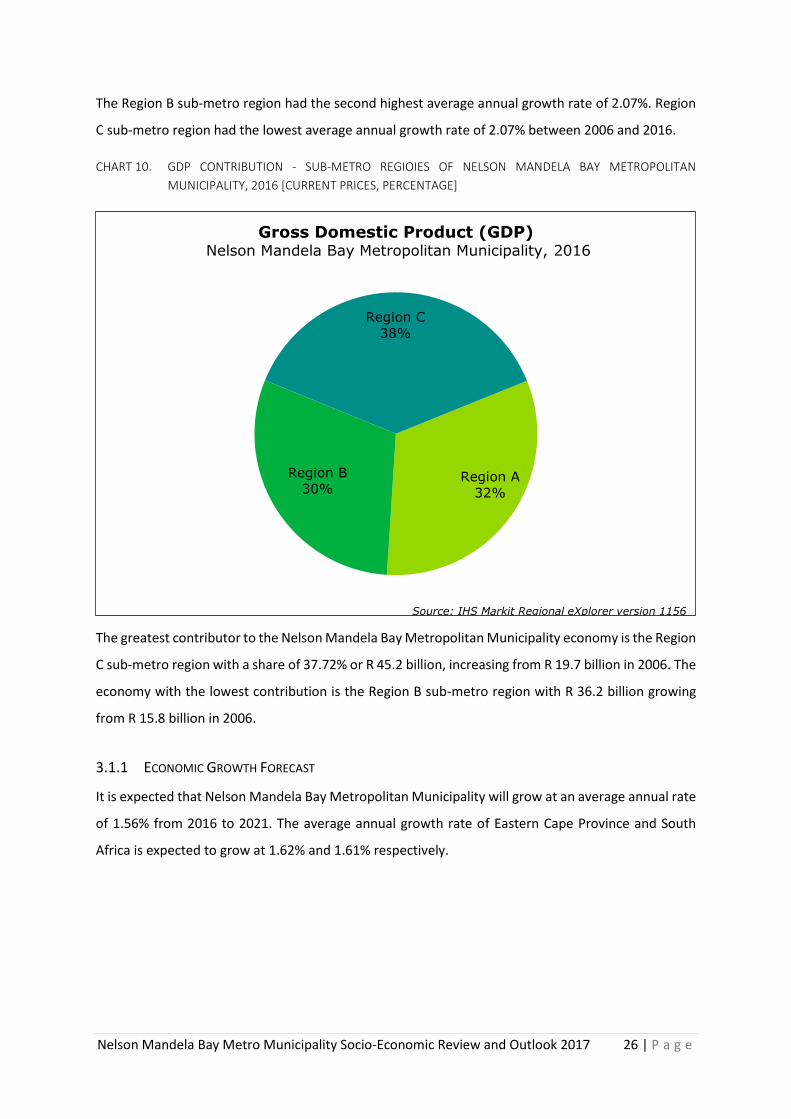
CHART 10. GDP CONTRIBUTION - SUB-METRO REGIOIES OF NELSON MANDELA BAY METROPOLITAN
MUNICIPALITY, 2016 [CURRENT PRICES, PERCENTAGE]
The greatest contributor to the Nelson Mandela Bay Metropolitan Municipality economy is the Region
C sub-metro region with a share of 37.72% or R 45.2 billion, increasing from R 19.7 billion in 2006. The
economy with the lowest contribution is the Region B sub-metro region with R 36.2 billion growing
from R 15.8 billion in 2006.
3.1.1 ECONOMIC GROWTH FORECAST
It is expected that Nelson Mandela Bay Metropolitan Municipality will grow at an average annual rate
of 1.56% from 2016 to 2021. The average annual growth rate of Eastern Cape Province and South
Africa is expected to grow at 1.62% and 1.61% respectively.
Region A
32%
Region B
30%
Region C
38%
Gross Domestic Product (GDP) Nelson Mandela Bay Metropolitan Municipality, 2016
Source: IHS Markit Regional eXplorer version 1156
Nelson Mandela Bay Metro Municipality Socio-Economic Review and Outlook 2017 27 | P a g e
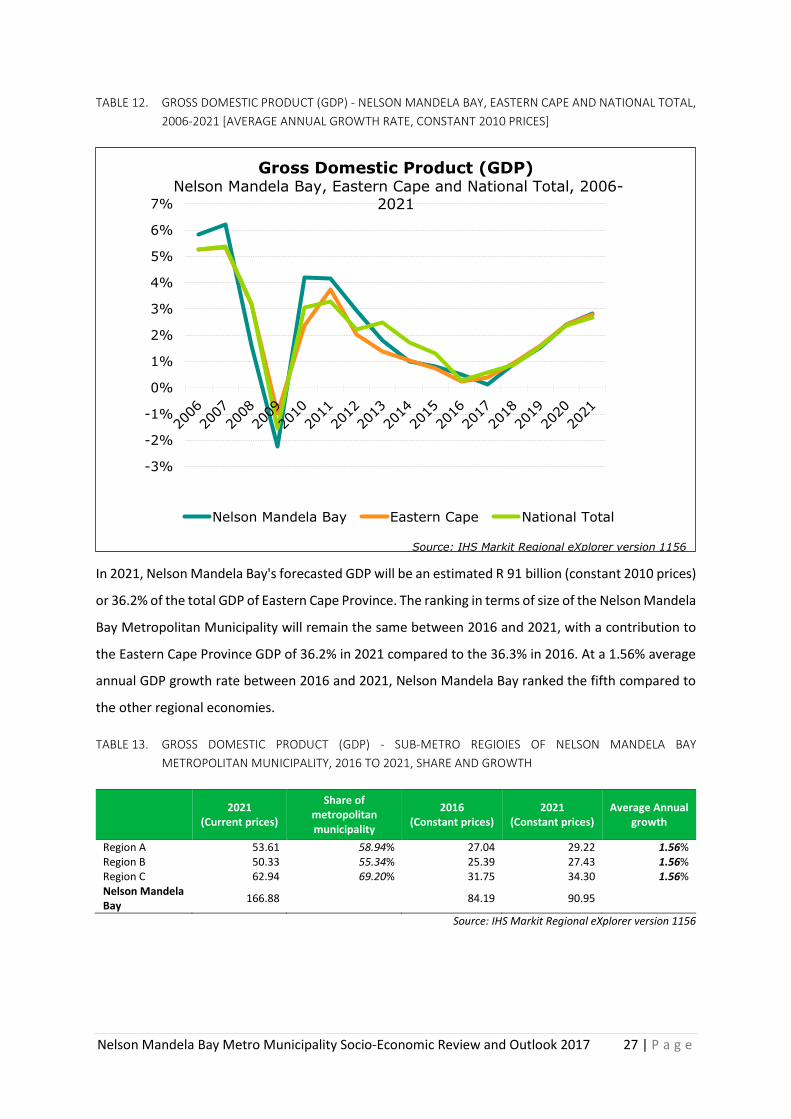
TABLE 12. GROSS DOMESTIC PRODUCT (GDP) - NELSON MANDELA BAY, EASTERN CAPE AND NATIONAL TOTAL,
2006-2021 [AVERAGE ANNUAL GROWTH RATE, CONSTANT 2010 PRICES]
In 2021, Nelson Mandela Bay's forecasted GDP will be an estimated R 91 billion (constant 2010 prices)
or 36.2% of the total GDP of Eastern Cape Province. The ranking in terms of size of the Nelson Mandela
Bay Metropolitan Municipality will remain the same between 2016 and 2021, with a contribution to
the Eastern Cape Province GDP of 36.2% in 2021 compared to the 36.3% in 2016. At a 1.56% average
annual GDP growth rate between 2016 and 2021, Nelson Mandela Bay ranked the fifth compared to
the other regional economies.
TABLE 13. GROSS DOMESTIC PRODUCT (GDP) - SUB-METRO REGIOIES OF NELSON MANDELA BAY
METROPOLITAN MUNICIPALITY, 2016 TO 2021, SHARE AND GROWTH
2021
(Current prices)
Share of metropolitan municipality
2016 (Constant prices)
2021 (Constant prices)
Average Annual growth
Region A 53.61 58.94% 27.04 29.22 1.56% Region B 50.33 55.34% 25.39 27.43 1.56% Region C 62.94 69.20% 31.75 34.30 1.56% Nelson Mandela Bay
166.88 84.19 90.95
Source: IHS Markit Regional eXplorer version 1156
-3%
-2%
-1%
0%
1%
2%
3%
4%
5%
6%
7%
Gross Domestic Product (GDP) Nelson Mandela Bay, Eastern Cape and National Total, 2006-
2021
Nelson Mandela Bay Eastern Cape National Total
Source: IHS Markit Regional eXplorer version 1156
Nelson Mandela Bay Metro Municipality Socio-Economic Review and Outlook 2017 28 | P a g e
3.2 GROSS VALUE ADDED BY REGION (GVA-R)
The Nelson Mandela Bay Metropolitan Municipality's economy is made up of various industries. The
GVA-R variable provides a sector breakdown, where each sector is measured in terms of its value
added produced in the local economy.
Definition: Gross Value Added (GVA) is a measure of output (total production) of a region in terms
of the value that was created within that region. GVA can be broken down into various
production sectors.
The summary table below puts the Gross Value Added (GVA) of all the regions in perspective to that
of the Nelson Mandela Bay Metropolitan Municipality.
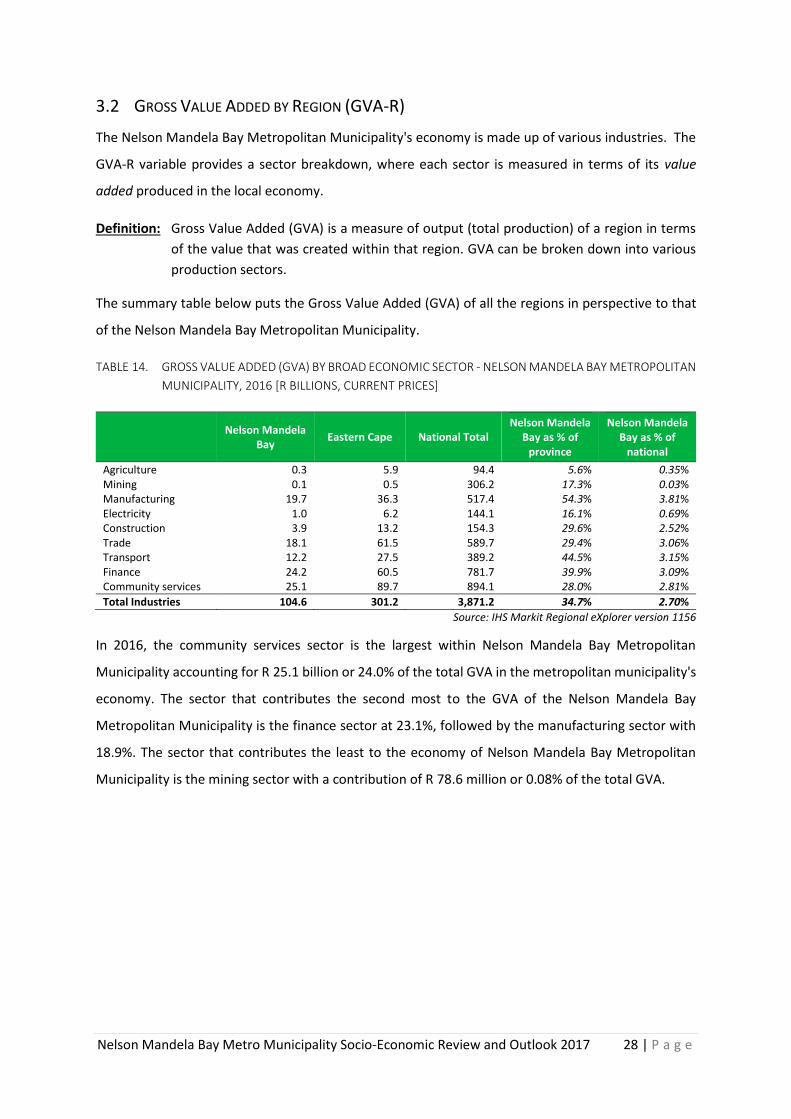
TABLE 14. GROSS VALUE ADDED (GVA) BY BROAD ECONOMIC SECTOR - NELSON MANDELA BAY METROPOLITAN
MUNICIPALITY, 2016 [R BILLIONS, CURRENT PRICES]
Nelson Mandela
Bay Eastern Cape National Total
Nelson Mandela Bay as % of
province
Nelson Mandela Bay as % of
national
Agriculture 0.3 5.9 94.4 5.6% 0.35% Mining 0.1 0.5 306.2 17.3% 0.03% Manufacturing 19.7 36.3 517.4 54.3% 3.81% Electricity 1.0 6.2 144.1 16.1% 0.69% Construction 3.9 13.2 154.3 29.6% 2.52% Trade 18.1 61.5 589.7 29.4% 3.06% Transport 12.2 27.5 389.2 44.5% 3.15% Finance 24.2 60.5 781.7 39.9% 3.09% Community services 25.1 89.7 894.1 28.0% 2.81%
Total Industries 104.6 301.2 3,871.2 34.7% 2.70%
Source: IHS Markit Regional eXplorer version 1156
In 2016, the community services sector is the largest within Nelson Mandela Bay Metropolitan
Municipality accounting for R 25.1 billion or 24.0% of the total GVA in the metropolitan municipality's
economy. The sector that contributes the second most to the GVA of the Nelson Mandela Bay
Metropolitan Municipality is the finance sector at 23.1%, followed by the manufacturing sector with
18.9%. The sector that contributes the least to the economy of Nelson Mandela Bay Metropolitan
Municipality is the mining sector with a contribution of R 78.6 million or 0.08% of the total GVA.
Nelson Mandela Bay Metro Municipality Socio-Economic Review and Outlook 2017 29 | P a g e
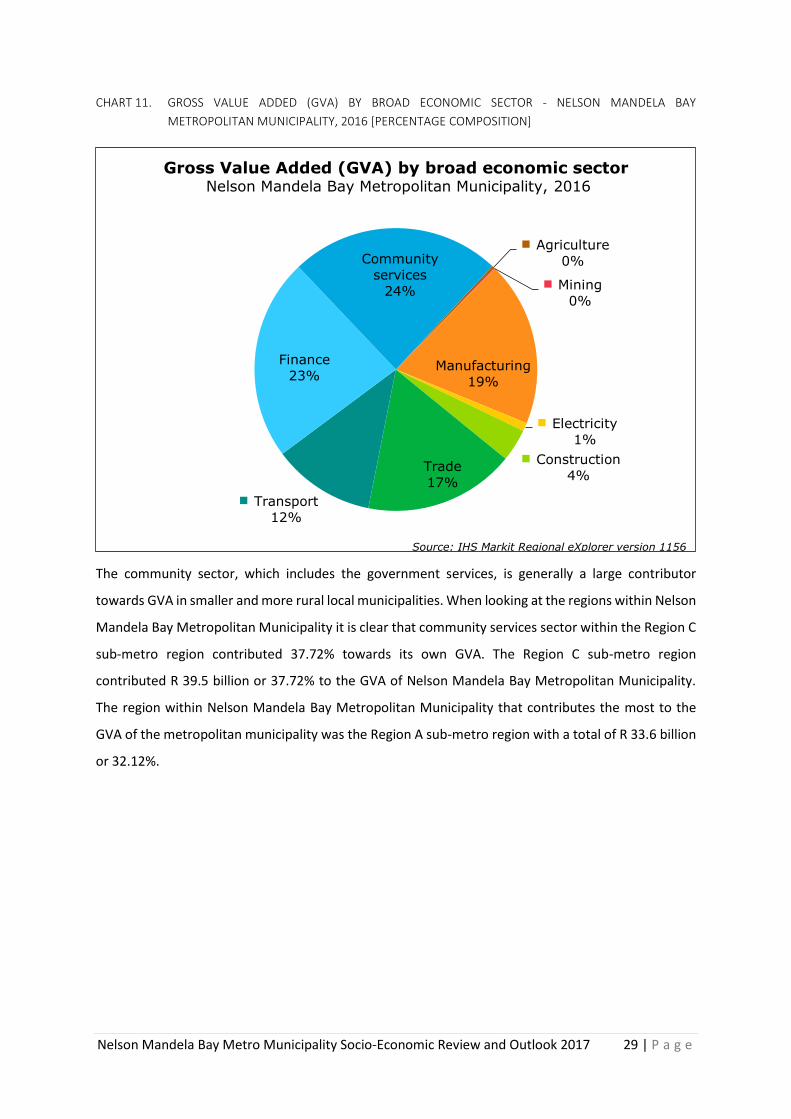
CHART 11. GROSS VALUE ADDED (GVA) BY BROAD ECONOMIC SECTOR - NELSON MANDELA BAY
METROPOLITAN MUNICIPALITY, 2016 [PERCENTAGE COMPOSITION]
The community sector, which includes the government services, is generally a large contributor
towards GVA in smaller and more rural local municipalities. When looking at the regions within Nelson
Mandela Bay Metropolitan Municipality it is clear that community services sector within the Region C
sub-metro region contributed 37.72% towards its own GVA. The Region C sub-metro region
contributed R 39.5 billion or 37.72% to the GVA of Nelson Mandela Bay Metropolitan Municipality.
The region within Nelson Mandela Bay Metropolitan Municipality that contributes the most to the
GVA of the metropolitan municipality was the Region A sub-metro region with a total of R 33.6 billion
or 32.12%.
Agriculture
0%
Mining
0%
Manufacturing
19%
Electricity
1%
Construction
4%Trade
17%
Transport
12%
Finance
23%
Community
services
24%
Gross Value Added (GVA) by broad economic sector Nelson Mandela Bay Metropolitan Municipality, 2016
Source: IHS Markit Regional eXplorer version 1156
Nelson Mandela Bay Metro Municipality Socio-Economic Review and Outlook 2017 30 | P a g e
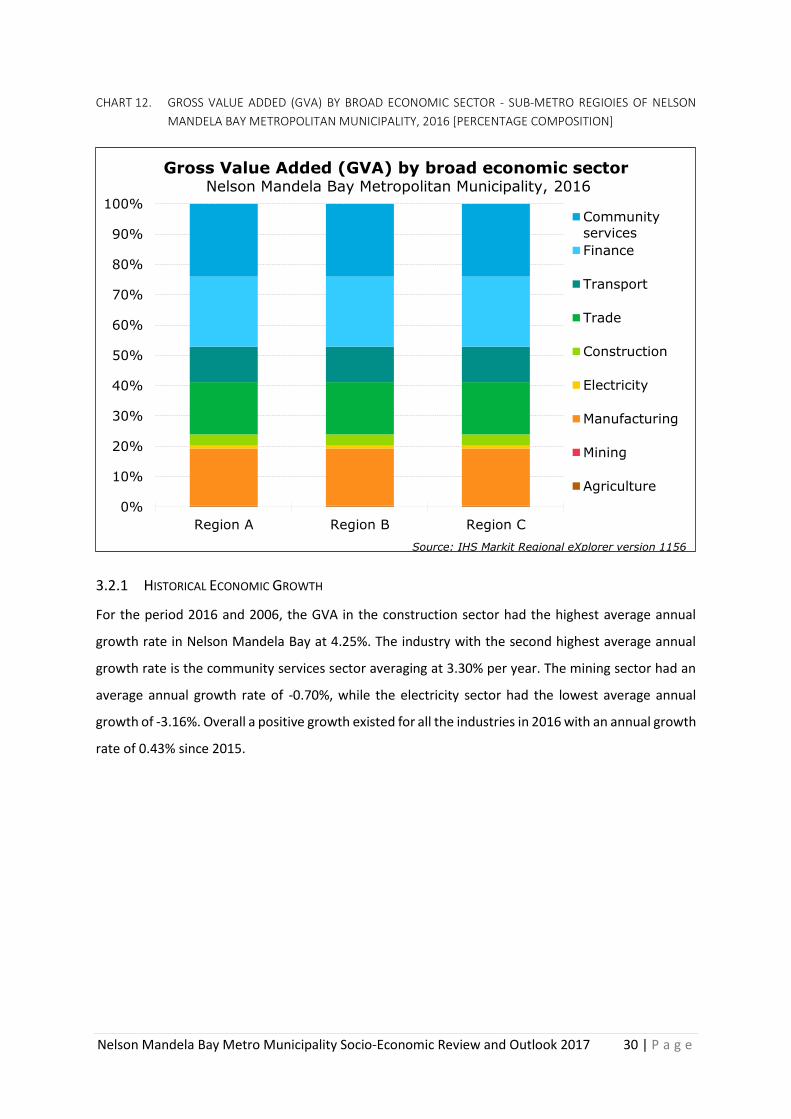
CHART 12. GROSS VALUE ADDED (GVA) BY BROAD ECONOMIC SECTOR - SUB-METRO REGIOIES OF NELSON
MANDELA BAY METROPOLITAN MUNICIPALITY, 2016 [PERCENTAGE COMPOSITION]
3.2.1 HISTORICAL ECONOMIC GROWTH
For the period 2016 and 2006, the GVA in the construction sector had the highest average annual
growth rate in Nelson Mandela Bay at 4.25%. The industry with the second highest average annual
growth rate is the community services sector averaging at 3.30% per year. The mining sector had an
average annual growth rate of -0.70%, while the electricity sector had the lowest average annual
growth of -3.16%. Overall a positive growth existed for all the industries in 2016 with an annual growth
rate of 0.43% since 2015.
0%
10%
20%
30%
40%
50%
60%
70%
80%
90%
100%
Region A Region B Region C
Gross Value Added (GVA) by broad economic sector Nelson Mandela Bay Metropolitan Municipality, 2016
Community
services
Finance
Transport
Trade
Construction
Electricity
Manufacturing
Mining
Agriculture
Source: IHS Markit Regional eXplorer version 1156
Nelson Mandela Bay Metro Municipality Socio-Economic Review and Outlook 2017 31 | P a g e
TABLE 15. GROSS VALUE ADDED (GVA) BY BROAD ECONOMIC SECTOR - NELSON MANDELA BAY METROPOLITAN
MUNICIPALITY, 2006, 2011 AND 2016 [R BILLIONS, 2010 CONSTANT PRICES]
2006 2011 2016 Average Annual
growth
Agriculture 0.13 0.17 0.17 2.66% Mining 0.10 0.10 0.10 -0.70% Manufacturing 14.42 15.90 16.46 1.33% Electricity 0.52 0.55 0.37 -3.16% Construction 1.62 2.22 2.45 4.25% Trade 10.48 11.50 12.00 1.36% Transport 6.52 7.67 8.28 2.42% Finance 14.14 15.76 17.11 1.93% Community services 12.87 15.76 17.82 3.30%
Total Industries 60.80 69.64 74.76 2.09%
Source: IHS Markit Regional eXplorer version 1156
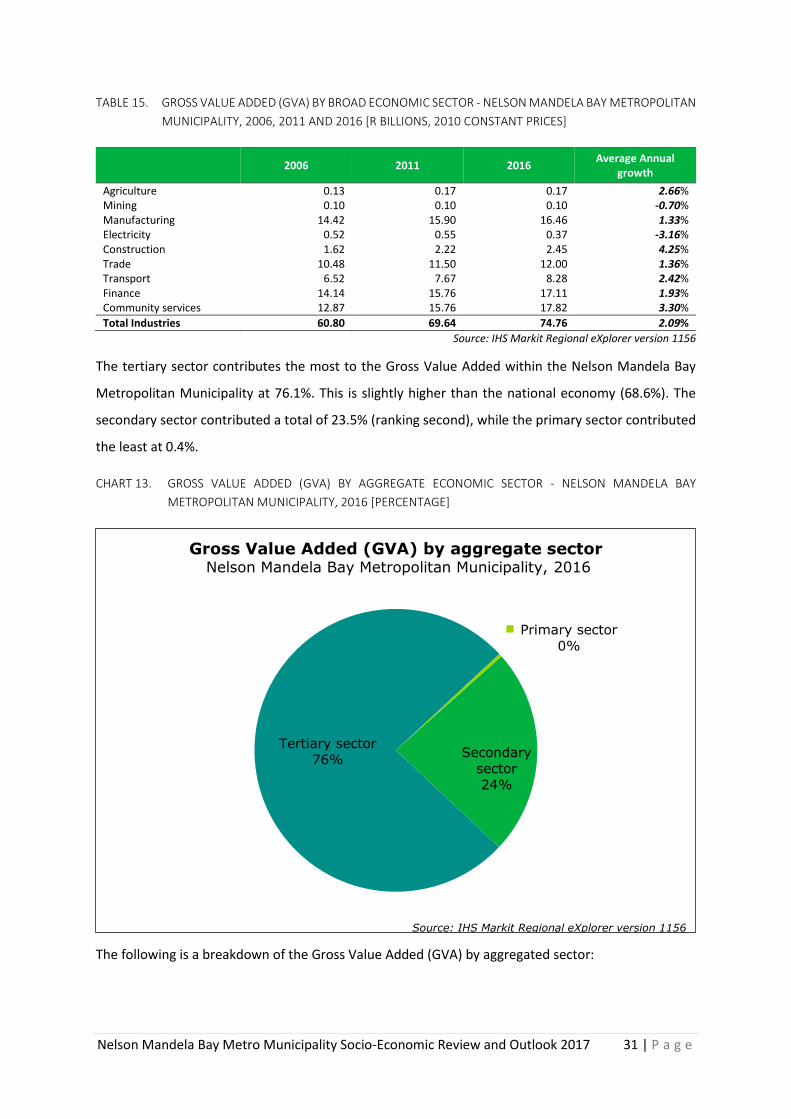
The tertiary sector contributes the most to the Gross Value Added within the Nelson Mandela Bay
Metropolitan Municipality at 76.1%. This is slightly higher than the national economy (68.6%). The
secondary sector contributed a total of 23.5% (ranking second), while the primary sector contributed
the least at 0.4%.
CHART 13. GROSS VALUE ADDED (GVA) BY AGGREGATE ECONOMIC SECTOR - NELSON MANDELA BAY
METROPOLITAN MUNICIPALITY, 2016 [PERCENTAGE]
The following is a breakdown of the Gross Value Added (GVA) by aggregated sector:
Primary sector
0%
Secondary
sector
24%
Tertiary sector
76%
Gross Value Added (GVA) by aggregate sector Nelson Mandela Bay Metropolitan Municipality, 2016
Source: IHS Markit Regional eXplorer version 1156
Nelson Mandela Bay Metro Municipality Socio-Economic Review and Outlook 2017 32 | P a g e
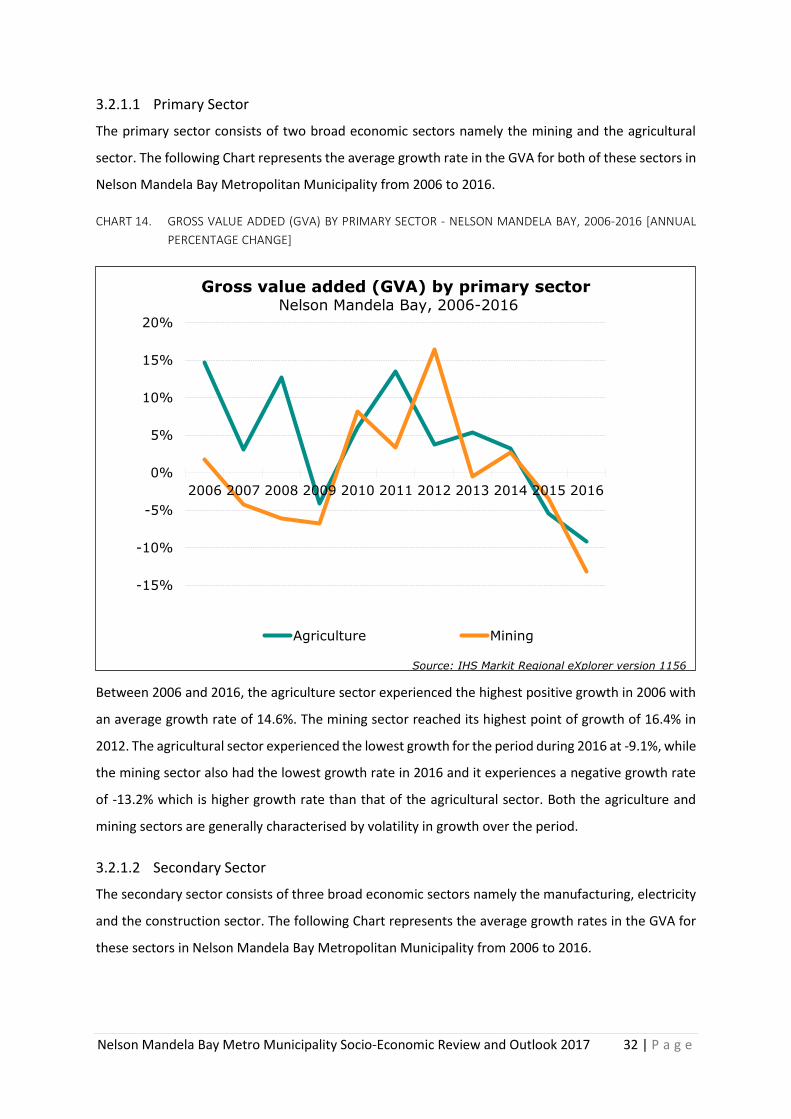
3.2.1.1 Primary Sector
The primary sector consists of two broad economic sectors namely the mining and the agricultural
sector. The following Chart represents the average growth rate in the GVA for both of these sectors in
Nelson Mandela Bay Metropolitan Municipality from 2006 to 2016.
CHART 14. GROSS VALUE ADDED (GVA) BY PRIMARY SECTOR - NELSON MANDELA BAY, 2006-2016 [ANNUAL
PERCENTAGE CHANGE]
Between 2006 and 2016, the agriculture sector experienced the highest positive growth in 2006 with
an average growth rate of 14.6%. The mining sector reached its highest point of growth of 16.4% in
2012. The agricultural sector experienced the lowest growth for the period during 2016 at -9.1%, while
the mining sector also had the lowest growth rate in 2016 and it experiences a negative growth rate
of -13.2% which is higher growth rate than that of the agricultural sector. Both the agriculture and
mining sectors are generally characterised by volatility in growth over the period.
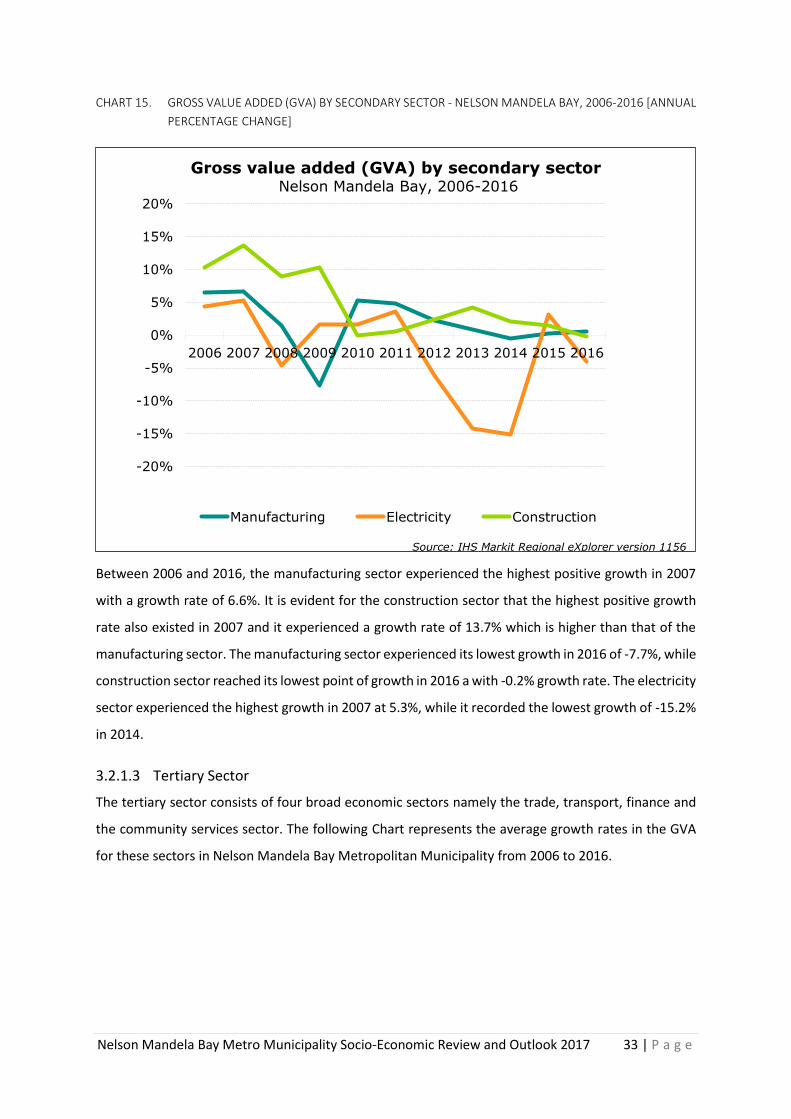
3.2.1.2 Secondary Sector
The secondary sector consists of three broad economic sectors namely the manufacturing, electricity
and the construction sector. The following Chart represents the average growth rates in the GVA for
these sectors in Nelson Mandela Bay Metropolitan Municipality from 2006 to 2016.
-15%
-10%
-5%
0%
5%
10%
15%
20%
2006 2007 2008 2009 2010 2011 2012 2013 2014 2015 2016
Gross value added (GVA) by primary sector Nelson Mandela Bay, 2006-2016
Agriculture Mining
Source: IHS Markit Regional eXplorer version 1156
Nelson Mandela Bay Metro Municipality Socio-Economic Review and Outlook 2017 33 | P a g e
CHART 15. GROSS VALUE ADDED (GVA) BY SECONDARY SECTOR - NELSON MANDELA BAY, 2006-2016 [ANNUAL
PERCENTAGE CHANGE]
Between 2006 and 2016, the manufacturing sector experienced the highest positive growth in 2007
with a growth rate of 6.6%. It is evident for the construction sector that the highest positive growth
rate also existed in 2007 and it experienced a growth rate of 13.7% which is higher than that of the
manufacturing sector. The manufacturing sector experienced its lowest growth in 2016 of -7.7%, while
construction sector reached its lowest point of growth in 2016 a with -0.2% growth rate. The electricity
sector experienced the highest growth in 2007 at 5.3%, while it recorded the lowest growth of -15.2%
in 2014.
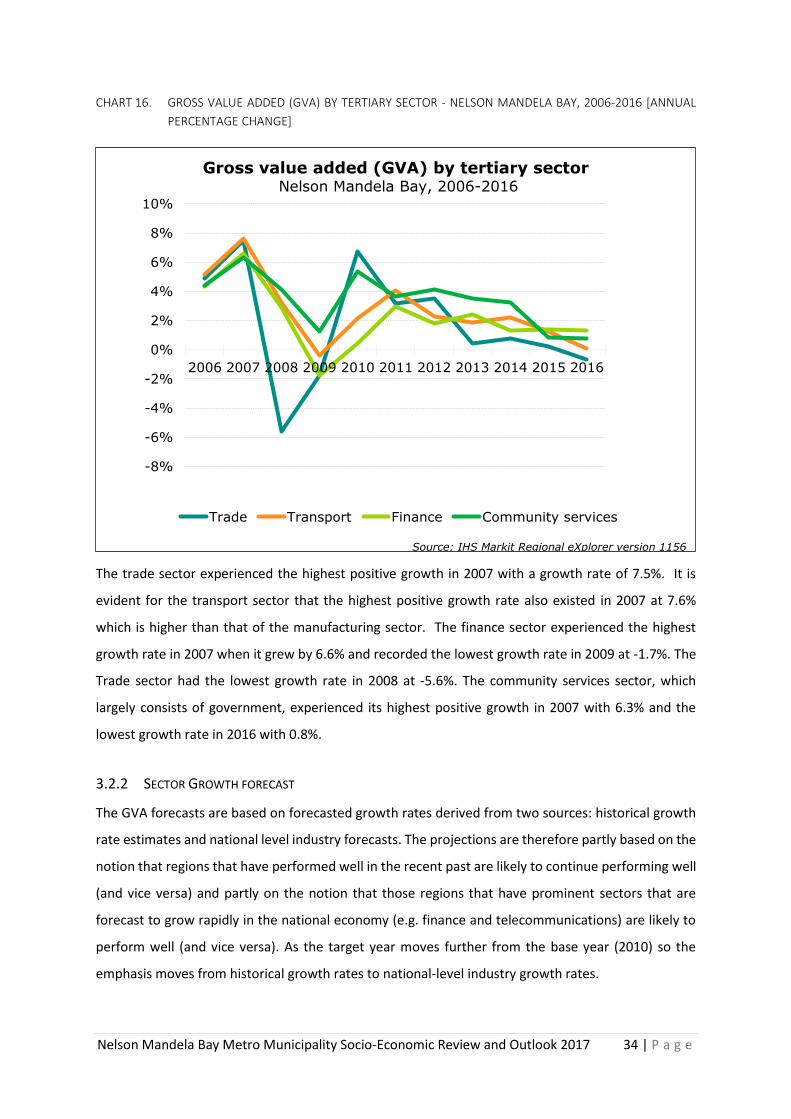
3.2.1.3 Tertiary Sector
The tertiary sector consists of four broad economic sectors namely the trade, transport, finance and
the community services sector. The following Chart represents the average growth rates in the GVA
for these sectors in Nelson Mandela Bay Metropolitan Municipality from 2006 to 2016.
-20%
-15%
-10%
-5%
0%
5%
10%
15%
20%
2006 2007 2008 2009 2010 2011 2012 2013 2014 2015 2016
Gross value added (GVA) by secondary sector Nelson Mandela Bay, 2006-2016
Manufacturing Electricity Construction
Source: IHS Markit Regional eXplorer version 1156
Nelson Mandela Bay Metro Municipality Socio-Economic Review and Outlook 2017 34 | P a g e
CHART 16. GROSS VALUE ADDED (GVA) BY TERTIARY SECTOR - NELSON MANDELA BAY, 2006-2016 [ANNUAL
PERCENTAGE CHANGE]
The trade sector experienced the highest positive growth in 2007 with a growth rate of 7.5%. It is
evident for the transport sector that the highest positive growth rate also existed in 2007 at 7.6%
which is higher than that of the manufacturing sector. The finance sector experienced the highest
growth rate in 2007 when it grew by 6.6% and recorded the lowest growth rate in 2009 at -1.7%. The
Trade sector had the lowest growth rate in 2008 at -5.6%. The community services sector, which
largely consists of government, experienced its highest positive growth in 2007 with 6.3% and the
lowest growth rate in 2016 with 0.8%.
3.2.2 SECTOR GROWTH FORECAST
The GVA forecasts are based on forecasted growth rates derived from two sources: historical growth
rate estimates and national level industry forecasts. The projections are therefore partly based on the
notion that regions that have performed well in the recent past are likely to continue performing well
(and vice versa) and partly on the notion that those regions that have prominent sectors that are
forecast to grow rapidly in the national economy (e.g. finance and telecommunications) are likely to
perform well (and vice versa). As the target year moves further from the base year (2010) so the
emphasis moves from historical growth rates to national-level industry growth rates.
-8%
-6%
-4%
-2%
0%
2%
4%
6%
8%
10%
2006 2007 2008 2009 2010 2011 2012 2013 2014 2015 2016
Gross value added (GVA) by tertiary sector Nelson Mandela Bay, 2006-2016
Trade Transport Finance Community services
Source: IHS Markit Regional eXplorer version 1156
Nelson Mandela Bay Metro Municipality Socio-Economic Review and Outlook 2017 35 | P a g e
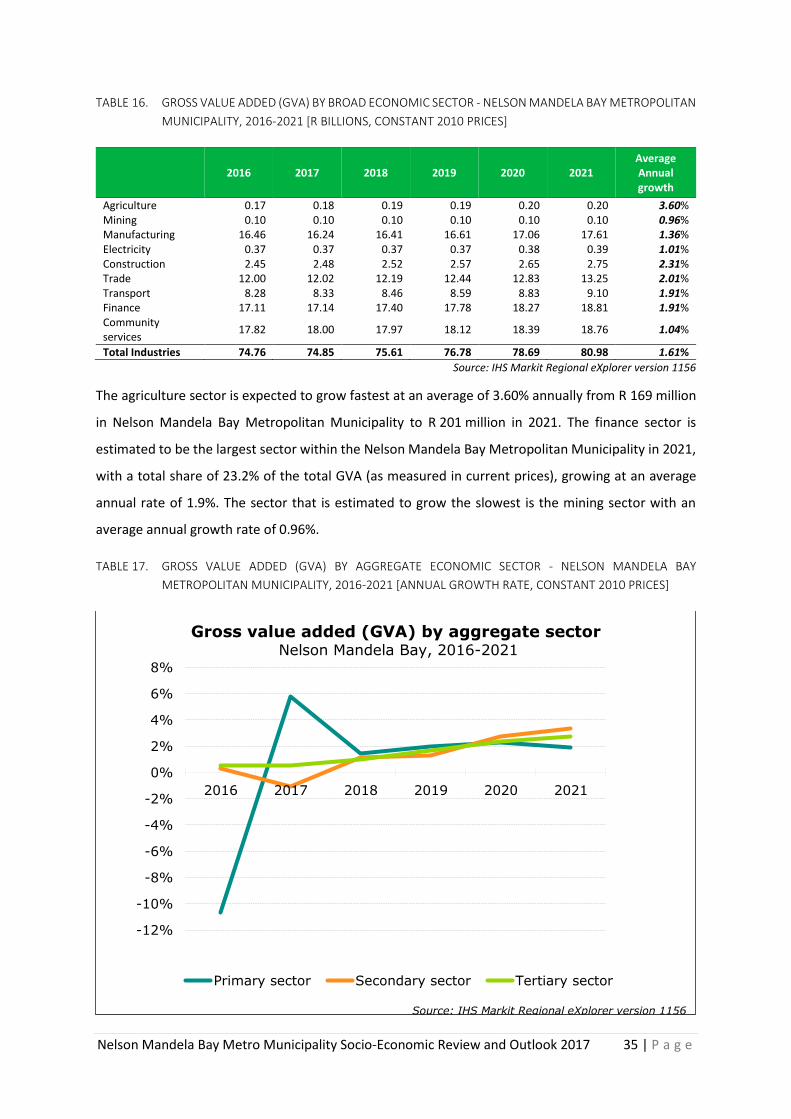
TABLE 16. GROSS VALUE ADDED (GVA) BY BROAD ECONOMIC SECTOR - NELSON MANDELA BAY METROPOLITAN
MUNICIPALITY, 2016-2021 [R BILLIONS, CONSTANT 2010 PRICES]
2016 2017 2018 2019 2020 2021 Average Annual growth
Agriculture 0.17 0.18 0.19 0.19 0.20 0.20 3.60% Mining 0.10 0.10 0.10 0.10 0.10 0.10 0.96% Manufacturing 16.46 16.24 16.41 16.61 17.06 17.61 1.36% Electricity 0.37 0.37 0.37 0.37 0.38 0.39 1.01% Construction 2.45 2.48 2.52 2.57 2.65 2.75 2.31% Trade 12.00 12.02 12.19 12.44 12.83 13.25 2.01% Transport 8.28 8.33 8.46 8.59 8.83 9.10 1.91% Finance 17.11 17.14 17.40 17.78 18.27 18.81 1.91% Community services
17.82 18.00 17.97 18.12 18.39 18.76 1.04%
Total Industries 74.76 74.85 75.61 76.78 78.69 80.98 1.61%
Source: IHS Markit Regional eXplorer version 1156
The agriculture sector is expected to grow fastest at an average of 3.60% annually from R 169 million
in Nelson Mandela Bay Metropolitan Municipality to R 201 million in 2021. The finance sector is
estimated to be the largest sector within the Nelson Mandela Bay Metropolitan Municipality in 2021,
with a total share of 23.2% of the total GVA (as measured in current prices), growing at an average
annual rate of 1.9%. The sector that is estimated to grow the slowest is the mining sector with an
average annual growth rate of 0.96%.
TABLE 17. GROSS VALUE ADDED (GVA) BY AGGREGATE ECONOMIC SECTOR - NELSON MANDELA BAY
METROPOLITAN MUNICIPALITY, 2016-2021 [ANNUAL GROWTH RATE, CONSTANT 2010 PRICES]
-12%
-10%
-8%
-6%
-4%
-2%
0%
2%
4%
6%
8%
2016 2017 2018 2019 2020 2021
Gross value added (GVA) by aggregate sector Nelson Mandela Bay, 2016-2021
Primary sector Secondary sector Tertiary sector
Source: IHS Markit Regional eXplorer version 1156
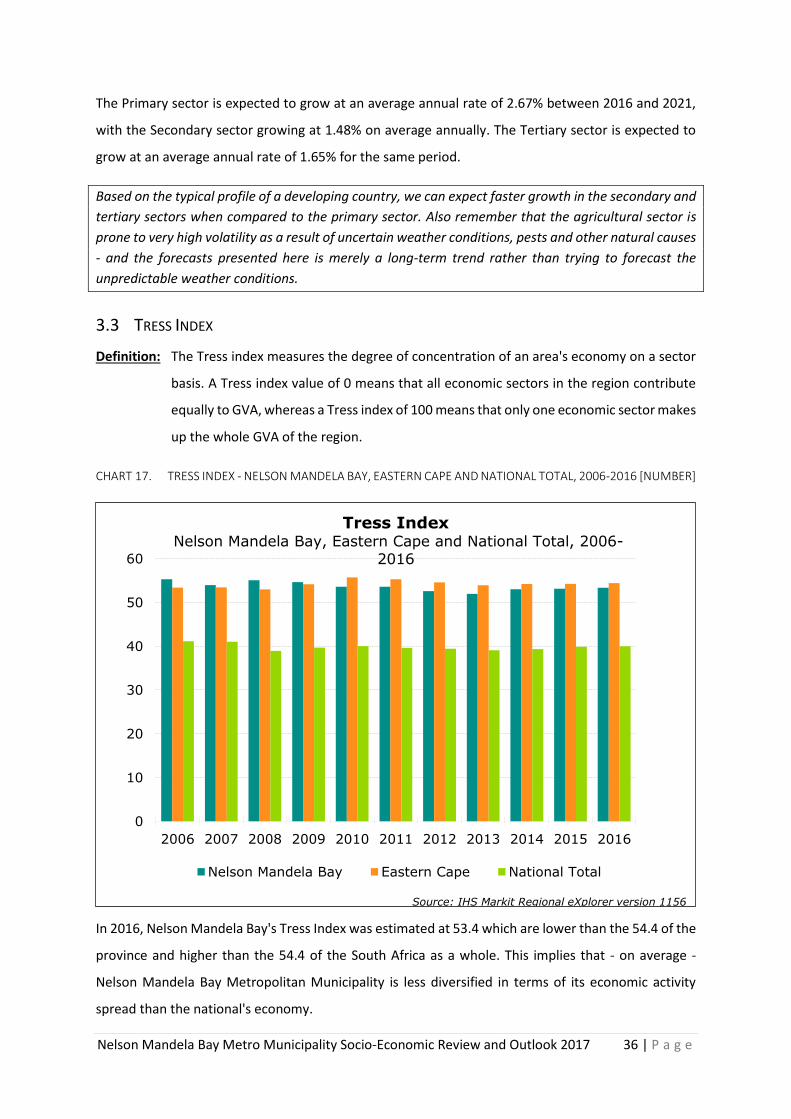
Nelson Mandela Bay Metro Municipality Socio-Economic Review and Outlook 2017 36 | P a g e
The Primary sector is expected to grow at an average annual rate of 2.67% between 2016 and 2021,
with the Secondary sector growing at 1.48% on average annually. The Tertiary sector is expected to
grow at an average annual rate of 1.65% for the same period.
Based on the typical profile of a developing country, we can expect faster growth in the secondary and
tertiary sectors when compared to the primary sector. Also remember that the agricultural sector is
prone to very high volatility as a result of uncertain weather conditions, pests and other natural causes
- and the forecasts presented here is merely a long-term trend rather than trying to forecast the
unpredictable weather conditions.
3.3 TRESS INDEX
Definition: The Tress index measures the degree of concentration of an area's economy on a sector
basis. A Tress index value of 0 means that all economic sectors in the region contribute
equally to GVA, whereas a Tress index of 100 means that only one economic sector makes
up the whole GVA of the region.
CHART 17. TRESS INDEX - NELSON MANDELA BAY, EASTERN CAPE AND NATIONAL TOTAL, 2006-2016 [NUMBER]
In 2016, Nelson Mandela Bay's Tress Index was estimated at 53.4 which are lower than the 54.4 of the
province and higher than the 54.4 of the South Africa as a whole. This implies that - on average -
Nelson Mandela Bay Metropolitan Municipality is less diversified in terms of its economic activity
spread than the national's economy.
0
10
20
30
40
50
60
2006 2007 2008 2009 2010 2011 2012 2013 2014 2015 2016
Tress Index Nelson Mandela Bay, Eastern Cape and National Total, 2006-
2016
Nelson Mandela Bay Eastern Cape National Total
Source: IHS Markit Regional eXplorer version 1156
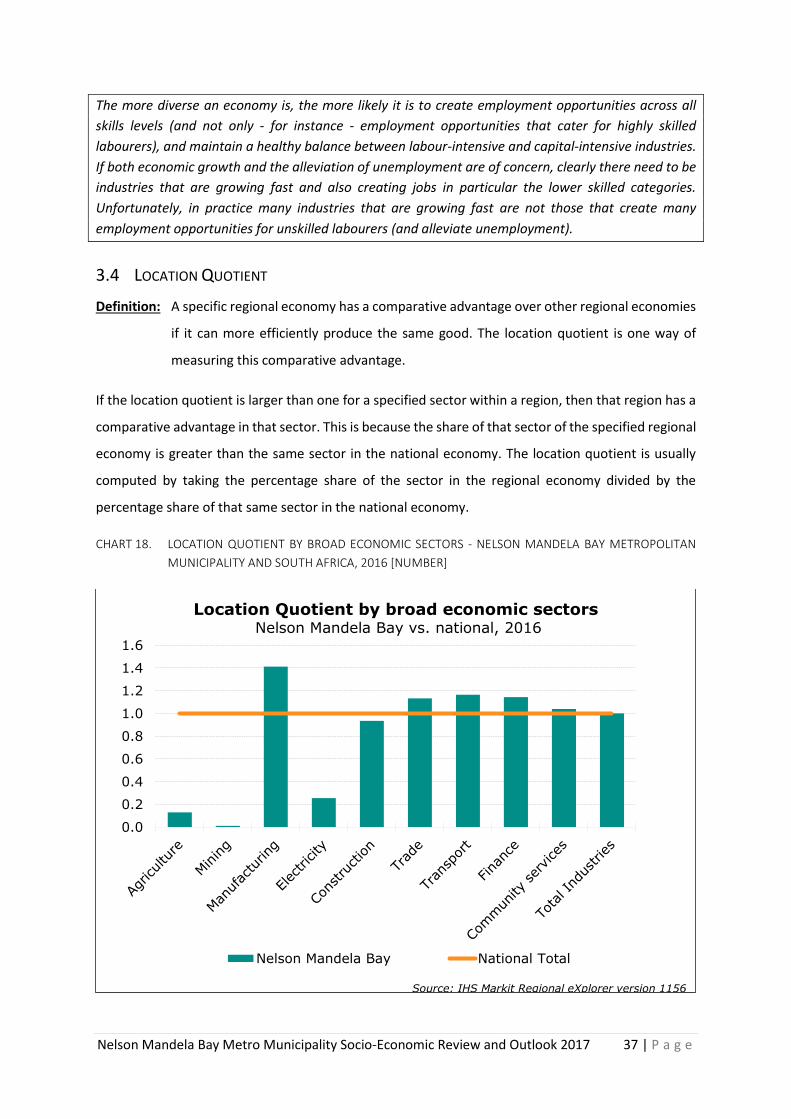
Nelson Mandela Bay Metro Municipality Socio-Economic Review and Outlook 2017 37 | P a g e
The more diverse an economy is, the more likely it is to create employment opportunities across all
skills levels (and not only - for instance - employment opportunities that cater for highly skilled
labourers), and maintain a healthy balance between labour-intensive and capital-intensive industries.
If both economic growth and the alleviation of unemployment are of concern, clearly there need to be
industries that are growing fast and also creating jobs in particular the lower skilled categories.
Unfortunately, in practice many industries that are growing fast are not those that create many
employment opportunities for unskilled labourers (and alleviate unemployment).
3.4 LOCATION QUOTIENT
Definition: A specific regional economy has a comparative advantage over other regional economies
if it can more efficiently produce the same good. The location quotient is one way of
measuring this comparative advantage.
If the location quotient is larger than one for a specified sector within a region, then that region has a
comparative advantage in that sector. This is because the share of that sector of the specified regional
economy is greater than the same sector in the national economy. The location quotient is usually
computed by taking the percentage share of the sector in the regional economy divided by the
percentage share of that same sector in the national economy.
CHART 18. LOCATION QUOTIENT BY BROAD ECONOMIC SECTORS - NELSON MANDELA BAY METROPOLITAN
MUNICIPALITY AND SOUTH AFRICA, 2016 [NUMBER]
0.0
0.2
0.4
0.6
0.8
1.0
1.2
1.4
1.6
Location Quotient by broad economic sectors Nelson Mandela Bay vs. national, 2016
Nelson Mandela Bay National Total
Source: IHS Markit Regional eXplorer version 1156
Nelson Mandela Bay Metro Municipality Socio-Economic Review and Outlook 2017 38 | P a g e
For 2016 Nelson Mandela Bay Metropolitan Municipality has a comparative advantage in the
manufacturing sector. The transport sector has a comparative advantage. The finance also has a
comparative advantage when comparing it to the South Africa economy as a whole, although less
prominent. The Nelson Mandela Bay Metropolitan Municipality has a comparative disadvantage when
it comes to the mining and agriculture sector which has a very large comparative disadvantage. In
general mining is a very concentrated economic sector. Unfortunately the Nelson Mandela Bay
Metropolitan Municipality area currently does not have a lot of mining activity, with an LQ of only
0.0095.
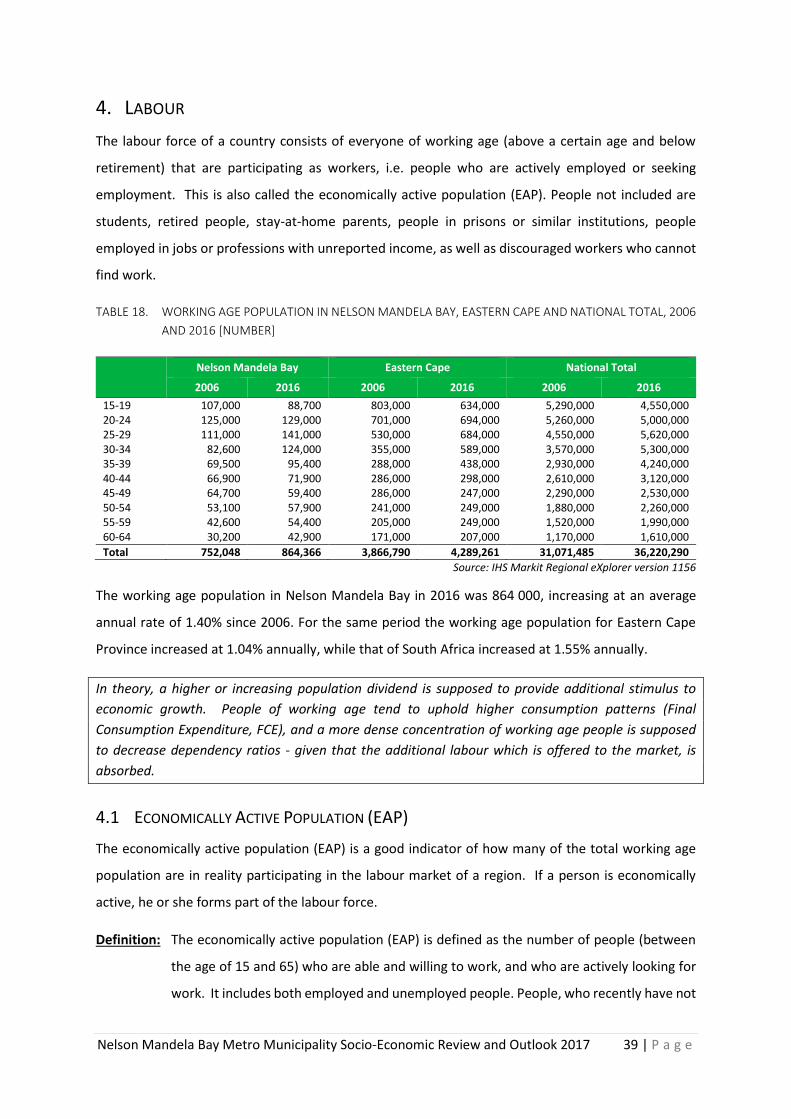
Nelson Mandela Bay Metro Municipality Socio-Economic Review and Outlook 2017 39 | P a g e
4. LABOUR
The labour force of a country consists of everyone of working age (above a certain age and below
retirement) that are participating as workers, i.e. people who are actively employed or seeking
employment. This is also called the economically active population (EAP). People not included are
students, retired people, stay-at-home parents, people in prisons or similar institutions, people
employed in jobs or professions with unreported income, as well as discouraged workers who cannot
find work.
TABLE 18. WORKING AGE POPULATION IN NELSON MANDELA BAY, EASTERN CAPE AND NATIONAL TOTAL, 2006
AND 2016 [NUMBER]
Nelson Mandela Bay Eastern Cape National Total
2006 2016 2006 2016 2006 2016
15-19 107,000 88,700 803,000 634,000 5,290,000 4,550,000 20-24 125,000 129,000 701,000 694,000 5,260,000 5,000,000 25-29 111,000 141,000 530,000 684,000 4,550,000 5,620,000 30-34 82,600 124,000 355,000 589,000 3,570,000 5,300,000 35-39 69,500 95,400 288,000 438,000 2,930,000 4,240,000 40-44 66,900 71,900 286,000 298,000 2,610,000 3,120,000 45-49 64,700 59,400 286,000 247,000 2,290,000 2,530,000 50-54 53,100 57,900 241,000 249,000 1,880,000 2,260,000 55-59 42,600 54,400 205,000 249,000 1,520,000 1,990,000 60-64 30,200 42,900 171,000 207,000 1,170,000 1,610,000
Total 752,048 864,366 3,866,790 4,289,261 31,071,485 36,220,290
Source: IHS Markit Regional eXplorer version 1156
The working age population in Nelson Mandela Bay in 2016 was 864 000, increasing at an average
annual rate of 1.40% since 2006. For the same period the working age population for Eastern Cape
Province increased at 1.04% annually, while that of South Africa increased at 1.55% annually.
In theory, a higher or increasing population dividend is supposed to provide additional stimulus to
economic growth. People of working age tend to uphold higher consumption patterns (Final
Consumption Expenditure, FCE), and a more dense concentration of working age people is supposed
to decrease dependency ratios - given that the additional labour which is offered to the market, is
absorbed.
4.1 ECONOMICALLY ACTIVE POPULATION (EAP)
The economically active population (EAP) is a good indicator of how many of the total working age
population are in reality participating in the labour market of a region. If a person is economically
active, he or she forms part of the labour force.
Definition: The economically active population (EAP) is defined as the number of people (between
the age of 15 and 65) who are able and willing to work, and who are actively looking for
work. It includes both employed and unemployed people. People, who recently have not
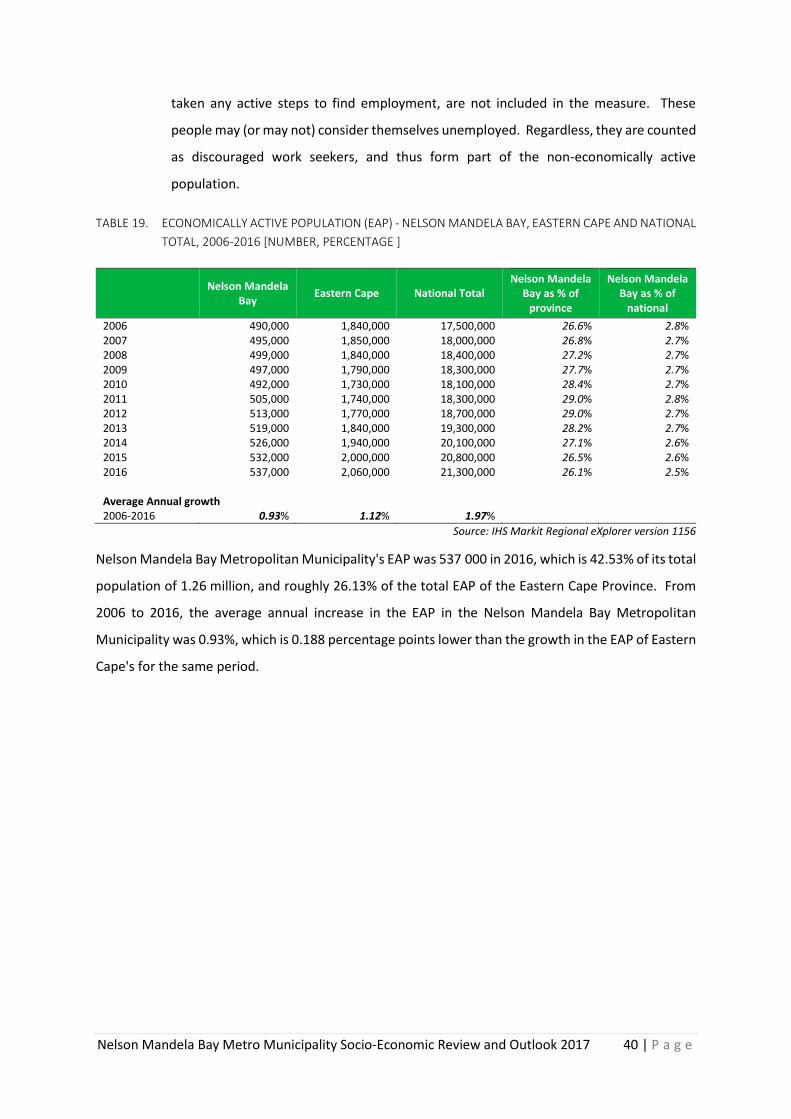
Nelson Mandela Bay Metro Municipality Socio-Economic Review and Outlook 2017 40 | P a g e
taken any active steps to find employment, are not included in the measure. These
people may (or may not) consider themselves unemployed. Regardless, they are counted
as discouraged work seekers, and thus form part of the non-economically active
population.
TABLE 19. ECONOMICALLY ACTIVE POPULATION (EAP) - NELSON MANDELA BAY, EASTERN CAPE AND NATIONAL
TOTAL, 2006-2016 [NUMBER, PERCENTAGE ]
Nelson Mandela
Bay Eastern Cape National Total
Nelson Mandela Bay as % of
province
Nelson Mandela Bay as % of
national
2006 490,000 1,840,000 17,500,000 26.6% 2.8% 2007 495,000 1,850,000 18,000,000 26.8% 2.7% 2008 499,000 1,840,000 18,400,000 27.2% 2.7% 2009 497,000 1,790,000 18,300,000 27.7% 2.7% 2010 492,000 1,730,000 18,100,000 28.4% 2.7% 2011 505,000 1,740,000 18,300,000 29.0% 2.8% 2012 513,000 1,770,000 18,700,000 29.0% 2.7% 2013 519,000 1,840,000 19,300,000 28.2% 2.7% 2014 526,000 1,940,000 20,100,000 27.1% 2.6% 2015 532,000 2,000,000 20,800,000 26.5% 2.6% 2016 537,000 2,060,000 21,300,000 26.1% 2.5% Average Annual growth 2006-2016 0.93% 1.12% 1.97%
Source: IHS Markit Regional eXplorer version 1156
Nelson Mandela Bay Metropolitan Municipality's EAP was 537 000 in 2016, which is 42.53% of its total
population of 1.26 million, and roughly 26.13% of the total EAP of the Eastern Cape Province. From
2006 to 2016, the average annual increase in the EAP in the Nelson Mandela Bay Metropolitan
Municipality was 0.93%, which is 0.188 percentage points lower than the growth in the EAP of Eastern
Cape's for the same period.
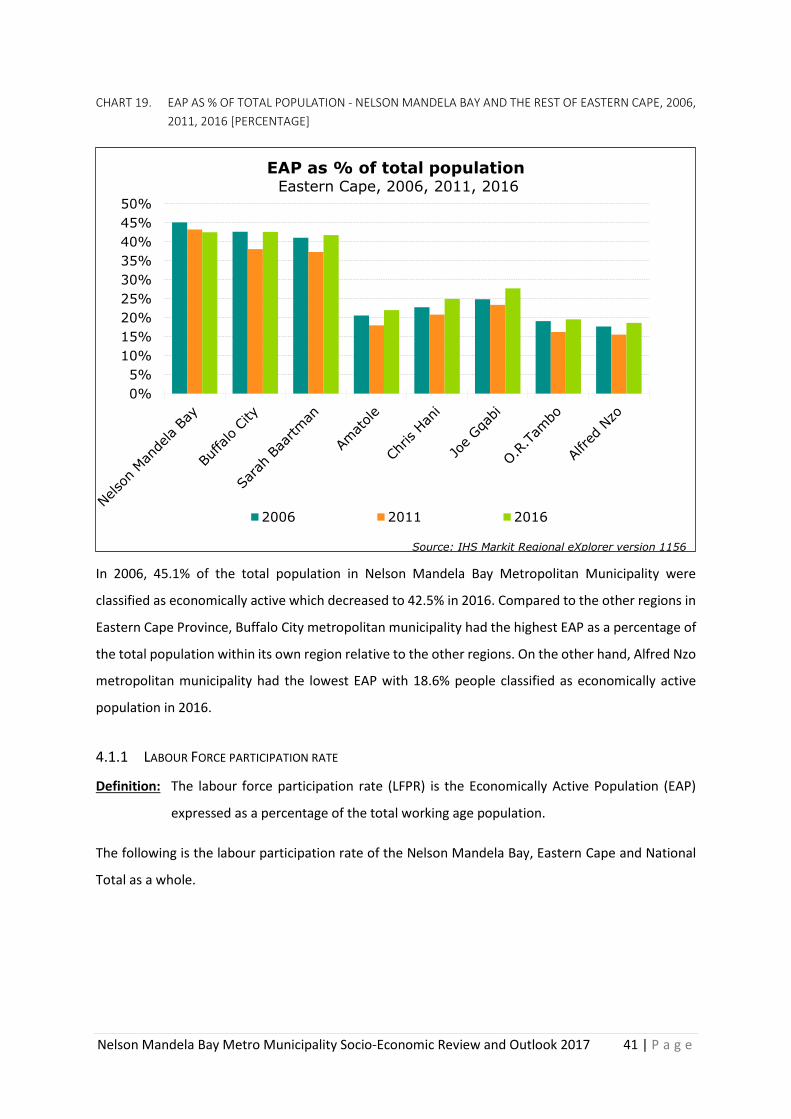
Nelson Mandela Bay Metro Municipality Socio-Economic Review and Outlook 2017 41 | P a g e
CHART 19. EAP AS % OF TOTAL POPULATION - NELSON MANDELA BAY AND THE REST OF EASTERN CAPE, 2006,
2011, 2016 [PERCENTAGE]
In 2006, 45.1% of the total population in Nelson Mandela Bay Metropolitan Municipality were
classified as economically active which decreased to 42.5% in 2016. Compared to the other regions in
Eastern Cape Province, Buffalo City metropolitan municipality had the highest EAP as a percentage of
the total population within its own region relative to the other regions. On the other hand, Alfred Nzo
metropolitan municipality had the lowest EAP with 18.6% people classified as economically active
population in 2016.
4.1.1 LABOUR FORCE PARTICIPATION RATE
Definition: The labour force participation rate (LFPR) is the Economically Active Population (EAP)
expressed as a percentage of the total working age population.
The following is the labour participation rate of the Nelson Mandela Bay, Eastern Cape and National
Total as a whole.
0%
5%
10%
15%
20%
25%
30%
35%
40%
45%
50%
EAP as % of total population Eastern Cape, 2006, 2011, 2016
2006 2011 2016
Source: IHS Markit Regional eXplorer version 1156
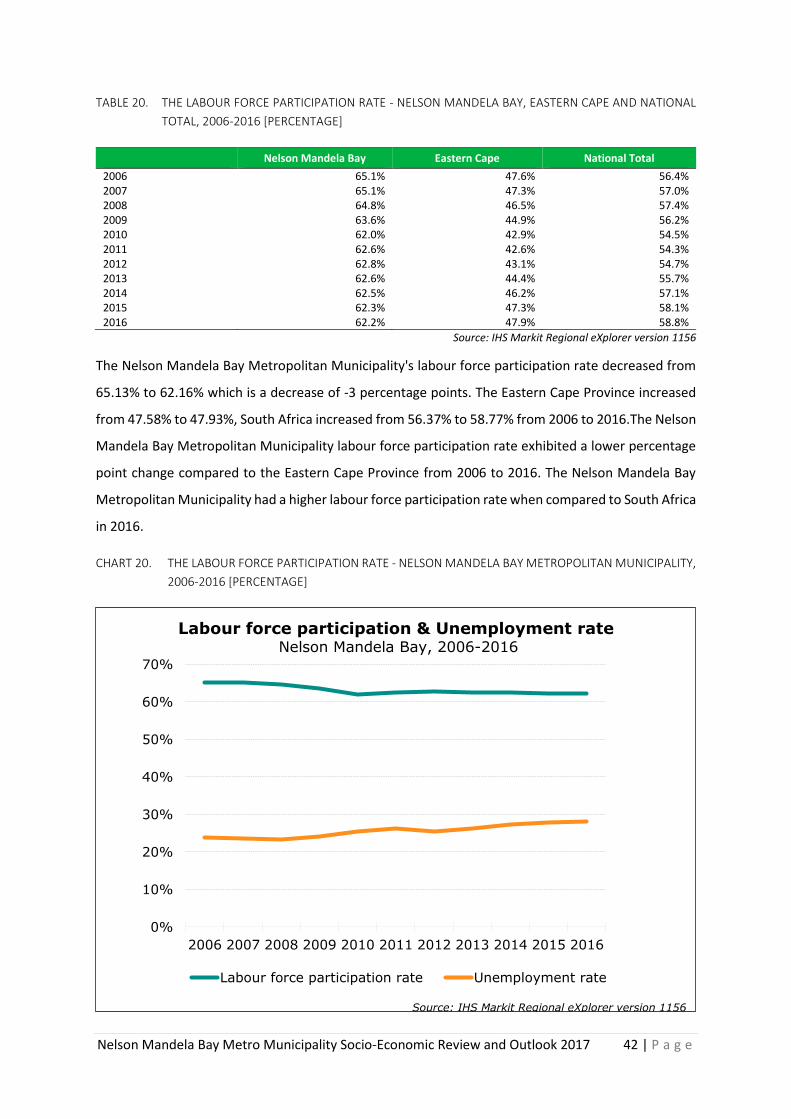
Nelson Mandela Bay Metro Municipality Socio-Economic Review and Outlook 2017 42 | P a g e
TABLE 20. THE LABOUR FORCE PARTICIPATION RATE - NELSON MANDELA BAY, EASTERN CAPE AND NATIONAL
TOTAL, 2006-2016 [PERCENTAGE]
Nelson Mandela Bay Eastern Cape National Total
2006 65.1% 47.6% 56.4% 2007 65.1% 47.3% 57.0% 2008 64.8% 46.5% 57.4% 2009 63.6% 44.9% 56.2% 2010 62.0% 42.9% 54.5% 2011 62.6% 42.6% 54.3% 2012 62.8% 43.1% 54.7% 2013 62.6% 44.4% 55.7% 2014 62.5% 46.2% 57.1% 2015 62.3% 47.3% 58.1% 2016 62.2% 47.9% 58.8%
Source: IHS Markit Regional eXplorer version 1156
The Nelson Mandela Bay Metropolitan Municipality's labour force participation rate decreased from
65.13% to 62.16% which is a decrease of -3 percentage points. The Eastern Cape Province increased
from 47.58% to 47.93%, South Africa increased from 56.37% to 58.77% from 2006 to 2016.The Nelson
Mandela Bay Metropolitan Municipality labour force participation rate exhibited a lower percentage
point change compared to the Eastern Cape Province from 2006 to 2016. The Nelson Mandela Bay
Metropolitan Municipality had a higher labour force participation rate when compared to South Africa
in 2016.
CHART 20. THE LABOUR FORCE PARTICIPATION RATE - NELSON MANDELA BAY METROPOLITAN MUNICIPALITY,
2006-2016 [PERCENTAGE]
0%
10%
20%
30%
40%
50%
60%
70%
2006 2007 2008 2009 2010 2011 2012 2013 2014 2015 2016
Labour force participation & Unemployment rate Nelson Mandela Bay, 2006-2016
Labour force participation rate Unemployment rate
Source: IHS Markit Regional eXplorer version 1156
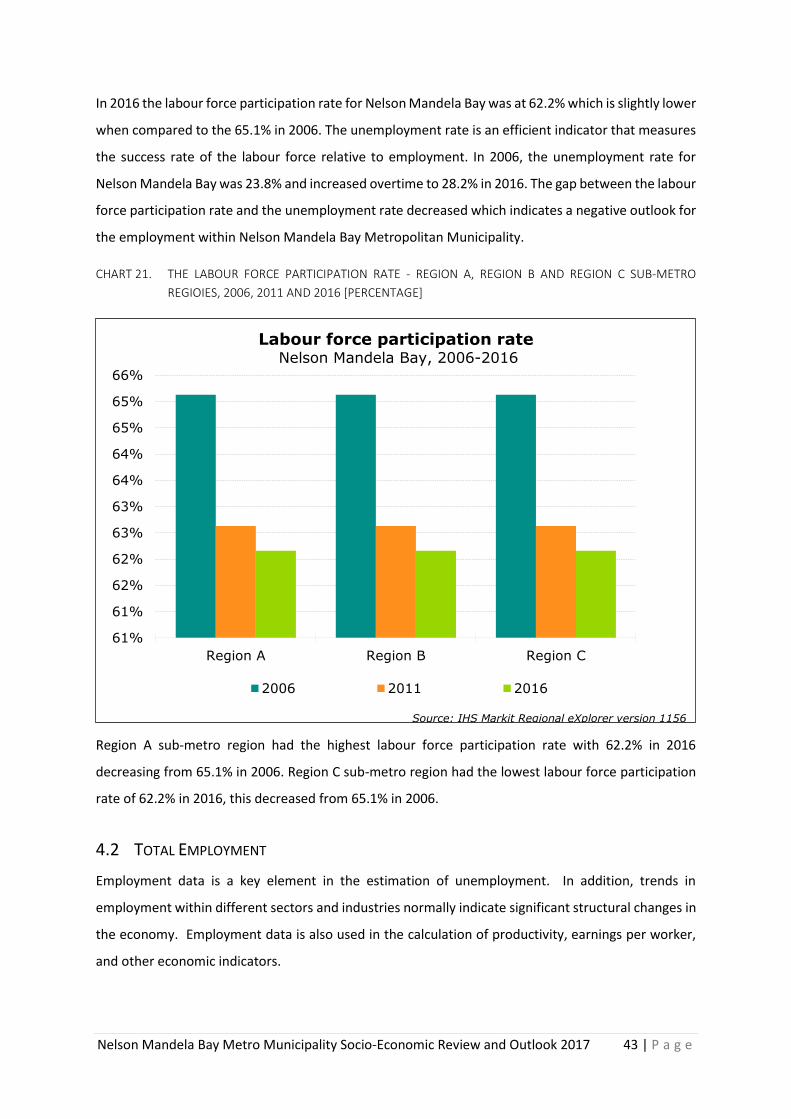
Nelson Mandela Bay Metro Municipality Socio-Economic Review and Outlook 2017 43 | P a g e
In 2016 the labour force participation rate for Nelson Mandela Bay was at 62.2% which is slightly lower
when compared to the 65.1% in 2006. The unemployment rate is an efficient indicator that measures
the success rate of the labour force relative to employment. In 2006, the unemployment rate for
Nelson Mandela Bay was 23.8% and increased overtime to 28.2% in 2016. The gap between the labour
force participation rate and the unemployment rate decreased which indicates a negative outlook for
the employment within Nelson Mandela Bay Metropolitan Municipality.
CHART 21. THE LABOUR FORCE PARTICIPATION RATE - REGION A, REGION B AND REGION C SUB-METRO
REGIOIES, 2006, 2011 AND 2016 [PERCENTAGE]
Region A sub-metro region had the highest labour force participation rate with 62.2% in 2016
decreasing from 65.1% in 2006. Region C sub-metro region had the lowest labour force participation
rate of 62.2% in 2016, this decreased from 65.1% in 2006.
4.2 TOTAL EMPLOYMENT
Employment data is a key element in the estimation of unemployment. In addition, trends in
employment within different sectors and industries normally indicate significant structural changes in
the economy. Employment data is also used in the calculation of productivity, earnings per worker,
and other economic indicators.
61%
61%
62%
62%
63%
63%
64%
64%
65%
65%
66%
Region A Region B Region C
Labour force participation rate Nelson Mandela Bay, 2006-2016
2006 2011 2016
Source: IHS Markit Regional eXplorer version 1156
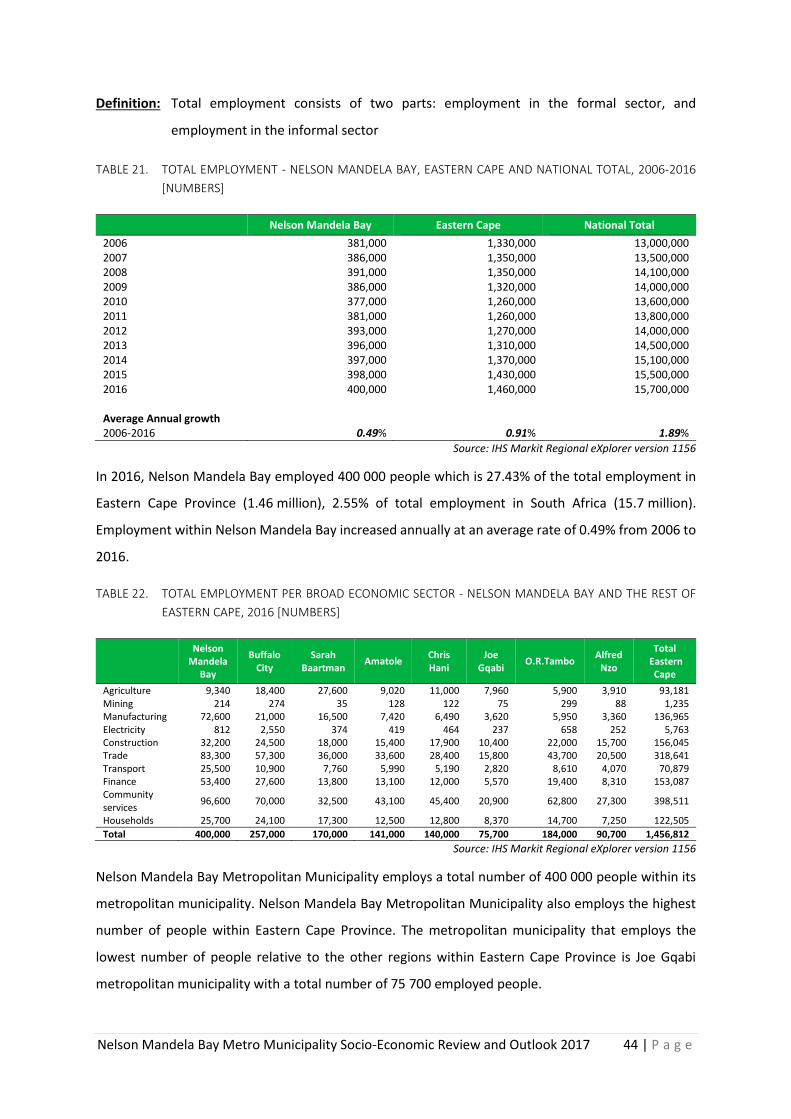
Nelson Mandela Bay Metro Municipality Socio-Economic Review and Outlook 2017 44 | P a g e
Definition: Total employment consists of two parts: employment in the formal sector, and
employment in the informal sector
TABLE 21. TOTAL EMPLOYMENT - NELSON MANDELA BAY, EASTERN CAPE AND NATIONAL TOTAL, 2006-2016
[NUMBERS]
Nelson Mandela Bay Eastern Cape National Total
2006 381,000 1,330,000 13,000,000 2007 386,000 1,350,000 13,500,000 2008 391,000 1,350,000 14,100,000 2009 386,000 1,320,000 14,000,000 2010 377,000 1,260,000 13,600,000 2011 381,000 1,260,000 13,800,000 2012 393,000 1,270,000 14,000,000 2013 396,000 1,310,000 14,500,000 2014 397,000 1,370,000 15,100,000 2015 398,000 1,430,000 15,500,000 2016 400,000 1,460,000 15,700,000 Average Annual growth 2006-2016 0.49% 0.91% 1.89%
Source: IHS Markit Regional eXplorer version 1156
In 2016, Nelson Mandela Bay employed 400 000 people which is 27.43% of the total employment in
Eastern Cape Province (1.46 million), 2.55% of total employment in South Africa (15.7 million).
Employment within Nelson Mandela Bay increased annually at an average rate of 0.49% from 2006 to
2016.
TABLE 22. TOTAL EMPLOYMENT PER BROAD ECONOMIC SECTOR - NELSON MANDELA BAY AND THE REST OF
EASTERN CAPE, 2016 [NUMBERS]
Nelson
Mandela Bay
Buffalo City
Sarah Baartman
Amatole Chris Hani
Joe Gqabi
O.R.Tambo Alfred
Nzo
Total Eastern
Cape
Agriculture 9,340 18,400 27,600 9,020 11,000 7,960 5,900 3,910 93,181 Mining 214 274 35 128 122 75 299 88 1,235 Manufacturing 72,600 21,000 16,500 7,420 6,490 3,620 5,950 3,360 136,965 Electricity 812 2,550 374 419 464 237 658 252 5,763 Construction 32,200 24,500 18,000 15,400 17,900 10,400 22,000 15,700 156,045 Trade 83,300 57,300 36,000 33,600 28,400 15,800 43,700 20,500 318,641 Transport 25,500 10,900 7,760 5,990 5,190 2,820 8,610 4,070 70,879 Finance 53,400 27,600 13,800 13,100 12,000 5,570 19,400 8,310 153,087 Community services
96,600 70,000 32,500 43,100 45,400 20,900 62,800 27,300 398,511
Households 25,700 24,100 17,300 12,500 12,800 8,370 14,700 7,250 122,505
Total 400,000 257,000 170,000 141,000 140,000 75,700 184,000 90,700 1,456,812
Source: IHS Markit Regional eXplorer version 1156
Nelson Mandela Bay Metropolitan Municipality employs a total number of 400 000 people within its
metropolitan municipality. Nelson Mandela Bay Metropolitan Municipality also employs the highest
number of people within Eastern Cape Province. The metropolitan municipality that employs the
lowest number of people relative to the other regions within Eastern Cape Province is Joe Gqabi
metropolitan municipality with a total number of 75 700 employed people.
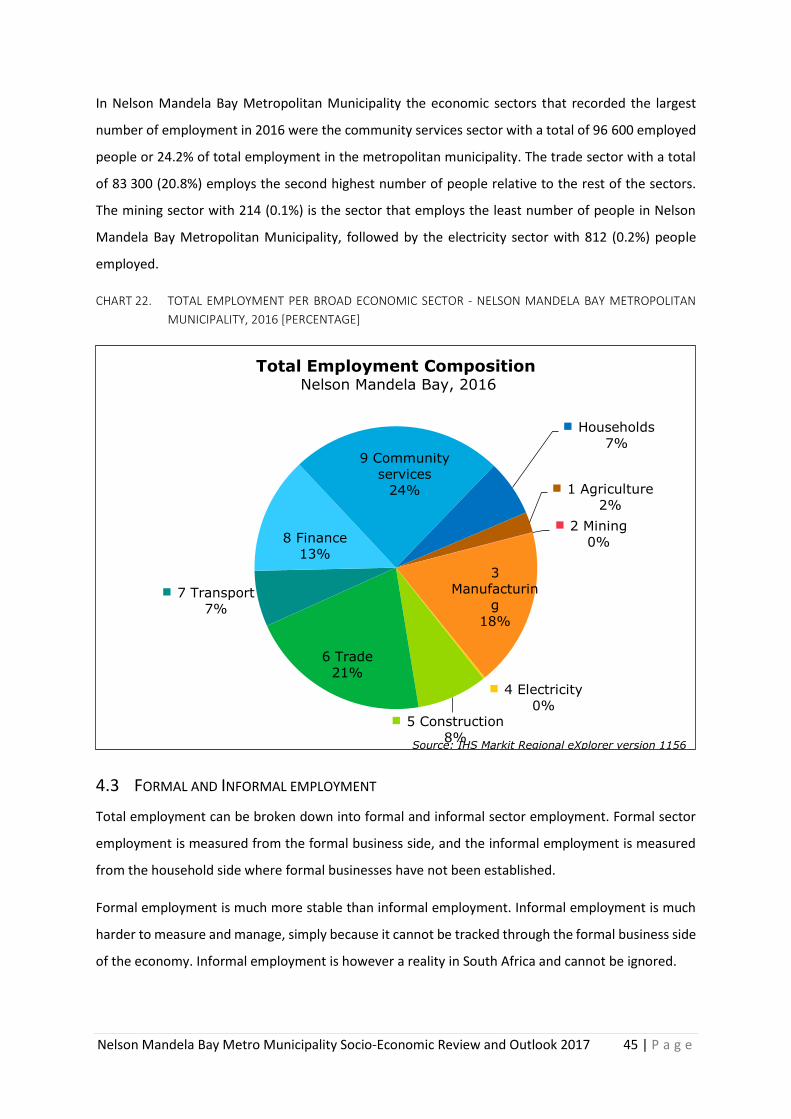
Nelson Mandela Bay Metro Municipality Socio-Economic Review and Outlook 2017 45 | P a g e
In Nelson Mandela Bay Metropolitan Municipality the economic sectors that recorded the largest
number of employment in 2016 were the community services sector with a total of 96 600 employed
people or 24.2% of total employment in the metropolitan municipality. The trade sector with a total
of 83 300 (20.8%) employs the second highest number of people relative to the rest of the sectors.
The mining sector with 214 (0.1%) is the sector that employs the least number of people in Nelson
Mandela Bay Metropolitan Municipality, followed by the electricity sector with 812 (0.2%) people
employed.
CHART 22. TOTAL EMPLOYMENT PER BROAD ECONOMIC SECTOR - NELSON MANDELA BAY METROPOLITAN
MUNICIPALITY, 2016 [PERCENTAGE]
4.3 FORMAL AND INFORMAL EMPLOYMENT
Total employment can be broken down into formal and informal sector employment. Formal sector
employment is measured from the formal business side, and the informal employment is measured
from the household side where formal businesses have not been established.
Formal employment is much more stable than informal employment. Informal employment is much
harder to measure and manage, simply because it cannot be tracked through the formal business side
of the economy. Informal employment is however a reality in South Africa and cannot be ignored.
1 Agriculture
2%
2 Mining
0%
3
Manufacturin
g
18%
4 Electricity
0%5 Construction
8%
6 Trade
21%
7 Transport
7%
8 Finance
13%
9 Community
services
24%
Households
7%
Total Employment Composition Nelson Mandela Bay, 2016
Source: IHS Markit Regional eXplorer version 1156
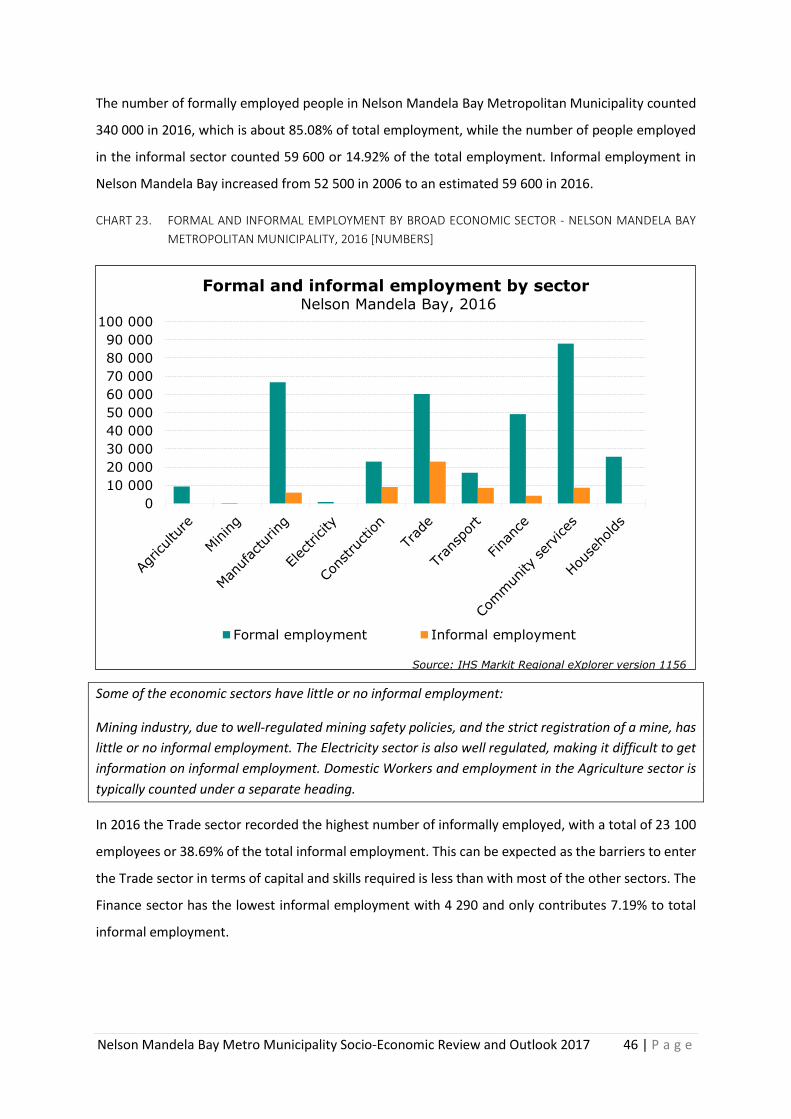
Nelson Mandela Bay Metro Municipality Socio-Economic Review and Outlook 2017 46 | P a g e
The number of formally employed people in Nelson Mandela Bay Metropolitan Municipality counted
340 000 in 2016, which is about 85.08% of total employment, while the number of people employed
in the informal sector counted 59 600 or 14.92% of the total employment. Informal employment in
Nelson Mandela Bay increased from 52 500 in 2006 to an estimated 59 600 in 2016.
CHART 23. FORMAL AND INFORMAL EMPLOYMENT BY BROAD ECONOMIC SECTOR - NELSON MANDELA BAY
METROPOLITAN MUNICIPALITY, 2016 [NUMBERS]
Some of the economic sectors have little or no informal employment:
Mining industry, due to well-regulated mining safety policies, and the strict registration of a mine, has
little or no informal employment. The Electricity sector is also well regulated, making it difficult to get
information on informal employment. Domestic Workers and employment in the Agriculture sector is
typically counted under a separate heading.
In 2016 the Trade sector recorded the highest number of informally employed, with a total of 23 100
employees or 38.69% of the total informal employment. This can be expected as the barriers to enter
the Trade sector in terms of capital and skills required is less than with most of the other sectors. The
Finance sector has the lowest informal employment with 4 290 and only contributes 7.19% to total
informal employment.
0
10 000
20 000
30 000
40 000
50 000
60 000
70 000
80 000
90 000
100 000
Formal and informal employment by sector Nelson Mandela Bay, 2016
Formal employment Informal employment
Source: IHS Markit Regional eXplorer version 1156
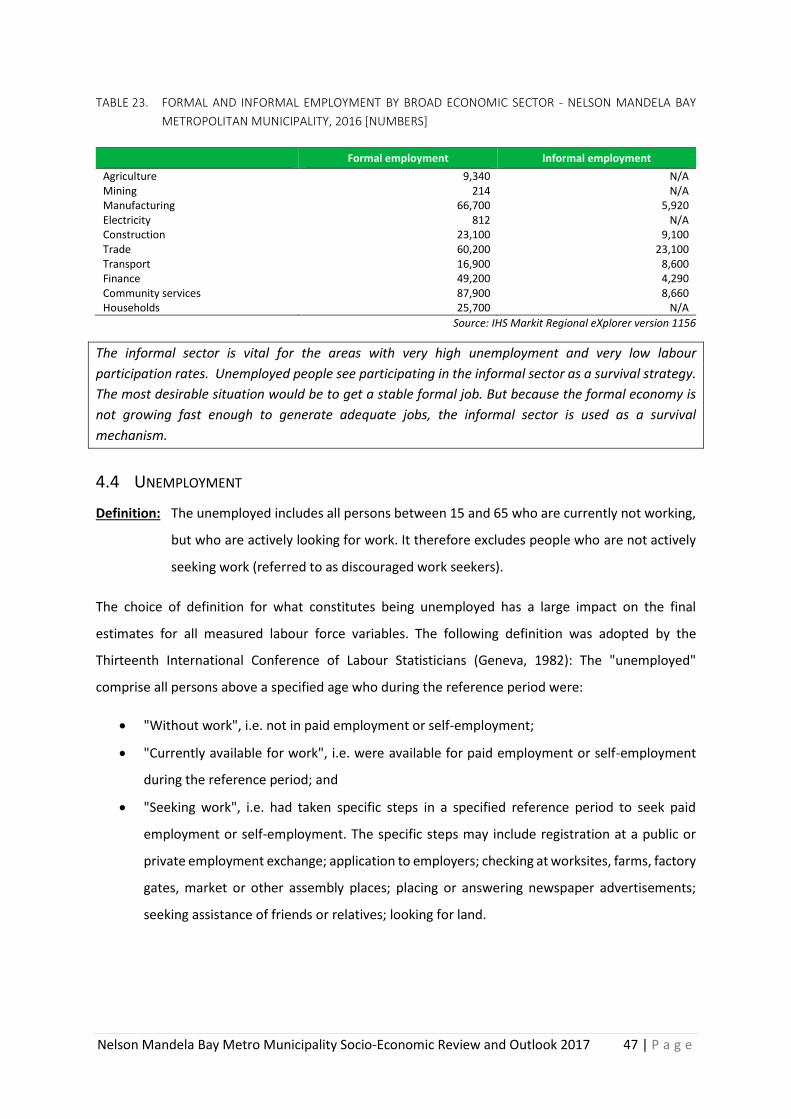
Nelson Mandela Bay Metro Municipality Socio-Economic Review and Outlook 2017 47 | P a g e
TABLE 23. FORMAL AND INFORMAL EMPLOYMENT BY BROAD ECONOMIC SECTOR - NELSON MANDELA BAY
METROPOLITAN MUNICIPALITY, 2016 [NUMBERS]
Formal employment Informal employment
Agriculture 9,340 N/A Mining 214 N/A Manufacturing 66,700 5,920 Electricity 812 N/A Construction 23,100 9,100 Trade 60,200 23,100 Transport 16,900 8,600 Finance 49,200 4,290 Community services 87,900 8,660 Households 25,700 N/A
Source: IHS Markit Regional eXplorer version 1156
The informal sector is vital for the areas with very high unemployment and very low labour
participation rates. Unemployed people see participating in the informal sector as a survival strategy.
The most desirable situation would be to get a stable formal job. But because the formal economy is
not growing fast enough to generate adequate jobs, the informal sector is used as a survival
mechanism.
4.4 UNEMPLOYMENT
Definition: The unemployed includes all persons between 15 and 65 who are currently not working,
but who are actively looking for work. It therefore excludes people who are not actively
seeking work (referred to as discouraged work seekers).
The choice of definition for what constitutes being unemployed has a large impact on the final
estimates for all measured labour force variables. The following definition was adopted by the
Thirteenth International Conference of Labour Statisticians (Geneva, 1982): The "unemployed"
comprise all persons above a specified age who during the reference period were:
• "Without work", i.e. not in paid employment or self-employment;
• "Currently available for work", i.e. were available for paid employment or self-employment
during the reference period; and
• "Seeking work", i.e. had taken specific steps in a specified reference period to seek paid
employment or self-employment. The specific steps may include registration at a public or
private employment exchange; application to employers; checking at worksites, farms, factory
gates, market or other assembly places; placing or answering newspaper advertisements;
seeking assistance of friends or relatives; looking for land.
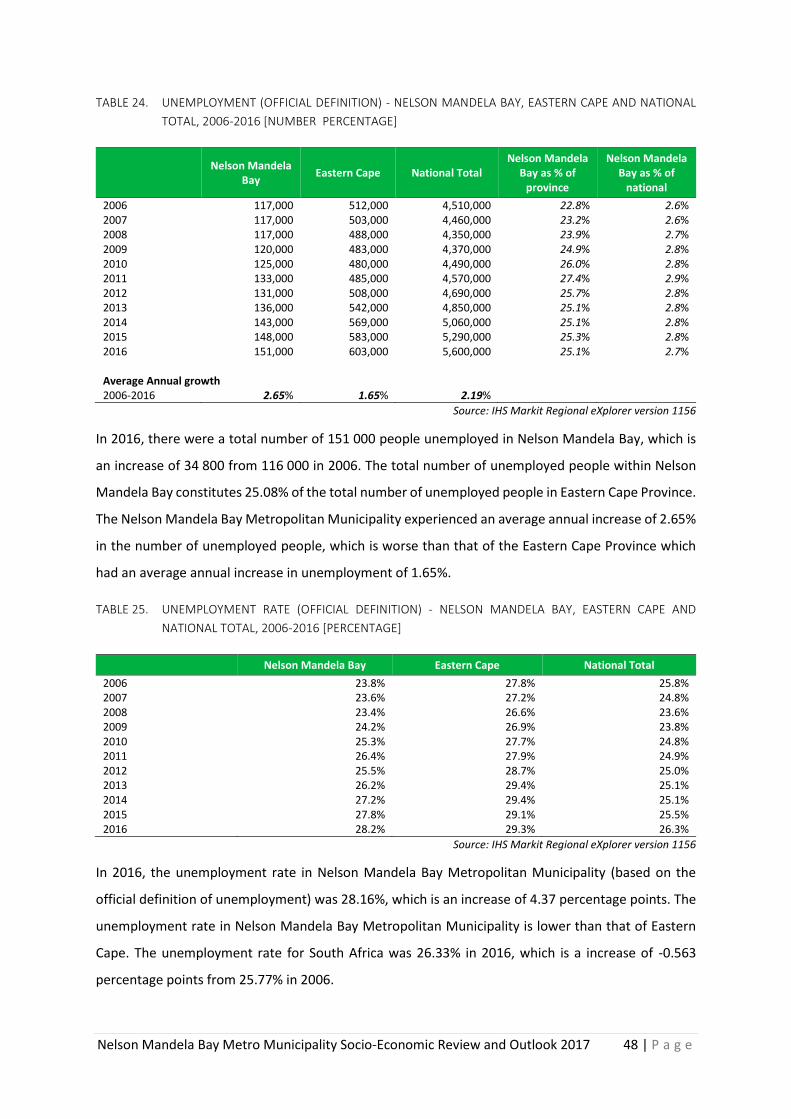
Nelson Mandela Bay Metro Municipality Socio-Economic Review and Outlook 2017 48 | P a g e
TABLE 24. UNEMPLOYMENT (OFFICIAL DEFINITION) - NELSON MANDELA BAY, EASTERN CAPE AND NATIONAL
TOTAL, 2006-2016 [NUMBER PERCENTAGE]
Nelson Mandela
Bay Eastern Cape National Total
Nelson Mandela Bay as % of
province
Nelson Mandela Bay as % of
national
2006 117,000 512,000 4,510,000 22.8% 2.6% 2007 117,000 503,000 4,460,000 23.2% 2.6% 2008 117,000 488,000 4,350,000 23.9% 2.7% 2009 120,000 483,000 4,370,000 24.9% 2.8% 2010 125,000 480,000 4,490,000 26.0% 2.8% 2011 133,000 485,000 4,570,000 27.4% 2.9% 2012 131,000 508,000 4,690,000 25.7% 2.8% 2013 136,000 542,000 4,850,000 25.1% 2.8% 2014 143,000 569,000 5,060,000 25.1% 2.8% 2015 148,000 583,000 5,290,000 25.3% 2.8% 2016 151,000 603,000 5,600,000 25.1% 2.7% Average Annual growth 2006-2016 2.65% 1.65% 2.19%
Source: IHS Markit Regional eXplorer version 1156
In 2016, there were a total number of 151 000 people unemployed in Nelson Mandela Bay, which is
an increase of 34 800 from 116 000 in 2006. The total number of unemployed people within Nelson
Mandela Bay constitutes 25.08% of the total number of unemployed people in Eastern Cape Province.
The Nelson Mandela Bay Metropolitan Municipality experienced an average annual increase of 2.65%
in the number of unemployed people, which is worse than that of the Eastern Cape Province which
had an average annual increase in unemployment of 1.65%.
TABLE 25. UNEMPLOYMENT RATE (OFFICIAL DEFINITION) - NELSON MANDELA BAY, EASTERN CAPE AND
NATIONAL TOTAL, 2006-2016 [PERCENTAGE]
Nelson Mandela Bay Eastern Cape National Total
2006 23.8% 27.8% 25.8% 2007 23.6% 27.2% 24.8% 2008 23.4% 26.6% 23.6% 2009 24.2% 26.9% 23.8% 2010 25.3% 27.7% 24.8% 2011 26.4% 27.9% 24.9% 2012 25.5% 28.7% 25.0% 2013 26.2% 29.4% 25.1% 2014 27.2% 29.4% 25.1% 2015 27.8% 29.1% 25.5% 2016 28.2% 29.3% 26.3%
Source: IHS Markit Regional eXplorer version 1156
In 2016, the unemployment rate in Nelson Mandela Bay Metropolitan Municipality (based on the
official definition of unemployment) was 28.16%, which is an increase of 4.37 percentage points. The
unemployment rate in Nelson Mandela Bay Metropolitan Municipality is lower than that of Eastern
Cape. The unemployment rate for South Africa was 26.33% in 2016, which is a increase of -0.563
percentage points from 25.77% in 2006.
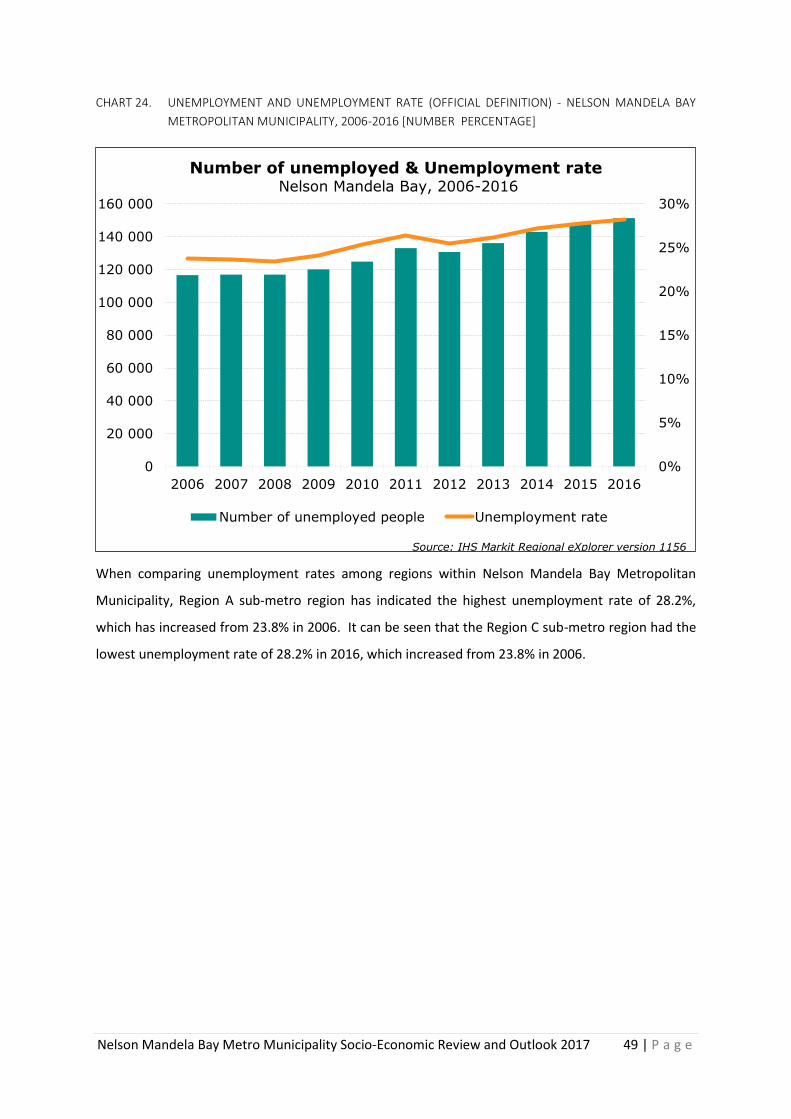
Nelson Mandela Bay Metro Municipality Socio-Economic Review and Outlook 2017 49 | P a g e
CHART 24. UNEMPLOYMENT AND UNEMPLOYMENT RATE (OFFICIAL DEFINITION) - NELSON MANDELA BAY
METROPOLITAN MUNICIPALITY, 2006-2016 [NUMBER PERCENTAGE]
When comparing unemployment rates among regions within Nelson Mandela Bay Metropolitan
Municipality, Region A sub-metro region has indicated the highest unemployment rate of 28.2%,
which has increased from 23.8% in 2006. It can be seen that the Region C sub-metro region had the
lowest unemployment rate of 28.2% in 2016, which increased from 23.8% in 2006.
0%
5%
10%
15%
20%
25%
30%
0
20 000
40 000
60 000
80 000
100 000
120 000
140 000
160 000
2006 2007 2008 2009 2010 2011 2012 2013 2014 2015 2016
Number of unemployed & Unemployment rate Nelson Mandela Bay, 2006-2016
Number of unemployed people Unemployment rate
Source: IHS Markit Regional eXplorer version 1156
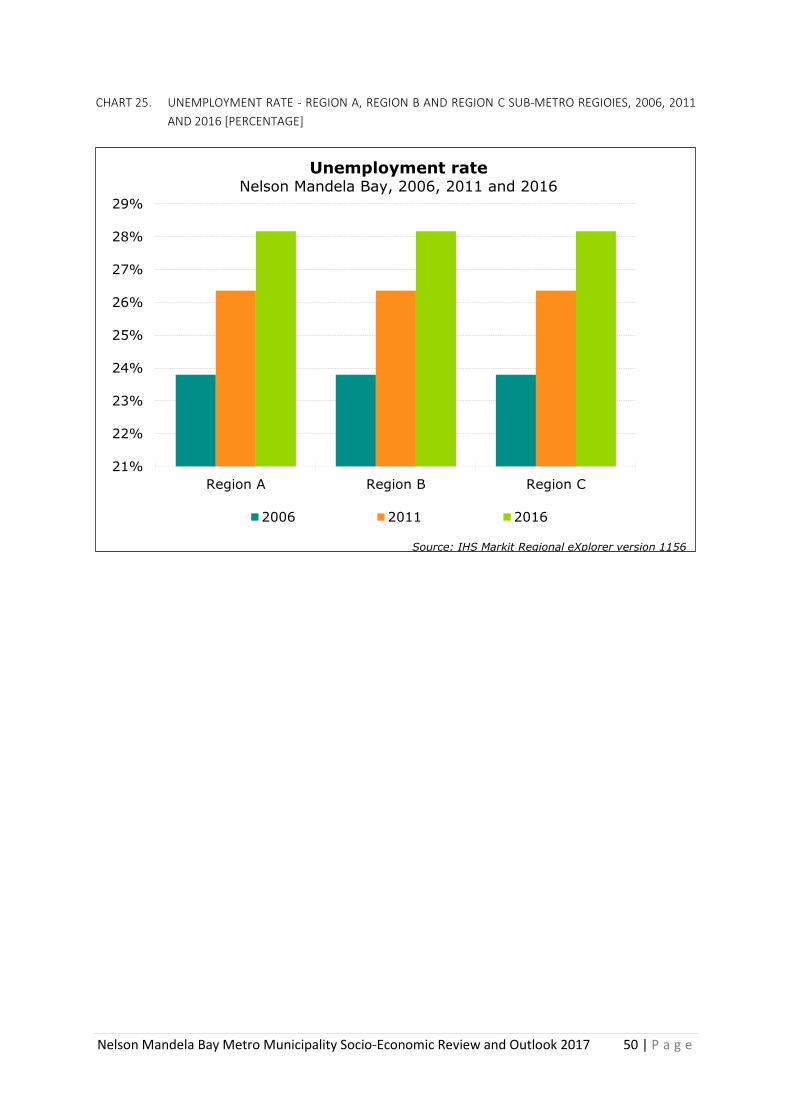
Nelson Mandela Bay Metro Municipality Socio-Economic Review and Outlook 2017 50 | P a g e
CHART 25. UNEMPLOYMENT RATE - REGION A, REGION B AND REGION C SUB-METRO REGIOIES, 2006, 2011
AND 2016 [PERCENTAGE]
21%
22%
23%
24%
25%
26%
27%
28%
29%
Region A Region B Region C
Unemployment rate Nelson Mandela Bay, 2006, 2011 and 2016
2006 2011 2016
Source: IHS Markit Regional eXplorer version 1156
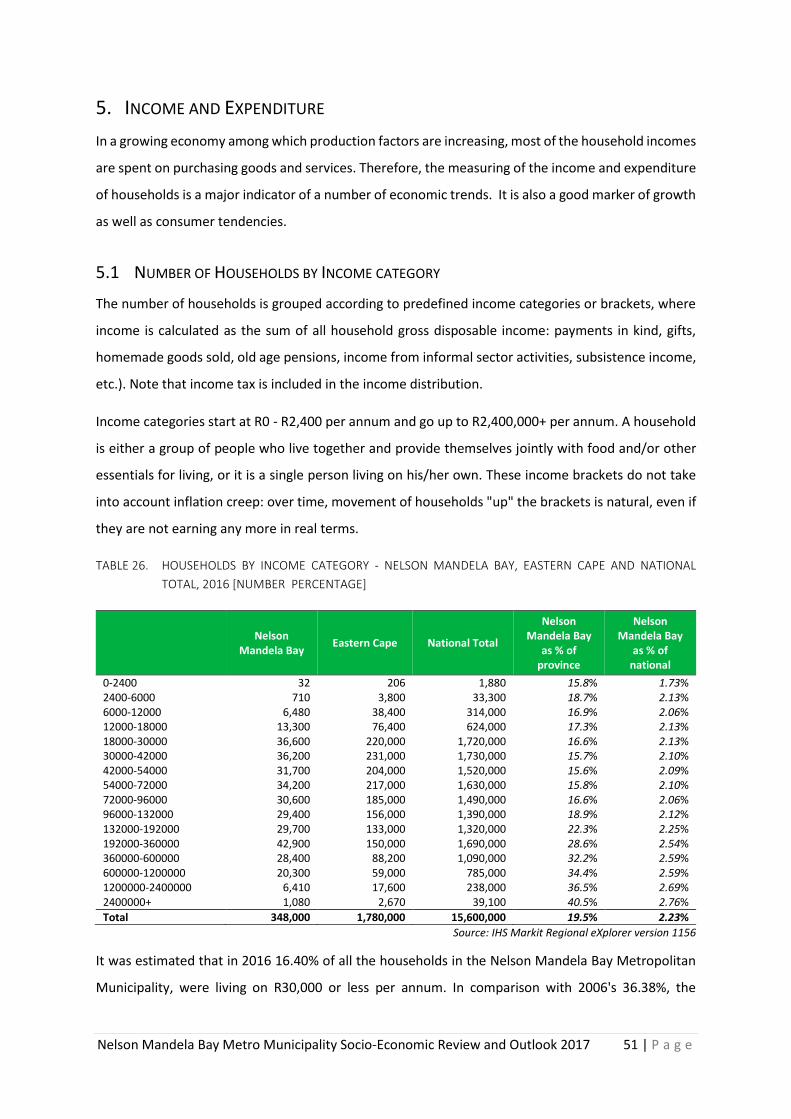
Nelson Mandela Bay Metro Municipality Socio-Economic Review and Outlook 2017 51 | P a g e
5. INCOME AND EXPENDITURE
In a growing economy among which production factors are increasing, most of the household incomes
are spent on purchasing goods and services. Therefore, the measuring of the income and expenditure
of households is a major indicator of a number of economic trends. It is also a good marker of growth
as well as consumer tendencies.
5.1 NUMBER OF HOUSEHOLDS BY INCOME CATEGORY
The number of households is grouped according to predefined income categories or brackets, where
income is calculated as the sum of all household gross disposable income: payments in kind, gifts,
homemade goods sold, old age pensions, income from informal sector activities, subsistence income,
etc.). Note that income tax is included in the income distribution.
Income categories start at R0 - R2,400 per annum and go up to R2,400,000+ per annum. A household
is either a group of people who live together and provide themselves jointly with food and/or other
essentials for living, or it is a single person living on his/her own. These income brackets do not take
into account inflation creep: over time, movement of households "up" the brackets is natural, even if
they are not earning any more in real terms.
TABLE 26. HOUSEHOLDS BY INCOME CATEGORY - NELSON MANDELA BAY, EASTERN CAPE AND NATIONAL
TOTAL, 2016 [NUMBER PERCENTAGE]
Nelson
Mandela Bay Eastern Cape National Total
Nelson Mandela Bay
as % of province
Nelson Mandela Bay
as % of national
0-2400 32 206 1,880 15.8% 1.73% 2400-6000 710 3,800 33,300 18.7% 2.13% 6000-12000 6,480 38,400 314,000 16.9% 2.06% 12000-18000 13,300 76,400 624,000 17.3% 2.13% 18000-30000 36,600 220,000 1,720,000 16.6% 2.13% 30000-42000 36,200 231,000 1,730,000 15.7% 2.10% 42000-54000 31,700 204,000 1,520,000 15.6% 2.09% 54000-72000 34,200 217,000 1,630,000 15.8% 2.10% 72000-96000 30,600 185,000 1,490,000 16.6% 2.06% 96000-132000 29,400 156,000 1,390,000 18.9% 2.12% 132000-192000 29,700 133,000 1,320,000 22.3% 2.25% 192000-360000 42,900 150,000 1,690,000 28.6% 2.54% 360000-600000 28,400 88,200 1,090,000 32.2% 2.59% 600000-1200000 20,300 59,000 785,000 34.4% 2.59% 1200000-2400000 6,410 17,600 238,000 36.5% 2.69% 2400000+ 1,080 2,670 39,100 40.5% 2.76%
Total 348,000 1,780,000 15,600,000 19.5% 2.23%
Source: IHS Markit Regional eXplorer version 1156
It was estimated that in 2016 16.40% of all the households in the Nelson Mandela Bay Metropolitan
Municipality, were living on R30,000 or less per annum. In comparison with 2006's 36.38%, the
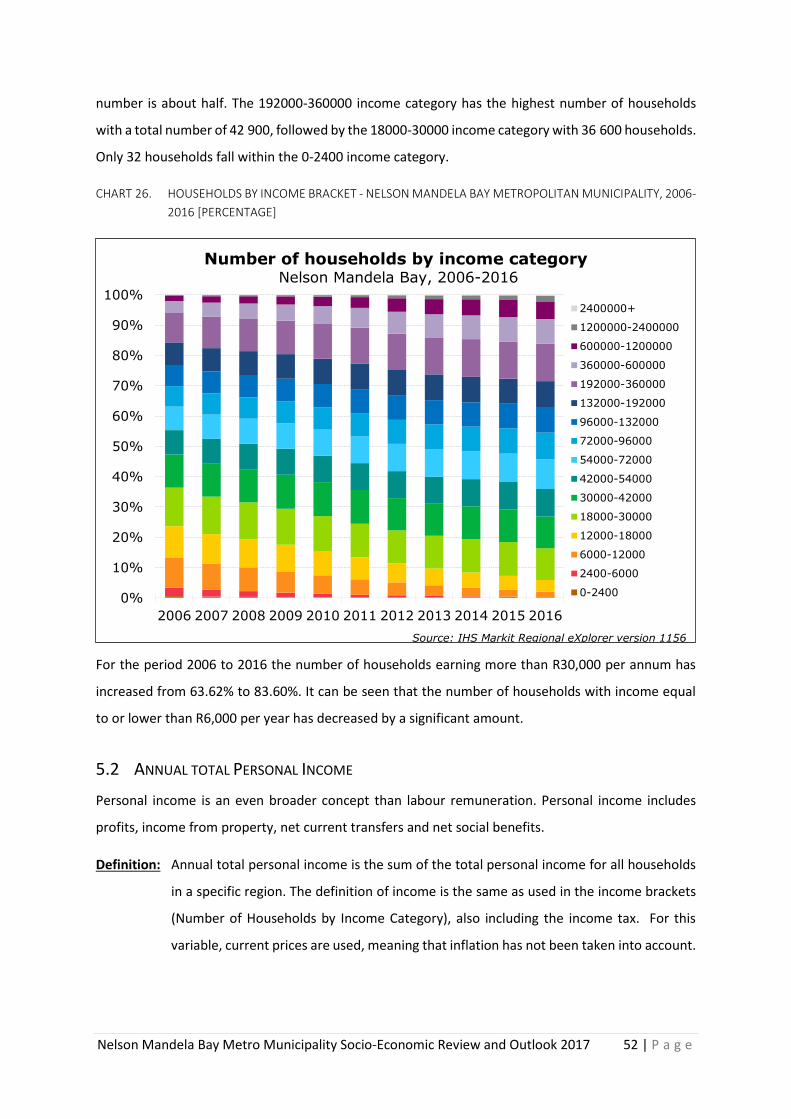
Nelson Mandela Bay Metro Municipality Socio-Economic Review and Outlook 2017 52 | P a g e
number is about half. The 192000-360000 income category has the highest number of households
with a total number of 42 900, followed by the 18000-30000 income category with 36 600 households.
Only 32 households fall within the 0-2400 income category.
CHART 26. HOUSEHOLDS BY INCOME BRACKET - NELSON MANDELA BAY METROPOLITAN MUNICIPALITY, 2006-
2016 [PERCENTAGE]
For the period 2006 to 2016 the number of households earning more than R30,000 per annum has
increased from 63.62% to 83.60%. It can be seen that the number of households with income equal
to or lower than R6,000 per year has decreased by a significant amount.
5.2 ANNUAL TOTAL PERSONAL INCOME
Personal income is an even broader concept than labour remuneration. Personal income includes
profits, income from property, net current transfers and net social benefits.
Definition: Annual total personal income is the sum of the total personal income for all households
in a specific region. The definition of income is the same as used in the income brackets
(Number of Households by Income Category), also including the income tax. For this
variable, current prices are used, meaning that inflation has not been taken into account.
0%
10%
20%
30%
40%
50%
60%
70%
80%
90%
100%
2006 2007 2008 2009 2010 2011 2012 2013 2014 2015 2016
Number of households by income category Nelson Mandela Bay, 2006-2016
2400000+
1200000-2400000
600000-1200000
360000-600000
192000-360000
132000-192000
96000-132000
72000-96000
54000-72000
42000-54000
30000-42000
18000-30000
12000-18000
6000-12000
2400-6000
0-2400
Source: IHS Markit Regional eXplorer version 1156
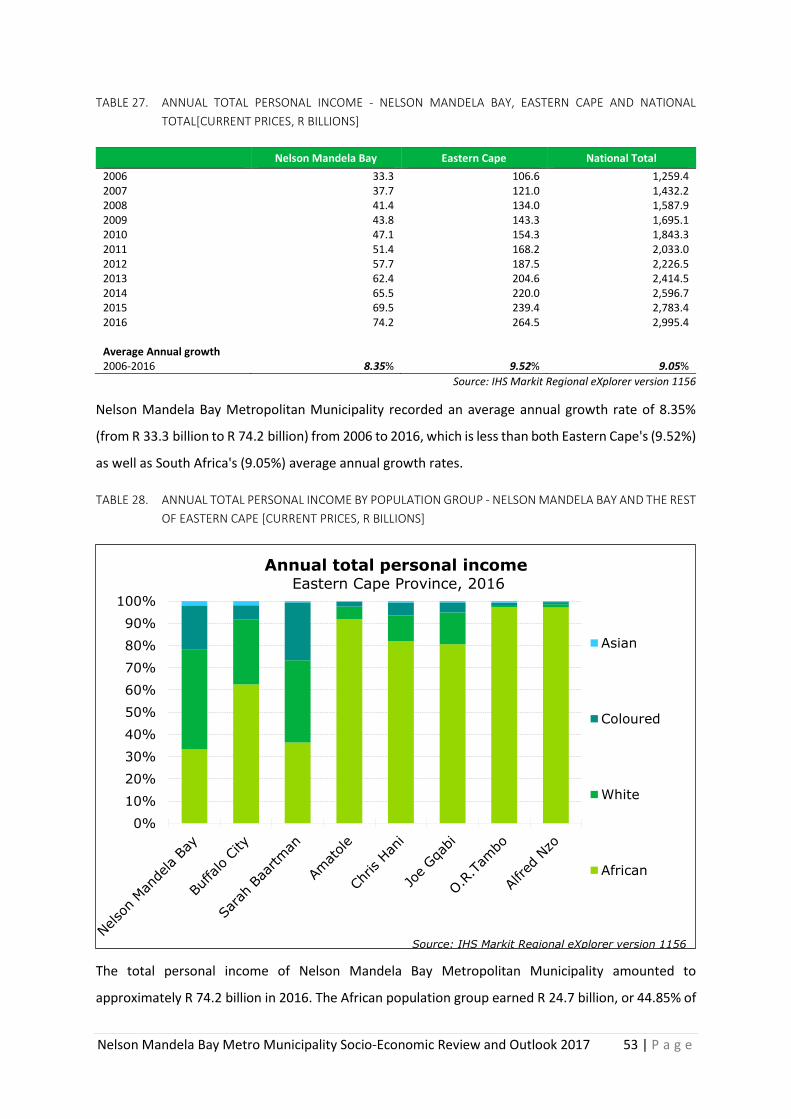
Nelson Mandela Bay Metro Municipality Socio-Economic Review and Outlook 2017 53 | P a g e
TABLE 27. ANNUAL TOTAL PERSONAL INCOME - NELSON MANDELA BAY, EASTERN CAPE AND NATIONAL
TOTAL[CURRENT PRICES, R BILLIONS]
Nelson Mandela Bay Eastern Cape National Total
2006 33.3 106.6 1,259.4 2007 37.7 121.0 1,432.2 2008 41.4 134.0 1,587.9 2009 43.8 143.3 1,695.1 2010 47.1 154.3 1,843.3 2011 51.4 168.2 2,033.0 2012 57.7 187.5 2,226.5 2013 62.4 204.6 2,414.5 2014 65.5 220.0 2,596.7 2015 69.5 239.4 2,783.4 2016 74.2 264.5 2,995.4 Average Annual growth 2006-2016 8.35% 9.52% 9.05%
Source: IHS Markit Regional eXplorer version 1156
Nelson Mandela Bay Metropolitan Municipality recorded an average annual growth rate of 8.35%
(from R 33.3 billion to R 74.2 billion) from 2006 to 2016, which is less than both Eastern Cape's (9.52%)
as well as South Africa's (9.05%) average annual growth rates.
TABLE 28. ANNUAL TOTAL PERSONAL INCOME BY POPULATION GROUP - NELSON MANDELA BAY AND THE REST
OF EASTERN CAPE [CURRENT PRICES, R BILLIONS]
The total personal income of Nelson Mandela Bay Metropolitan Municipality amounted to
approximately R 74.2 billion in 2016. The African population group earned R 24.7 billion, or 44.85% of
0%
10%
20%
30%
40%
50%
60%
70%
80%
90%
100%
Annual total personal income Eastern Cape Province, 2016
Asian
Coloured
White
African
Source: IHS Markit Regional eXplorer version 1156
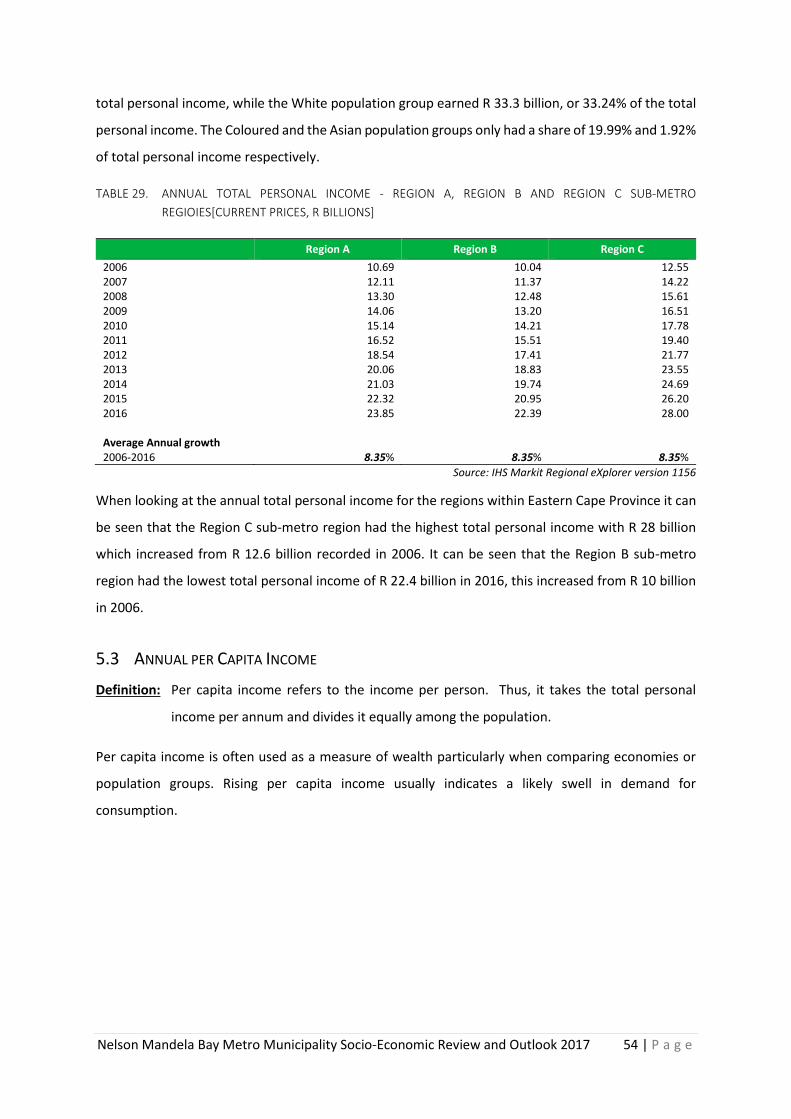
Nelson Mandela Bay Metro Municipality Socio-Economic Review and Outlook 2017 54 | P a g e
total personal income, while the White population group earned R 33.3 billion, or 33.24% of the total
personal income. The Coloured and the Asian population groups only had a share of 19.99% and 1.92%
of total personal income respectively.
TABLE 29. ANNUAL TOTAL PERSONAL INCOME - REGION A, REGION B AND REGION C SUB-METRO
REGIOIES[CURRENT PRICES, R BILLIONS]
Region A Region B Region C
2006 10.69 10.04 12.55 2007 12.11 11.37 14.22 2008 13.30 12.48 15.61 2009 14.06 13.20 16.51 2010 15.14 14.21 17.78 2011 16.52 15.51 19.40 2012 18.54 17.41 21.77 2013 20.06 18.83 23.55 2014 21.03 19.74 24.69 2015 22.32 20.95 26.20 2016 23.85 22.39 28.00 Average Annual growth 2006-2016 8.35% 8.35% 8.35%
Source: IHS Markit Regional eXplorer version 1156
When looking at the annual total personal income for the regions within Eastern Cape Province it can
be seen that the Region C sub-metro region had the highest total personal income with R 28 billion
which increased from R 12.6 billion recorded in 2006. It can be seen that the Region B sub-metro
region had the lowest total personal income of R 22.4 billion in 2016, this increased from R 10 billion
in 2006.
5.3 ANNUAL PER CAPITA INCOME
Definition: Per capita income refers to the income per person. Thus, it takes the total personal
income per annum and divides it equally among the population.
Per capita income is often used as a measure of wealth particularly when comparing economies or
population groups. Rising per capita income usually indicates a likely swell in demand for
consumption.
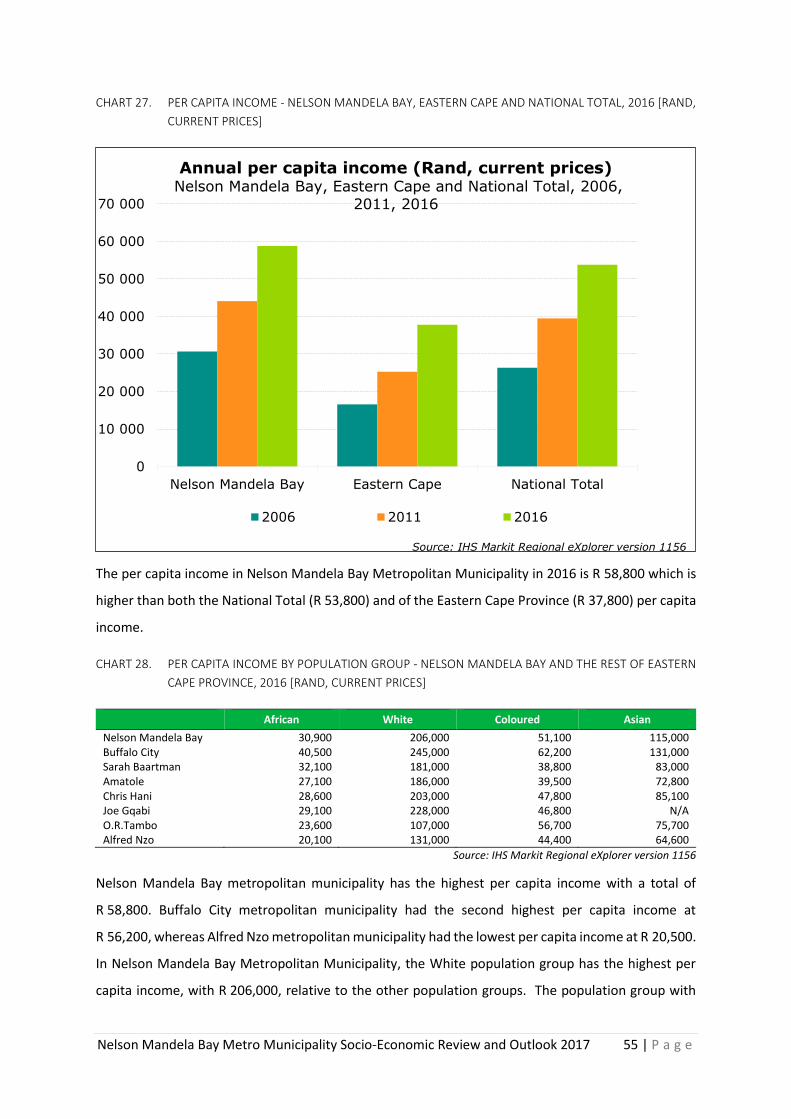
Nelson Mandela Bay Metro Municipality Socio-Economic Review and Outlook 2017 55 | P a g e
CHART 27. PER CAPITA INCOME - NELSON MANDELA BAY, EASTERN CAPE AND NATIONAL TOTAL, 2016 [RAND,
CURRENT PRICES]
The per capita income in Nelson Mandela Bay Metropolitan Municipality in 2016 is R 58,800 which is
higher than both the National Total (R 53,800) and of the Eastern Cape Province (R 37,800) per capita
income.
CHART 28. PER CAPITA INCOME BY POPULATION GROUP - NELSON MANDELA BAY AND THE REST OF EASTERN
CAPE PROVINCE, 2016 [RAND, CURRENT PRICES]
African White Coloured Asian
Nelson Mandela Bay 30,900 206,000 51,100 115,000 Buffalo City 40,500 245,000 62,200 131,000 Sarah Baartman 32,100 181,000 38,800 83,000 Amatole 27,100 186,000 39,500 72,800 Chris Hani 28,600 203,000 47,800 85,100 Joe Gqabi 29,100 228,000 46,800 N/A O.R.Tambo 23,600 107,000 56,700 75,700 Alfred Nzo 20,100 131,000 44,400 64,600
Source: IHS Markit Regional eXplorer version 1156
Nelson Mandela Bay metropolitan municipality has the highest per capita income with a total of
R 58,800. Buffalo City metropolitan municipality had the second highest per capita income at
R 56,200, whereas Alfred Nzo metropolitan municipality had the lowest per capita income at R 20,500.
In Nelson Mandela Bay Metropolitan Municipality, the White population group has the highest per
capita income, with R 206,000, relative to the other population groups. The population group with
0
10 000
20 000
30 000
40 000
50 000
60 000
70 000
Nelson Mandela Bay Eastern Cape National Total
Annual per capita income (Rand, current prices) Nelson Mandela Bay, Eastern Cape and National Total, 2006,
2011, 2016
2006 2011 2016
Source: IHS Markit Regional eXplorer version 1156
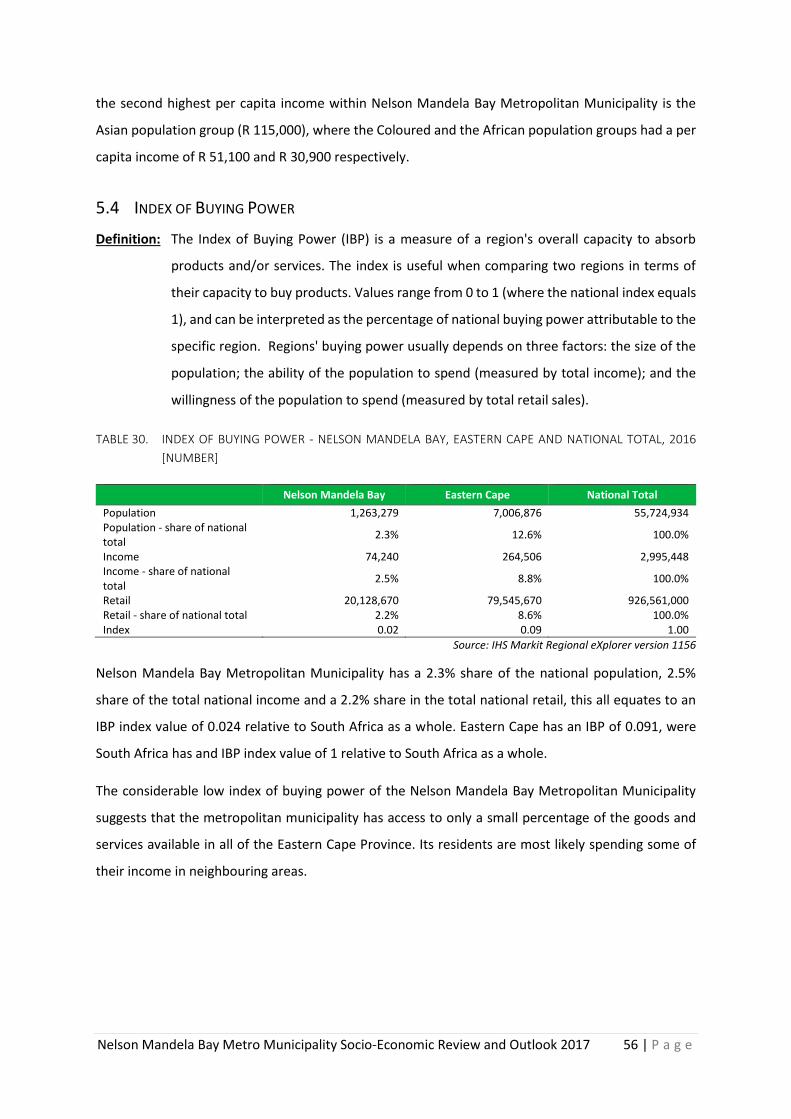
Nelson Mandela Bay Metro Municipality Socio-Economic Review and Outlook 2017 56 | P a g e
the second highest per capita income within Nelson Mandela Bay Metropolitan Municipality is the
Asian population group (R 115,000), where the Coloured and the African population groups had a per
capita income of R 51,100 and R 30,900 respectively.
5.4 INDEX OF BUYING POWER
Definition: The Index of Buying Power (IBP) is a measure of a region's overall capacity to absorb
products and/or services. The index is useful when comparing two regions in terms of
their capacity to buy products. Values range from 0 to 1 (where the national index equals
1), and can be interpreted as the percentage of national buying power attributable to the
specific region. Regions' buying power usually depends on three factors: the size of the
population; the ability of the population to spend (measured by total income); and the
willingness of the population to spend (measured by total retail sales).
TABLE 30. INDEX OF BUYING POWER - NELSON MANDELA BAY, EASTERN CAPE AND NATIONAL TOTAL, 2016
[NUMBER]
Nelson Mandela Bay Eastern Cape National Total
Population 1,263,279 7,006,876 55,724,934 Population - share of national total
2.3% 12.6% 100.0%
Income 74,240 264,506 2,995,448 Income - share of national total
2.5% 8.8% 100.0%
Retail 20,128,670 79,545,670 926,561,000 Retail - share of national total 2.2% 8.6% 100.0% Index 0.02 0.09 1.00
Source: IHS Markit Regional eXplorer version 1156
Nelson Mandela Bay Metropolitan Municipality has a 2.3% share of the national population, 2.5%
share of the total national income and a 2.2% share in the total national retail, this all equates to an
IBP index value of 0.024 relative to South Africa as a whole. Eastern Cape has an IBP of 0.091, were
South Africa has and IBP index value of 1 relative to South Africa as a whole.
The considerable low index of buying power of the Nelson Mandela Bay Metropolitan Municipality
suggests that the metropolitan municipality has access to only a small percentage of the goods and
services available in all of the Eastern Cape Province. Its residents are most likely spending some of
their income in neighbouring areas.
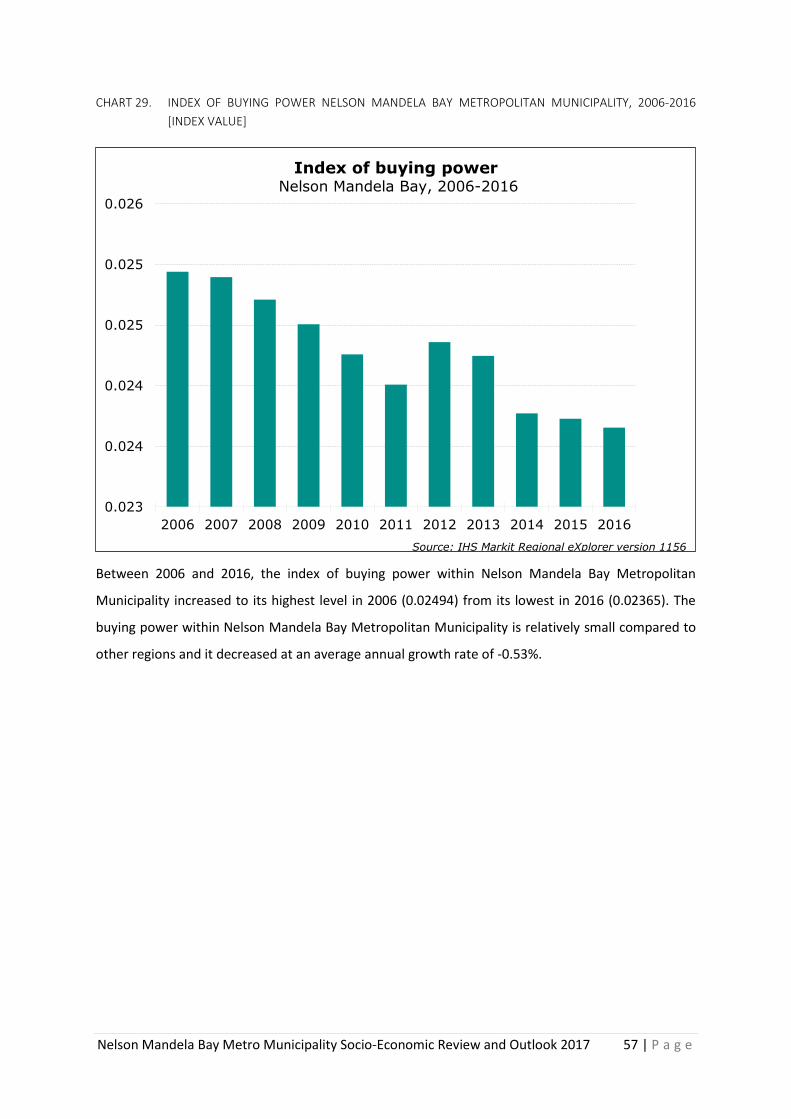
Nelson Mandela Bay Metro Municipality Socio-Economic Review and Outlook 2017 57 | P a g e
CHART 29. INDEX OF BUYING POWER NELSON MANDELA BAY METROPOLITAN MUNICIPALITY, 2006-2016
[INDEX VALUE]
Between 2006 and 2016, the index of buying power within Nelson Mandela Bay Metropolitan
Municipality increased to its highest level in 2006 (0.02494) from its lowest in 2016 (0.02365). The
buying power within Nelson Mandela Bay Metropolitan Municipality is relatively small compared to
other regions and it decreased at an average annual growth rate of -0.53%.
0.023
0.024
0.024
0.025
0.025
0.026
2006 2007 2008 2009 2010 2011 2012 2013 2014 2015 2016
Index of buying power Nelson Mandela Bay, 2006-2016
Source: IHS Markit Regional eXplorer version 1156
Nelson Mandela Bay Metro Municipality Socio-Economic Review and Outlook 2017 58 | P a g e
6. DEVELOPMENT
Indicators of development, like the Human Development Index (HDI), Gini Coefficient (income
inequality), poverty and the poverty gap, and education, are used to estimate the level of
development of a given region in South Africa relative to the rest of the country.
Another indicator that is widely used is the number (or percentage) of people living in poverty.
Poverty is defined as the deprivation of those things that determine the quality of life, including food,
clothing, shelter and safe drinking water. More than that, other "intangibles" is also included such as
the opportunity to learn, and the privilege to enjoy the respect of fellow citizens. Curbing poverty and
alleviating the effects thereof should be a premise in the compilation of all policies that aspire towards
a better life for all.
6.1 HUMAN DEVELOPMENT INDEX (HDI)
Definition: The Human Development Index (HDI) is a composite relative index used to compare
human development across population groups or regions.
HDI is the combination of three basic dimensions of human development: A long and healthy life,
knowledge and a decent standard of living. A long and healthy life is typically measured using life
expectancy at birth. Knowledge is normally based on adult literacy and / or the combination of
enrolment in primary, secondary and tertiary schools. In order to gauge a decent standard of living,
we make use of GDP per capita. On a technical note, the HDI can have a maximum value of 1, indicating
a very high level of human development, while the minimum value is 0, indicating no human
development.
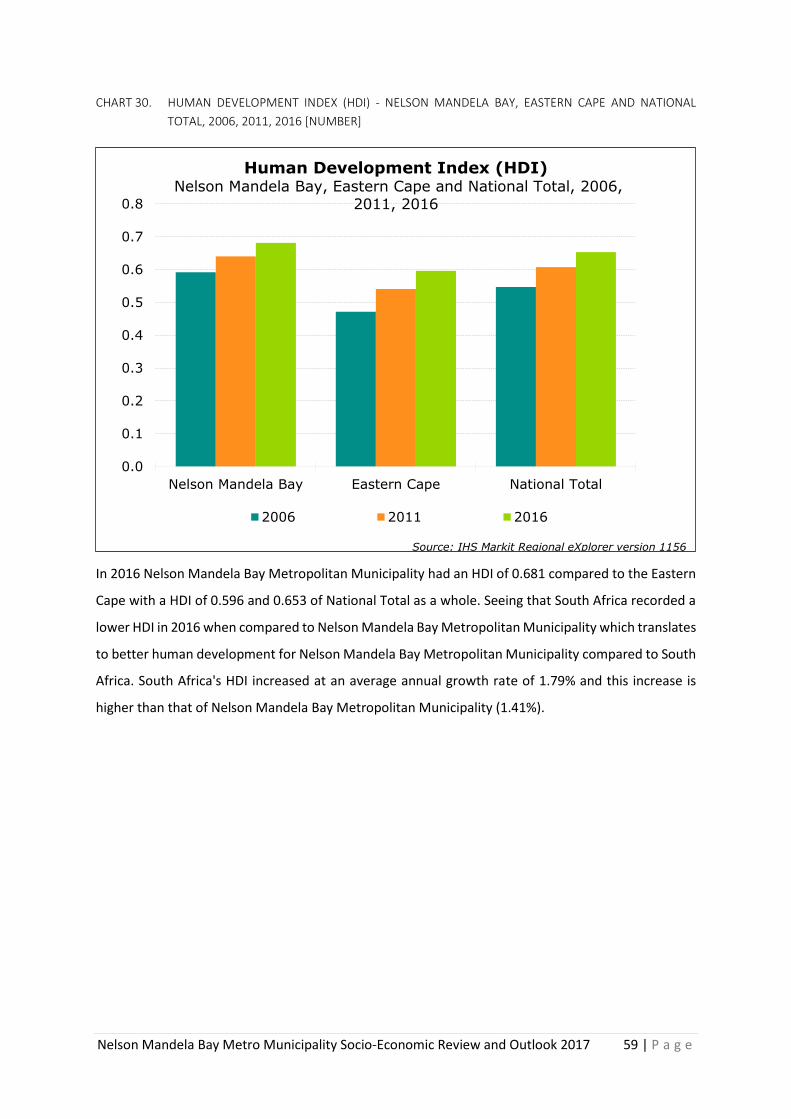
Nelson Mandela Bay Metro Municipality Socio-Economic Review and Outlook 2017 59 | P a g e
CHART 30. HUMAN DEVELOPMENT INDEX (HDI) - NELSON MANDELA BAY, EASTERN CAPE AND NATIONAL
TOTAL, 2006, 2011, 2016 [NUMBER]
In 2016 Nelson Mandela Bay Metropolitan Municipality had an HDI of 0.681 compared to the Eastern
Cape with a HDI of 0.596 and 0.653 of National Total as a whole. Seeing that South Africa recorded a
lower HDI in 2016 when compared to Nelson Mandela Bay Metropolitan Municipality which translates
to better human development for Nelson Mandela Bay Metropolitan Municipality compared to South
Africa. South Africa's HDI increased at an average annual growth rate of 1.79% and this increase is
higher than that of Nelson Mandela Bay Metropolitan Municipality (1.41%).
0.0
0.1
0.2
0.3
0.4
0.5
0.6
0.7
0.8
Nelson Mandela Bay Eastern Cape National Total
Human Development Index (HDI) Nelson Mandela Bay, Eastern Cape and National Total, 2006,
2011, 2016
2006 2011 2016
Source: IHS Markit Regional eXplorer version 1156
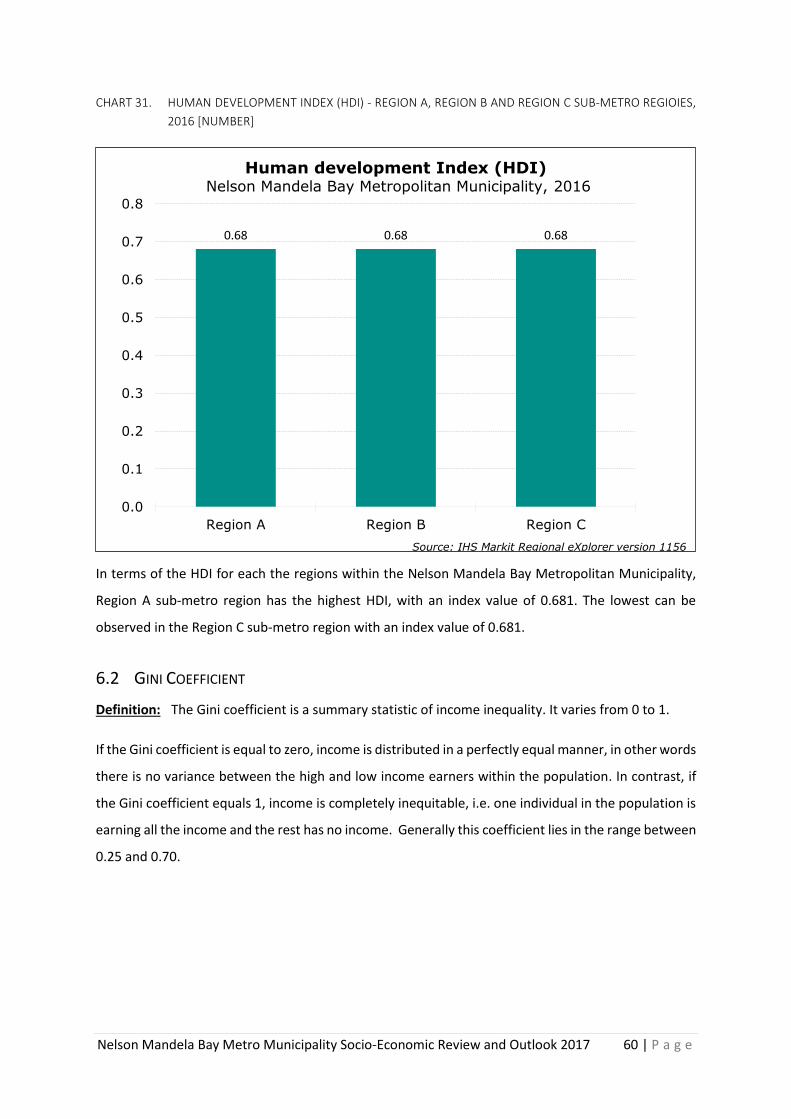
Nelson Mandela Bay Metro Municipality Socio-Economic Review and Outlook 2017 60 | P a g e
CHART 31. HUMAN DEVELOPMENT INDEX (HDI) - REGION A, REGION B AND REGION C SUB-METRO REGIOIES,
2016 [NUMBER]
In terms of the HDI for each the regions within the Nelson Mandela Bay Metropolitan Municipality,
Region A sub-metro region has the highest HDI, with an index value of 0.681. The lowest can be
observed in the Region C sub-metro region with an index value of 0.681.
6.2 GINI COEFFICIENT
Definition: The Gini coefficient is a summary statistic of income inequality. It varies from 0 to 1.
If the Gini coefficient is equal to zero, income is distributed in a perfectly equal manner, in other words
there is no variance between the high and low income earners within the population. In contrast, if
the Gini coefficient equals 1, income is completely inequitable, i.e. one individual in the population is
earning all the income and the rest has no income. Generally this coefficient lies in the range between
0.25 and 0.70.
0.68 0.68 0.68
0.0
0.1
0.2
0.3
0.4
0.5
0.6
0.7
0.8
Region A Region B Region C
Human development Index (HDI) Nelson Mandela Bay Metropolitan Municipality, 2016
Source: IHS Markit Regional eXplorer version 1156
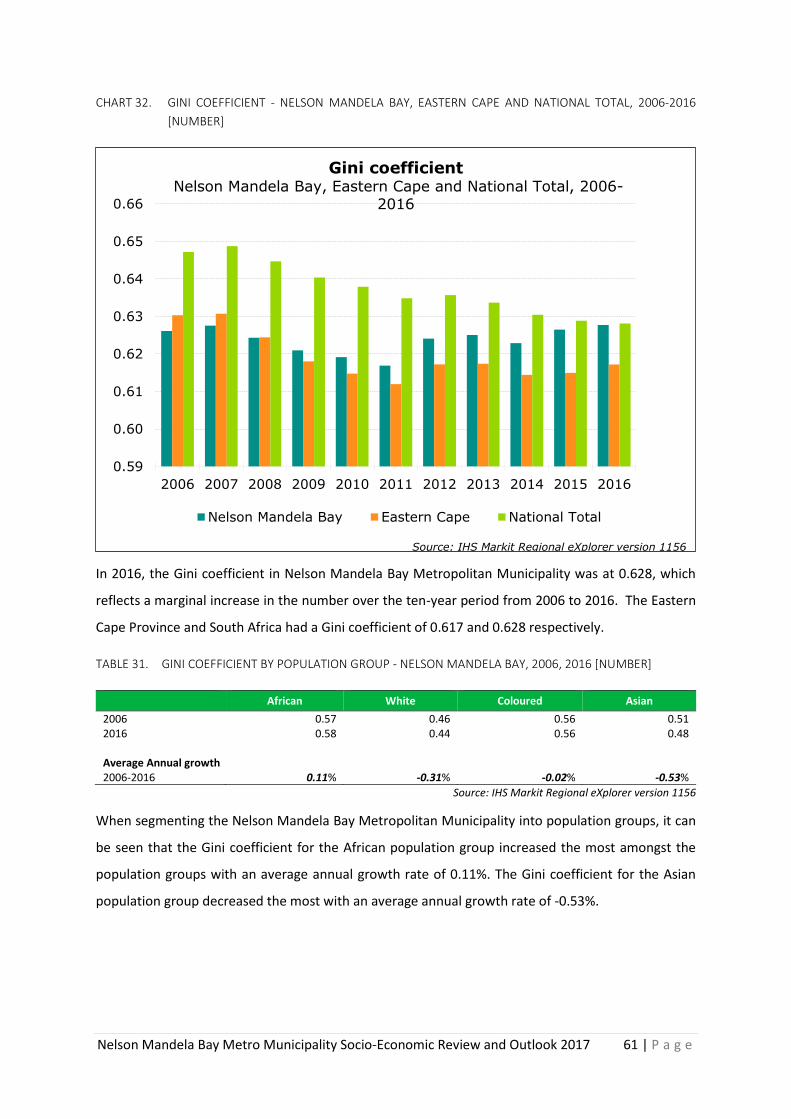
Nelson Mandela Bay Metro Municipality Socio-Economic Review and Outlook 2017 61 | P a g e
CHART 32. GINI COEFFICIENT - NELSON MANDELA BAY, EASTERN CAPE AND NATIONAL TOTAL, 2006-2016
[NUMBER]
In 2016, the Gini coefficient in Nelson Mandela Bay Metropolitan Municipality was at 0.628, which
reflects a marginal increase in the number over the ten-year period from 2006 to 2016. The Eastern
Cape Province and South Africa had a Gini coefficient of 0.617 and 0.628 respectively.
TABLE 31. GINI COEFFICIENT BY POPULATION GROUP - NELSON MANDELA BAY, 2006, 2016 [NUMBER]
African White Coloured Asian
2006 0.57 0.46 0.56 0.51 2016 0.58 0.44 0.56 0.48 Average Annual growth 2006-2016 0.11% -0.31% -0.02% -0.53%
Source: IHS Markit Regional eXplorer version 1156
When segmenting the Nelson Mandela Bay Metropolitan Municipality into population groups, it can
be seen that the Gini coefficient for the African population group increased the most amongst the
population groups with an average annual growth rate of 0.11%. The Gini coefficient for the Asian
population group decreased the most with an average annual growth rate of -0.53%.
0.59
0.60
0.61
0.62
0.63
0.64
0.65
0.66
2006 2007 2008 2009 2010 2011 2012 2013 2014 2015 2016
Gini coefficient Nelson Mandela Bay, Eastern Cape and National Total, 2006-
2016
Nelson Mandela Bay Eastern Cape National Total
Source: IHS Markit Regional eXplorer version 1156
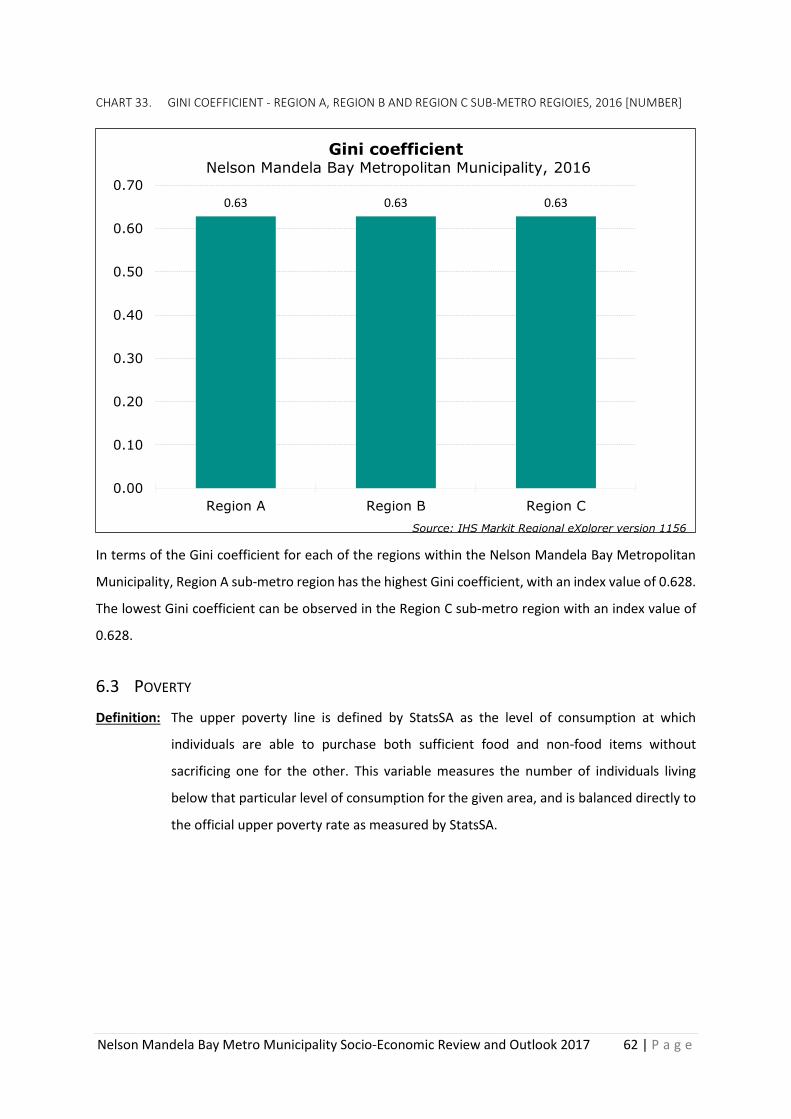
Nelson Mandela Bay Metro Municipality Socio-Economic Review and Outlook 2017 62 | P a g e
CHART 33. GINI COEFFICIENT - REGION A, REGION B AND REGION C SUB-METRO REGIOIES, 2016 [NUMBER]
In terms of the Gini coefficient for each of the regions within the Nelson Mandela Bay Metropolitan
Municipality, Region A sub-metro region has the highest Gini coefficient, with an index value of 0.628.
The lowest Gini coefficient can be observed in the Region C sub-metro region with an index value of
0.628.
6.3 POVERTY
Definition: The upper poverty line is defined by StatsSA as the level of consumption at which
individuals are able to purchase both sufficient food and non-food items without
sacrificing one for the other. This variable measures the number of individuals living
below that particular level of consumption for the given area, and is balanced directly to
the official upper poverty rate as measured by StatsSA.
0.63 0.63 0.63
0.00
0.10
0.20
0.30
0.40
0.50
0.60
0.70
Region A Region B Region C
Gini coefficient Nelson Mandela Bay Metropolitan Municipality, 2016
Source: IHS Markit Regional eXplorer version 1156
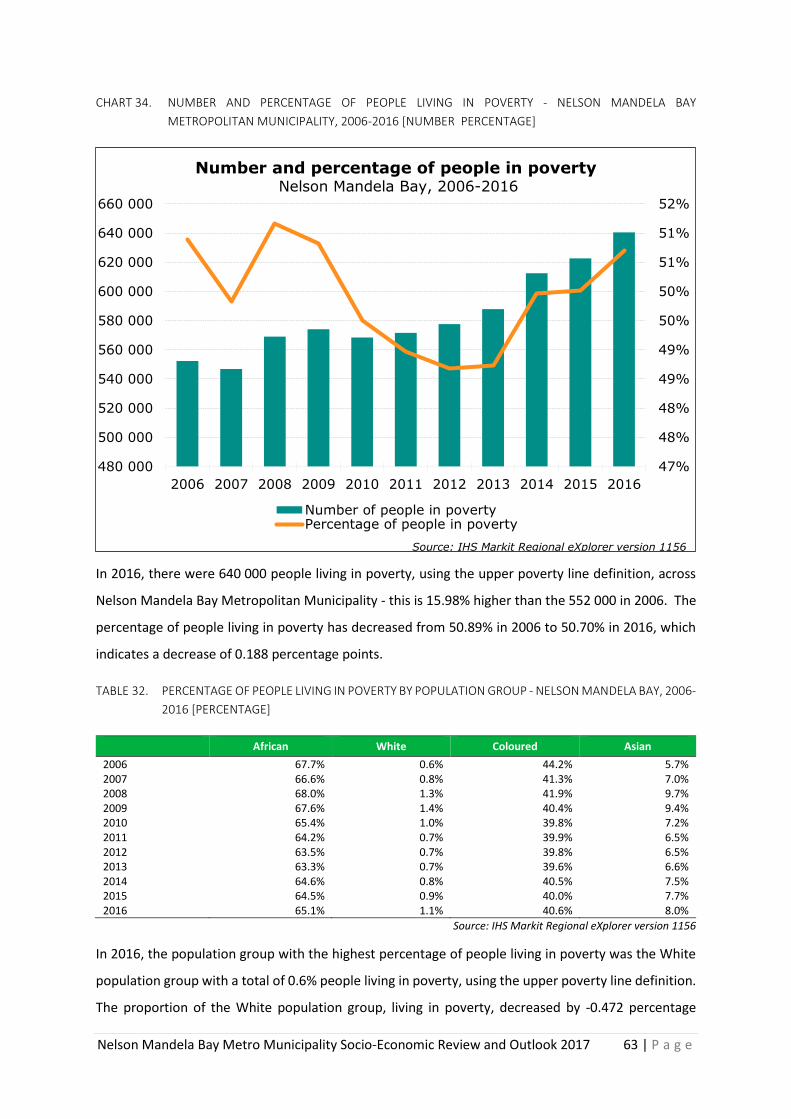
Nelson Mandela Bay Metro Municipality Socio-Economic Review and Outlook 2017 63 | P a g e
CHART 34. NUMBER AND PERCENTAGE OF PEOPLE LIVING IN POVERTY - NELSON MANDELA BAY
METROPOLITAN MUNICIPALITY, 2006-2016 [NUMBER PERCENTAGE]
In 2016, there were 640 000 people living in poverty, using the upper poverty line definition, across
Nelson Mandela Bay Metropolitan Municipality - this is 15.98% higher than the 552 000 in 2006. The
percentage of people living in poverty has decreased from 50.89% in 2006 to 50.70% in 2016, which
indicates a decrease of 0.188 percentage points.
TABLE 32. PERCENTAGE OF PEOPLE LIVING IN POVERTY BY POPULATION GROUP - NELSON MANDELA BAY, 2006-
2016 [PERCENTAGE]
African White Coloured Asian
2006 67.7% 0.6% 44.2% 5.7% 2007 66.6% 0.8% 41.3% 7.0% 2008 68.0% 1.3% 41.9% 9.7% 2009 67.6% 1.4% 40.4% 9.4% 2010 65.4% 1.0% 39.8% 7.2% 2011 64.2% 0.7% 39.9% 6.5% 2012 63.5% 0.7% 39.8% 6.5% 2013 63.3% 0.7% 39.6% 6.6% 2014 64.6% 0.8% 40.5% 7.5% 2015 64.5% 0.9% 40.0% 7.7% 2016 65.1% 1.1% 40.6% 8.0%
Source: IHS Markit Regional eXplorer version 1156
In 2016, the population group with the highest percentage of people living in poverty was the White
population group with a total of 0.6% people living in poverty, using the upper poverty line definition.
The proportion of the White population group, living in poverty, decreased by -0.472 percentage
47%
48%
48%
49%
49%
50%
50%
51%
51%
52%
480 000
500 000
520 000
540 000
560 000
580 000
600 000
620 000
640 000
660 000
2006 2007 2008 2009 2010 2011 2012 2013 2014 2015 2016
Number and percentage of people in poverty Nelson Mandela Bay, 2006-2016
Number of people in povertyPercentage of people in poverty
Source: IHS Markit Regional eXplorer version 1156
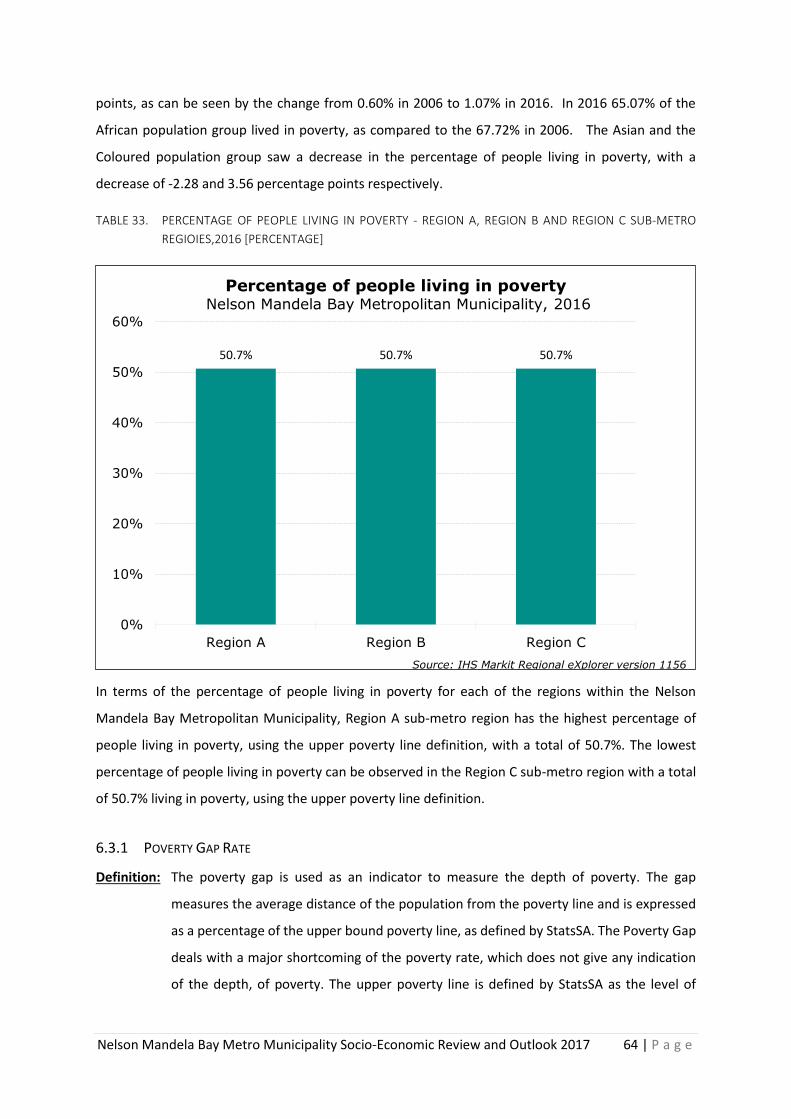
Nelson Mandela Bay Metro Municipality Socio-Economic Review and Outlook 2017 64 | P a g e
points, as can be seen by the change from 0.60% in 2006 to 1.07% in 2016. In 2016 65.07% of the
African population group lived in poverty, as compared to the 67.72% in 2006. The Asian and the
Coloured population group saw a decrease in the percentage of people living in poverty, with a
decrease of -2.28 and 3.56 percentage points respectively.
TABLE 33. PERCENTAGE OF PEOPLE LIVING IN POVERTY - REGION A, REGION B AND REGION C SUB-METRO
REGIOIES,2016 [PERCENTAGE]
In terms of the percentage of people living in poverty for each of the regions within the Nelson
Mandela Bay Metropolitan Municipality, Region A sub-metro region has the highest percentage of
people living in poverty, using the upper poverty line definition, with a total of 50.7%. The lowest
percentage of people living in poverty can be observed in the Region C sub-metro region with a total
of 50.7% living in poverty, using the upper poverty line definition.
6.3.1 POVERTY GAP RATE
Definition: The poverty gap is used as an indicator to measure the depth of poverty. The gap
measures the average distance of the population from the poverty line and is expressed
as a percentage of the upper bound poverty line, as defined by StatsSA. The Poverty Gap
deals with a major shortcoming of the poverty rate, which does not give any indication
of the depth, of poverty. The upper poverty line is defined by StatsSA as the level of
50.7% 50.7% 50.7%
0%
10%
20%
30%
40%
50%
60%
Region A Region B Region C
Percentage of people living in poverty Nelson Mandela Bay Metropolitan Municipality, 2016
Source: IHS Markit Regional eXplorer version 1156
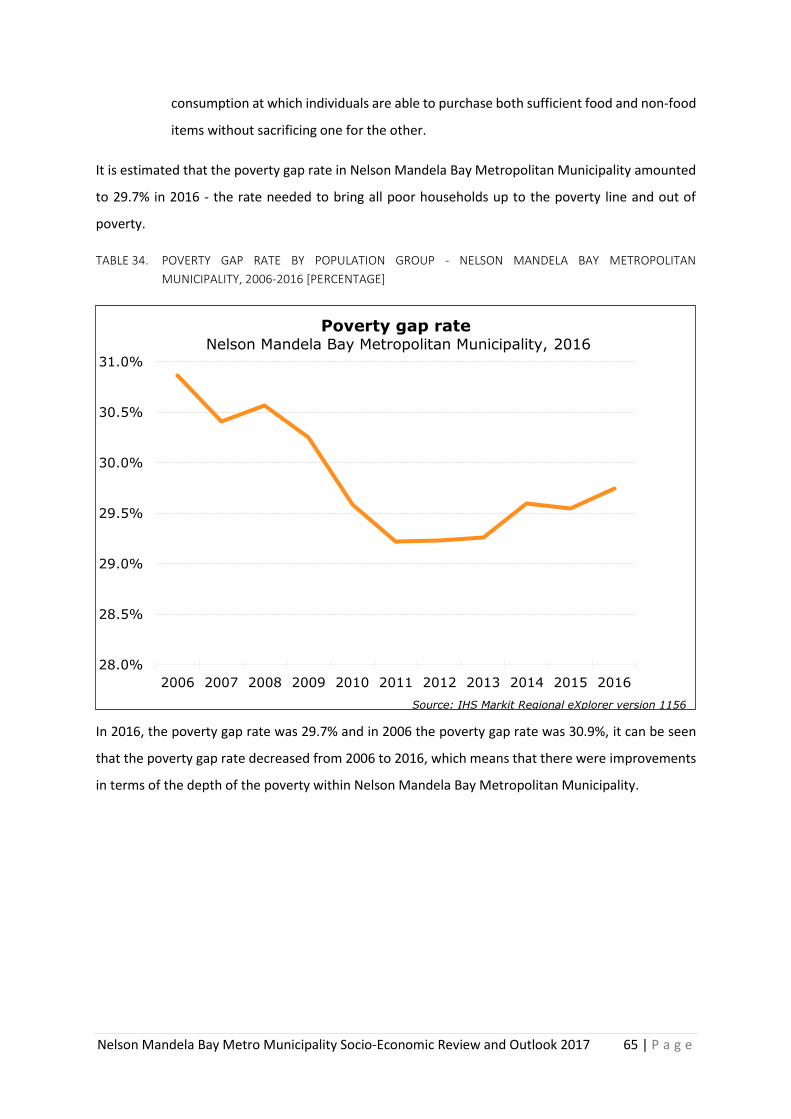
Nelson Mandela Bay Metro Municipality Socio-Economic Review and Outlook 2017 65 | P a g e
consumption at which individuals are able to purchase both sufficient food and non-food
items without sacrificing one for the other.
It is estimated that the poverty gap rate in Nelson Mandela Bay Metropolitan Municipality amounted
to 29.7% in 2016 - the rate needed to bring all poor households up to the poverty line and out of
poverty.
TABLE 34. POVERTY GAP RATE BY POPULATION GROUP - NELSON MANDELA BAY METROPOLITAN
MUNICIPALITY, 2006-2016 [PERCENTAGE]
In 2016, the poverty gap rate was 29.7% and in 2006 the poverty gap rate was 30.9%, it can be seen
that the poverty gap rate decreased from 2006 to 2016, which means that there were improvements
in terms of the depth of the poverty within Nelson Mandela Bay Metropolitan Municipality.
28.0%
28.5%
29.0%
29.5%
30.0%
30.5%
31.0%
2006 2007 2008 2009 2010 2011 2012 2013 2014 2015 2016
Poverty gap rate Nelson Mandela Bay Metropolitan Municipality, 2016
Source: IHS Markit Regional eXplorer version 1156
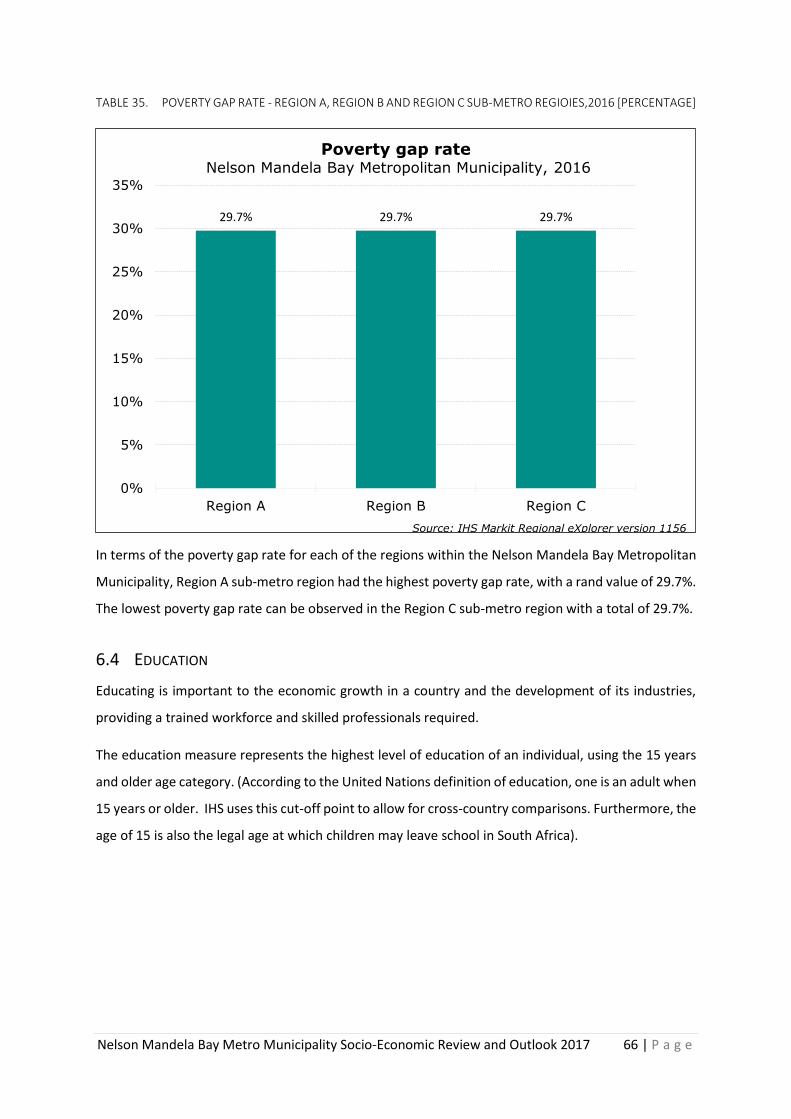
Nelson Mandela Bay Metro Municipality Socio-Economic Review and Outlook 2017 66 | P a g e
TABLE 35. POVERTY GAP RATE - REGION A, REGION B AND REGION C SUB-METRO REGIOIES,2016 [PERCENTAGE]
In terms of the poverty gap rate for each of the regions within the Nelson Mandela Bay Metropolitan
Municipality, Region A sub-metro region had the highest poverty gap rate, with a rand value of 29.7%.
The lowest poverty gap rate can be observed in the Region C sub-metro region with a total of 29.7%.
6.4 EDUCATION
Educating is important to the economic growth in a country and the development of its industries,
providing a trained workforce and skilled professionals required.
The education measure represents the highest level of education of an individual, using the 15 years
and older age category. (According to the United Nations definition of education, one is an adult when
15 years or older. IHS uses this cut-off point to allow for cross-country comparisons. Furthermore, the
age of 15 is also the legal age at which children may leave school in South Africa).
29.7% 29.7% 29.7%
0%
5%
10%
15%
20%
25%
30%
35%
Region A Region B Region C
Poverty gap rate Nelson Mandela Bay Metropolitan Municipality, 2016
Source: IHS Markit Regional eXplorer version 1156
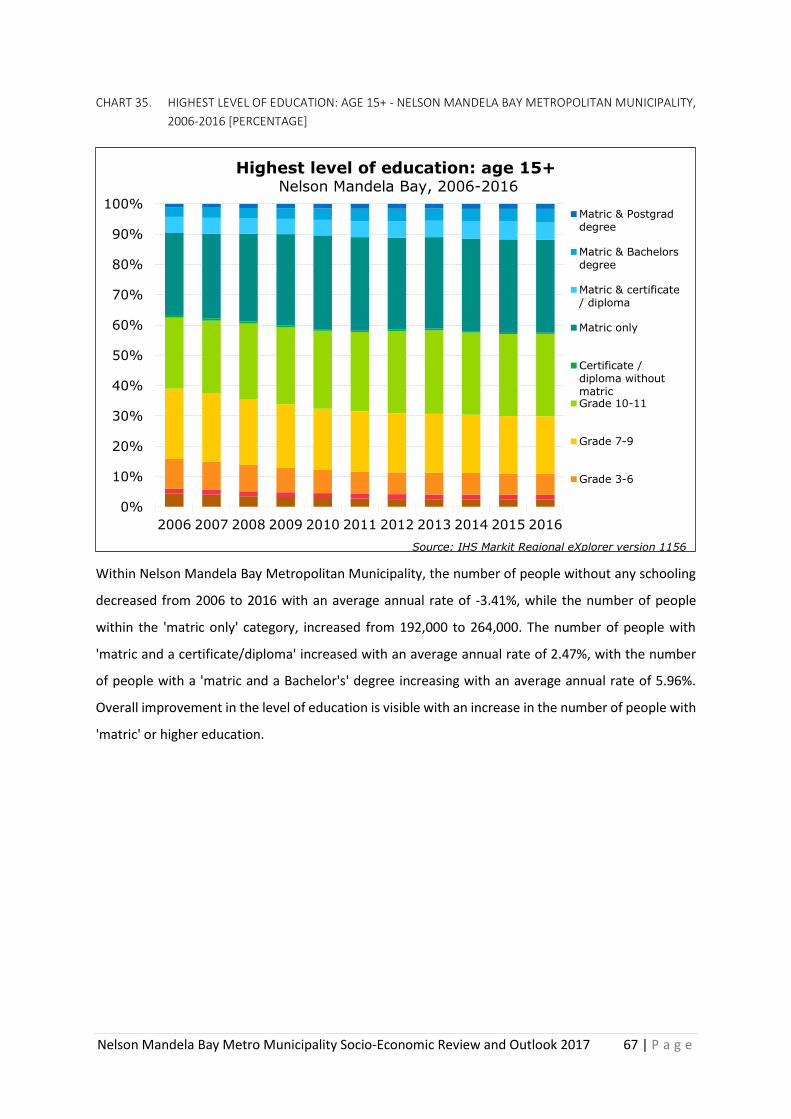
Nelson Mandela Bay Metro Municipality Socio-Economic Review and Outlook 2017 67 | P a g e
CHART 35. HIGHEST LEVEL OF EDUCATION: AGE 15+ - NELSON MANDELA BAY METROPOLITAN MUNICIPALITY,
2006-2016 [PERCENTAGE]
Within Nelson Mandela Bay Metropolitan Municipality, the number of people without any schooling
decreased from 2006 to 2016 with an average annual rate of -3.41%, while the number of people
within the 'matric only' category, increased from 192,000 to 264,000. The number of people with
'matric and a certificate/diploma' increased with an average annual rate of 2.47%, with the number
of people with a 'matric and a Bachelor's' degree increasing with an average annual rate of 5.96%.
Overall improvement in the level of education is visible with an increase in the number of people with
'matric' or higher education.
0%
10%
20%
30%
40%
50%
60%
70%
80%
90%
100%
2006 2007 2008 2009 2010 2011 2012 2013 2014 2015 2016
Highest level of education: age 15+ Nelson Mandela Bay, 2006-2016
Matric & Postgraddegree
Matric & Bachelorsdegree
Matric & certificate/ diploma
Matric only
Certificate /diploma withoutmatricGrade 10-11
Grade 7-9
Grade 3-6
Source: IHS Markit Regional eXplorer version 1156
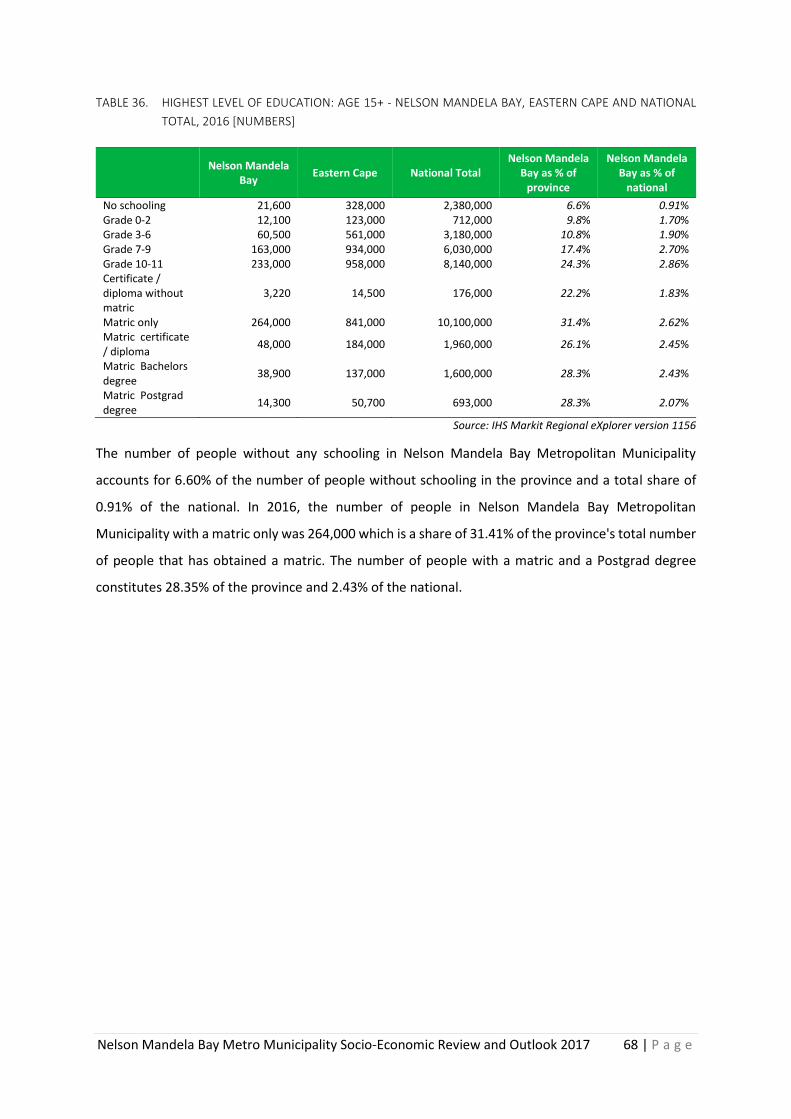
Nelson Mandela Bay Metro Municipality Socio-Economic Review and Outlook 2017 68 | P a g e
TABLE 36. HIGHEST LEVEL OF EDUCATION: AGE 15+ - NELSON MANDELA BAY, EASTERN CAPE AND NATIONAL
TOTAL, 2016 [NUMBERS]
Nelson Mandela
Bay Eastern Cape National Total
Nelson Mandela Bay as % of
province
Nelson Mandela Bay as % of
national
No schooling 21,600 328,000 2,380,000 6.6% 0.91% Grade 0-2 12,100 123,000 712,000 9.8% 1.70% Grade 3-6 60,500 561,000 3,180,000 10.8% 1.90% Grade 7-9 163,000 934,000 6,030,000 17.4% 2.70% Grade 10-11 233,000 958,000 8,140,000 24.3% 2.86% Certificate / diploma without matric
3,220 14,500 176,000 22.2% 1.83%
Matric only 264,000 841,000 10,100,000 31.4% 2.62% Matric certificate / diploma
48,000 184,000 1,960,000 26.1% 2.45%
Matric Bachelors degree
38,900 137,000 1,600,000 28.3% 2.43%
Matric Postgrad degree
14,300 50,700 693,000 28.3% 2.07%
Source: IHS Markit Regional eXplorer version 1156
The number of people without any schooling in Nelson Mandela Bay Metropolitan Municipality
accounts for 6.60% of the number of people without schooling in the province and a total share of
0.91% of the national. In 2016, the number of people in Nelson Mandela Bay Metropolitan
Municipality with a matric only was 264,000 which is a share of 31.41% of the province's total number
of people that has obtained a matric. The number of people with a matric and a Postgrad degree
constitutes 28.35% of the province and 2.43% of the national.
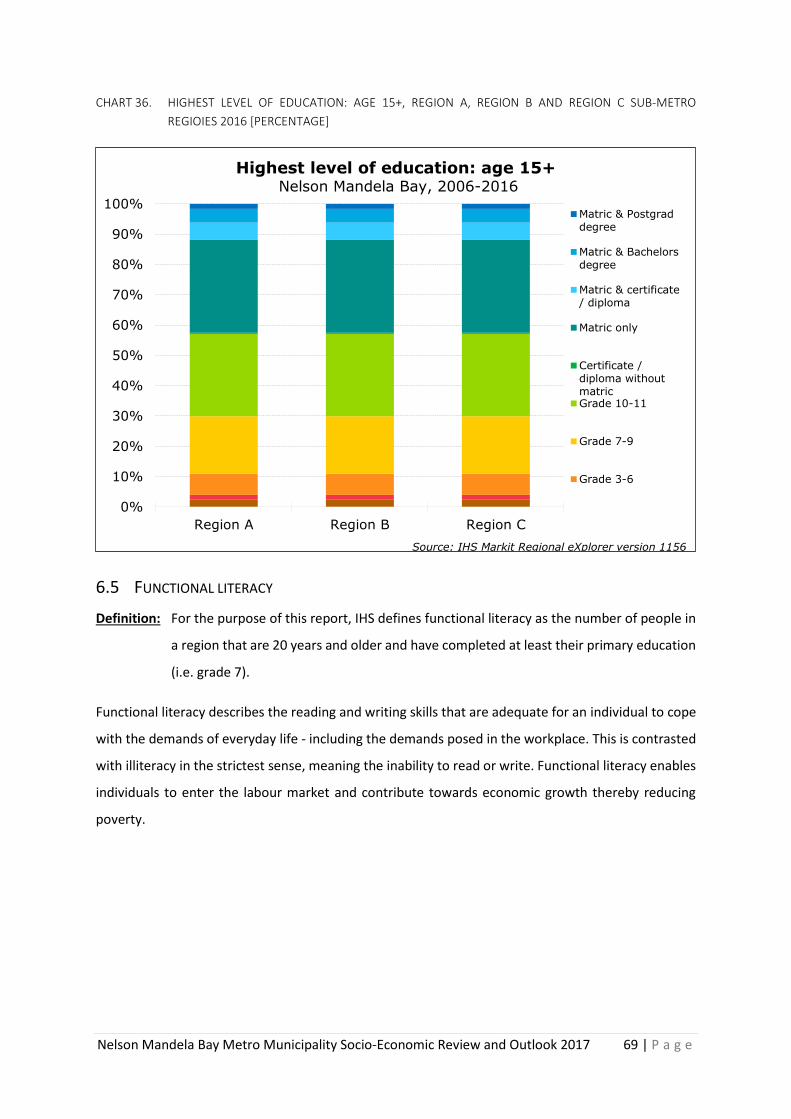
Nelson Mandela Bay Metro Municipality Socio-Economic Review and Outlook 2017 69 | P a g e
CHART 36. HIGHEST LEVEL OF EDUCATION: AGE 15+, REGION A, REGION B AND REGION C SUB-METRO
REGIOIES 2016 [PERCENTAGE]
6.5 FUNCTIONAL LITERACY
Definition: For the purpose of this report, IHS defines functional literacy as the number of people in
a region that are 20 years and older and have completed at least their primary education
(i.e. grade 7).
Functional literacy describes the reading and writing skills that are adequate for an individual to cope
with the demands of everyday life - including the demands posed in the workplace. This is contrasted
with illiteracy in the strictest sense, meaning the inability to read or write. Functional literacy enables
individuals to enter the labour market and contribute towards economic growth thereby reducing
poverty.
0%
10%
20%
30%
40%
50%
60%
70%
80%
90%
100%
Region A Region B Region C
Highest level of education: age 15+ Nelson Mandela Bay, 2006-2016
Matric & Postgraddegree
Matric & Bachelorsdegree
Matric & certificate/ diploma
Matric only
Certificate /diploma withoutmatricGrade 10-11
Grade 7-9
Grade 3-6
Source: IHS Markit Regional eXplorer version 1156
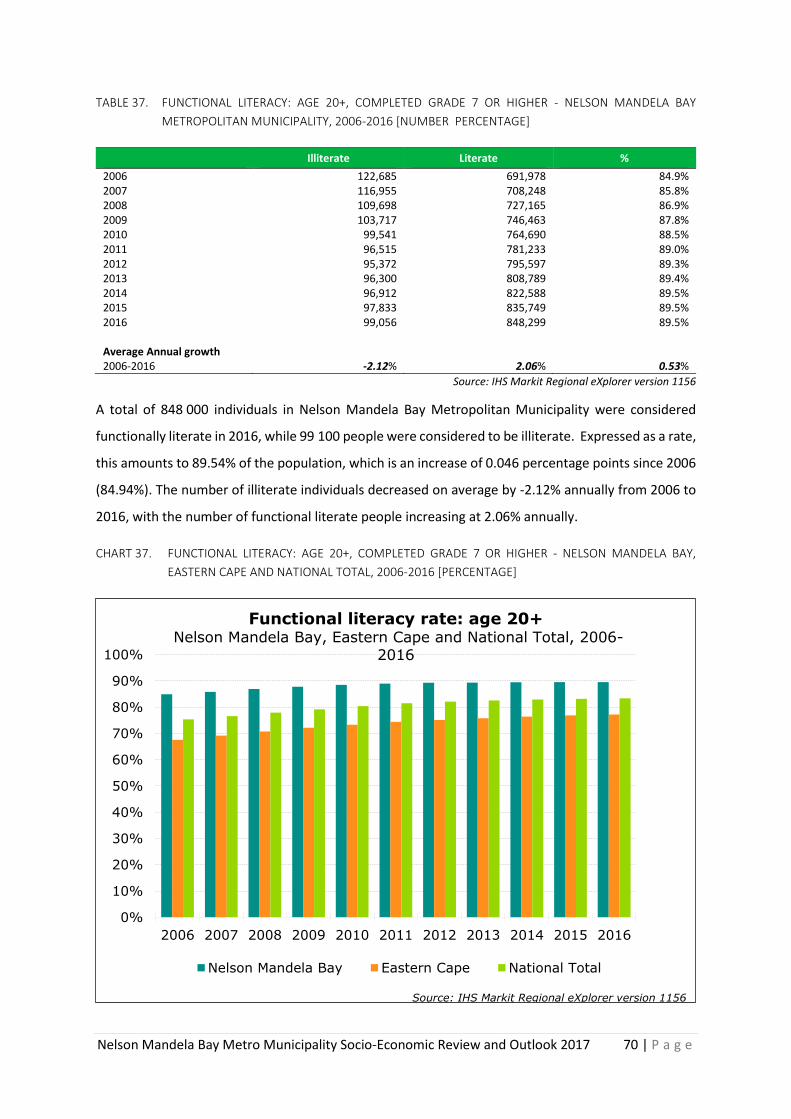
Nelson Mandela Bay Metro Municipality Socio-Economic Review and Outlook 2017 70 | P a g e
TABLE 37. FUNCTIONAL LITERACY: AGE 20+, COMPLETED GRADE 7 OR HIGHER - NELSON MANDELA BAY
METROPOLITAN MUNICIPALITY, 2006-2016 [NUMBER PERCENTAGE]
Illiterate Literate %
2006 122,685 691,978 84.9% 2007 116,955 708,248 85.8% 2008 109,698 727,165 86.9% 2009 103,717 746,463 87.8% 2010 99,541 764,690 88.5% 2011 96,515 781,233 89.0% 2012 95,372 795,597 89.3% 2013 96,300 808,789 89.4% 2014 96,912 822,588 89.5% 2015 97,833 835,749 89.5% 2016 99,056 848,299 89.5% Average Annual growth 2006-2016 -2.12% 2.06% 0.53%
Source: IHS Markit Regional eXplorer version 1156
A total of 848 000 individuals in Nelson Mandela Bay Metropolitan Municipality were considered
functionally literate in 2016, while 99 100 people were considered to be illiterate. Expressed as a rate,
this amounts to 89.54% of the population, which is an increase of 0.046 percentage points since 2006
(84.94%). The number of illiterate individuals decreased on average by -2.12% annually from 2006 to
2016, with the number of functional literate people increasing at 2.06% annually.
CHART 37. FUNCTIONAL LITERACY: AGE 20+, COMPLETED GRADE 7 OR HIGHER - NELSON MANDELA BAY,
EASTERN CAPE AND NATIONAL TOTAL, 2006-2016 [PERCENTAGE]
0%
10%
20%
30%
40%
50%
60%
70%
80%
90%
100%
2006 2007 2008 2009 2010 2011 2012 2013 2014 2015 2016
Functional literacy rate: age 20+ Nelson Mandela Bay, Eastern Cape and National Total, 2006-
2016
Nelson Mandela Bay Eastern Cape National Total
Source: IHS Markit Regional eXplorer version 1156
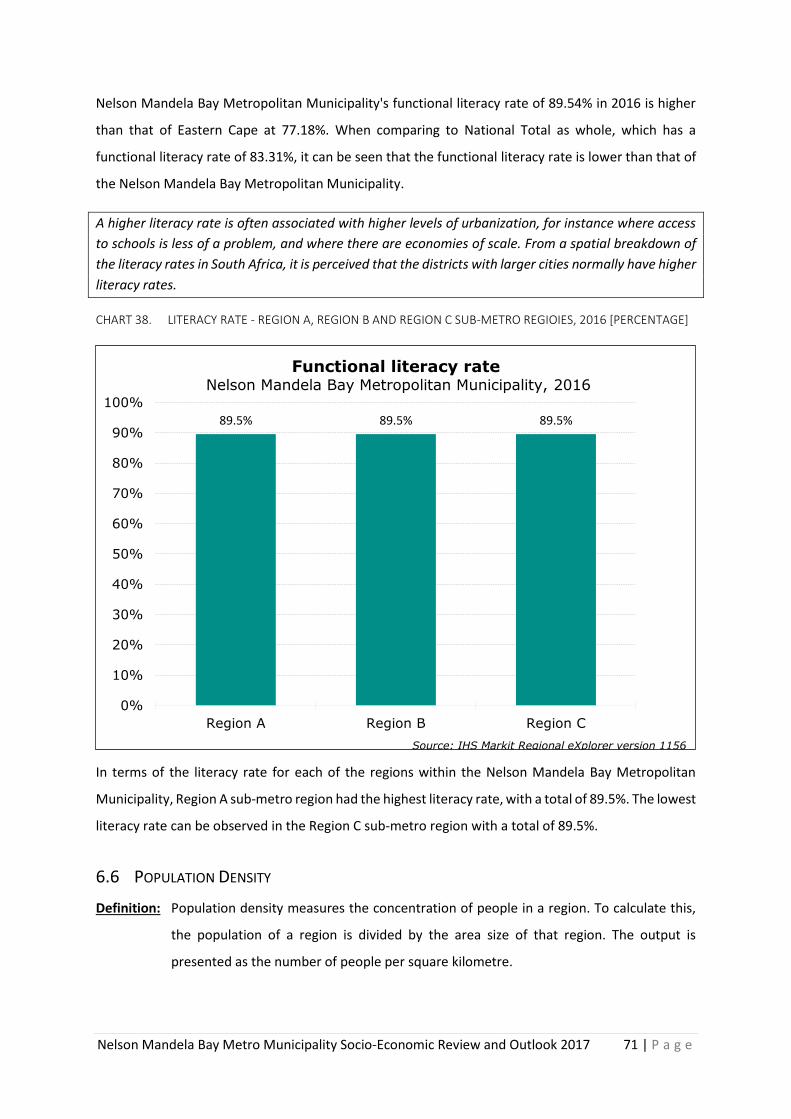
Nelson Mandela Bay Metro Municipality Socio-Economic Review and Outlook 2017 71 | P a g e
Nelson Mandela Bay Metropolitan Municipality's functional literacy rate of 89.54% in 2016 is higher
than that of Eastern Cape at 77.18%. When comparing to National Total as whole, which has a
functional literacy rate of 83.31%, it can be seen that the functional literacy rate is lower than that of
the Nelson Mandela Bay Metropolitan Municipality.
A higher literacy rate is often associated with higher levels of urbanization, for instance where access
to schools is less of a problem, and where there are economies of scale. From a spatial breakdown of
the literacy rates in South Africa, it is perceived that the districts with larger cities normally have higher
literacy rates.
CHART 38. LITERACY RATE - REGION A, REGION B AND REGION C SUB-METRO REGIOIES, 2016 [PERCENTAGE]
In terms of the literacy rate for each of the regions within the Nelson Mandela Bay Metropolitan
Municipality, Region A sub-metro region had the highest literacy rate, with a total of 89.5%. The lowest
literacy rate can be observed in the Region C sub-metro region with a total of 89.5%.
6.6 POPULATION DENSITY
Definition: Population density measures the concentration of people in a region. To calculate this,
the population of a region is divided by the area size of that region. The output is
presented as the number of people per square kilometre.
89.5% 89.5% 89.5%
0%
10%
20%
30%
40%
50%
60%
70%
80%
90%
100%
Region A Region B Region C
Functional literacy rate Nelson Mandela Bay Metropolitan Municipality, 2016
Source: IHS Markit Regional eXplorer version 1156
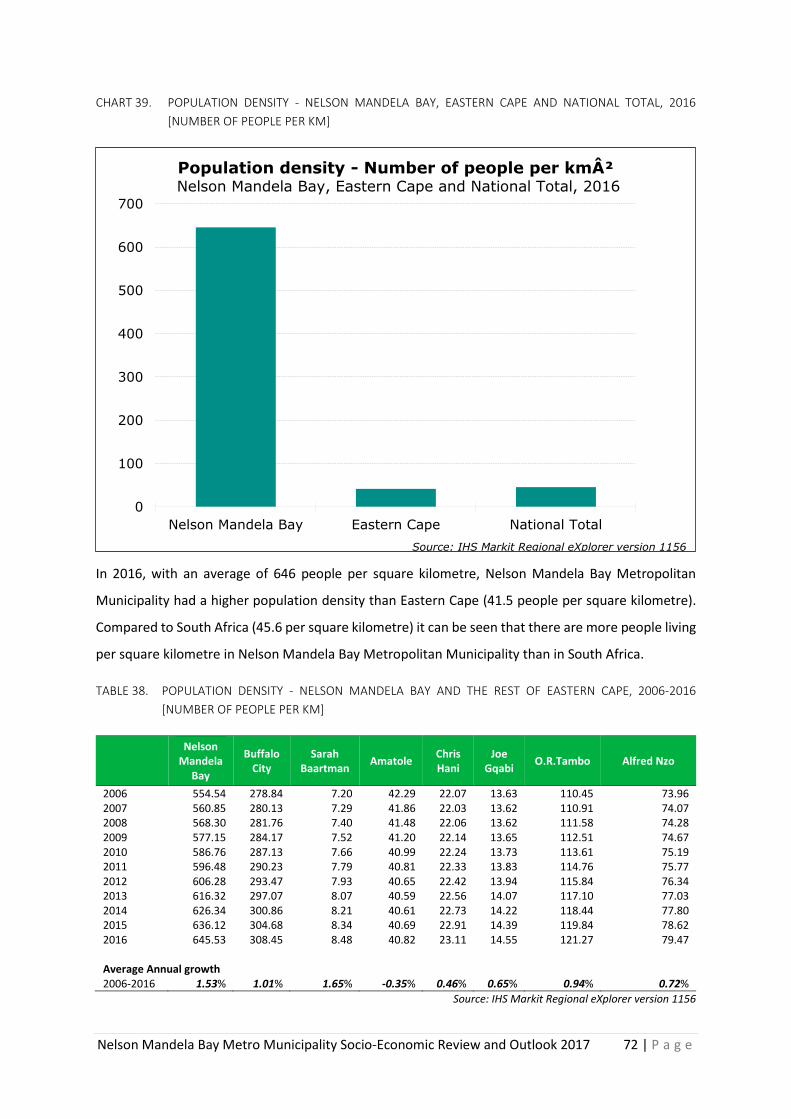
Nelson Mandela Bay Metro Municipality Socio-Economic Review and Outlook 2017 72 | P a g e
CHART 39. POPULATION DENSITY - NELSON MANDELA BAY, EASTERN CAPE AND NATIONAL TOTAL, 2016
[NUMBER OF PEOPLE PER KM]
In 2016, with an average of 646 people per square kilometre, Nelson Mandela Bay Metropolitan
Municipality had a higher population density than Eastern Cape (41.5 people per square kilometre).
Compared to South Africa (45.6 per square kilometre) it can be seen that there are more people living
per square kilometre in Nelson Mandela Bay Metropolitan Municipality than in South Africa.
TABLE 38. POPULATION DENSITY - NELSON MANDELA BAY AND THE REST OF EASTERN CAPE, 2006-2016
[NUMBER OF PEOPLE PER KM]
Nelson
Mandela Bay
Buffalo City
Sarah Baartman
Amatole Chris Hani
Joe Gqabi
O.R.Tambo Alfred Nzo
2006 554.54 278.84 7.20 42.29 22.07 13.63 110.45 73.96 2007 560.85 280.13 7.29 41.86 22.03 13.62 110.91 74.07 2008 568.30 281.76 7.40 41.48 22.06 13.62 111.58 74.28 2009 577.15 284.17 7.52 41.20 22.14 13.65 112.51 74.67 2010 586.76 287.13 7.66 40.99 22.24 13.73 113.61 75.19 2011 596.48 290.23 7.79 40.81 22.33 13.83 114.76 75.77 2012 606.28 293.47 7.93 40.65 22.42 13.94 115.84 76.34 2013 616.32 297.07 8.07 40.59 22.56 14.07 117.10 77.03 2014 626.34 300.86 8.21 40.61 22.73 14.22 118.44 77.80 2015 636.12 304.68 8.34 40.69 22.91 14.39 119.84 78.62 2016 645.53 308.45 8.48 40.82 23.11 14.55 121.27 79.47 Average Annual growth 2006-2016 1.53% 1.01% 1.65% -0.35% 0.46% 0.65% 0.94% 0.72%
Source: IHS Markit Regional eXplorer version 1156
0
100
200
300
400
500
600
700
Nelson Mandela Bay Eastern Cape National Total
Population density - Number of people per km² Nelson Mandela Bay, Eastern Cape and National Total, 2016
Source: IHS Markit Regional eXplorer version 1156
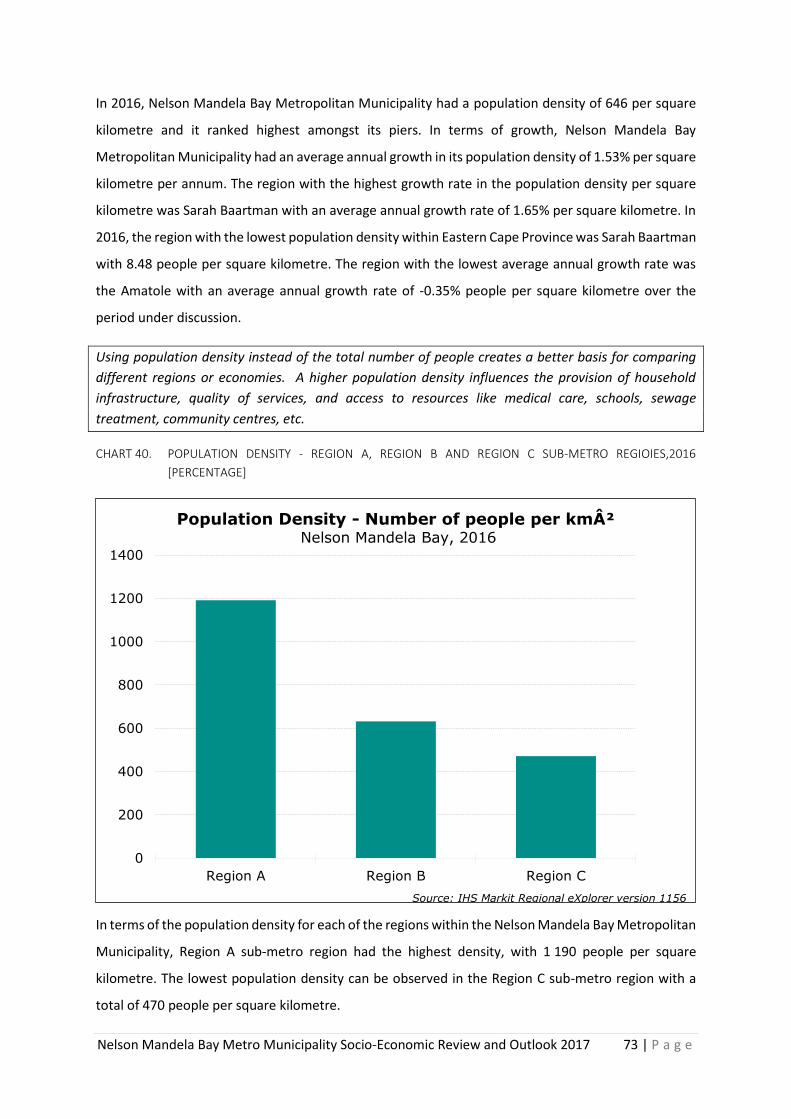
Nelson Mandela Bay Metro Municipality Socio-Economic Review and Outlook 2017 73 | P a g e
In 2016, Nelson Mandela Bay Metropolitan Municipality had a population density of 646 per square
kilometre and it ranked highest amongst its piers. In terms of growth, Nelson Mandela Bay
Metropolitan Municipality had an average annual growth in its population density of 1.53% per square
kilometre per annum. The region with the highest growth rate in the population density per square
kilometre was Sarah Baartman with an average annual growth rate of 1.65% per square kilometre. In
2016, the region with the lowest population density within Eastern Cape Province was Sarah Baartman
with 8.48 people per square kilometre. The region with the lowest average annual growth rate was
the Amatole with an average annual growth rate of -0.35% people per square kilometre over the
period under discussion.
Using population density instead of the total number of people creates a better basis for comparing
different regions or economies. A higher population density influences the provision of household
infrastructure, quality of services, and access to resources like medical care, schools, sewage
treatment, community centres, etc.
CHART 40. POPULATION DENSITY - REGION A, REGION B AND REGION C SUB-METRO REGIOIES,2016
[PERCENTAGE]
In terms of the population density for each of the regions within the Nelson Mandela Bay Metropolitan
Municipality, Region A sub-metro region had the highest density, with 1 190 people per square
kilometre. The lowest population density can be observed in the Region C sub-metro region with a
total of 470 people per square kilometre.
0
200
400
600
800
1000
1200
1400
Region A Region B Region C
Population Density - Number of people per km² Nelson Mandela Bay, 2016
Source: IHS Markit Regional eXplorer version 1156
Nelson Mandela Bay Metro Municipality Socio-Economic Review and Outlook 2017 74 | P a g e
7. CRIME
The state of crime in South Africa has been the topic of many media articles and papers in the past
years, and although many would acknowledge that the country has a crime problem, very little
research has been done on the relative level of crime. The media often tend to focus on more negative
or sensational information, while the progress made in combating crime is neglected.
7.1 IHS COMPOSITE CRIME INDEX
The IHS Composite Crime Index makes use of the official SAPS data, which is reported in 27 crime
categories (ranging from murder to crime injuries). These 27 categories are divided into two groups
according to the nature of the crime: i.e. violent crimes and property crimes. IHS uses the (a) Length-
of-sentence and the (b) Cost-of-crime in order to apply a weight to each category.
7.1.1 OVERALL CRIME INDEX
Definition: The crime index is a composite, weighted index which measures crime. The higher the
index number, the higher the level of crime for that specific year in a particular region.
The index is best used by looking at the change over time, or comparing the crime levels
across regions.
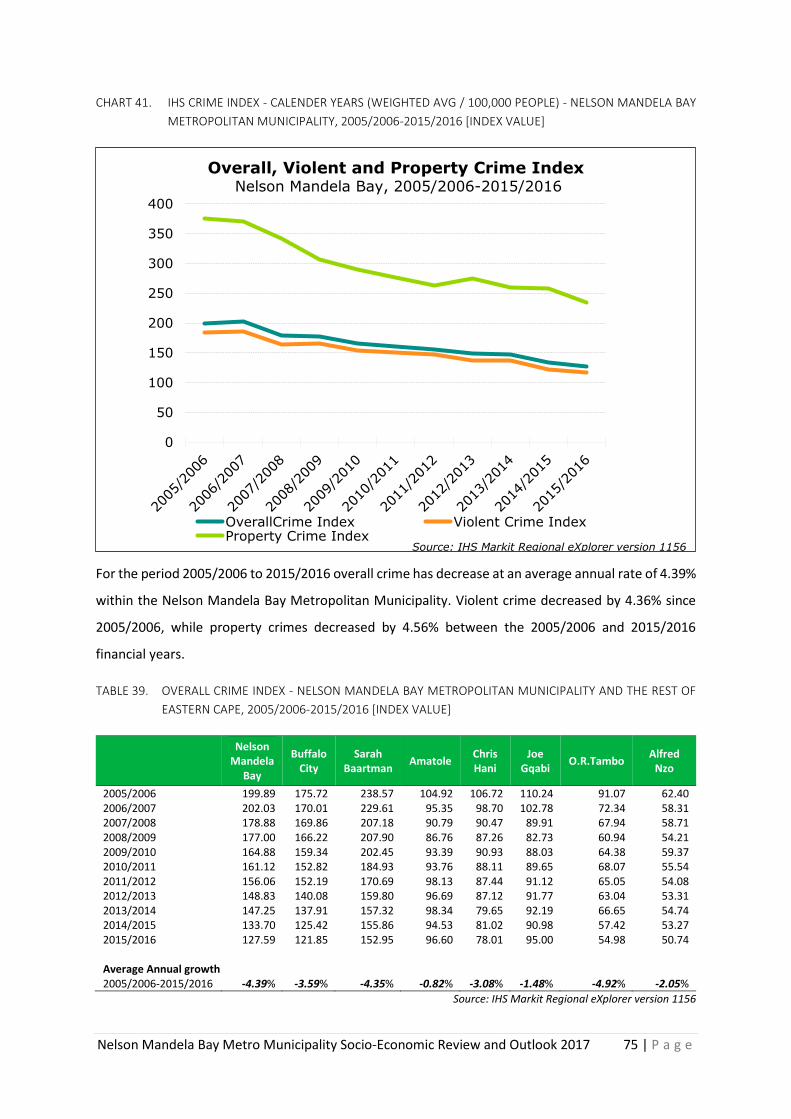
Nelson Mandela Bay Metro Municipality Socio-Economic Review and Outlook 2017 75 | P a g e
CHART 41. IHS CRIME INDEX - CALENDER YEARS (WEIGHTED AVG / 100,000 PEOPLE) - NELSON MANDELA BAY
METROPOLITAN MUNICIPALITY, 2005/2006-2015/2016 [INDEX VALUE]
For the period 2005/2006 to 2015/2016 overall crime has decrease at an average annual rate of 4.39%
within the Nelson Mandela Bay Metropolitan Municipality. Violent crime decreased by 4.36% since
2005/2006, while property crimes decreased by 4.56% between the 2005/2006 and 2015/2016
financial years.
TABLE 39. OVERALL CRIME INDEX - NELSON MANDELA BAY METROPOLITAN MUNICIPALITY AND THE REST OF
EASTERN CAPE, 2005/2006-2015/2016 [INDEX VALUE]
Nelson
Mandela Bay
Buffalo City
Sarah Baartman
Amatole Chris Hani
Joe Gqabi
O.R.Tambo Alfred
Nzo
2005/2006 199.89 175.72 238.57 104.92 106.72 110.24 91.07 62.40 2006/2007 202.03 170.01 229.61 95.35 98.70 102.78 72.34 58.31 2007/2008 178.88 169.86 207.18 90.79 90.47 89.91 67.94 58.71 2008/2009 177.00 166.22 207.90 86.76 87.26 82.73 60.94 54.21 2009/2010 164.88 159.34 202.45 93.39 90.93 88.03 64.38 59.37 2010/2011 161.12 152.82 184.93 93.76 88.11 89.65 68.07 55.54 2011/2012 156.06 152.19 170.69 98.13 87.44 91.12 65.05 54.08 2012/2013 148.83 140.08 159.80 96.69 87.12 91.77 63.04 53.31 2013/2014 147.25 137.91 157.32 98.34 79.65 92.19 66.65 54.74 2014/2015 133.70 125.42 155.86 94.53 81.02 90.98 57.42 53.27 2015/2016 127.59 121.85 152.95 96.60 78.01 95.00 54.98 50.74 Average Annual growth 2005/2006-2015/2016 -4.39% -3.59% -4.35% -0.82% -3.08% -1.48% -4.92% -2.05%
Source: IHS Markit Regional eXplorer version 1156
0
50
100
150
200
250
300
350
400
Overall, Violent and Property Crime Index Nelson Mandela Bay, 2005/2006-2015/2016
OverallCrime Index Violent Crime IndexProperty Crime Index
Source: IHS Markit Regional eXplorer version 1156
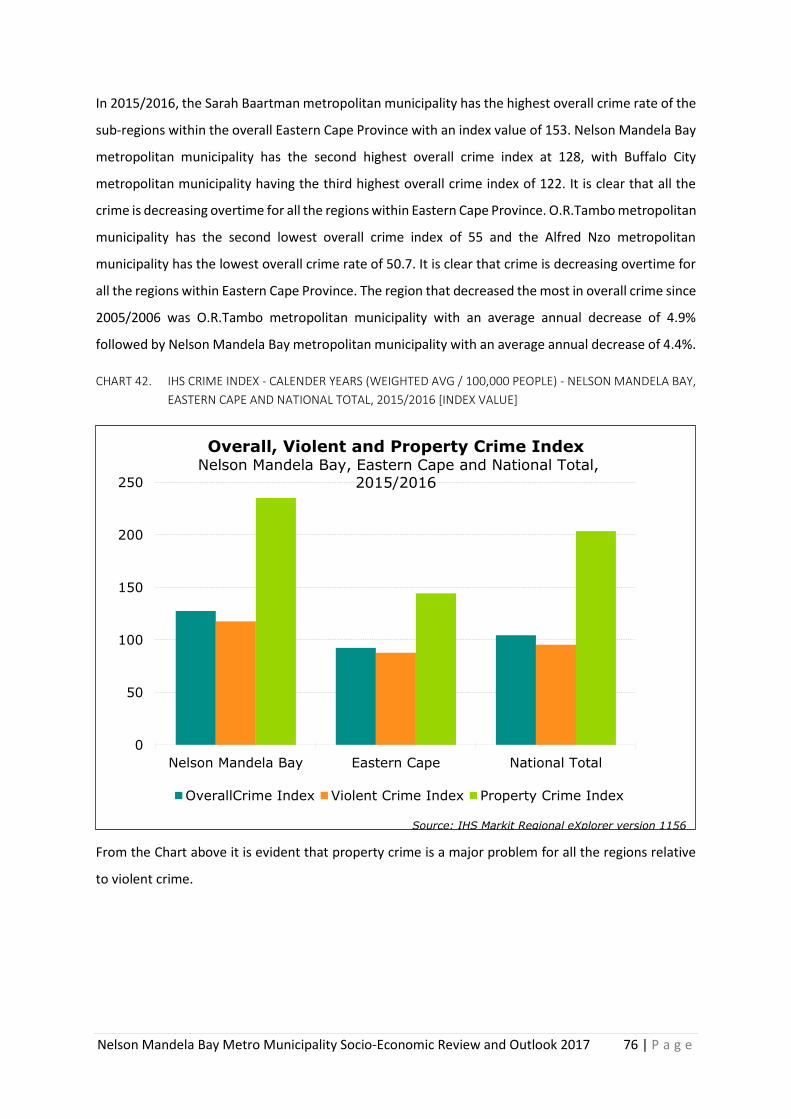
Nelson Mandela Bay Metro Municipality Socio-Economic Review and Outlook 2017 76 | P a g e
In 2015/2016, the Sarah Baartman metropolitan municipality has the highest overall crime rate of the
sub-regions within the overall Eastern Cape Province with an index value of 153. Nelson Mandela Bay
metropolitan municipality has the second highest overall crime index at 128, with Buffalo City
metropolitan municipality having the third highest overall crime index of 122. It is clear that all the
crime is decreasing overtime for all the regions within Eastern Cape Province. O.R.Tambo metropolitan
municipality has the second lowest overall crime index of 55 and the Alfred Nzo metropolitan
municipality has the lowest overall crime rate of 50.7. It is clear that crime is decreasing overtime for
all the regions within Eastern Cape Province. The region that decreased the most in overall crime since
2005/2006 was O.R.Tambo metropolitan municipality with an average annual decrease of 4.9%
followed by Nelson Mandela Bay metropolitan municipality with an average annual decrease of 4.4%.
CHART 42. IHS CRIME INDEX - CALENDER YEARS (WEIGHTED AVG / 100,000 PEOPLE) - NELSON MANDELA BAY,
EASTERN CAPE AND NATIONAL TOTAL, 2015/2016 [INDEX VALUE]
From the Chart above it is evident that property crime is a major problem for all the regions relative
to violent crime.
0
50
100
150
200
250
Nelson Mandela Bay Eastern Cape National Total
Overall, Violent and Property Crime Index Nelson Mandela Bay, Eastern Cape and National Total,
2015/2016
OverallCrime Index Violent Crime Index Property Crime Index
Source: IHS Markit Regional eXplorer version 1156
Nelson Mandela Bay Metro Municipality Socio-Economic Review and Outlook 2017 77 | P a g e
8. HOUSEHOLD INFRASTRUCTURE
Drawing on the household infrastructure data of a region is of essential value in economic planning
and social development. Assessing household infrastructure involves the measurement of four
indicators:
• Access to dwelling units
• Access to proper sanitation
• Access to running water
• Access to refuse removal
• Access to electricity
A household is considered "serviced" if it has access to all four of these basic services. If not, the
household is considered to be part of the backlog. The way access to a given service is defined (and
how to accurately measure that specific Definition over time) gives rise to some distinct problems. IHS
has therefore developed a unique model to capture the number of households and their level of
access to the four basic services.
A household is defined as a group of persons who live together and provide themselves jointly with
food and/or other essentials for living, or a single person who lives alone.
The next few sections offer an overview of the household infrastructure of the Nelson Mandela Bay
Metropolitan Municipality between 2016 and 2006.
8.1 HOUSEHOLD BY DWELLING TYPE
Using the StatsSA definition of a household and a dwelling unit, households can be categorised
according to type of dwelling. The categories are:
• Very formal dwellings - structures built according to approved plans, e.g. houses on a
separate stand, flats or apartments, townhouses, rooms in backyards that also have running
water and flush toilets within the dwelling. .
• Formal dwellings - structures built according to approved plans, i.e. house on a separate
stand, flat or apartment, townhouse, room in backyard, rooms or flatlet elsewhere etc, but
without running water or without a flush toilet within the dwelling.
• Informal dwellings - shacks or shanties in informal settlements, serviced stands, or proclaimed
townships, as well as shacks in the backyards of other dwelling types.
• Traditional dwellings - structures made of clay, mud, reeds, or other locally available material.
• Other dwelling units - tents, ships, caravans, etc.
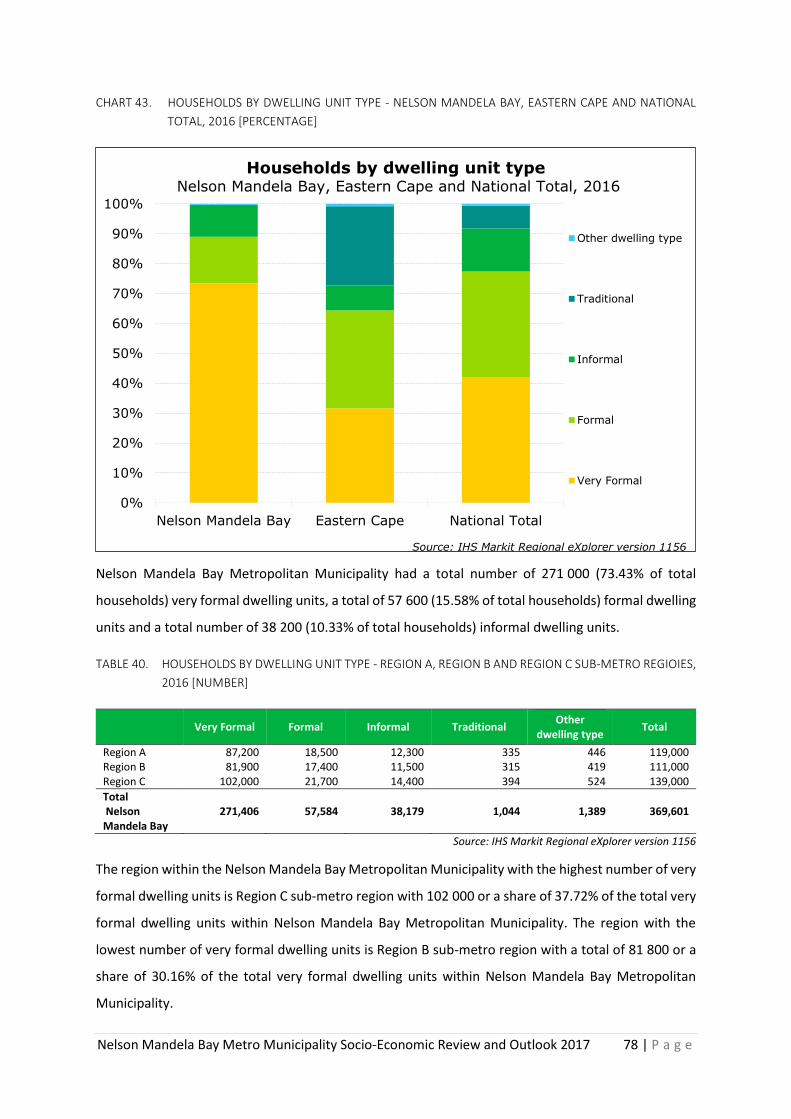
Nelson Mandela Bay Metro Municipality Socio-Economic Review and Outlook 2017 78 | P a g e
CHART 43. HOUSEHOLDS BY DWELLING UNIT TYPE - NELSON MANDELA BAY, EASTERN CAPE AND NATIONAL
TOTAL, 2016 [PERCENTAGE]
Nelson Mandela Bay Metropolitan Municipality had a total number of 271 000 (73.43% of total
households) very formal dwelling units, a total of 57 600 (15.58% of total households) formal dwelling
units and a total number of 38 200 (10.33% of total households) informal dwelling units.
TABLE 40. HOUSEHOLDS BY DWELLING UNIT TYPE - REGION A, REGION B AND REGION C SUB-METRO REGIOIES,
2016 [NUMBER]
Very Formal Formal Informal Traditional Other
dwelling type Total
Region A 87,200 18,500 12,300 335 446 119,000 Region B 81,900 17,400 11,500 315 419 111,000 Region C 102,000 21,700 14,400 394 524 139,000
Total Nelson Mandela Bay
271,406 57,584 38,179 1,044 1,389 369,601
Source: IHS Markit Regional eXplorer version 1156
The region within the Nelson Mandela Bay Metropolitan Municipality with the highest number of very
formal dwelling units is Region C sub-metro region with 102 000 or a share of 37.72% of the total very
formal dwelling units within Nelson Mandela Bay Metropolitan Municipality. The region with the
lowest number of very formal dwelling units is Region B sub-metro region with a total of 81 800 or a
share of 30.16% of the total very formal dwelling units within Nelson Mandela Bay Metropolitan
Municipality.
0%
10%
20%
30%
40%
50%
60%
70%
80%
90%
100%
Nelson Mandela Bay Eastern Cape National Total
Households by dwelling unit type Nelson Mandela Bay, Eastern Cape and National Total, 2016
Other dwelling type
Traditional
Informal
Formal
Very Formal
Source: IHS Markit Regional eXplorer version 1156
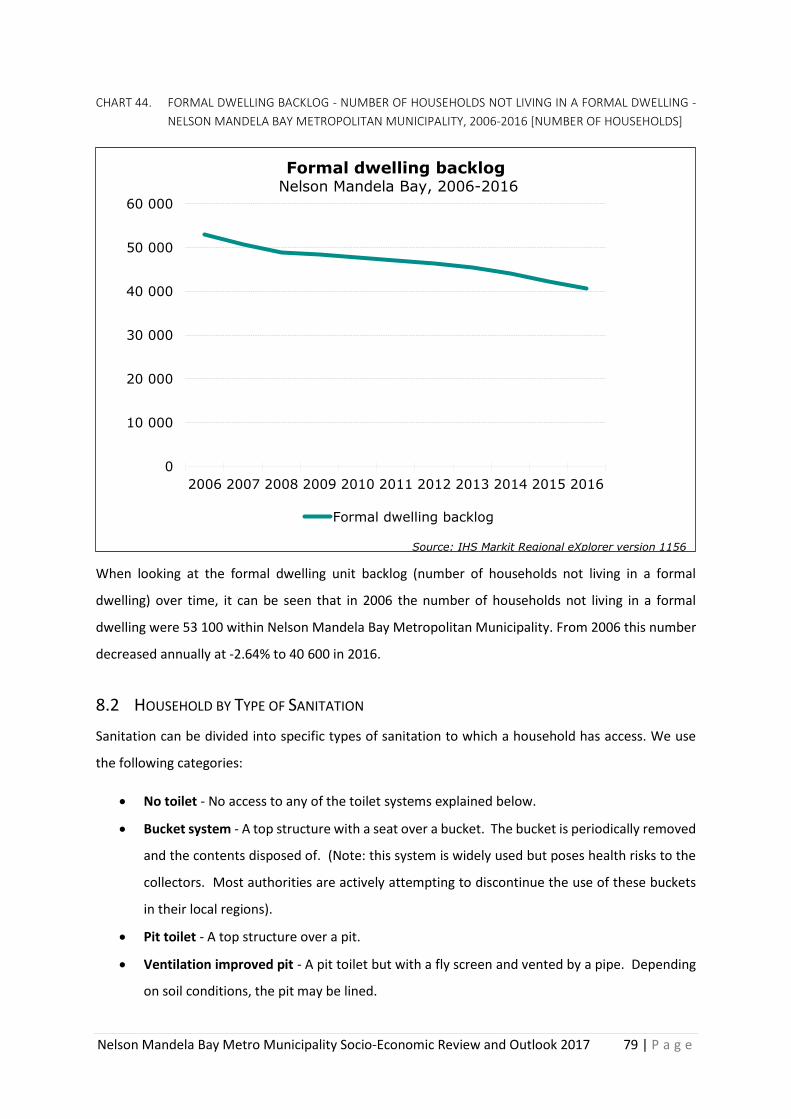
Nelson Mandela Bay Metro Municipality Socio-Economic Review and Outlook 2017 79 | P a g e
CHART 44. FORMAL DWELLING BACKLOG - NUMBER OF HOUSEHOLDS NOT LIVING IN A FORMAL DWELLING -
NELSON MANDELA BAY METROPOLITAN MUNICIPALITY, 2006-2016 [NUMBER OF HOUSEHOLDS]
When looking at the formal dwelling unit backlog (number of households not living in a formal
dwelling) over time, it can be seen that in 2006 the number of households not living in a formal
dwelling were 53 100 within Nelson Mandela Bay Metropolitan Municipality. From 2006 this number
decreased annually at -2.64% to 40 600 in 2016.
8.2 HOUSEHOLD BY TYPE OF SANITATION
Sanitation can be divided into specific types of sanitation to which a household has access. We use
the following categories:
• No toilet - No access to any of the toilet systems explained below.
• Bucket system - A top structure with a seat over a bucket. The bucket is periodically removed
and the contents disposed of. (Note: this system is widely used but poses health risks to the
collectors. Most authorities are actively attempting to discontinue the use of these buckets
in their local regions).
• Pit toilet - A top structure over a pit.
• Ventilation improved pit - A pit toilet but with a fly screen and vented by a pipe. Depending
on soil conditions, the pit may be lined.
0
10 000
20 000
30 000
40 000
50 000
60 000
2006 2007 2008 2009 2010 2011 2012 2013 2014 2015 2016
Formal dwelling backlog Nelson Mandela Bay, 2006-2016
Formal dwelling backlog
Source: IHS Markit Regional eXplorer version 1156
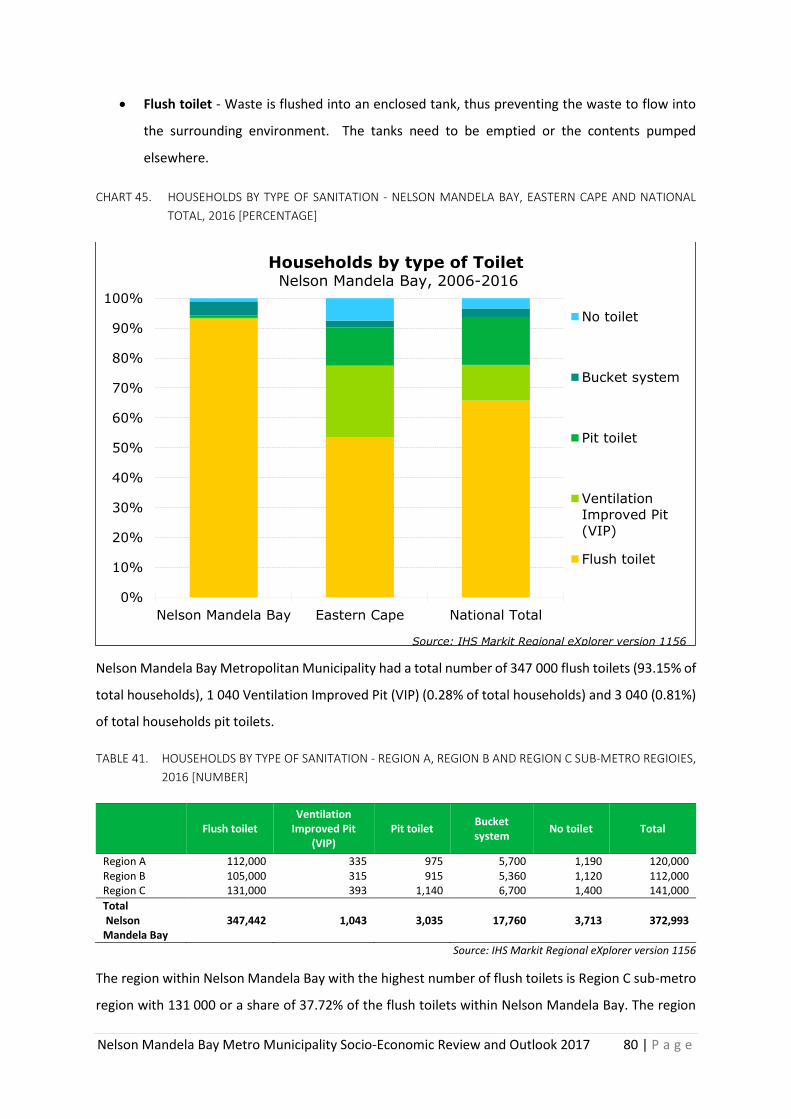
Nelson Mandela Bay Metro Municipality Socio-Economic Review and Outlook 2017 80 | P a g e
• Flush toilet - Waste is flushed into an enclosed tank, thus preventing the waste to flow into
the surrounding environment. The tanks need to be emptied or the contents pumped
elsewhere.
CHART 45. HOUSEHOLDS BY TYPE OF SANITATION - NELSON MANDELA BAY, EASTERN CAPE AND NATIONAL
TOTAL, 2016 [PERCENTAGE]
Nelson Mandela Bay Metropolitan Municipality had a total number of 347 000 flush toilets (93.15% of
total households), 1 040 Ventilation Improved Pit (VIP) (0.28% of total households) and 3 040 (0.81%)
of total households pit toilets.
TABLE 41. HOUSEHOLDS BY TYPE OF SANITATION - REGION A, REGION B AND REGION C SUB-METRO REGIOIES,
2016 [NUMBER]
Flush toilet Ventilation
Improved Pit (VIP)
Pit toilet Bucket system
No toilet Total
Region A 112,000 335 975 5,700 1,190 120,000 Region B 105,000 315 915 5,360 1,120 112,000 Region C 131,000 393 1,140 6,700 1,400 141,000
Total Nelson Mandela Bay
347,442 1,043 3,035 17,760 3,713 372,993
Source: IHS Markit Regional eXplorer version 1156
The region within Nelson Mandela Bay with the highest number of flush toilets is Region C sub-metro
region with 131 000 or a share of 37.72% of the flush toilets within Nelson Mandela Bay. The region
0%
10%
20%
30%
40%
50%
60%
70%
80%
90%
100%
Nelson Mandela Bay Eastern Cape National Total
Households by type of Toilet Nelson Mandela Bay, 2006-2016
No toilet
Bucket system
Pit toilet
Ventilation
Improved Pit
(VIP)
Flush toilet
Source: IHS Markit Regional eXplorer version 1156
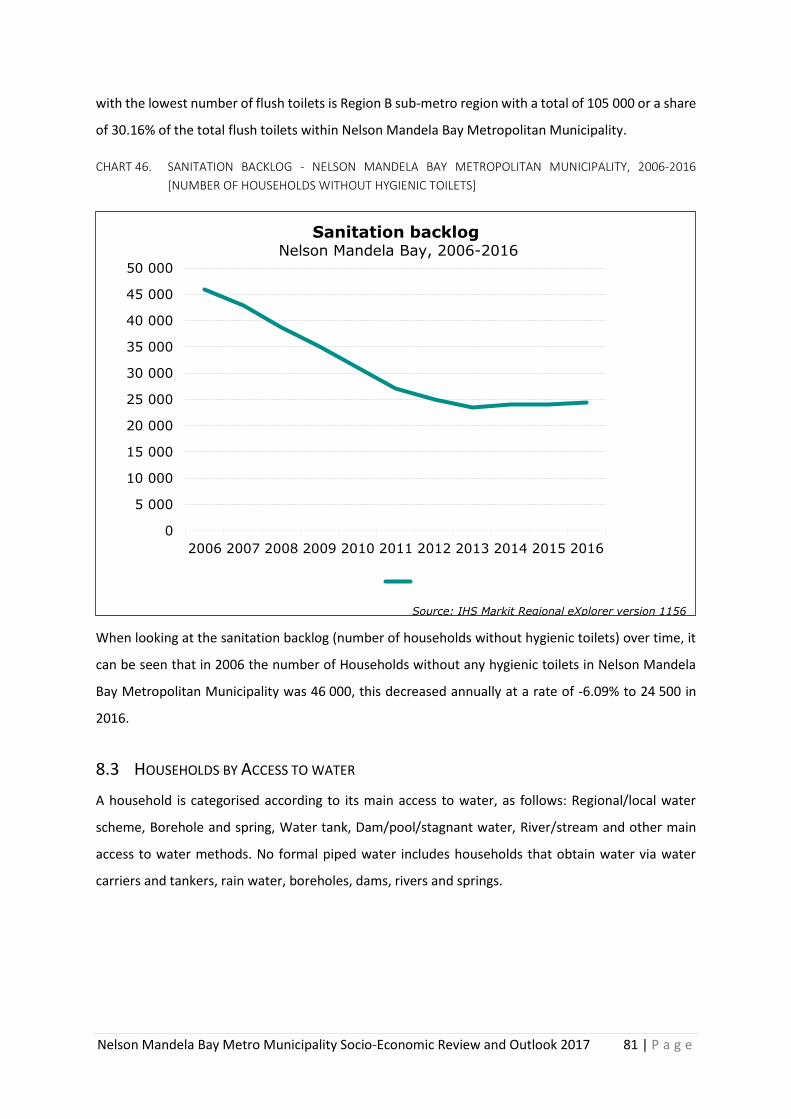
Nelson Mandela Bay Metro Municipality Socio-Economic Review and Outlook 2017 81 | P a g e
with the lowest number of flush toilets is Region B sub-metro region with a total of 105 000 or a share
of 30.16% of the total flush toilets within Nelson Mandela Bay Metropolitan Municipality.
CHART 46. SANITATION BACKLOG - NELSON MANDELA BAY METROPOLITAN MUNICIPALITY, 2006-2016
[NUMBER OF HOUSEHOLDS WITHOUT HYGIENIC TOILETS]
When looking at the sanitation backlog (number of households without hygienic toilets) over time, it
can be seen that in 2006 the number of Households without any hygienic toilets in Nelson Mandela
Bay Metropolitan Municipality was 46 000, this decreased annually at a rate of -6.09% to 24 500 in
2016.
8.3 HOUSEHOLDS BY ACCESS TO WATER
A household is categorised according to its main access to water, as follows: Regional/local water
scheme, Borehole and spring, Water tank, Dam/pool/stagnant water, River/stream and other main
access to water methods. No formal piped water includes households that obtain water via water
carriers and tankers, rain water, boreholes, dams, rivers and springs.
0
5 000
10 000
15 000
20 000
25 000
30 000
35 000
40 000
45 000
50 000
2006 2007 2008 2009 2010 2011 2012 2013 2014 2015 2016
Sanitation backlog Nelson Mandela Bay, 2006-2016
Source: IHS Markit Regional eXplorer version 1156
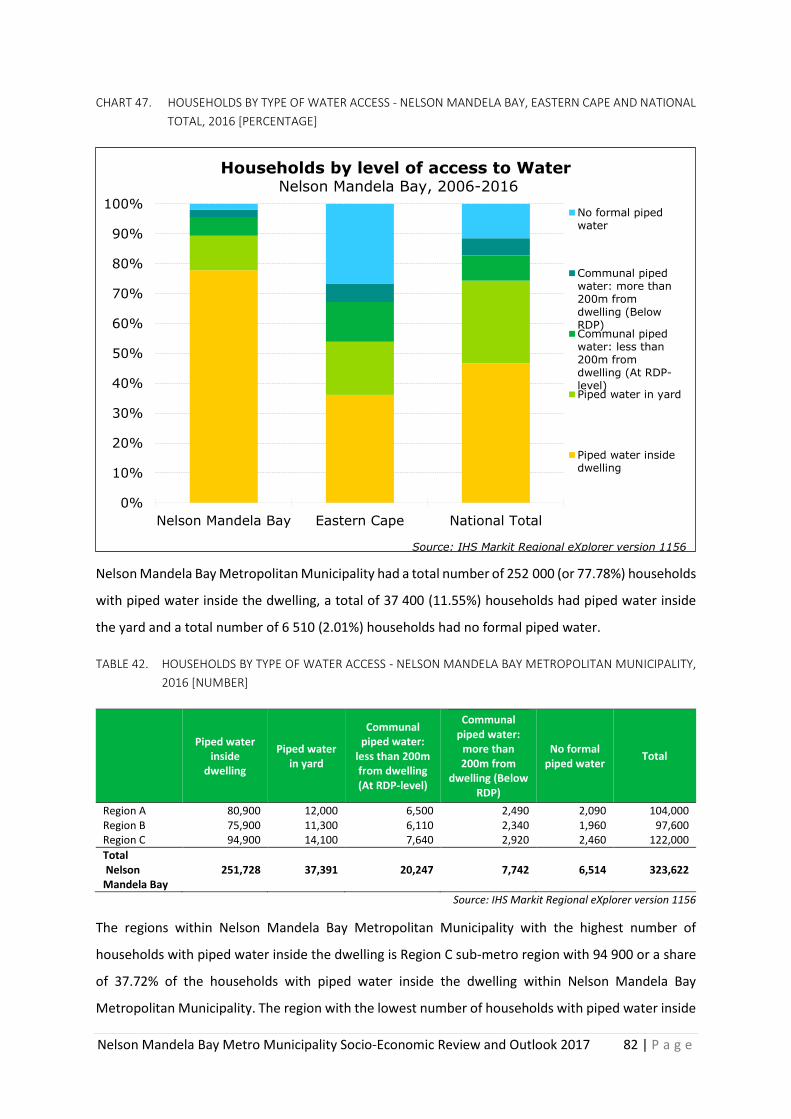
Nelson Mandela Bay Metro Municipality Socio-Economic Review and Outlook 2017 82 | P a g e
CHART 47. HOUSEHOLDS BY TYPE OF WATER ACCESS - NELSON MANDELA BAY, EASTERN CAPE AND NATIONAL
TOTAL, 2016 [PERCENTAGE]
Nelson Mandela Bay Metropolitan Municipality had a total number of 252 000 (or 77.78%) households
with piped water inside the dwelling, a total of 37 400 (11.55%) households had piped water inside
the yard and a total number of 6 510 (2.01%) households had no formal piped water.
TABLE 42. HOUSEHOLDS BY TYPE OF WATER ACCESS - NELSON MANDELA BAY METROPOLITAN MUNICIPALITY,
2016 [NUMBER]
Piped water
inside dwelling
Piped water in yard
Communal piped water:
less than 200m from dwelling (At RDP-level)
Communal piped water:
more than 200m from
dwelling (Below RDP)
No formal piped water
Total
Region A 80,900 12,000 6,500 2,490 2,090 104,000 Region B 75,900 11,300 6,110 2,340 1,960 97,600 Region C 94,900 14,100 7,640 2,920 2,460 122,000
Total Nelson Mandela Bay
251,728 37,391 20,247 7,742 6,514 323,622
Source: IHS Markit Regional eXplorer version 1156
The regions within Nelson Mandela Bay Metropolitan Municipality with the highest number of
households with piped water inside the dwelling is Region C sub-metro region with 94 900 or a share
of 37.72% of the households with piped water inside the dwelling within Nelson Mandela Bay
Metropolitan Municipality. The region with the lowest number of households with piped water inside
0%
10%
20%
30%
40%
50%
60%
70%
80%
90%
100%
Nelson Mandela Bay Eastern Cape National Total
Households by level of access to Water Nelson Mandela Bay, 2006-2016
No formal pipedwater
Communal pipedwater: more than200m fromdwelling (BelowRDP)Communal pipedwater: less than200m fromdwelling (At RDP-level)Piped water in yard
Piped water insidedwelling
Source: IHS Markit Regional eXplorer version 1156
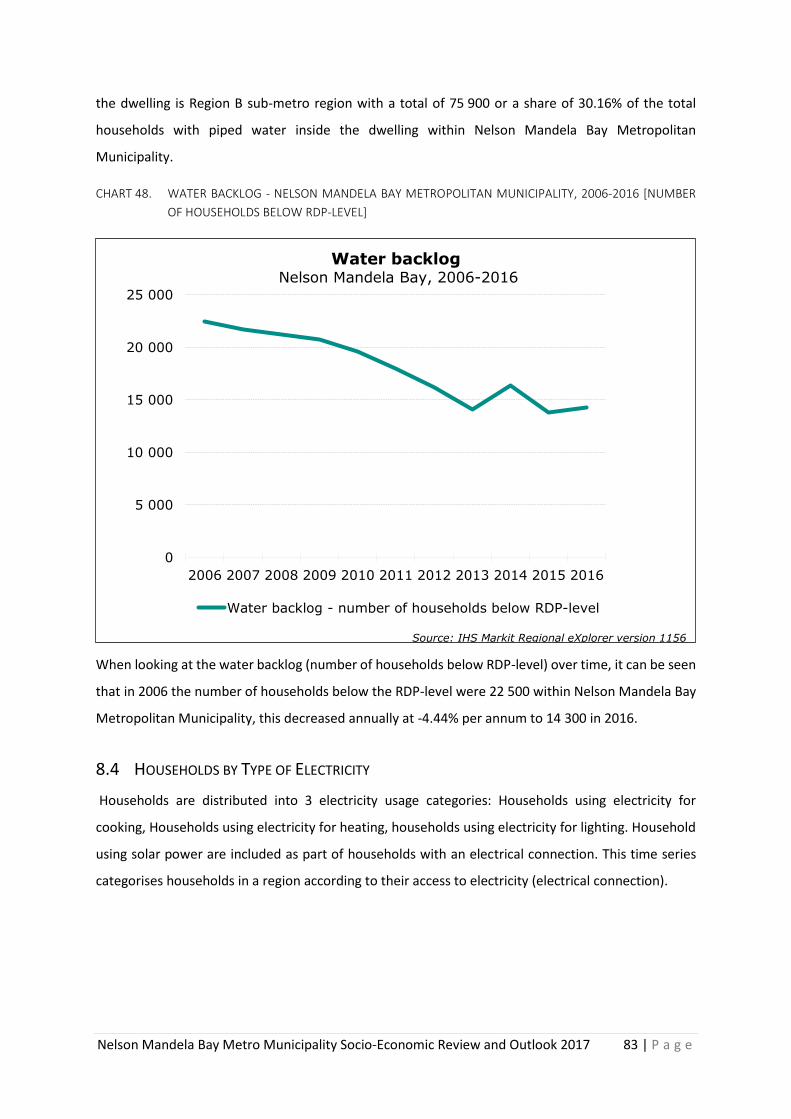
Nelson Mandela Bay Metro Municipality Socio-Economic Review and Outlook 2017 83 | P a g e
the dwelling is Region B sub-metro region with a total of 75 900 or a share of 30.16% of the total
households with piped water inside the dwelling within Nelson Mandela Bay Metropolitan
Municipality.
CHART 48. WATER BACKLOG - NELSON MANDELA BAY METROPOLITAN MUNICIPALITY, 2006-2016 [NUMBER
OF HOUSEHOLDS BELOW RDP-LEVEL]
When looking at the water backlog (number of households below RDP-level) over time, it can be seen
that in 2006 the number of households below the RDP-level were 22 500 within Nelson Mandela Bay
Metropolitan Municipality, this decreased annually at -4.44% per annum to 14 300 in 2016.
8.4 HOUSEHOLDS BY TYPE OF ELECTRICITY
Households are distributed into 3 electricity usage categories: Households using electricity for
cooking, Households using electricity for heating, households using electricity for lighting. Household
using solar power are included as part of households with an electrical connection. This time series
categorises households in a region according to their access to electricity (electrical connection).
0
5 000
10 000
15 000
20 000
25 000
2006 2007 2008 2009 2010 2011 2012 2013 2014 2015 2016
Water backlog Nelson Mandela Bay, 2006-2016
Water backlog - number of households below RDP-level
Source: IHS Markit Regional eXplorer version 1156
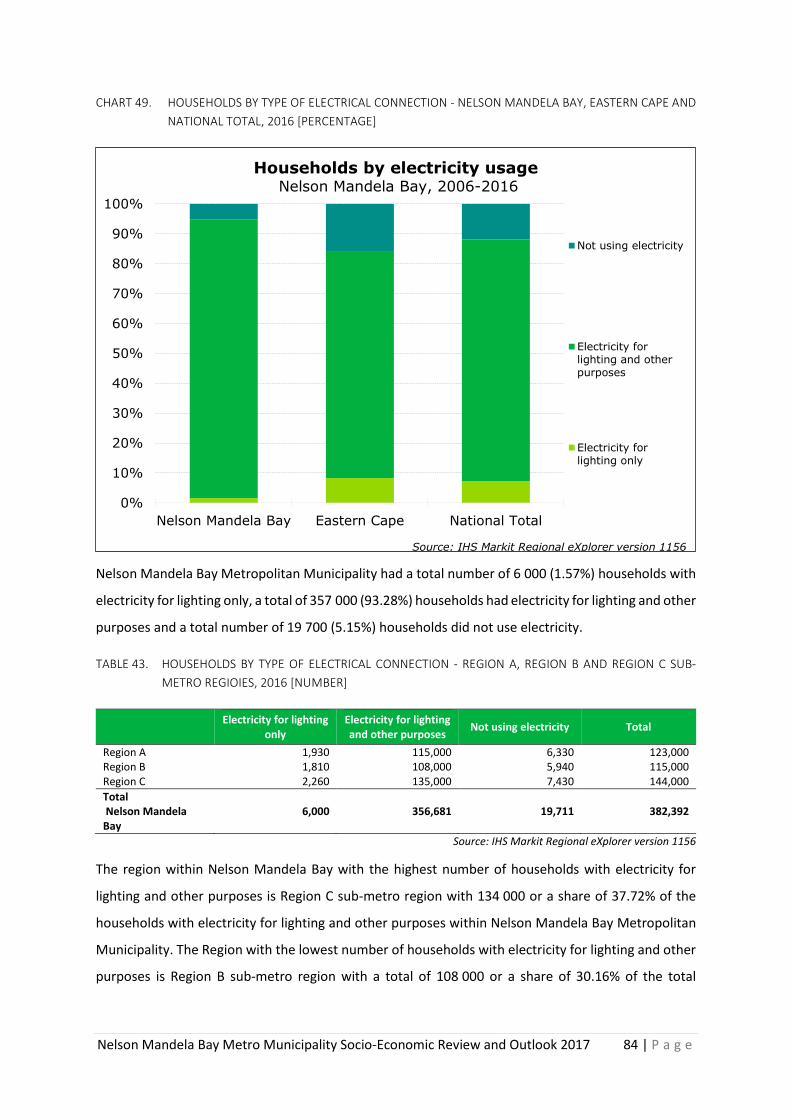
Nelson Mandela Bay Metro Municipality Socio-Economic Review and Outlook 2017 84 | P a g e
CHART 49. HOUSEHOLDS BY TYPE OF ELECTRICAL CONNECTION - NELSON MANDELA BAY, EASTERN CAPE AND
NATIONAL TOTAL, 2016 [PERCENTAGE]
Nelson Mandela Bay Metropolitan Municipality had a total number of 6 000 (1.57%) households with
electricity for lighting only, a total of 357 000 (93.28%) households had electricity for lighting and other
purposes and a total number of 19 700 (5.15%) households did not use electricity.
TABLE 43. HOUSEHOLDS BY TYPE OF ELECTRICAL CONNECTION - REGION A, REGION B AND REGION C SUB-
METRO REGIOIES, 2016 [NUMBER]
Electricity for lighting
only Electricity for lighting and other purposes
Not using electricity Total
Region A 1,930 115,000 6,330 123,000 Region B 1,810 108,000 5,940 115,000 Region C 2,260 135,000 7,430 144,000
Total Nelson Mandela Bay
6,000 356,681 19,711 382,392
Source: IHS Markit Regional eXplorer version 1156
The region within Nelson Mandela Bay with the highest number of households with electricity for
lighting and other purposes is Region C sub-metro region with 134 000 or a share of 37.72% of the
households with electricity for lighting and other purposes within Nelson Mandela Bay Metropolitan
Municipality. The Region with the lowest number of households with electricity for lighting and other
purposes is Region B sub-metro region with a total of 108 000 or a share of 30.16% of the total
0%
10%
20%
30%
40%
50%
60%
70%
80%
90%
100%
Nelson Mandela Bay Eastern Cape National Total
Households by electricity usage Nelson Mandela Bay, 2006-2016
Not using electricity
Electricity forlighting and otherpurposes
Electricity forlighting only
Source: IHS Markit Regional eXplorer version 1156
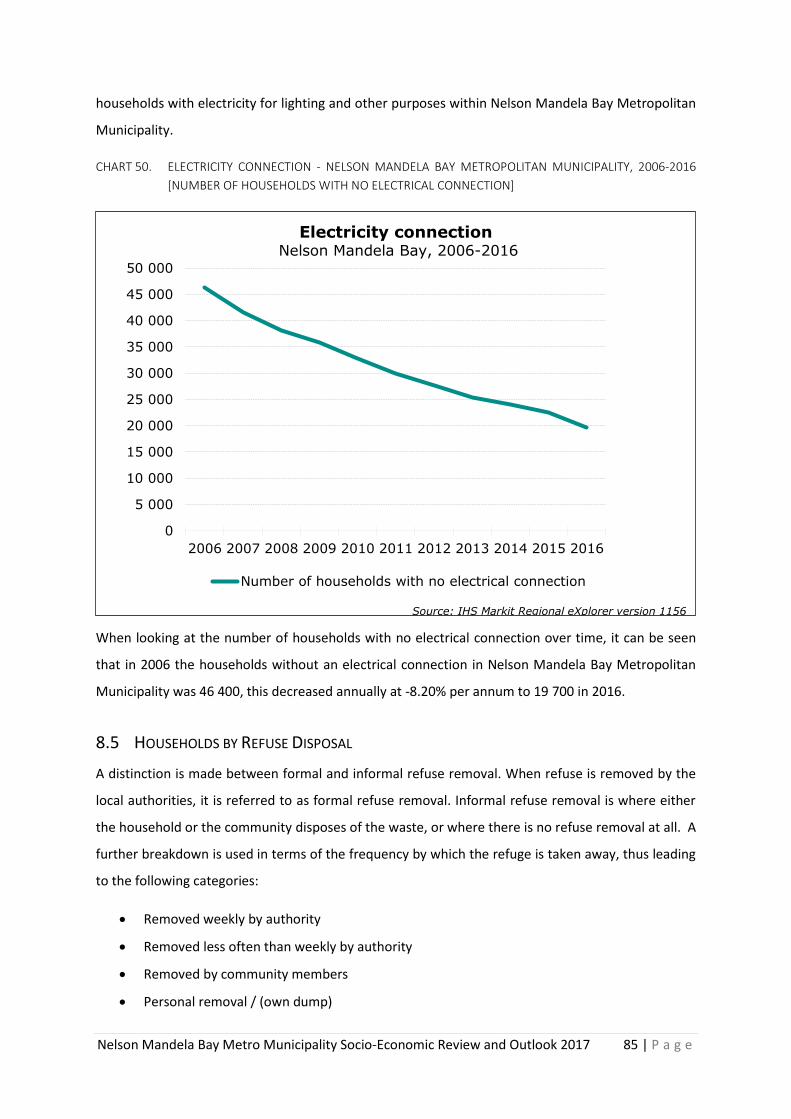
Nelson Mandela Bay Metro Municipality Socio-Economic Review and Outlook 2017 85 | P a g e
households with electricity for lighting and other purposes within Nelson Mandela Bay Metropolitan
Municipality.
CHART 50. ELECTRICITY CONNECTION - NELSON MANDELA BAY METROPOLITAN MUNICIPALITY, 2006-2016
[NUMBER OF HOUSEHOLDS WITH NO ELECTRICAL CONNECTION]
When looking at the number of households with no electrical connection over time, it can be seen
that in 2006 the households without an electrical connection in Nelson Mandela Bay Metropolitan
Municipality was 46 400, this decreased annually at -8.20% per annum to 19 700 in 2016.
8.5 HOUSEHOLDS BY REFUSE DISPOSAL
A distinction is made between formal and informal refuse removal. When refuse is removed by the
local authorities, it is referred to as formal refuse removal. Informal refuse removal is where either
the household or the community disposes of the waste, or where there is no refuse removal at all. A
further breakdown is used in terms of the frequency by which the refuge is taken away, thus leading
to the following categories:
• Removed weekly by authority
• Removed less often than weekly by authority
• Removed by community members
• Personal removal / (own dump)
0
5 000
10 000
15 000
20 000
25 000
30 000
35 000
40 000
45 000
50 000
2006 2007 2008 2009 2010 2011 2012 2013 2014 2015 2016
Electricity connection Nelson Mandela Bay, 2006-2016
Number of households with no electrical connection
Source: IHS Markit Regional eXplorer version 1156
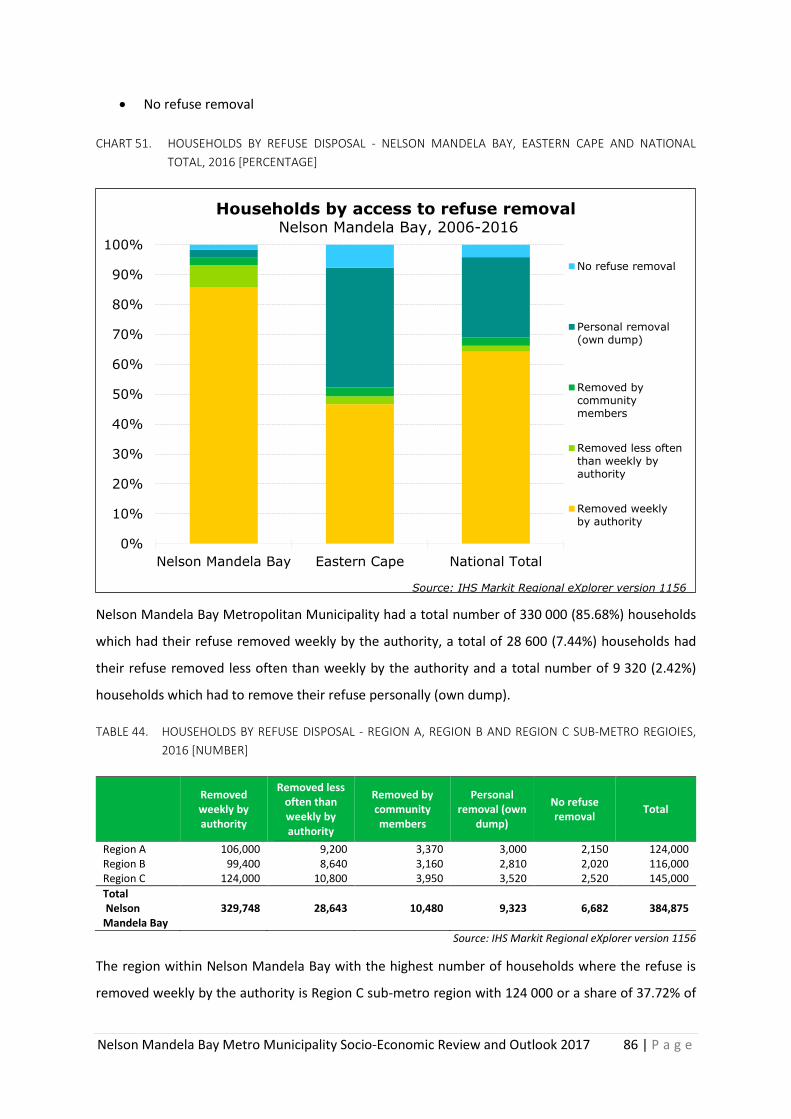
Nelson Mandela Bay Metro Municipality Socio-Economic Review and Outlook 2017 86 | P a g e
• No refuse removal
CHART 51. HOUSEHOLDS BY REFUSE DISPOSAL - NELSON MANDELA BAY, EASTERN CAPE AND NATIONAL
TOTAL, 2016 [PERCENTAGE]
Nelson Mandela Bay Metropolitan Municipality had a total number of 330 000 (85.68%) households
which had their refuse removed weekly by the authority, a total of 28 600 (7.44%) households had
their refuse removed less often than weekly by the authority and a total number of 9 320 (2.42%)
households which had to remove their refuse personally (own dump).
TABLE 44. HOUSEHOLDS BY REFUSE DISPOSAL - REGION A, REGION B AND REGION C SUB-METRO REGIOIES,
2016 [NUMBER]
Removed weekly by authority
Removed less often than weekly by authority
Removed by community members
Personal removal (own
dump)
No refuse removal
Total
Region A 106,000 9,200 3,370 3,000 2,150 124,000 Region B 99,400 8,640 3,160 2,810 2,020 116,000 Region C 124,000 10,800 3,950 3,520 2,520 145,000
Total Nelson Mandela Bay
329,748 28,643 10,480 9,323 6,682 384,875
Source: IHS Markit Regional eXplorer version 1156
The region within Nelson Mandela Bay with the highest number of households where the refuse is
removed weekly by the authority is Region C sub-metro region with 124 000 or a share of 37.72% of
0%
10%
20%
30%
40%
50%
60%
70%
80%
90%
100%
Nelson Mandela Bay Eastern Cape National Total
Households by access to refuse removal Nelson Mandela Bay, 2006-2016
No refuse removal
Personal removal(own dump)
Removed bycommunitymembers
Removed less oftenthan weekly byauthority
Removed weeklyby authority
Source: IHS Markit Regional eXplorer version 1156
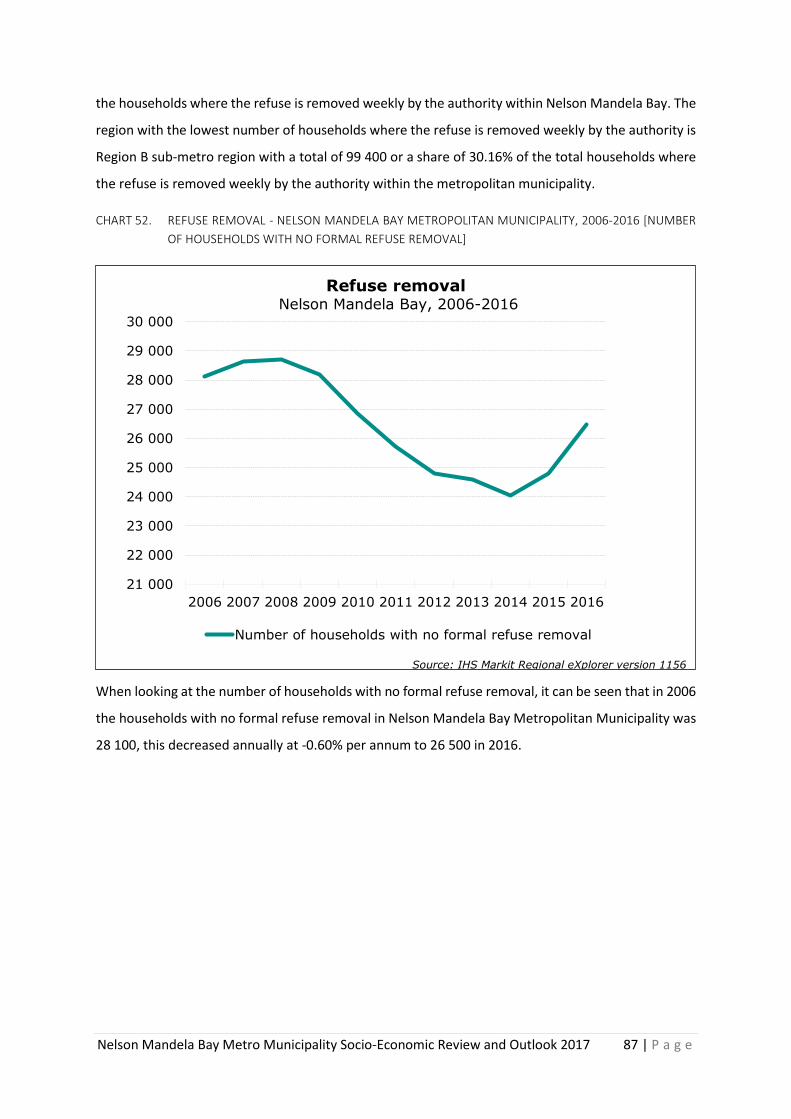
Nelson Mandela Bay Metro Municipality Socio-Economic Review and Outlook 2017 87 | P a g e
the households where the refuse is removed weekly by the authority within Nelson Mandela Bay. The
region with the lowest number of households where the refuse is removed weekly by the authority is
Region B sub-metro region with a total of 99 400 or a share of 30.16% of the total households where
the refuse is removed weekly by the authority within the metropolitan municipality.
CHART 52. REFUSE REMOVAL - NELSON MANDELA BAY METROPOLITAN MUNICIPALITY, 2006-2016 [NUMBER
OF HOUSEHOLDS WITH NO FORMAL REFUSE REMOVAL]
When looking at the number of households with no formal refuse removal, it can be seen that in 2006
the households with no formal refuse removal in Nelson Mandela Bay Metropolitan Municipality was
28 100, this decreased annually at -0.60% per annum to 26 500 in 2016.
21 000
22 000
23 000
24 000
25 000
26 000
27 000
28 000
29 000
30 000
2006 2007 2008 2009 2010 2011 2012 2013 2014 2015 2016
Refuse removal Nelson Mandela Bay, 2006-2016
Number of households with no formal refuse removal
Source: IHS Markit Regional eXplorer version 1156
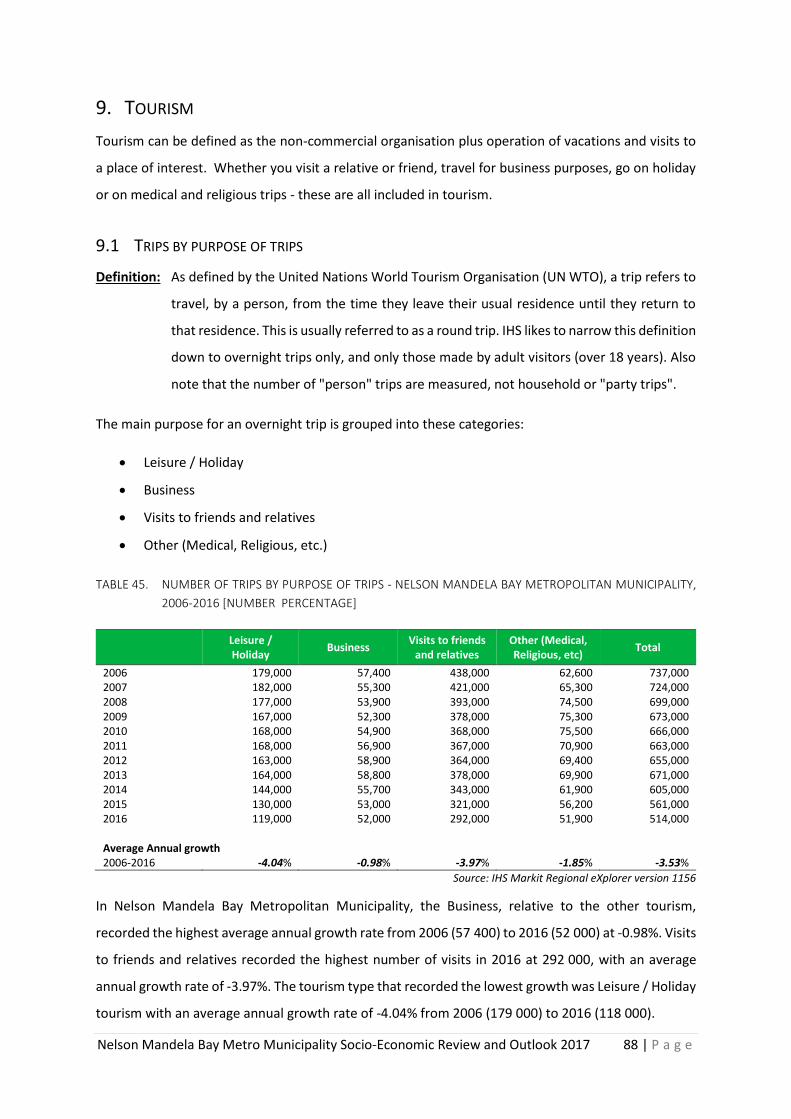
Nelson Mandela Bay Metro Municipality Socio-Economic Review and Outlook 2017 88 | P a g e
9. TOURISM
Tourism can be defined as the non-commercial organisation plus operation of vacations and visits to
a place of interest. Whether you visit a relative or friend, travel for business purposes, go on holiday
or on medical and religious trips - these are all included in tourism.
9.1 TRIPS BY PURPOSE OF TRIPS
Definition: As defined by the United Nations World Tourism Organisation (UN WTO), a trip refers to
travel, by a person, from the time they leave their usual residence until they return to
that residence. This is usually referred to as a round trip. IHS likes to narrow this definition
down to overnight trips only, and only those made by adult visitors (over 18 years). Also
note that the number of "person" trips are measured, not household or "party trips".
The main purpose for an overnight trip is grouped into these categories:
• Leisure / Holiday
• Business
• Visits to friends and relatives
• Other (Medical, Religious, etc.)
TABLE 45. NUMBER OF TRIPS BY PURPOSE OF TRIPS - NELSON MANDELA BAY METROPOLITAN MUNICIPALITY,
2006-2016 [NUMBER PERCENTAGE]
Leisure / Holiday
Business Visits to friends
and relatives Other (Medical, Religious, etc)
Total
2006 179,000 57,400 438,000 62,600 737,000 2007 182,000 55,300 421,000 65,300 724,000 2008 177,000 53,900 393,000 74,500 699,000 2009 167,000 52,300 378,000 75,300 673,000 2010 168,000 54,900 368,000 75,500 666,000 2011 168,000 56,900 367,000 70,900 663,000 2012 163,000 58,900 364,000 69,400 655,000 2013 164,000 58,800 378,000 69,900 671,000 2014 144,000 55,700 343,000 61,900 605,000 2015 130,000 53,000 321,000 56,200 561,000 2016 119,000 52,000 292,000 51,900 514,000 Average Annual growth 2006-2016 -4.04% -0.98% -3.97% -1.85% -3.53%
Source: IHS Markit Regional eXplorer version 1156
In Nelson Mandela Bay Metropolitan Municipality, the Business, relative to the other tourism,
recorded the highest average annual growth rate from 2006 (57 400) to 2016 (52 000) at -0.98%. Visits
to friends and relatives recorded the highest number of visits in 2016 at 292 000, with an average
annual growth rate of -3.97%. The tourism type that recorded the lowest growth was Leisure / Holiday
tourism with an average annual growth rate of -4.04% from 2006 (179 000) to 2016 (118 000).
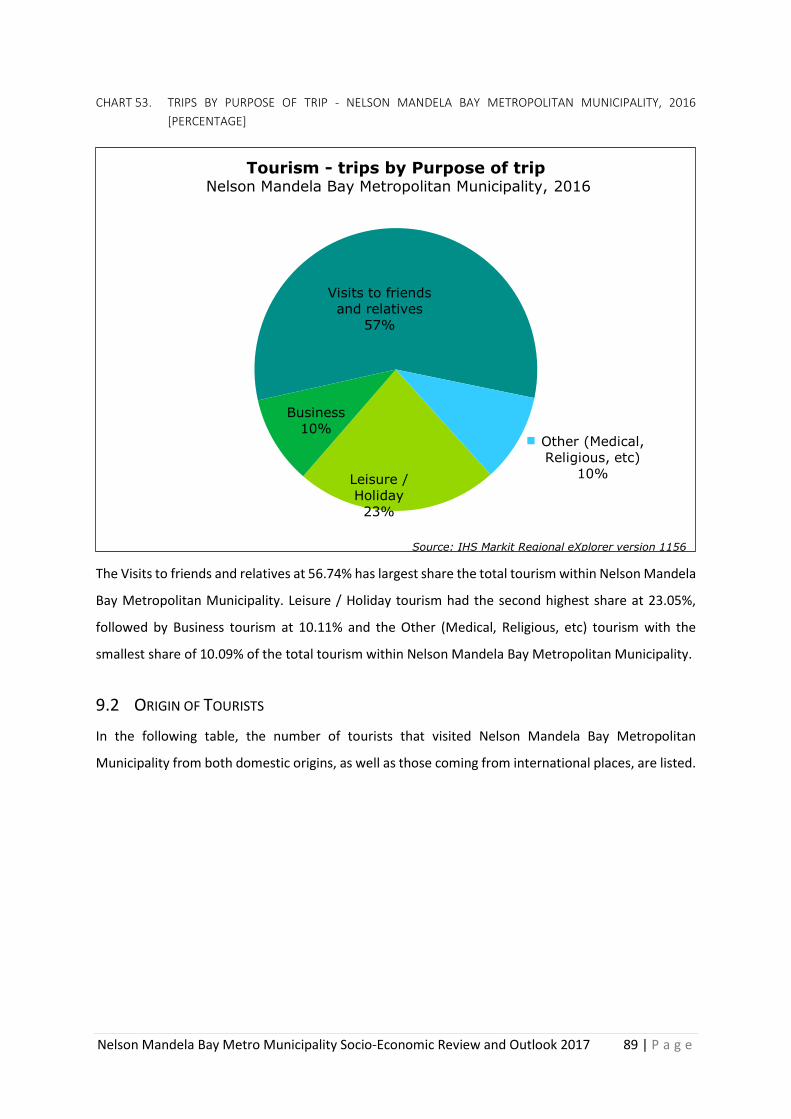
Nelson Mandela Bay Metro Municipality Socio-Economic Review and Outlook 2017 89 | P a g e
CHART 53. TRIPS BY PURPOSE OF TRIP - NELSON MANDELA BAY METROPOLITAN MUNICIPALITY, 2016
[PERCENTAGE]
The Visits to friends and relatives at 56.74% has largest share the total tourism within Nelson Mandela
Bay Metropolitan Municipality. Leisure / Holiday tourism had the second highest share at 23.05%,
followed by Business tourism at 10.11% and the Other (Medical, Religious, etc) tourism with the
smallest share of 10.09% of the total tourism within Nelson Mandela Bay Metropolitan Municipality.
9.2 ORIGIN OF TOURISTS
In the following table, the number of tourists that visited Nelson Mandela Bay Metropolitan
Municipality from both domestic origins, as well as those coming from international places, are listed.
Leisure /
Holiday
23%
Business
10%
Visits to friends
and relatives
57%
Other (Medical,
Religious, etc)
10%
Tourism - trips by Purpose of trip Nelson Mandela Bay Metropolitan Municipality, 2016
Source: IHS Markit Regional eXplorer version 1156
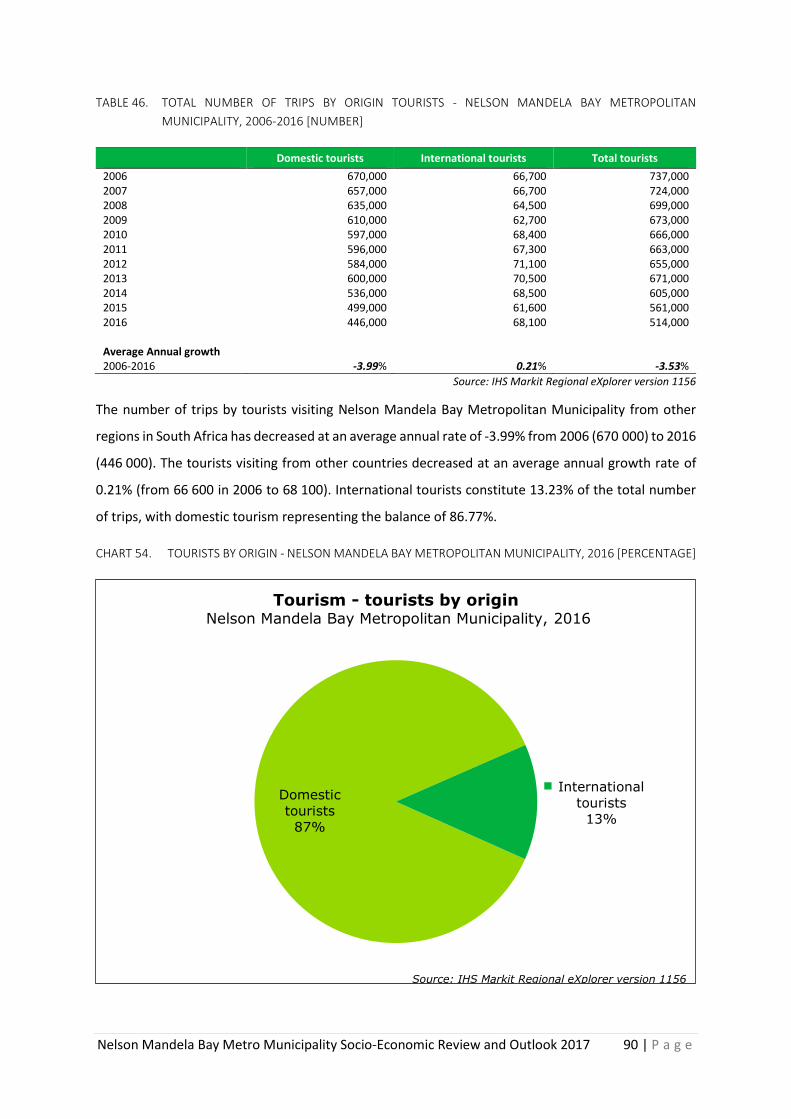
Nelson Mandela Bay Metro Municipality Socio-Economic Review and Outlook 2017 90 | P a g e
TABLE 46. TOTAL NUMBER OF TRIPS BY ORIGIN TOURISTS - NELSON MANDELA BAY METROPOLITAN
MUNICIPALITY, 2006-2016 [NUMBER]
Domestic tourists International tourists Total tourists
2006 670,000 66,700 737,000 2007 657,000 66,700 724,000 2008 635,000 64,500 699,000 2009 610,000 62,700 673,000 2010 597,000 68,400 666,000 2011 596,000 67,300 663,000 2012 584,000 71,100 655,000 2013 600,000 70,500 671,000 2014 536,000 68,500 605,000 2015 499,000 61,600 561,000 2016 446,000 68,100 514,000 Average Annual growth 2006-2016 -3.99% 0.21% -3.53%
Source: IHS Markit Regional eXplorer version 1156
The number of trips by tourists visiting Nelson Mandela Bay Metropolitan Municipality from other
regions in South Africa has decreased at an average annual rate of -3.99% from 2006 (670 000) to 2016
(446 000). The tourists visiting from other countries decreased at an average annual growth rate of
0.21% (from 66 600 in 2006 to 68 100). International tourists constitute 13.23% of the total number
of trips, with domestic tourism representing the balance of 86.77%.
CHART 54. TOURISTS BY ORIGIN - NELSON MANDELA BAY METROPOLITAN MUNICIPALITY, 2016 [PERCENTAGE]
Domestic
tourists
87%
International
tourists
13%
Tourism - tourists by origin Nelson Mandela Bay Metropolitan Municipality, 2016
Source: IHS Markit Regional eXplorer version 1156
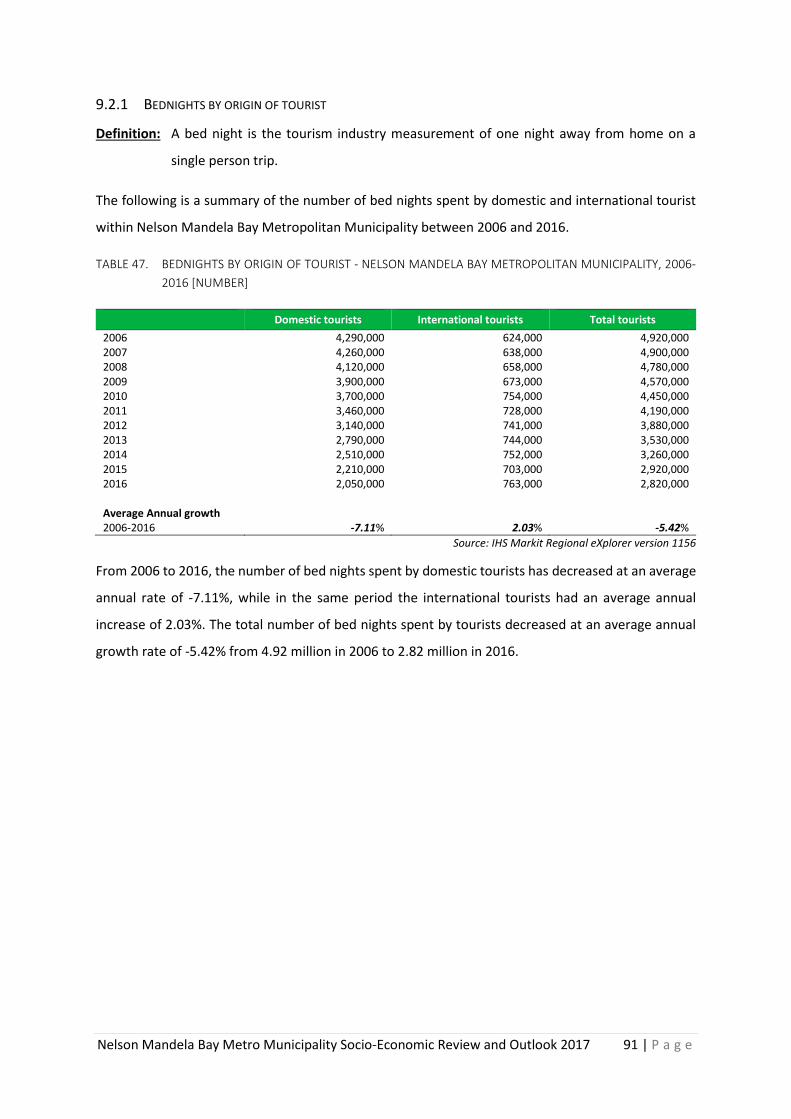
Nelson Mandela Bay Metro Municipality Socio-Economic Review and Outlook 2017 91 | P a g e
9.2.1 BEDNIGHTS BY ORIGIN OF TOURIST
Definition: A bed night is the tourism industry measurement of one night away from home on a
single person trip.
The following is a summary of the number of bed nights spent by domestic and international tourist
within Nelson Mandela Bay Metropolitan Municipality between 2006 and 2016.
TABLE 47. BEDNIGHTS BY ORIGIN OF TOURIST - NELSON MANDELA BAY METROPOLITAN MUNICIPALITY, 2006-
2016 [NUMBER]
Domestic tourists International tourists Total tourists
2006 4,290,000 624,000 4,920,000 2007 4,260,000 638,000 4,900,000 2008 4,120,000 658,000 4,780,000 2009 3,900,000 673,000 4,570,000 2010 3,700,000 754,000 4,450,000 2011 3,460,000 728,000 4,190,000 2012 3,140,000 741,000 3,880,000 2013 2,790,000 744,000 3,530,000 2014 2,510,000 752,000 3,260,000 2015 2,210,000 703,000 2,920,000 2016 2,050,000 763,000 2,820,000 Average Annual growth 2006-2016 -7.11% 2.03% -5.42%
Source: IHS Markit Regional eXplorer version 1156
From 2006 to 2016, the number of bed nights spent by domestic tourists has decreased at an average
annual rate of -7.11%, while in the same period the international tourists had an average annual
increase of 2.03%. The total number of bed nights spent by tourists decreased at an average annual
growth rate of -5.42% from 4.92 million in 2006 to 2.82 million in 2016.
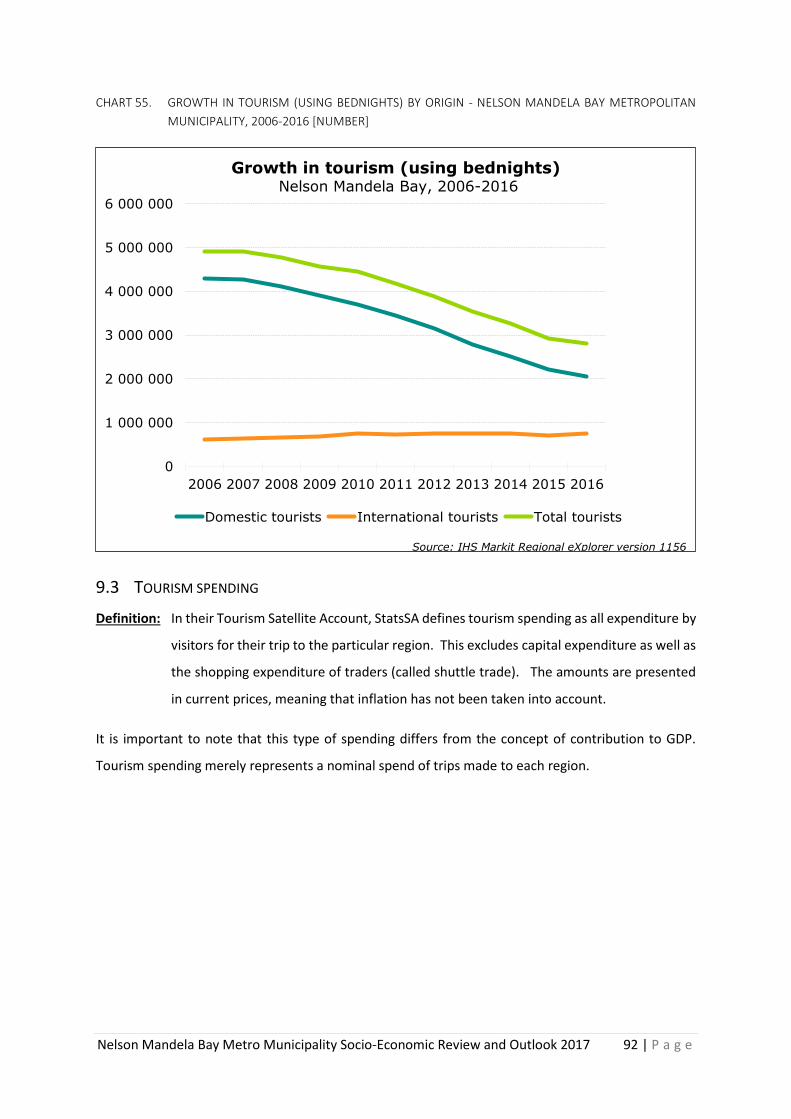
Nelson Mandela Bay Metro Municipality Socio-Economic Review and Outlook 2017 92 | P a g e
CHART 55. GROWTH IN TOURISM (USING BEDNIGHTS) BY ORIGIN - NELSON MANDELA BAY METROPOLITAN
MUNICIPALITY, 2006-2016 [NUMBER]
9.3 TOURISM SPENDING
Definition: In their Tourism Satellite Account, StatsSA defines tourism spending as all expenditure by
visitors for their trip to the particular region. This excludes capital expenditure as well as
the shopping expenditure of traders (called shuttle trade). The amounts are presented
in current prices, meaning that inflation has not been taken into account.
It is important to note that this type of spending differs from the concept of contribution to GDP.
Tourism spending merely represents a nominal spend of trips made to each region.
0
1 000 000
2 000 000
3 000 000
4 000 000
5 000 000
6 000 000
2006 2007 2008 2009 2010 2011 2012 2013 2014 2015 2016
Growth in tourism (using bednights) Nelson Mandela Bay, 2006-2016
Domestic tourists International tourists Total tourists
Source: IHS Markit Regional eXplorer version 1156
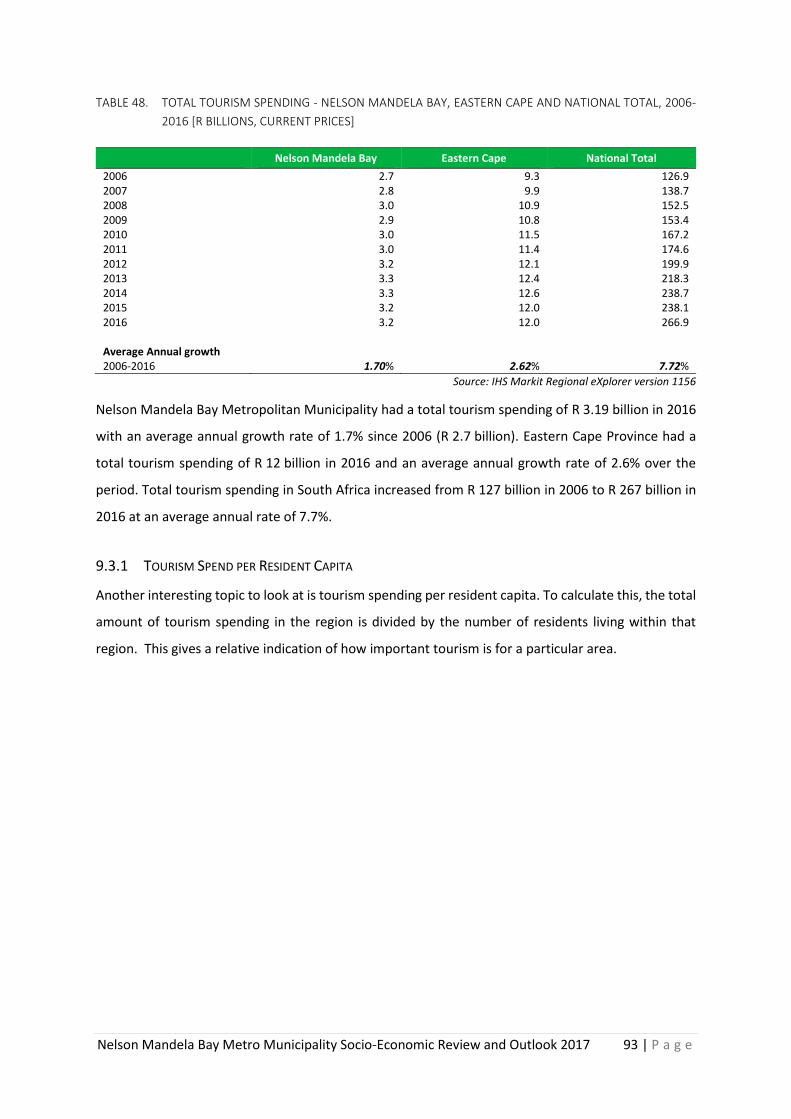
Nelson Mandela Bay Metro Municipality Socio-Economic Review and Outlook 2017 93 | P a g e
TABLE 48. TOTAL TOURISM SPENDING - NELSON MANDELA BAY, EASTERN CAPE AND NATIONAL TOTAL, 2006-
2016 [R BILLIONS, CURRENT PRICES]
Nelson Mandela Bay Eastern Cape National Total
2006 2.7 9.3 126.9 2007 2.8 9.9 138.7 2008 3.0 10.9 152.5 2009 2.9 10.8 153.4 2010 3.0 11.5 167.2 2011 3.0 11.4 174.6 2012 3.2 12.1 199.9 2013 3.3 12.4 218.3 2014 3.3 12.6 238.7 2015 3.2 12.0 238.1 2016 3.2 12.0 266.9 Average Annual growth 2006-2016 1.70% 2.62% 7.72%
Source: IHS Markit Regional eXplorer version 1156
Nelson Mandela Bay Metropolitan Municipality had a total tourism spending of R 3.19 billion in 2016
with an average annual growth rate of 1.7% since 2006 (R 2.7 billion). Eastern Cape Province had a
total tourism spending of R 12 billion in 2016 and an average annual growth rate of 2.6% over the
period. Total tourism spending in South Africa increased from R 127 billion in 2006 to R 267 billion in
2016 at an average annual rate of 7.7%.
9.3.1 TOURISM SPEND PER RESIDENT CAPITA
Another interesting topic to look at is tourism spending per resident capita. To calculate this, the total
amount of tourism spending in the region is divided by the number of residents living within that
region. This gives a relative indication of how important tourism is for a particular area.
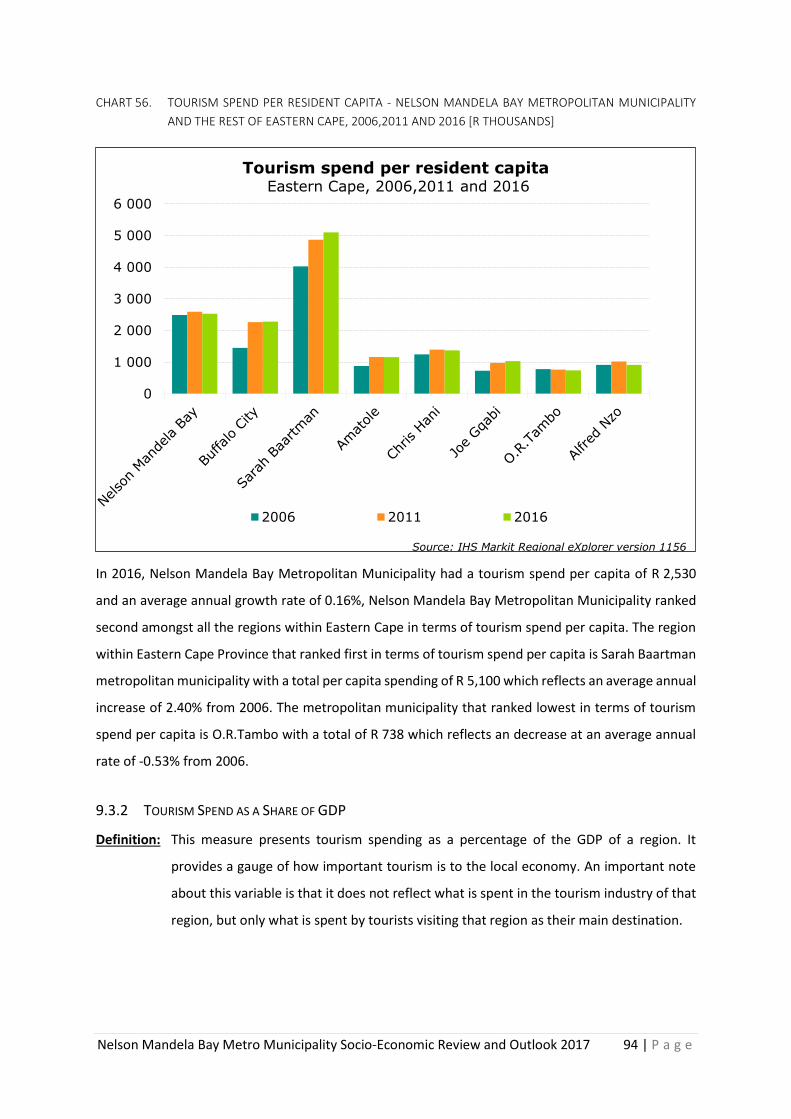
Nelson Mandela Bay Metro Municipality Socio-Economic Review and Outlook 2017 94 | P a g e
CHART 56. TOURISM SPEND PER RESIDENT CAPITA - NELSON MANDELA BAY METROPOLITAN MUNICIPALITY
AND THE REST OF EASTERN CAPE, 2006,2011 AND 2016 [R THOUSANDS]
In 2016, Nelson Mandela Bay Metropolitan Municipality had a tourism spend per capita of R 2,530
and an average annual growth rate of 0.16%, Nelson Mandela Bay Metropolitan Municipality ranked
second amongst all the regions within Eastern Cape in terms of tourism spend per capita. The region
within Eastern Cape Province that ranked first in terms of tourism spend per capita is Sarah Baartman
metropolitan municipality with a total per capita spending of R 5,100 which reflects an average annual
increase of 2.40% from 2006. The metropolitan municipality that ranked lowest in terms of tourism
spend per capita is O.R.Tambo with a total of R 738 which reflects an decrease at an average annual
rate of -0.53% from 2006.
9.3.2 TOURISM SPEND AS A SHARE OF GDP
Definition: This measure presents tourism spending as a percentage of the GDP of a region. It
provides a gauge of how important tourism is to the local economy. An important note
about this variable is that it does not reflect what is spent in the tourism industry of that
region, but only what is spent by tourists visiting that region as their main destination.
0
1 000
2 000
3 000
4 000
5 000
6 000
Tourism spend per resident capita Eastern Cape, 2006,2011 and 2016
2006 2011 2016
Source: IHS Markit Regional eXplorer version 1156
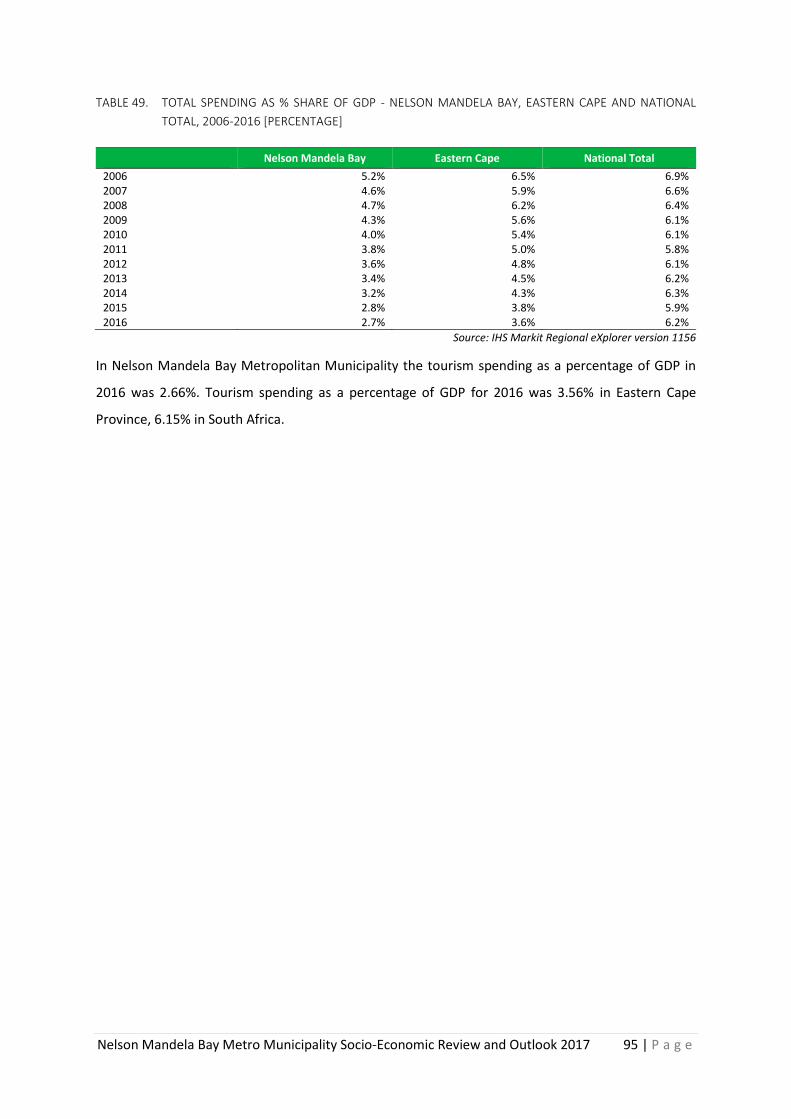
Nelson Mandela Bay Metro Municipality Socio-Economic Review and Outlook 2017 95 | P a g e
TABLE 49. TOTAL SPENDING AS % SHARE OF GDP - NELSON MANDELA BAY, EASTERN CAPE AND NATIONAL
TOTAL, 2006-2016 [PERCENTAGE]
Nelson Mandela Bay Eastern Cape National Total
2006 5.2% 6.5% 6.9% 2007 4.6% 5.9% 6.6% 2008 4.7% 6.2% 6.4% 2009 4.3% 5.6% 6.1% 2010 4.0% 5.4% 6.1% 2011 3.8% 5.0% 5.8% 2012 3.6% 4.8% 6.1% 2013 3.4% 4.5% 6.2% 2014 3.2% 4.3% 6.3% 2015 2.8% 3.8% 5.9% 2016 2.7% 3.6% 6.2%
Source: IHS Markit Regional eXplorer version 1156
In Nelson Mandela Bay Metropolitan Municipality the tourism spending as a percentage of GDP in
2016 was 2.66%. Tourism spending as a percentage of GDP for 2016 was 3.56% in Eastern Cape
Province, 6.15% in South Africa.
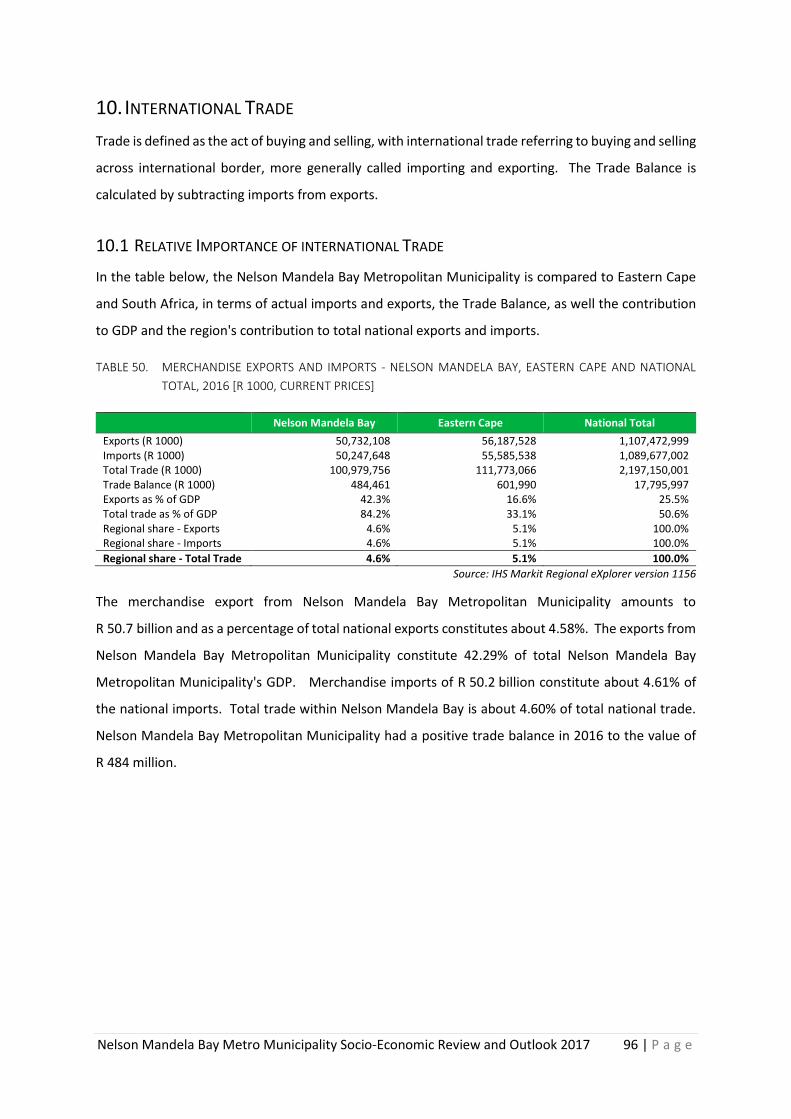
Nelson Mandela Bay Metro Municipality Socio-Economic Review and Outlook 2017 96 | P a g e
10. INTERNATIONAL TRADE
Trade is defined as the act of buying and selling, with international trade referring to buying and selling
across international border, more generally called importing and exporting. The Trade Balance is
calculated by subtracting imports from exports.
10.1 RELATIVE IMPORTANCE OF INTERNATIONAL TRADE
In the table below, the Nelson Mandela Bay Metropolitan Municipality is compared to Eastern Cape
and South Africa, in terms of actual imports and exports, the Trade Balance, as well the contribution
to GDP and the region's contribution to total national exports and imports.
TABLE 50. MERCHANDISE EXPORTS AND IMPORTS - NELSON MANDELA BAY, EASTERN CAPE AND NATIONAL
TOTAL, 2016 [R 1000, CURRENT PRICES]
Nelson Mandela Bay Eastern Cape National Total
Exports (R 1000) 50,732,108 56,187,528 1,107,472,999 Imports (R 1000) 50,247,648 55,585,538 1,089,677,002 Total Trade (R 1000) 100,979,756 111,773,066 2,197,150,001 Trade Balance (R 1000) 484,461 601,990 17,795,997 Exports as % of GDP 42.3% 16.6% 25.5% Total trade as % of GDP 84.2% 33.1% 50.6% Regional share - Exports 4.6% 5.1% 100.0% Regional share - Imports 4.6% 5.1% 100.0%
Regional share - Total Trade 4.6% 5.1% 100.0%
Source: IHS Markit Regional eXplorer version 1156
The merchandise export from Nelson Mandela Bay Metropolitan Municipality amounts to
R 50.7 billion and as a percentage of total national exports constitutes about 4.58%. The exports from
Nelson Mandela Bay Metropolitan Municipality constitute 42.29% of total Nelson Mandela Bay
Metropolitan Municipality's GDP. Merchandise imports of R 50.2 billion constitute about 4.61% of
the national imports. Total trade within Nelson Mandela Bay is about 4.60% of total national trade.
Nelson Mandela Bay Metropolitan Municipality had a positive trade balance in 2016 to the value of
R 484 million.
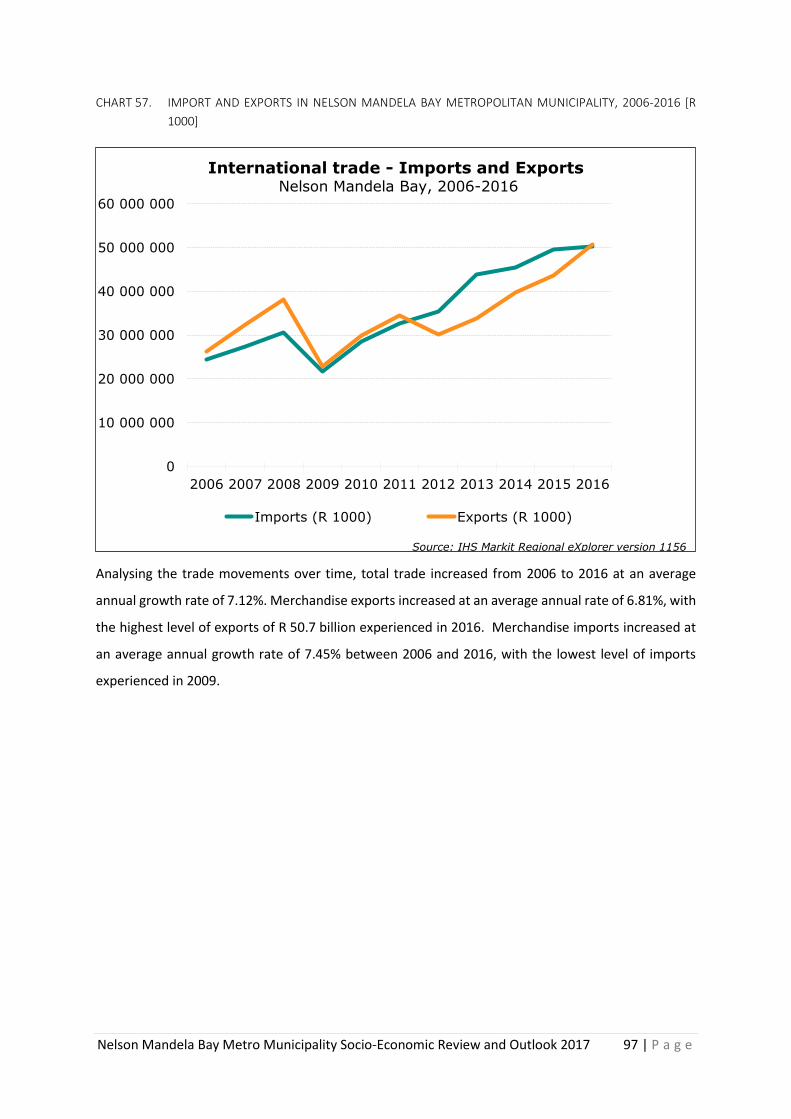
Nelson Mandela Bay Metro Municipality Socio-Economic Review and Outlook 2017 97 | P a g e
CHART 57. IMPORT AND EXPORTS IN NELSON MANDELA BAY METROPOLITAN MUNICIPALITY, 2006-2016 [R
1000]
Analysing the trade movements over time, total trade increased from 2006 to 2016 at an average
annual growth rate of 7.12%. Merchandise exports increased at an average annual rate of 6.81%, with
the highest level of exports of R 50.7 billion experienced in 2016. Merchandise imports increased at
an average annual growth rate of 7.45% between 2006 and 2016, with the lowest level of imports
experienced in 2009.
0
10 000 000
20 000 000
30 000 000
40 000 000
50 000 000
60 000 000
2006 2007 2008 2009 2010 2011 2012 2013 2014 2015 2016
International trade - Imports and Exports Nelson Mandela Bay, 2006-2016
Imports (R 1000) Exports (R 1000)
Source: IHS Markit Regional eXplorer version 1156
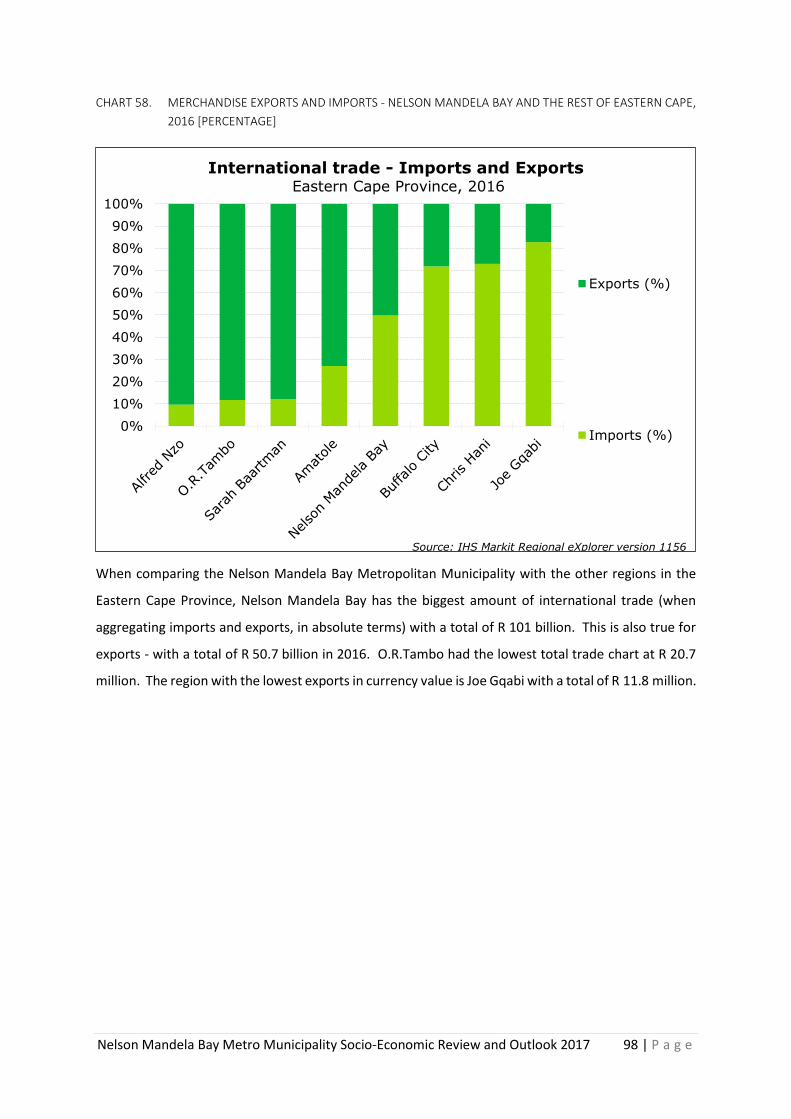
Nelson Mandela Bay Metro Municipality Socio-Economic Review and Outlook 2017 98 | P a g e
CHART 58. MERCHANDISE EXPORTS AND IMPORTS - NELSON MANDELA BAY AND THE REST OF EASTERN CAPE,
2016 [PERCENTAGE]
When comparing the Nelson Mandela Bay Metropolitan Municipality with the other regions in the
Eastern Cape Province, Nelson Mandela Bay has the biggest amount of international trade (when
aggregating imports and exports, in absolute terms) with a total of R 101 billion. This is also true for
exports - with a total of R 50.7 billion in 2016. O.R.Tambo had the lowest total trade chart at R 20.7
million. The region with the lowest exports in currency value is Joe Gqabi with a total of R 11.8 million.
0%
10%
20%
30%
40%
50%
60%
70%
80%
90%
100%
International trade - Imports and Exports Eastern Cape Province, 2016
Exports (%)
Imports (%)
Source: IHS Markit Regional eXplorer version 1156

Nelson Mandela Bay Metro Municipality Socio-Economic Review and Outlook 2017 99 | P a g e


