34
Nemetschek Group – Company Presentation November 2014
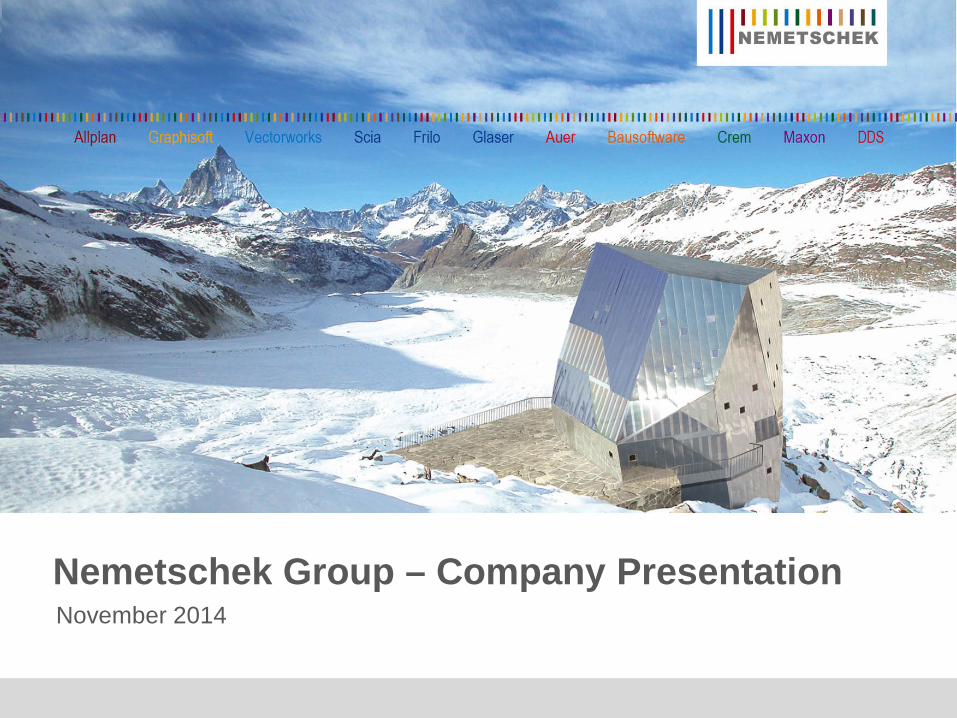
Nemetschek Group – Company PresentationNovember 2014

2
Agenda
Nemetschek Group: In brief
Strategy
InternationalizationIndustry mega trendsInnovations
Financial data 9-month 2014
Nemetschek share
Why invest?

A success story of more than 50 years
1963
1983
1984
2014ff
1968
1980
1999
1999 - 2007
Company founded by Prof. Georg Nemetschek
First use of computers in the building industry
Nemetschek publishes first Computer Aided Engineering Software
Start of internationalization (Austria, Switzerland)
Release of CAD Software „Allplan 1.0“
IPO on Frankfurt Stock Exchange
Numerous acquisitions: Glaser, Auer, Maxon, Vectorworks, Scia, Graphisoft
Leading Open BIM* and 5D Software Company in the world
3
2008 - 2014 Further internationalization, acquisition of Data Design System, Bluebeam
* Building Information Modeling

Unique DNA
PositioningNemetschek Group with 12 strong brands Software solutions, innovations, 5D and BIM for the AEC industry (Architecture, Engineering, Construction)More than 1.8 million users Globally present with more than 40 locations in 142 countries
Mission & VisionOur claim: Innovative, customer -oriented software solution throughout the lifecycle of buildings Our benchmark: Highest quality, user-friendliness and user benefits Focus on customersWorldwide presence: Intensive sales and service secure customer access, customer proximity and customer satisfaction
We drive innovation and digitalization for the entire building life cycle
4
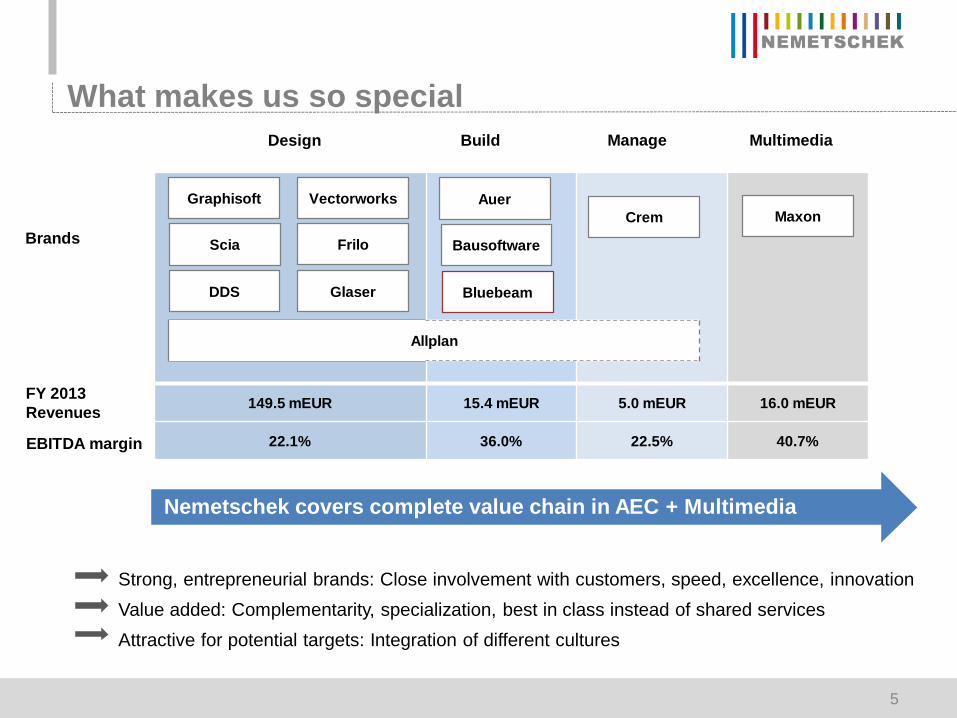
What makes us so special
Strong, entrepreneurial brands: Close involvement with customers, speed, excellence, innovationValue added: Complementarity, specialization, best in class instead of shared servicesAttractive for potential targets: Integration of different cultures
Design Build Manage Multimedia
Brands
EBITDA margin
FY 2013 Revenues 149.5 mEUR 15.4 mEUR 5.0 mEUR 16.0 mEUR
22.1% 36.0% 22.5% 40.7%
Allplan
Bausoftware
AuerCrem Maxon
Graphisoft Vectorworks
Scia Frilo
GlaserDDS
Nemetschek covers complete value chain in AEC + Multimedia
Bluebeam
5
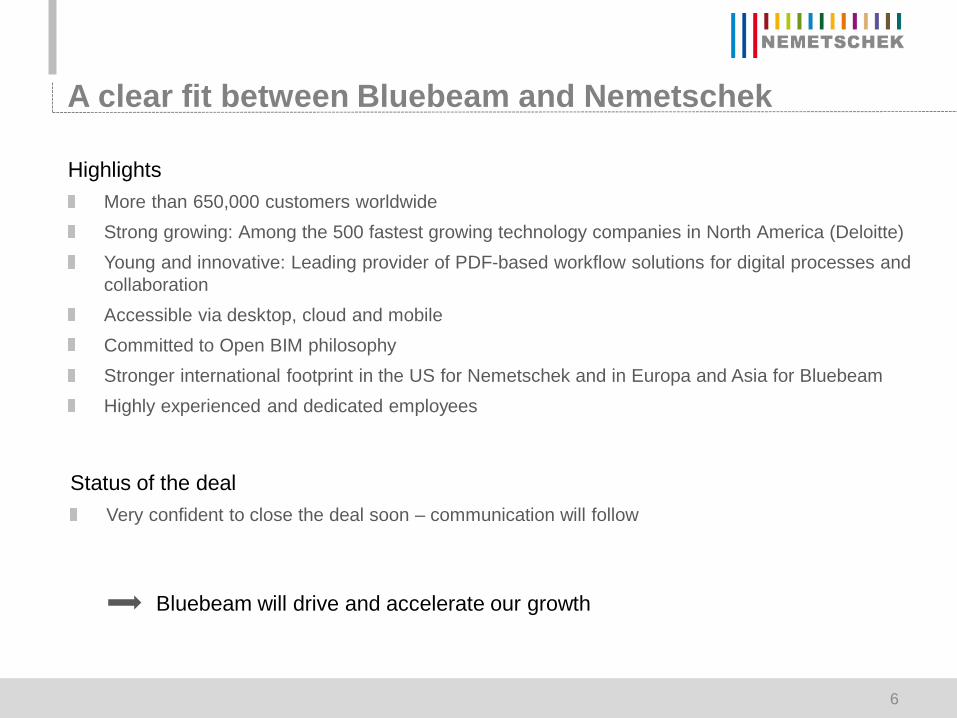
A clear fit between Bluebeam and Nemetschek
Status of the dealVery confident to close the deal soon – communication will follow
HighlightsMore than 650,000 customers worldwideStrong growing: Among the 500 fastest growing technology companies in North America (Deloitte)Young and innovative: Leading provider of PDF-based workflow solutions for digital processes and collaborationAccessible via desktop, cloud and mobileCommitted to Open BIM philosophyStronger international footprint in the US for Nemetschek and in Europa and Asia for BluebeamHighly experienced and dedicated employees
Bluebeam will drive and accelerate our growth
6
7
Agenda
Nemetschek Group: In brief
Strategy
InternationalizationIndustry mega trendsInnovations
Financial data 9-month 2014
Nemetschek share
Why invest?

Challenges of the AEC industry
Time and costs are the critical parameters in the building process, e.g. Airport Berlin, Plan: 2012 completion, 1.7bn EUR, Status: 2017 completion, 5.7bn EUR
Further projects: Elbphilharmonie, San Francisco Bay Bridge, Soccer stadium Berlin and many others
Industry in transition
Digitalization far behind other industries
Increasing complexity
Less time, less budget
More team players
New regulations (BIM, 5D)
Increasing demands for sustainable building
Management of the complete value chain in the building process
8

The Americas Asia Northern Europe Eastern Europe
Major growth markets
What drives our growth
Processes Data management Usability Content Apps …
Focus on customers
BIM 5D Cloud Collaboration Mobile, Web
Strategic areas
Internationalization
Growth: Organic and via acquisitionsAcquisition focus: Strategic fit to close regional and technology gaps
Technology trends Innovations
9

International revenue split
Germany40%
Europe w/o Germany
39%
Americas11%
Asia/Pacific9%
RoW1%
DACH: Market leading position, solid base, increasing revenues
Market position in Americas and Asia strengthened
Germany44%
Europe w/o Germany
44%
Americas6%
Asia/Pacific5%
RoW1%
Growth potential abroad
4 years
Revenues 2013: 185.9m EURRevenues 2009: 135.6m EUR
10

11
Internationalization: Regions on the agenda
Strengthening our position in the Americas, Asia, Northern and Eastern EuropeMarkets with strong growth prospects and increasing demandLeverage via co-operations, acquisitions and early-stage occupation
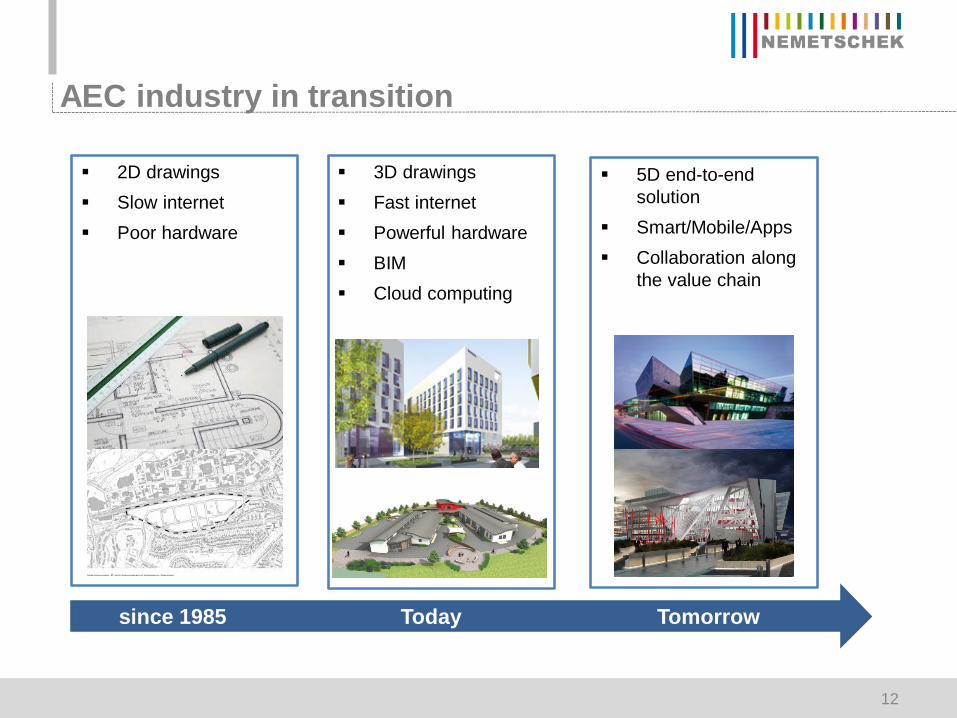
5D end-to-end solution
Smart/Mobile/Apps Collaboration along
the value chain
2D drawings Slow internet Poor hardware
AEC industry in transition
Technologische Trends
since 1985
3D drawings Fast internet Powerful hardware BIM Cloud computing
Today Tomorrow
12

Open BIM is one of the growth drivers for AEC
13
Open BIM

Nemetschek Group focus on Open BIM
14
Open BIM
Innovations along the value chainFocus on customer needs

15
Agenda
Nemetschek Group: In brief
Strategy
Financial data 9-month 2014
Nemetschek share
Why invest?
Continued growth in revenues in the third quarter
43,751,0
Q1 2013 Q1 2014
+16.7%
in mEUR
44,851,3
Q2 2013 Q2 2014
+14.6%
134,2
153,5
9M 2013 9M 2014
+14.3%
Strong home market (+15.8%)
International markets also in growth mode (+13.4%)
45,851,2
Q3 2013 Q3 2014
+11.9%
16

Well-balanced growth of license and service contracts
% of revenues
Up by 14.7% to 73.8 mEUR:Recurring revenues secured
Up by 14.3% to 71.8 mEUR: New customers wins and increasing customer base
Software services48,1%
Software licenses
46,8%
Consulting & Hardware
5,1%Software services:
Software licenses:
17
9,6
12,4
Q2 2013 Q2 2014
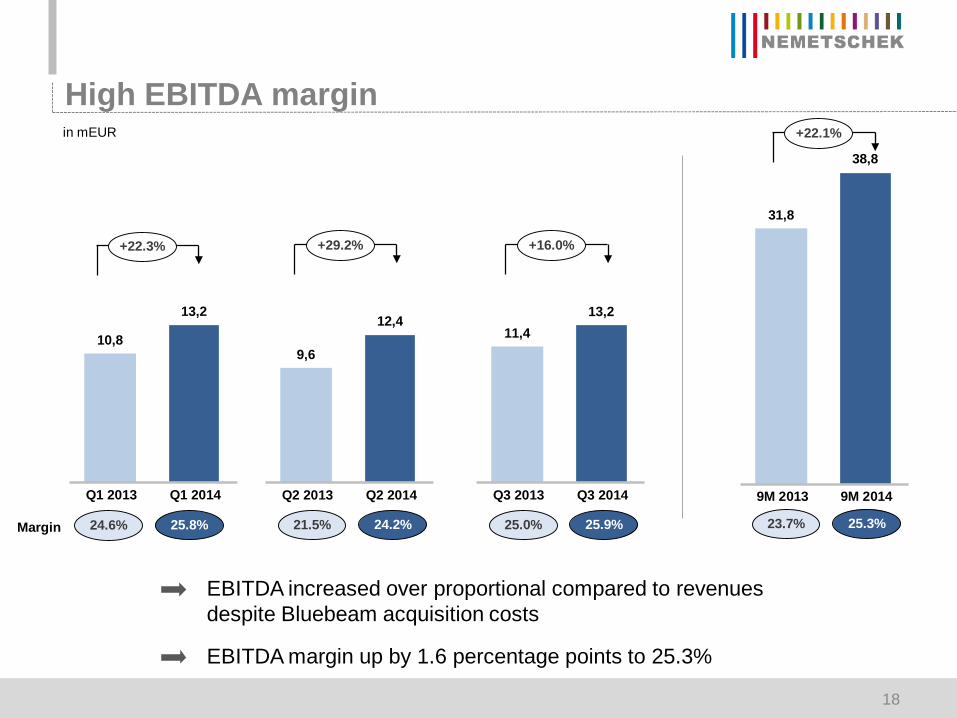
High EBITDA margin
10,8
13,2
Q1 2013 Q1 2014
+22.3%
in mEUR
+29.2%
EBITDA increased over proportional compared to revenues despite Bluebeam acquisition costs
31,8
38,8
9M 2013 9M 2014
24.6%Margin 25.8% 21.5% 24.2% 23.7% 25.3%
EBITDA margin up by 1.6 percentage points to 25.3%
+22.1%
11,413,2
Q3 2013 Q3 2014
+16.0%
25.0% 25.9%
18
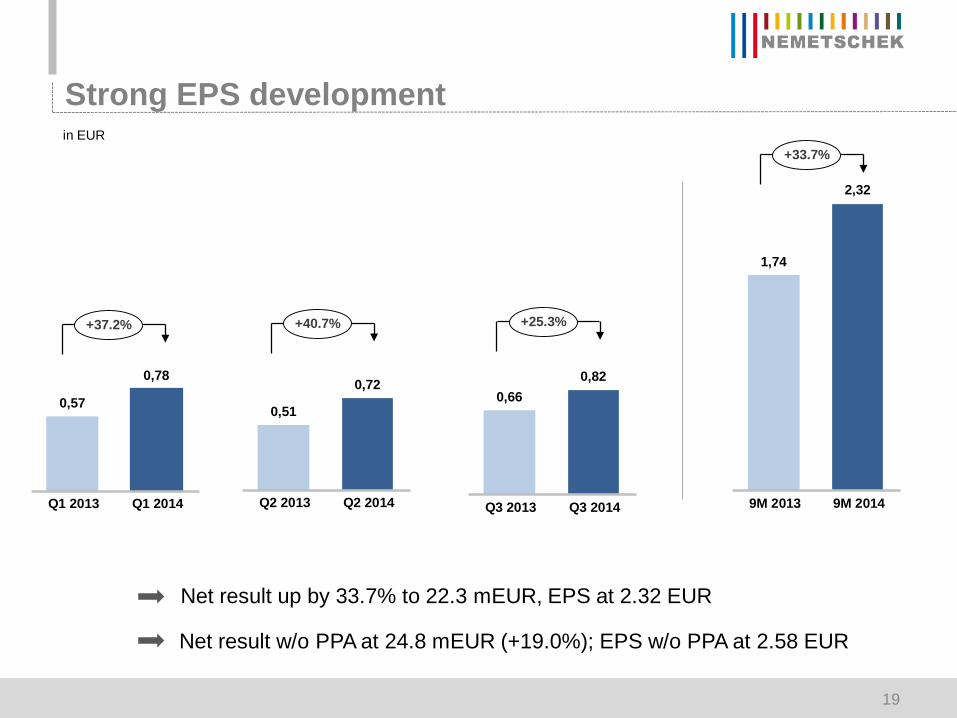
1,74
2,32
9M 2013 9M 2014
0,51
0,72
Q2 2013 Q2 2014
Strong EPS development
0,57
0,78
Q1 2013 Q1 2014
+37.2%
in EUR
+40.7%
+33.7%
Net result up by 33.7% to 22.3 mEUR, EPS at 2.32 EUR
Net result w/o PPA at 24.8 mEUR (+19.0%); EPS w/o PPA at 2.58 EUR
0,660,82
Q3 2013 Q3 2014
+25.3%
19
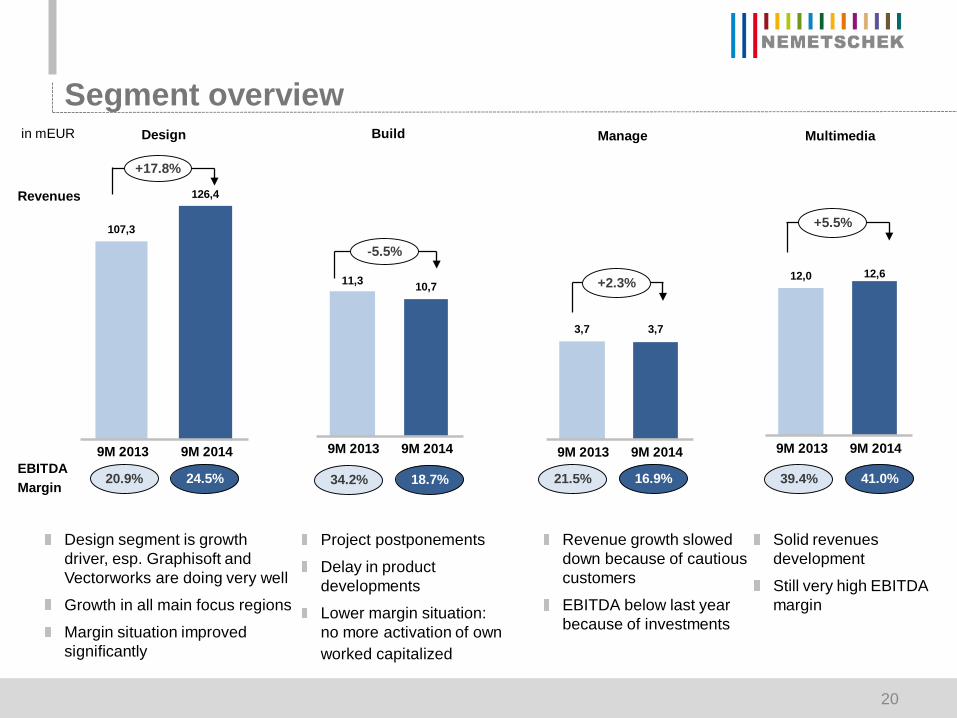
Segment overview
107,3
126,4
9M 2013 9M 2014
+17.8%
20.9%EBITDAMargin 24.5%
Design
-5.5%
34.2% 18.7%
Build
3,7 3,7
9M 2013 9M 2014
21.5% 16.9%
Manage
+5.5%
39.4% 41.0%
Multimediain mEUR
Design segment is growth driver, esp. Graphisoft and Vectorworks are doing very well
Growth in all main focus regions
Margin situation improved significantly
Project postponements
Delay in product developments
Lower margin situation: no more activation of own worked capitalized
Revenue growth slowed down because of cautious customers
EBITDA below last year because of investments
Solid revenues development
Still very high EBITDA margin
Revenues
11,3 10,7
9M 2013 9M 2014
20
+2.3% 12,0 12,6
9M 2013 9M 2014
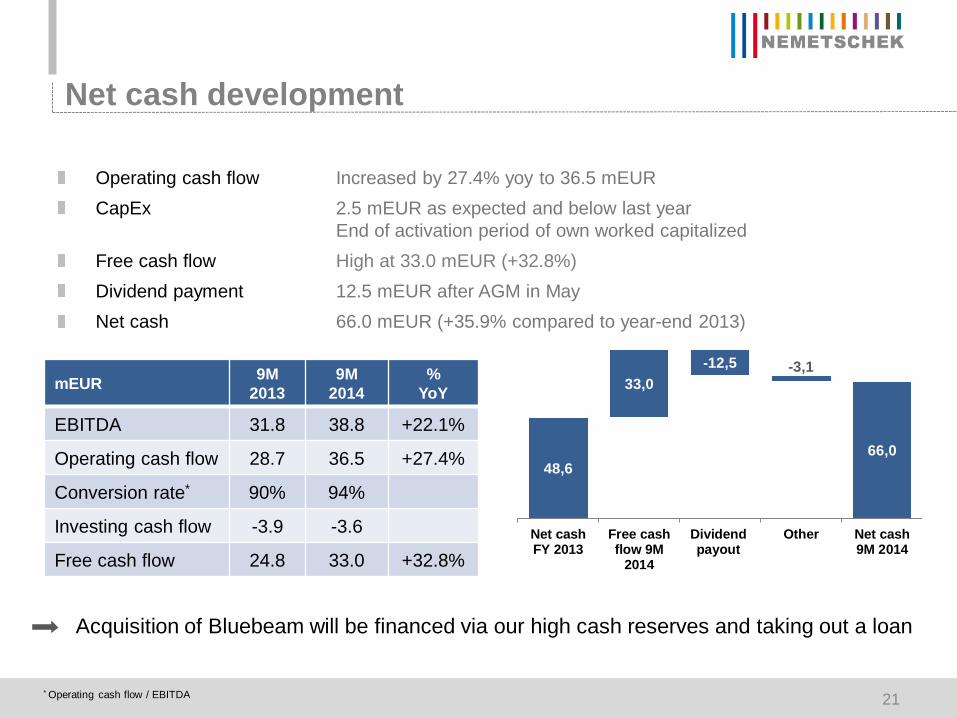
Net cash development
Operating cash flow Increased by 27.4% yoy to 36.5 mEURCapEx 2.5 mEUR as expected and below last year
End of activation period of own worked capitalized Free cash flow High at 33.0 mEUR (+32.8%)Dividend payment 12.5 mEUR after AGM in MayNet cash 66.0 mEUR (+35.9% compared to year-end 2013)
mEUR 9M 2013
9M2014
%YoY
EBITDA 31.8 38.8 +22.1%
Operating cash flow 28.7 36.5 +27.4%
Conversion rate* 90% 94%
Investing cash flow -3.9 -3.6
Free cash flow 24.8 33.0 +32.8%
* Operating cash flow / EBITDA
Acquisition of Bluebeam will be financed via our high cash reserves and taking out a loan
48,6
33,0-12,5 -3,1
66,0
Net cashFY 2013
Free cashflow 9M
2014
Dividendpayout
Other Net cash9M 2014
21

22
Agenda
Nemetschek Group: In brief
Strategy
Financial data 9-month 2014
Nemetschek share
Why invest?

Stable shareholder structure
5.2%
48.4%
46.4%
Prof. Georg NemetschekNemetschek Vermögensverwaltungs GmbH & Co KGFree float
Founded: in 1963IPO: March 10, 1999Number of shares: 9,625,000Frankfurt Stock Exchange, Prime StandardBloomberg: NEM GY, Reuters: NEKG.DEShares Nemetschek family: 53.57%Freefloat: 46.43 percentCurrent MarketCap: ~ 770 mEURCurrent TecDAX Ranking: 23/31
Shares of Nemetschek family pooled: secures stable shareholder structure for well-being of Nemetschek Group in the future
23
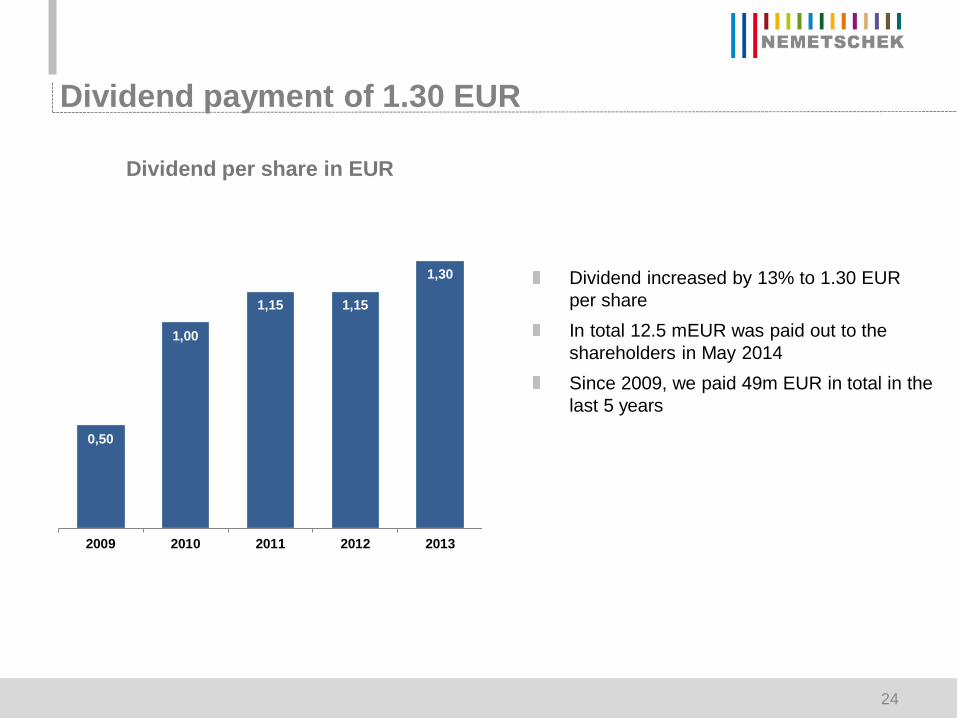
Dividend payment of 1.30 EUR
Dividend per share in EUR
Dividend increased by 13% to 1.30 EUR per share In total 12.5 mEUR was paid out to the shareholders in May 2014Since 2009, we paid 49m EUR in total in the last 5 years
0,50
1,00
1,15 1,15
1,30
0,00
0,20
0,40
0,60
0,80
1,00
1,20
1,40
2009 2010 2011 2012 2013
24
25
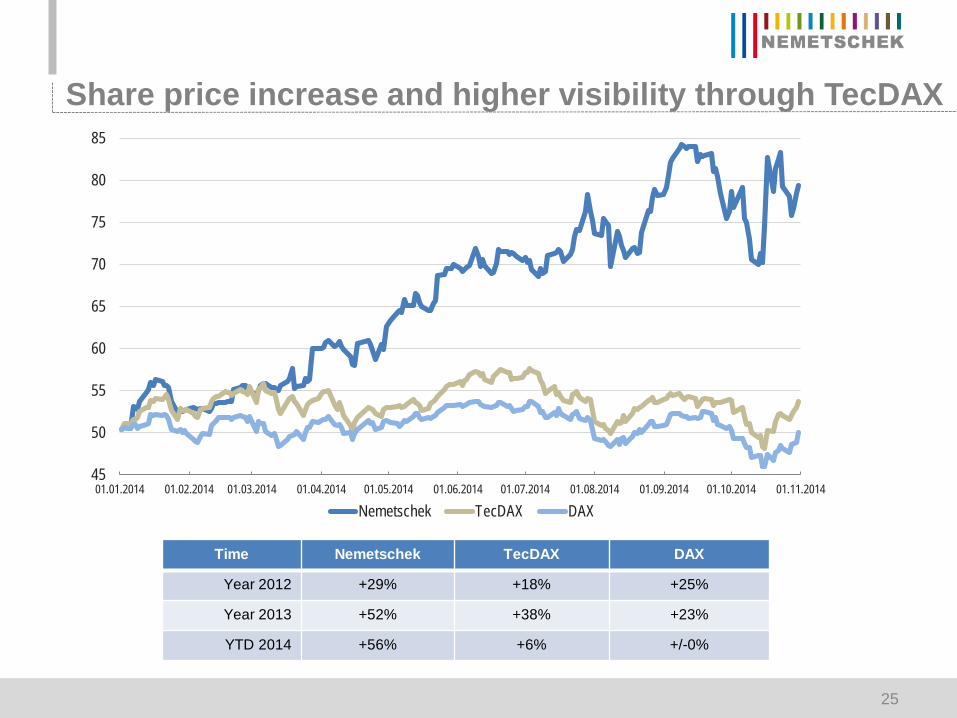
Time Nemetschek TecDAX DAX
Year 2012 +29% +18% +25%
Year 2013 +52% +38% +23%
YTD 2014 +56% +6% +/-0%
Share price increase and higher visibility through TecDAX
45
50
55
60
65
70
75
80
85
01.01.2014 01.02.2014 01.03.2014 01.04.2014 01.05.2014 01.06.2014 01.07.2014 01.08.2014 01.09.2014 01.10.2014 01.11.2014
Nemetschek TecDAX DAX
26
Agenda
Nemetschek Group: In brief
Strategy
Financial data 9-month 2014
Nemetschek share
Why invest?

Strategic market • Clear focus on AEC marketpositioning • Leading in Open BIM solutions and 5D
• Strong global brands• Focus on customer needs• Very good reputation at renowned customers
27
Investment highlights
Healthy financial • High margin business• Strong cash generation• Healthy balance sheet
Growth potential • Attractive, innovative solution portfolio for the AEC industry• Strengthen Nemetschek’s position abroad• Capable of investing in inorganic growth• Driving innovations for an industry whose transformation has just begun

Growth factors • Acquisition of innovative, strong growing US software provider Bluebeam• Two investments in the promising BIM 5D market• Trends such as BIM, 5D, collaboration, digitalization, cloud, mobile
drive the market
28
Outlook 2014 confirmed
Guidance • 9-month figures are strong basis for further growth • Additional growth trough Bluebeam (consolidation starts in Nov.)• Revenue forecast increased
Market conditions • Macroeconomic indicators slowed down • Solid growth in the AEC market worldwide • General trends (BIM, 5D etc.) are growth drivers
Revenues:
211 - 216 mEUR(formerly 207 – 212 mEUR)
EBITDA margin:
23 - 25%
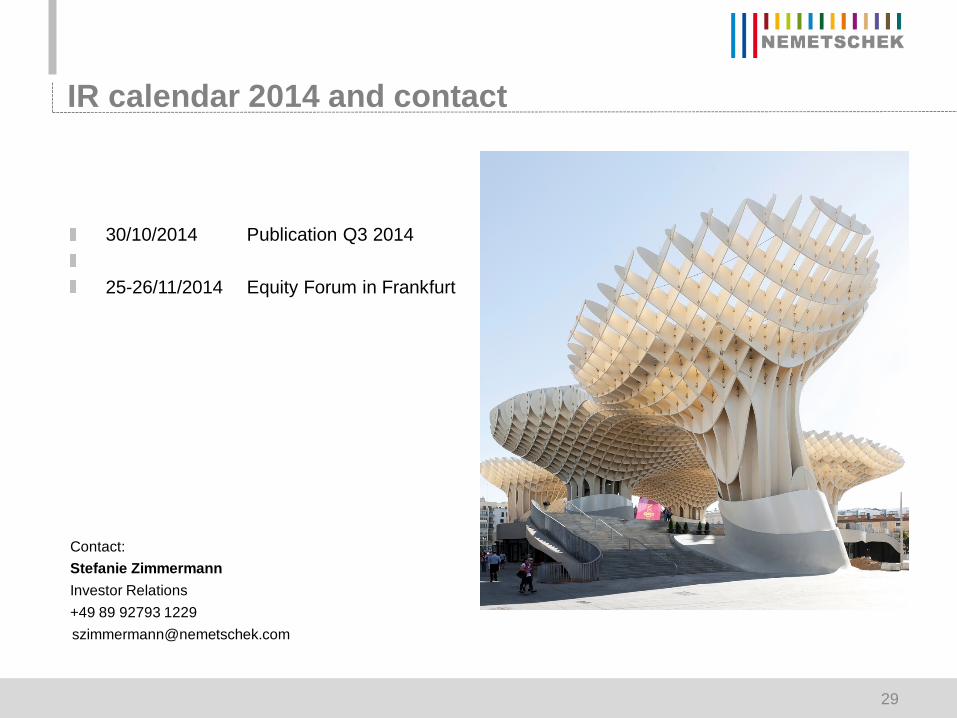
IR calendar 2014 and contact
Contact:Stefanie ZimmermannInvestor Relations+49 89 92793 [email protected]
30/10/2014 Publication Q3 2014
25-26/11/2014 Equity Forum in Frankfurt
29

P+L statement – Q3 / 9-month comparisonmEUR Q3 2014 Q3 2013 % YoY 9M 2014 9M 2013 % YoY
Revenues 51.2 45.8 +11.9% 153.5 134.2 +14.3%
Own work capitalized/ other operating income 1.0 0.7 +41.0% 2.7 2.7 -0.5%
Operating income 52.2 46.5 +12.3% 156.1 136.9 +14.0%
Cost of materials/ purchased services -2.1 -2.0 +5.1% -5.9 -6.3 -5.9%
Personnel expenses -21.7 -19.3 +12.2% -66.2 -57.7 +14.6%
Other operating expenses -15.2 -13.7 +10.5% -45.2 -41.1 +10.1%
Operating costs -39.0 -35.0 +11.1% -117.3 -105.1 +11.6%
EBITDA 13.2 11.4 +16.0% 38.8 31.8 +22.1%
Margin 25.9% 25.0% 25.3% 23.7%
Depreciation of PPE and amortization -2.4 -2.6 -9.0% -6.6 -7.8 -15.2%
Thereof PPA -1.0 -1.6 -3.0 -4.7
EBITA (normalized EBIT) 11.9 10.4 +14.6% 35.2 28.6 +22.8%
EBIT 10.9 8.8 +23.4% 32.2 24.0 +34.3%
Financial result 0 0 0 0
EBT 10.9 8.8 +23.5% 32.2 24.0 +34.3%
Income taxes -2.6 -2.2 +16.3% -8.7 -6.5 +34.3%
Minorities 0.4 0.3 1.2 0.8
Net income (group shares) 7.9 6.3 +25.3% 22.3 16.7 +33.7%
EPS in EUR 0.82 0.66 +25.3% 2.32 1.74 +33.7%
30
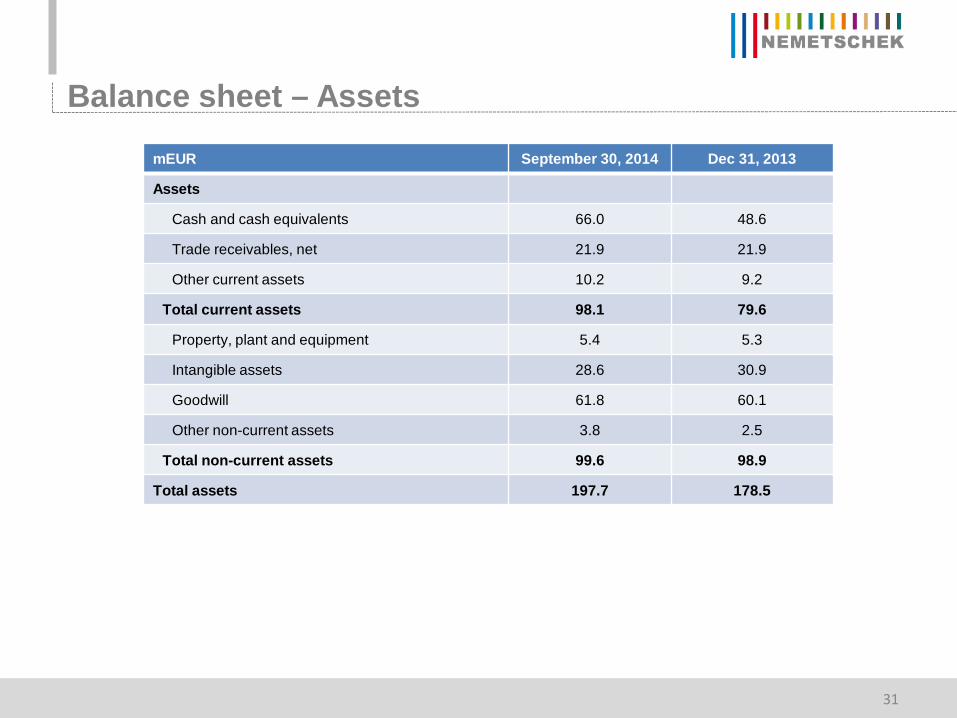
Balance sheet – Assets
mEUR September 30, 2014 Dec 31, 2013
Assets
Cash and cash equivalents 66.0 48.6
Trade receivables, net 21.9 21.9
Other current assets 10.2 9.2
Total current assets 98.1 79.6
Property, plant and equipment 5.4 5.3
Intangible assets 28.6 30.9
Goodwill 61.8 60.1
Other non-current assets 3.8 2.5
Total non-current assets 99.6 98.9
Total assets 197.7 178.5
31

Balance sheet – Equity and liabilities
mEUR September 30, 2014 Dec 31, 2013
Equity and liabilities
Trade payables & accrued liabilities 19.7 20.1
Deferred revenue 32.6 23.5
Other current liabilities 11.0 10.4
Total current liabilities 63.3 54.0
Deferred tax liabilities 4.1 4.1
Other non-current liabilities 4.0 2.3
Total non-current liabilities 8.1 6.4
Subscribed capital and capital reserve 51.0 51.0
Other comprehensive income -13.2 -12.8
Retained earnings 87.6 78.3
Minority interests 1.0 1.6
Total equity 126.4 118.2
Total equity and liabilities 197.7 178.5
32
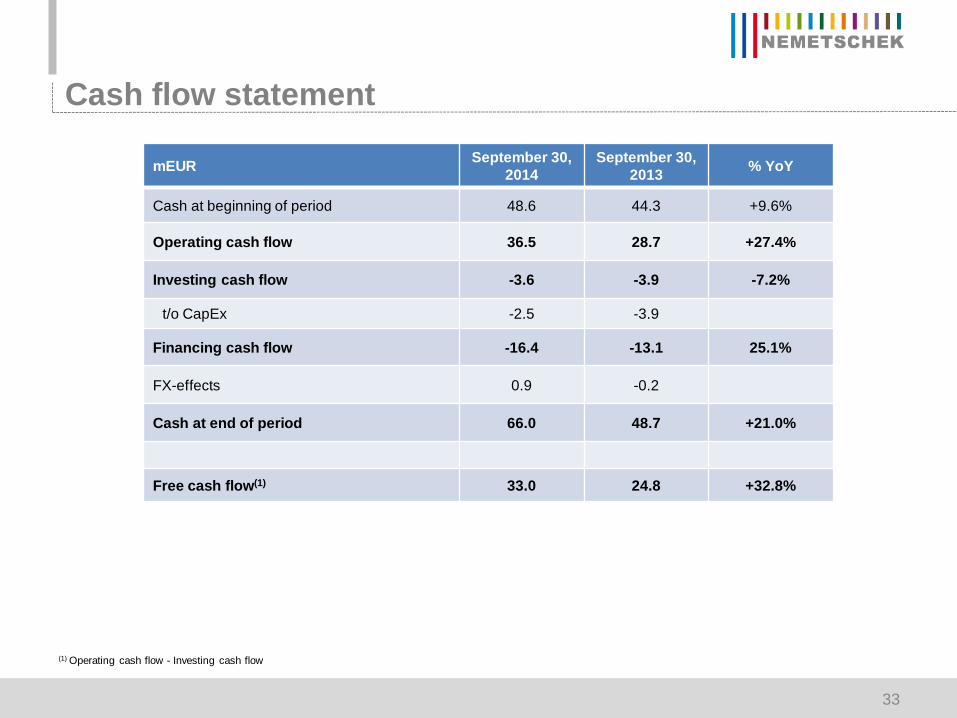
Cash flow statement
mEUR September 30, 2014
September 30, 2013 % YoY
Cash at beginning of period 48.6 44.3 +9.6%
Operating cash flow 36.5 28.7 +27.4%
Investing cash flow -3.6 -3.9 -7.2%
t/o CapEx -2.5 -3.9
Financing cash flow -16.4 -13.1 25.1%
FX-effects 0.9 -0.2
Cash at end of period 66.0 48.7 +21.0%
Free cash flow(1) 33.0 24.8 +32.8%
(1) Operating cash flow - Investing cash flow
33
Disclaimer
This presentation contains forward-looking statements based on the beliefs of Nemetschek AGmanagement. Such statements reflect current views of Nemetschek AG with respect to future eventsand results and are subject to risks and uncertainties. Actual results may vary materially from thoseprojected here, due to factors including changes in general economic and business conditions,changes in currency exchange, the introduction of competing products, lack of market acceptance ofnew products, services or technologies and changes in business strategy. Nemetschek AG does notintend or assume any obligation to update these forward-looking statements.
34


](https://static.documents.pub/doc/80x56/5562ac71d8b42a7c4a8b51ad/presentation15-b15d5b15d1carolina-panthersgalea.jpg)

![Diverticulosis%5B1%5D %5BAutosaved%5D[1]](https://static.documents.pub/doc/80x56/577d38db1a28ab3a6b989f85/diverticulosis5b15d-5bautosaved5d1.jpg)


