Contents lists available at SciVerse ScienceDirect
Tectonophysics
j ourna l homepage: www.e lsev ie r .com/ locate / tecto
Neoarchaean tectonic history of the Witwatersrand Basin and VentersdorpSupergroup: New constraints from high-resolution 3D seismic reflection data
Musa S.D. Manzi a,⁎, Kim A.A. Hein a,1, Nick King b,2, Raymond J. Durrheim a,c
a School of Geosciences, University of the Witwatersrand Johannesburg, PBag 3, WITS, 2050, Republic of South Africab South Deep Gold Mine, Gold Fields Limited, Republic of South Africac Council for Scientific and Industrial Research (CSIR) and University of the Witwatersrand, Johannesburg, Republic of South Africa
First-order scale structures in the West Wits Line and West Rand goldfields of the Witwatersrand Basin (SouthAfrica) were mapped using the high-resolution 3D reflection seismic method. Structural models constrain themagnitude of displacement of thrusts and faults, the gross structural architecture and Neoarchaean tectonic evo-lution of the West Rand and Bank fault zones, which offset the gold-bearing reefs of the basin.The merging of several 3D seismic surveys made clear the gross strato-structural architecture of the gold-fields; a macroscopic fold-thrust belt is crosscut by a macroscopic extensional fault array. These are dissected,eroded and overlain by the Transvaal Supergroup above an angular unconformity.The seismic sections confirm that the West Rand Group (ca. 2985–2902 Ma) is unconformably overlain bythe Central Rand Group (ca. 2902–2849 Ma), with tilting of the West Rand Group syn- to post-erosion atca. 2.9 Ga. The seismic sections also confirm that an unconformable relationship exists between the CentralRand Group and the auriferous Ventersdorp Contact Reef (VCR), with an easterly-verging fold-thrust beltbeing initiated concomitant to deposition of the VCR at approximately 2.72 Ga. Fold-thrust formation includ-ed development of the (1) newly identified first-order scale Libanon Anticline, (2) Tandeka and Jabulanithrusts which displace the West Rand Group, and (3) parasite folds.The fold-thrust belt is crosscut by a macroscopic extensional fault array (or rift-like system of faults) whichincepted towards the end of extrusion of the Ventersdorp lavas, and certainly during deposition of thePlatberg Group (2709–2643 Ma) when a mantle plume may have heated the lithosphere. The West Randand Bank fault zones formed at this time and include (1) the West Rand and Bank faults which are scissorsfaults; (2) second and third-order scale normal faults in the immediate footwall and hanging wall of thefaults; (3) drag synclines, and (4) rollover anticlines.
The West Wits Line and West Rand goldfields of the MesoarchaeanWitwatersrand Basin (Fig. 1) have been the focus of renewed interestin recent years in terms of their strato-structural and geophysical archi-tecture (Beach and Smith, 2007; Dankert and Hein, 2010; Frimmel andMinter, 2002; Mambane et al., 2011; Manzi et al., 2012a; Mashabella,2011; Mohale, 2010). The studies undertaken by Coward et al. (1995),Beach and Smith (2007), Dankert and Hein (2010), Jolley et al. (2007)and others confirm that the basin experienced more than one episodeof deformation although Dankert and Hein (2010) pointed out that
M.S.D. Manzi),dfields.co.za (N. King),
rights reserved.
surprisingly little regional-scale kinematic and structural analysis hastaken place across the Witwatersrand Basin despite more than100 years of mining of gold. However, it is generally agreed that theWitwatersrand Basin underwent inversion tectonics during and afterdeposition of the quartzite and conglomerate units (some auriferous)of the Central Rand Group, from extension to compression i.e. positiveinversion (c.f., Beach and Smith, 2007; Dankert and Hein, 2010), andthen compression to extension (i.e. negative inversion) during deposi-tion of the Ventersdorp Supergroup (Van der Westhuizen et al., 1991).
Listric faults in the Witwatersrand Basin were recognized byCoward et al. (1995) and Vermaakt and Chunnet (1994) throughstudies in gold mines in theWest Wits Line andWest Rand goldfields,and by Beach and Smith (2007), Gibson et al. (2000, 2004) andGibson (2005) through the interpretation of 3D seismic reflectiondata. Beach and Smith (2007) showed that the dominant structuralstyles, including major normal fault zones and their related dragfolds, are those attributed to extensional tectonics that occurred dur-ing deposition of the Ventersdorp Supergroup (ca. 2709–2643 Ma)possibly during deposition of the Platberg Group.
Fig. 1. Location map of the West Rand andWest Wits Line (Carletonville) goldfields of theWitwatersrand Basin in South Africa, showing historical 3D seismic reflection surveys (modified after Dankert and Hein, 2010; historical surveys afterGibson et al., 2000). Generalized seismic stratigraphy and tectonic events, with dates and ages are derived from Armstrong et al. (1991), Dankert and Hein (2010), Kositcin and Krapež (2004) and Myers et al. (1989). Note that Driefonteinand Kloof gold mines have been re-named KDCWEST and KDC EAST, respectively. KDC: Kloof-Driefontein Complex; WUDLs: Western Ultra Deep levels; VCR: Ventersdorp Contact Reef; BLR: Black Reef Formation. aUnpublished; bMartin et al.(1998; zircon U–Pb SHRIMP); c,eArmstrong et al. (1991; single zircon U–Pb SHRIMP); dKositcin and Krapež (2004; zircon U–Pb SHRIMP).
95M.S.D
.Manziet
al./Tectonophysics
590(2013)
94–105
96 M.S.D. Manzi et al. / Tectonophysics 590 (2013) 94–105
Further to this, previous structural models of the WitwatersrandBasin were constrained by low resolution 3D seismic surveys thatcovered the region to the west of the Bank Fault (Beach and Smith,2007; Gibson et al., 2000; Jolley et al., 2007). Little or no coverage ofthe eastern side of the fault (West Rand goldfields) was incorporated.
In this study, the interpretation of high-resolution 3D seismic reflec-tion data that covers the West Wits Line and West Rand goldfields ispresented, and includes studies across the Driefontein Block (nowtermed KDC West), the Kloof Block (now termed the KDC East), andthe South Deeps Block (Fig. 1). The structural studies of the entirereprocessed and merged dataset are unique and are herein reportedfor the first time. The data was used to study the structural setting,mainly the first-order scale structures, but also their associatedsecond- and third-order faults and folds. Focuswas given to (1) fault ge-ometry, fault form, and fault-throw analysis, and (2) the relative chro-nology of tectonic events. The results were integrated with boreholedata and underground maps to validate the seismic and Neoarchaeantectonic interpretations.
The data has also been used by Manzi et al. (2012a) to map poten-tial conduits of water and methane in the deep gold mines covered bythe seismic volume. It has been used in the application of 3D seismictechnique in evaluation of ore resources and is reported by Manzi etal. (2012b), and for mapping the distribution and timing of meso-to mega-scale structures and provide constraints on the ore geneticmodels (Malehmir et al., in press).
2. Geological setting
TheMesoarchaeanWitwatersrand Basin, one of theworld's premiergold regions and the greatest known source of gold on Earth, was de-posited between ca. 2985 and 2849 Ma (Kositcin and Krapež, 2004)on the Kaapvaal Craton (ca. 3.6–3.2 Ga). The Witwatersrand Super-group overlies the Dominion Group (ca. 3074±6 Ma, Myers et al.,1989; U–Pb detrital zircon SHRIMP), and is made up of coarse clasticrocks and bimodal volcanic rocks. The Witwatersrand Supergroup con-sists of the West Rand and Central Rand groups (Fig. 1).
The West Rand Group unconformably overlies the Dominion Groupwith clastic and largely marine sedimentary rocks (ca. 2985–2902 Ma;Kositcin and Krapež, 2004; U–Pb detrital zircon SHRIMP). This sequencewas deposited in a tectonically stable environment of the volcano-sedimentary succession of the Dominion Group (c.f., Beach and Smith,2007; Frimmel and Minter, 2002). The West Rand Group is dividedinto three formations, namely the Discovery, Crown and Jeppestown for-mations. The Crown Formation is a seismically recognizable marker be-cause of a relatively high acoustic impedance contrast between theoverlying volcanic rocks and underlying shale units.
Unconformably overlying the West Rand Group are sandstone,conglomerate and shale units of the Central Rand Group (ca. 2902–2849 Ma; Kositcin and Krapež, 2004; U–Pb detrital zircon SHRIMP),which were deposited in a braided system of rivers of a shallow ma-rine delta. The group hosts the majority of the auriferous reefs thatare mined throughout the basin including the Elsberg, Kloof, Libanonand Kimberly reefs of the Johannesburg Subgroup, and Bird, CarbonLeader, North Leader and Middelvlei reefs of the Turffontein Sub-group (De Kock, 1964). The basin-wide Booysens Formation (se-quence of laminated shale units) has been used as a stratigraphicmarker to subdivide the Johannesburg Subgroup from the TurffonteinSubgroup (McCarthy, 2006; Minter, 1982). Numerous erosional sur-faces are hosted by the Central Rand Group dividing it into fluvialand marine repositories of sedimentation.
Synchronous to, and/or after deposition of the Central Rand Group,the sedimentary rocks of the Witwatersrand Basin were deformedwith development of an easterly-verging fold-thrust belt (Beach andSmith, 2007) during the Umzawami Event (Dankert and Hein, 2010)at ca 2.73 Ga. Tectonic transport was from west to east (Beach andSmith, 2007).
The upper part of the Central RandGroup is unconformably overlainby the Ventersdorp Contact Reef (VCR) of the Venterspost Formation,which has the maximum age of 2729±19 Ma (Kositcin and Krapež,2004; U–Pb detrital zircon SHRIMP). The Venterspost Formation con-sists of a thin fluvial auriferous conglomerate. The VCR represents anerosional surface that formed at the end of deposition of the CentralRand Group (Frimmel et al., 1999; Gartz and Frimmel, 1999; Gibson,2004, 2005; McCarthy, 2006; Tankard et al., 1982). It unconformablyoverlies and truncates approximately 2500 m stratigraphic thicknessof Witwatersrand Supergroup sediments (Myers et al., 1989; Robb etal., 1991; Spencer, 1992;Winter, 1994). The depth of the VCR unconfor-mity is approximately 3000–4200 m below surface. The conglomeratesof the VCR are too thin (less than 1.5 m) to be directly resolved seismi-cally because they fall below the tuning thickness or resolution limit,which is given by ¼ seismic dominant wavelength (λ), where λ=v/f(Widess, 1973). Our data is characterized by the frequency (f) of65 Hz and a mean velocity (v) of 6500 m/s, thus providing the tuningthickness of 25 m. This implies that the top and bottom of any reefwith a thickness less than 25 m may not be resolved. However, theVCR unconformity coincideswith a reflective interface or strong seismicreflector resulting from a major acoustic impedance contrast betweenmetamorphosed basalts of the KlipriviersbergGroup (~6400 m/s veloc-ity) and quartzite units at the top of the Central RandGroup (~5700 m/svelocity).
Unconformably overlying the VCR is the Neoarchaean VentersdorpSupergroup (ca. 2.72–2.63 Ga), which comprises ultramafic and maficmetavolcanic rocks of the Klipriviersberg Group, and metasedimentaryrocks and bimodal metavolcanic rocks of the Platberg Group (Crow andCondie, 1988; Van der Westhuizen et al., 1991). The KlipriviersbergGroup is divided into five formations, i.e. the Westonaria, Alberton,Orkney, Jeannette, and Edenville formations. The Alberton Formationis dated at 2714±8 Ma (Armstrong et al. 1991; U–Pb detrital zirconSHRIMP). The emplacement of the Ventersdorp Supergroup may havecoincided with global-scale mantle overturning that witnessedmassivegranite–greenstone belt formation in the Yilgarn and Superior cratons,and concomitant to the impingement of a superplume beneath theKaapvaal Craton (Eriksson et al., 2007).
Bimodal metavolcanic and clastic metasedimentary rocks of thePlatberg Group overlie the Klipriviersberg Group (ca. 2709±8 Ma;c.f., Crow and Condie, 1988; Dankert and Hein, 2010) and Pniel Group(Jolley et al., 2004; Phillips and Law, 2000). The meta-sedimentaryandmeta-volcanic succession of the Platberg Group is exposed in sever-al boreholes in theWest Wits Line (De Kock, 1964). The group attains amaximum thickness of approximately 330 m and consists of boulders,cobbles, and fragments of (mainly) amygdaloidal metavolcanic rocks,with subordinate amounts of quartzite, chert and shale (Engelbrechtet al., 1986).
Unconformably overlying the Ventersdorp Supergroup is the rela-tively thin Black Reef Formation, which has been interpreted as thebasal lithostratigraphic unit of the Palaeoproterozoic Transvaal Su-pergroup (ca. 2588±6 Ma; Jolley et al., 2004; Krapež, 1985; Vos,1975). The formation consists of a lower quartzite unit, with a sporad-ically developed conglomerate at the base, overlain by interbedded,black carbonaceous shale and dolomite beds in the upper portion.The Black Reef Formation (BLF) represents a highly reflective inter-face due to a major laterally extensive acoustic impedance contrastbetween high-velocity, high density dolomite of the ChuniespoortGroup of the Transvaal Supergroup and the underlying low-velocity,less dense Ventersdorp metabasalts.
Above the BLF, the Transvaal Supergroup is divided into theChuniespoort Group and the Pretoria Group. The Chuniespoort Groupconsists of carbonate (dolomite), banded iron formation and lacustrinedeposits (Eriksson et al., 1995, 2007; Frimmel, 2005). The PretoriaGroup (~6-7 km thick), which predominantly consists of intercalatedmudstone–sandstone units, andesite and subordinate conglomeratebeds, diamictite and carbonate units, non-conformably overlies the
97M.S.D. Manzi et al. / Tectonophysics 590 (2013) 94–105
Chuniespoort Group (Eriksson et al., 2007; SACS, 1980); a hiatus of 80My has been proposed by Eriksson and Reczko (1995) and Eriksson etal. (1995, 2006) between the Chuniespoort and Pretoria groups. Thenon-conformity represents a reflective interface between the overlyinglow velocity volcanic rocks of the Pretoria Group and the underlyinghigh velocity dolomites of the Chuniespoort Group.
Prior to deposition of the Transvaal Basin, themeta-sedimentary andmeta-volcanic rocks of the Witwatersrand and Ventersdorp super-groups underwent extensional tectonics (c.f., Dankert and Hein, 2010;Gartz and Frimmel, 1999; Roering, 1990). Normal fault activity and ex-tension arguably accompanied emplacement of the KlipriviersbergGroup, and culminated in graben formation and deposition of thePlatberg Group. The base of the BLF of the Transvaal Supergroup cross-cuts earlier tectono-stratigraphy (Coward et al., 1995; Gibson et al.,2000) and a hiatus of approximately 100 Ma marks the transitionfrom the Ventersdorp Supergroup sequences to the Transvaal Basin se-quences (Dankert and Hein, 2010; Phillips and Law, 2000).
3. Methodology
The seismic dataset and the method of collection and processing aredescribed by Manzi et al. (2012a,b). In summary, in 2003, Gold FieldsLtd conducted a high-resolution 3D seismic reflection survey, targetedat the down-dip portion of the Kloof Gold Mine (in the West Wits Linegoldfield), which is locatedwest of theWest Rand Fault (Fig. 1). The sur-vey was designed to overlap a 3D seismic survey undertaken atLeeudoorn in 1994; the Leeudoorn dataset was re-processed using thelatest processing algorithms, and merged with the 2003 Kloof-SouthDeep data to produce a single seismic cube. This cube was merged(post-migration) with the Western Ultra Deep Levels survey (WUDLs),and incorporated into one continuous volume (>7040 km3).
Interpretation of the Ventersdorp Contact Reef (VCR) and the BlackReef (BLR)were of particular interest in this study. They form importantgeophysical markers across the study area andwere interpreted to con-strain pre- to post-Central Rand Group age structures. Based on intervalvelocities, the VCRwas picked as a peak because of the decrease in seis-mic velocity from the overlying Ventersdorp metabasalts (approx6400 m/s) to the underlying Central Rand quartzite units (approx.5750 m/s).
To map the first-order scale structures, the seismic sections wereinitially interpreted at wide-line spacing, i.e., every fifth crosslineand inline of the seismic volume. Once a wide grid of picks was com-pleted, infill picks were made at close line spacing, facilitating de-tailed structural interpretation. To make sure that subtle faults werenot missed during the picking, each seismic line was interpreted.
However, the only faults that could be clearly seen in seismicsections during conventional interpretation were those with throws(displacements) greater than, or equal to a one-quarter dominantwavelength (λ) i.e.,
v4f
where v is the mean velocity and f is the peak frequency of the wave-length (Yilmaz, 1987). The one-quarter dominant wavelength is thewidely accepted seismic resolution limit for detection of faults(Lindesay, 1989; Yilmaz, 1987). The peak frequency obtained during3D seismic acquisition over the West Wits Line and West Rand areasis 65 Hz, and 6500 m/s is a good mean velocity value observed duringprocessing. These parameters provide 100 m dominant wavelength.By using the equation above, faults with a throw of less than 25 m fellbelow the seismic resolution limit.
Therefore at the scale of the goldfield (study area) the first-orderscale structures refer to faults with a throw of 400 m to 2.5 km. Thesecond-order scale structures refer to faults with a throw of lessthan 400 m, but greater than conventional one-quarter wavelength,
i.e., 25 m. Third-order scale structures refer to faults with a throw ofless than one-quarter of a wavelength; these are not visible on theoriginal migrated seismic sections, however, they can be resolvedusing horizon-based attribute analysis.
4. West Rand Fault Zone (WRFZ)
TheWest Rand Fault Zone includes; (1) theWest Rand Fault (WRF),which is approximately 1.0 km wide, (2) faults in the immediate foot-wall and hanging wall of the WRF, and (3) the Kloof syncline (drag)which lies parallel to the WRF in the hanging wall (Figs. 2, 3a). Thefault damage zone is therefore approximately 4.2 km wide. Approxi-mately 1.25 km below theWRF (in depth), the seismic section resolvesa reverse fault that displaces and offsets theWest Rand Group. The faultis hereafter named the Tandeka Thrust. The Kloof syncline, in the hang-ing wall to the WRF, is 4 km long and trends north–northwest (Gibsonet al., 2000; McCarthy, 2006).
The WRF is north–northeast trending and west-dipping. It is listricin form; 65°–70°W in dip at 1.5 km depth; 40°W in dip at 3.0–3.5 kmdepth; 5°–10°W dip within shale units at the top of the West RandGroup in which it forms a décollement horizon. The WRF has a maxi-mum normal throw of 1.6–2.0 km and an (apparent) sinistral offset of600 m (Figs. 2, 3a). Normal fault displacement is associated with mac-roscopic clockwise fault block rotation and failure of the hanging wall(the Kloof Block), with development of secondary and tertiary accom-modation (synthetic faults).
Displacement is unequal along the length of the WRF such that itbroadly forms a scissor that is hinged in the south–southwest. In thenorth–northeast, near Cooke Shaft 7 (Fig. 1), second-order antitheticfaults splay-off the WRF into the footwall. The graphical distributionof throw, as shown in Fig. 3b, gradually reaches zero near Kloof Shaft3 where the Kloof and South Deep blocks are hinged. The graph sug-gests that the West Rand fault system has a predictable throw, butcurve roughness occurs where subordinate structures form splays. To-wards the north of the survey area (northeast of Kloof 6) the WRF isnot imaged as a single fault but resolves two major north–northeasttrending normal fault segments (dipping at ~60° to the west) thatbound a 1 km long by 250 m wide VCR block.
The seismic sections show that the WRF crosscuts and offsets (nor-mal) the West Rand Group (ca. 2985–2902 Ma), the Central RandGroup (ca. 2902–2849 Ma) and the Ventersdorp Supergroup (ca.2714 Ma), thus constraining the relative age of the normal fault dis-placement to post-2714 Ma. Importantly, theWRF fault does not pene-trate the base of the Chuniespoort Group (ca. 2588 Ma) of the TransvaalBasin. Thus the WRF was not active during the formation of the Trans-vaal Basin. Extension on the WRF is thereby restricted to theNeoarchaean, or between 2714 Ma and 2588 Ma.
5. Bank Fault Zone (BFZ)
The Bank Fault Zone (BFZ) is interpreted as the first-order scalestructure that forms the boundary between the Kloof Block to the eastand theDriefontein-WUDLs Block to thewest (or KDC east andwest, re-spectively). The BFZ includes; (1) the Bank Fault (BF), which is approx-imately 1.5 km wide, and (2) second-order faults in the hanging walland footwall damage zones (Figs. 2, 4a). Approximately 1.5 km belowthe BFZ (in depth), the seismic section resolves a reverse fault that issimilar in orientation to the BFZ; the fault is hereafter named theJabulani Thrust (JT). It dips 5°–10° W.
Similar to theWRF, seismic plans and sections of the BF demonstrateit is north–northeast-trending andwest-dipping. It is listric in form; 65°–75°W in dip at 3.5 kmdepth; 40°W in dip at 5.0–5.5 kmdepth; 5°–10°Win dip at 7.5 km depth in shale units of theWest Rand Group in which itforms a décollement horizon. The BF has a maximum normal throw of2.0–2.5 kmand an apparent sinistral offset of 800 m (Figs. 2, 4a). Normalfault displacement was associated with macroscopic clockwise fault
Fig. 2. Seismic model across theWitwatersrand goldfields. (a) 3D regional seismic model incorporating the BLR, Ventersdorp lavas, VCR and B. Shale. The model shows the geometryof West Rand Fault, Bank Fault and Libanon Anticline. (b) Regional crossline seismic section (line AA′ in Fig. 1) through WUDLs, Driefontein, Kloof and South Deep surveys, showingWRF and BF zones and their adjacent TT and JT, respectively. WRF: West Rand Fault; BF: Bank Fault; TF: Tandeka Thrust; JT: Jabulani Thrust; WRG: West Rand Group; CRG: CentralRand Group; Klip: Klipriviersberg; VCR: Ventersdorp Contact Reef; BLR: Black Reef Formation; B. Shale: Booysens Shale.
98 M.S.D. Manzi et al. / Tectonophysics 590 (2013) 94–105
block rotation of the hanging wall (the Driefontein-WUDLs Block), withdevelopment of a rollover anticline (sensu-stricto).
The BF at 3.0–6.0 km depth separates high amplitude reflectors inthe hanging wall to the fault from low frequency seismic events in thefootwall to the fault. The origin of the high amplitude reflectors is uncer-tain but may characterize brecciated or mylonitised zones similar tothose described by Engelbrecht et al. (1986), Fletcher and Gay (1971),Fletcher and Reimold (1989), and Vermaakt (1995) that associatewith the bedding-parallel Master Bedding Fault in the West Wits Linegoldfield, or may represent intrusions.
Similar to the WRF, displacement is unequal along the length of theBF; the BF broadly forms a scissor that is hinged in the south–southwest.Second-order antithetic faults also splay off the BF into the footwall toform a macroscopic breccia. The graphical distribution of throw, asshown in Fig. 4b, gradually reaches zero where the Driefontein-WUDLsand Kloof blocks are hinged. The graph suggests that the BF has a pre-dictable throw, but curve roughness occurs where subordinate struc-tures form splays.
In concert with theWRF, the BF crosscuts and offsets theWest RandGroup, Central Rand Group and Ventersdorp Supergroup, but does notbreach the base of the Transvaal Basin; normal displacement on theBF predates deposition in the Transvaal Basin. However, the evidencethat the Ventersdorp Supergroup forms a wedge and possible rolloveragainst the BF constrains the relative age of the normal faulting on theBF to between 2714 Ma and 2588 Ma.
6. South Deep Block
The South Deep block is bounded by the west-dipping WRF (Figs. 2,3a). The South Deep Block has a consistent geometry; the dip of 5°–10°south is generally constant for all imaged stratigraphic boundaries frombase of the Transvaal Basin down through to the West Rand Group. De-tailed seismic interpretations indicated that a fault-parallel anticline-syncline pair (termed the Panvlakte anticline–syncline pair or PAS) sub-tends theWRF in the footwall. Thewavelength and amplitude of the PASis 1.6 km and 200 m, respectively. The PAS anticline is locally known asthe Panvlakte Anticline (McCarthy, 2006).
The folds are open and symmetrical in form and periclinal, plungingshallowly north–northeast and south–southwest. The hinge plane ofthe folds lies parallel to the plane of the WRF (dipping at approximately40°–50° W). The PAS coalesces and terminates against second-orderfaults near Kloof KEA Shaft in the southwest of the study area, and nearKloof Shaft 2 in the northeast of the study area. The PAS is interpretedto have formed prior to normal faulting on the WRF because the WRFcrosscuts and breaches the western limb of the Panvlakte Anticline.
Furthermore, the PAS is crosscut by a series of steeply east-dippingsecond-order normal faults that postdate fold formation. A series ofhorst and grabens are resolved including the Panvlakte Horst de-scribed by McCarthy (2006) (Fig. 3a).
The PAS is also overprinted by a series of steeply-dipping northeast,north–south and east–west trending normal faults that are variously
99M.S.D. Manzi et al. / Tectonophysics 590 (2013) 94–105
intruded by dykes of the Klipriviersberg Group. Normal fault throw ismeters to tens of meters. The faults are interpreted to have formed dur-ing instability created in the footwall block during normal displacementon the WRF and postdate formation of the PAS.
Additionally, although the Panvlakte Anticline has been interpreted asa drag or rollover fold by Mashabella (2011) and McCarthy (2006)showed that it formed by flexural-slip folding on bedding planes priorto dissection by the WRF, which means it formed during compressionand not extension. It subsequently collapsed during normal displacement
Fig. 3. (a) Seismic section (line BB′ in Fig. 1) across the listric West Rand Fault, showing the sblock (South Deeps). (b) Displacement (throw) measured in seismic sections perpendicularVentersdorp Contact Reef; WRG: West Rand Group; CRG: Central Rand Group; PAS: Panvla
on the WRF and synchronous to extrusion of lavas of the VentersdorpSupergroup.
Summarily, the gross geometry of the footwall to the WRF is that ofan open anticline–syncline fold pair (PAS) that failed during extensionaltectonics to form a macroscopic collapse breccia with blocks 100s ofmeters in size. Blocks are bounded by second- and third-order scalenormal faults that resolved a horst and graben topography (includingthe Panvlakte Horst), while some blocks are wholly bounded by dykesof the Klipriviersberg Group. This suggests that these faults may have
teeply dipping hanging wall (Kloof block), Tandeka Thrust and PAS-pair in the footwallto the West Rand Fault strike at 250 m interval. FW: Footwall; HW: Hanging wall; VCR:kte Anticline Syncline.
100 M.S.D. Manzi et al. / Tectonophysics 590 (2013) 94–105
been active syn-emplacement of the (comagmatic) Klipriviersberglavas, but offset on some Klipriviersberg dykes may indicate that thefaults were active post-emplacement aswell. The age of normal faultingis thereby constrained to post-2714 Ma, which is themaximum age forthe Klipriviersberg Group.
7. Kloof Block (KDC East)
The Kloof Block is situated between the WRF and the BFZ andhosts the Jabulani Thrust Complex (Figs. 2, 3a). The block hosts thenortherly-trending first-order scale Libanon Anticline, the crest of
Fig. 4. (a) Seismic section (line CC′ in Fig. 1) across the listric Bank Fault, showing the hangingw(b) Displacement (throw)measured in seismic sections perpendicular to the Bank Fault strike aWest Rand Group; CRG: Central Rand Group.
which is partially decapitated by the north–northeast trending BFZ(Fig. 5). The wavelength of the anticline is greater than 8 km andthe amplitude is 2 km. The eastern limb of the Libanon Anticline isdissected by a series of west-dipping reverse faults of the JabulaniThrust. The general dip of strata in the Kloof Block is approximately30°E for a northerly strike, but steepens to 55° E near the hinge ofthe Libanon Anticline, i.e., above 6.0 km depth. Below 6.0 km depth,the Libanon Anticline forms an open, symmetric, and upright foldform. The Libanon Anticline is thus disharmonic; it is likely to hostbedding parallel flexural-slip faults that facilitated fold formation,but these are difficult to see in the seismic data.
all (Driefontein/WUDLs) and shallowdipping Jabulani Thrust in the footwall block (Kloof).t 250 m interval. FW: Footwall; HW: Hangingwall; VCR: Ventersdorp Contact Reef;WRG:
Fig. 5. Seismic section (line DD′ in Fig. 1) showing the geometry of the Libanon Anticline at the merge boundary between the footwall (Kloof) and hanging wall (Driefontein/WUDLs) blocks. The Jabulani Thrust and its subordinate faults in the footwall of the Bank Fault crosscut the Libanon Anticline. The hanging wall block hosts minor rollover anticlineand a subordinate fault. FW: Footwall; HW: Hanging wall; VCR: Ventersdorp Contact Reef; WRG: West Rand Group; CRG: Central Rand Group; BLR: Black Reef Formation.
101M.S.D. Manzi et al. / Tectonophysics 590 (2013) 94–105
The Kloof Block is dissected by several steeply dipping conjugatenormal faults (70°–80°W dip) that trend northwest and northeast.Horst and graben architectures are thereby created.
8. The Driefontein-WUDLs Block (KDC West)
The hanging wall (Driefontein-WUDLs block) to the BFZ covers alarge portion of the seismic volume (a 35 km long×10 km wideblock) and hosts some parts of the deepest gold mines in the world,namely Mponeng, Tau Tona, Savuka and Driefontein gold mines.The Driefontein-WUDLs block is defined by the western limb of theLibanon Anticline (Figs. 2, 5).
In the seismic sections across the Driefontein-WUDLs block it is clearthat the Booysens Shale and Turffontein Subgroup are truncated by theVCR creating a gently east-dipping angular unconformity (5°E dip inwest–east seismic sections). The Turffontein Subgroup and BooysensShale were thereby deformed and tilted prior to erosion and subsequentdeposition of the VCR, i.e., at or before 2729±19 Ma which is the maxi-mum age established for the VCR (Kositcin et al., 2003).
Above the top of the West Rand Group through to the end of theCentral Rand Group, the stratigraphic succession thickens to thewest. Above the VCR, the Ventersdorp Supergroup forms a wedge-shaped package that thickens towards the Bank Fault. However, indi-vidual units in the Ventersdorp Supergroup do not wedge against theBF but remain relatively constant in thickness. Furthermore, theVentersdorp Supergroup is truncated by the BLF creating an angularunconformity that dips gently west (5°–15° W dip in west–east seis-mic sections).
These relationships clearly indicate that the Central Rand Group wasmacroscopically folded and tilted (probably during formation of theLibanon Anticline), then eroded to form the VCR angular unconformity,which was then overlain by the Ventersdorp Supergroup. During orafter deposition of the Ventersdorp Supergroup at ca. 2714 Ma, theDriefontein-WUDLs block was rotated clockwise (on west east-seismicsections) during normal faulting (domino block faulting) on the BF anda rollover anticline was formed McCarthy (2006). The rotated block wassubsequently eroded and peneplanated before deposition of the Trans-vaal Supergroup at approximately 2588 Ma. The Driefontein-WUDLsblock is crosscut by steeply southwest-dipping normal faults that formsynthetic faults to the BF. A horst and graben architecture is therebycreated.
9. Discussion
High-resolution merged 3D seismic reflection data that covers aunique 40×30×11 km seismic volume in the West Wits Line andWest Rand goldfields has beenused to study the strato-structural setting.Focus was given to (1) fault geometry, fault form, and fault-throw anal-ysis, and (2) the relative chronology of tectonic events. These eventswere correlated with absolute geochronological data of Armstrong etal. (1991), Crow and Condie (1988), Kositcin and Krapež (2004) andKrapež (1985). The results were integrated with borehole data and un-derground maps to validate the seismic interpretations.
The merged data made clear the gross strato-structural architectureof the goldfields; amacroscopic fold-thrust system is crosscut by amac-roscopic extensional fault array (in an interpreted rift-like system offaults). These are dissected, eroded and overlain by the Transvaal Super-group above an angular unconformity.
The west–east seismic sections across the West Wits Line and WestRand goldfields confirm that the dominantly shale–arenite units of theWest Rand Group (ca. 2985–2902 Ma, Kositcin and Krapež, 2004; U–Pb detrital zircon SHRIMP) are unconformably overlain by the CentralRand Group (ca. 2902–2849 Ma) above an angular unconformity, asproposed by Frimmel et al. (2005), Robb and Robb (1998) and SACS(1980). The unconformity juxtaposed units of the West Rand Group(which had been tilted prior to juxtaposition) against the base of theCentral Rand Group. Tilting of the West Rand Group must have takenplace syn- to post-erosion at ca. 2.9 Ga. The cause of tilting of theWest Rand Group is not known, but it is clear that tectonic activity ex-posed the clastic and largely marine sediments of the West RandGroup to erosion as early as 2.9 Ga. The event is hereafter termed theAsazi Event (Asazi meaning unknown in the IsiZulu language).
The seismic sections also resolve an unconformable relationship be-tween the Central Rand Group and the auriferous Ventersdorp ContactReef (VCR), which are dated at 2942±6 and 2729±19 Ma (discordantU–Pb SHRIMP ages), respectively, from igneous-detrital xenotime/zircon aggregates (Kositcin et al., 2003). The VCR is interpreted as theerosional product of the Central Rand Group, as suggested by McCarthy(2006), Robb et al. (1991), Spencer (1992), Winter (1994) and others.
We interpreted the northerly-trending, upright, tight to openLibanon Anticline from the merged West Rand and 1995 historicalWUDLs datasets. Parasitic folds, such as the Panvlakte anticline–syncline pair (PAS) on the eastern limb of the Libanon Anticline, and re-verse faults, such as thewest-dippingTandeka and Jabulani thrusts,were
102 M.S.D. Manzi et al. / Tectonophysics 590 (2013) 94–105
also resolved. They are interpreted as second-order structures to theLibanon Anticline, which has a wavelength of 8 km and amplitude of2 km. The Libanon Anticline is a first-order crustal-scale fold that proba-bly formedprior to progressive fold-thrust development, as suggested byJolley et al. (2007).
The Libanon Anticline and parasitic folds formed syn- to post-deposition of the West Rand and Central Rand groups because theyare folded about the hinges of the folds; the Tandeka and Jabulanithrusts displace the West Rand Group and thus also formed after thatgroup. The age of fold-fault formation is best estimated from the youn-gest U–Pb geochronological age for the VCR at 2.7 Ga. It correspondswith (1) compressive deformation as described by Barnicoat et al.(1997), McCarthy et al. (1982) and Roering et al. (1991), (2) blockfaulting, folding and thrusting along the northernmargin of theWitwa-tersrand Basin (c.f. DeWit and Tinker, 2004; Frimmel, 2005; Schmitz etal., 2004; Stanistreet et al., 1986 and others), and thrust-fold formationas detailed by Beach and Smith (2007). It also corresponds with theUmzawami Event of Dankert and Hein (2010).
We have interpreted the WRF and BF from the dataset. The WRFand BF are north–northeast trending and approximately 11 km and20 km long, respectively. They are steeply dipping (65°–70° to thewest) listric faults, flattening at the décollement horizon into thedominantly shale units of the West Rand Group.
This work confirms previous studies of Dankert and Hein (2010),Gibson et al. (2000), Gibson (2004) and Mambane et al. (2011) thatthese structures crosscut and offset the West Rand Group, CentralRand Group and Ventersdorp Supergroup, but do not penetrate thebase of the Transvaal Basin, therefore restricting the tectonic evolutionof the faults to pre-2.58 Ga. In contrast, this work contradicts studiesby Coward et al. (1995) and Vermaakt and Chunnet (1994) whointerpreted that the BF propagated through the BLF and displaced itby at least 200 m. A significant number of faults, identified through at-tribute analysis by Manzi et al. (2012a), are associated with syn- topost-Transvaal Basin development and not formation of the WRF andBF; the seismic data shows that displacement on these late faults is inthe order of meters to tens of meters only.
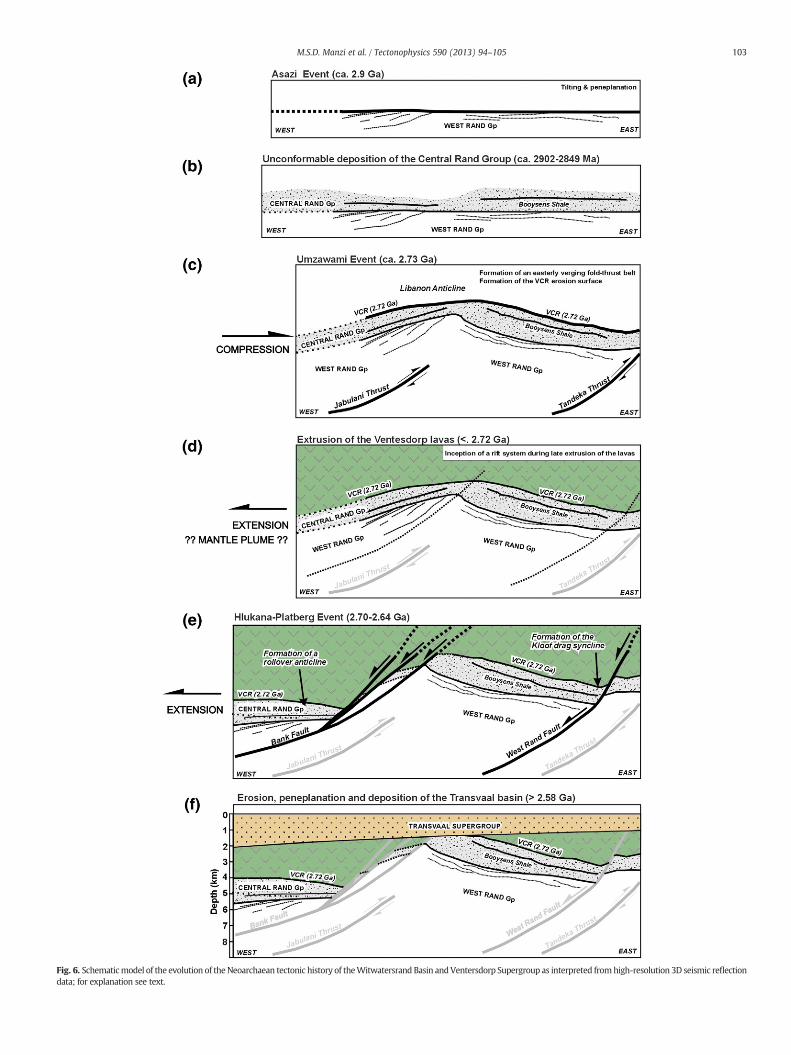
Based on the seismic sections, and with a view to Jolley et al. (2004,2007) and Roering et al. (1991), we propose that at the end of depositionof theWest RandGroup, a tectonic eventwitnessed; (1) tilting and expo-sure of theWest Rand Group at approximately 2.90 Ga by landscape up-lift andmarine regression during the Asazi Event (Fig. 6a); (2) landscapeevolution accompanied deposition of the sandstone, conglomerate andshale units of the Central Rand Group (ca. 2902–2849 Ma) in a subaerialbraided deltaic system (Fig. 6b); (3) formation of a fold-thrust belt dur-ing the Umzawami Event of Dankert and Hein (2010) at ca. 2.73 Ga, inwhich folding of the landscape was synchronous with the formation ofthrusts, reverse and flexural-slip faults (Fig. 6c). The Libanon Anticlineand its parasite folds (the PAS) are the dramatic expression of thisevent and are similar to macroscopic folds imaged by Beach and Smith(2007), and Frimmel and Minter (2002) in their studies for theWelkomandKlerksdorp goldfields.We confirm their findings that fold-thrust for-mation was progressive and directed from the west.
Furthermore, the high-resolution 3-D seismic reflection data, inte-grated with borehole and mapping data, has allowed us to propose anew model for the goldfields that accords with conclusions of Beachand Smith (2007) and Jolley et al. (2004, 2007) inwhich thrust-fold for-mation syn- to post-deposition of the Central Rand Groupwas followedby extensional collapse, initially during deposition of the VentersdorpSupergroup (Fig. 6d,e). The extensional event is hereafter referred toas the Hlukana-Platberg Event (Hlukana meaning tear apart in theIsiZulu language).
The data makes clear that the WRF and BF developed as tear orscissor faults (hinged in the south–southeast) after deposition of theKlipriviersberg lavas and likely during emplacement of the PlatbergGroup (ca. 2.70–2.64 Ga) when a mantle plume may have heatedthe lithospheric mantle (Clendenin et al., 1988; Crow and Condie,
1988; Eriksson et al., 2001, 2009) causing regional crustal anatexis(Taylor et al., 2010). The formation of the WRF and BF at that timeprobably coincided with graben formation across the Kaapvaal craton(c.f., De Kock et al., 2012; Stanistreet et al., 1986), and perhaps withprogressive pseudotachylite formation in the West Rand goldfieldsand elsewhere, as described by Killick and Roering (1995, 1998) andMambane et al. (2011), as the crust and lithosphere were influencedby regional-scale extensional tectonics.
Importantly, the seismic sections do not support wedging of theKlipriviersberg lavas against the WRF or BF because individual unitscontinue unthickened across both sides of the faults, i.e., the idea thatthe faults formed as growth faults (sensu stricto) during deposition ofthe lavas, as suggested by McCarthy (2006), is not supported. In fact,the Klipriviersberg packet thickens from east to west in restored sec-tions (c.f., Frimmel and Minter, 2002; Tinker et al., 2002), and althoughthey were probably emplaced in an extensional tectonic setting (Vander Westhuizen et al., 1991 and references therein), it is not likelythat theWRF and BF (sensu stricto) formed at that time. Instead, we in-terpret that the Klipriviersberg volcanic rocks were listric-faulted dur-ing the Hlukana-Platberg Event (concomitant to graben formation)and eroded leaving a thin eroded package to the east of the WRF anda protected thick package to the west. The fold-thrust belt and exten-sional fault array does not penetrate the base of the Transvaal Basin(Fig. 6f).
10. Conclusion
The merging of the historical 3D seismic dataset covers mines andexploration lease areas owned by AngloGold Ashanti (Mponeng, West-ern Ultra-deep Levels) and Gold Fields (Kloof–Driefontein Complex—KDC; South Deep). It has enabled us to constrain the Neoarchaean tec-tonic history of a portion of the Witwatersrand Basin. The 3D seismicdata, correlated with absolute and relative geochronology, borehole,underground mapping datasets, has characterized three Neoarchaeantectonic events:
1. Asazi Event (ca. 2.90 Ga): Exposure of the clastic and largely ma-rine sediments of the West Rand Group during landscape upliftand tilting syn- to post-erosion, followed by the unconformabledeposition of the Central Rand Group sediments.
2. Umzawami Event (ca 2.73 Ga): Compressive deformation; forma-tion of the first-order scale thrust-fold, the Libanon Anticline andits parasitic folds, syn- to post-deposition of the Central RandGroup, and synchronous with the formation of reverse faults andthrusts such as Tandeka and Jabulani thrusts.
3. Hlukana-Platberg Event (2.70–2.64 Ga): Extensional tectonics coe-val with the heating of lithosphere by mantle plume; formation offirst-order scale rift-like system of faults such as the West Randand Bank faults and their second and third-order scale normalfaults that dissect and crosscut (Umzawami) fold-thrust belt to-wards the end of extrusion of the Ventersdorp lavas and during de-position of the Platberg Group; formation of a drag syncline and arollover anticline in the hanging wall of the West Rand and Bankfaults, respectively.
Furthermore, the throw-distance analysis on the first-order scalenormal faults shows that the throw distribution exhibits a linear lateraldisplacement profile, but can be greatly influenced by the developmentof splays of the second- and third-order scale structures during the pe-riod of extensional fault activity.
This work is the first attempt to constrain the tectonic history of theWest Wits Line and West Rand goldfields in the Witwatersrand Basinthrough the interpretation of a merged historic 3-D seismic dataacquired between 1988 and 2003. In this study we propose that high-resolution 3-D seismics should be recognized as a core geophysical tech-nique when studying the tectonic history of the region. In structurallycomplex domains, such as the Witwatersrand Basin, the 3-D seismic
Fig. 6. Schematicmodel of the evolution of theNeoarchaean tectonic history of theWitwatersrand Basin andVentersdorp Supergroup as interpreted fromhigh-resolution 3D seismic reflectiondata; for explanation see text.
103M.S.D. Manzi et al. / Tectonophysics 590 (2013) 94–105
104 M.S.D. Manzi et al. / Tectonophysics 590 (2013) 94–105
data correlated with borehole and underground map has fully con-strained the magnitude of displacement of thrusts and normal faults,the gross structural architecture, and the tectonic evolution of the first-order scale structures. However, without kinematic analysis, 3-D seismicsmay not be sufficient to provide criteria that make it possible to correctlyunravel the timing and the evolution of faults. Therefore, integration of ki-nematic data with 3-D seismics and borehole data is critical when tempt-ing to constrain the timing of faults.
Acknowledgments
This research was supported by the University of Witwatersrand Jo-hannesburg and sponsored by Gold FieldsMining Ltd.Wewish to thankG.J. Cooper, J. Tricket and L. Lindzay for their technical contribution onthis paper. We gratefully acknowledge the review of H. Frimmel andthe editors for their critical and constructive comments on the paper.
References
Armstrong, R.A., Compston, W., Williams, I.S., Welke, H.J., 1991. Zircon ion microprobestudies bearing on the age and evolution of the Witwatersrand triad. PrecambrianResearch 53, 243–266.
Beach, A., Smith, R., 2007. Structural geometry and development of the WitwatersrandBasin, South Africa. In: Ries, A.C., Butler, R.W.H., Graham, R.H. (Eds.), Deformationof the Continental Crust: The Legacy of Mike Coward: Geological Society, London,Special Publications, 272, pp. 533–542.
Clendenin, C.W., Charlesworth, E.G., Maske, S., 1988. An early Proterozoic three stagerift system, Kaapvaal Craton, South Africa. Tectonophysics 145, 73–86.
Coward, M.P., Spencer, R.M., Spencer, C.E., 1995. Development of the WitwatersrandBasin, South Africa. In: Coward, M.P., Ries, A.C. (Eds.), Early Precambrian Processes:Geological Society, London, Special Publications, 95, pp. 243–269.
Crow, C., Condie, K.C., 1988. Geochemistry and origin of Late Archaean volcanics fromthe Ventersdorp Supergroup, South Africa. Precambrian Research 42, 19–37.
Dankert, B.T., Hein, K.A.A., 2010. Evaluating the structural character and tectonic histo-ry of the Witwatersrand Basin. Precambrian Research 177, 1–22.
De Kock, W.P., 1964. The geology and economic significance of the West Wits Line. In:Haughton, S.H. (Ed.), The Geology of Some Ore Deposits of Southern Africa, 1. Geo-logical Society of South Africa, Johannesburg, pp. 323–386.
De Kock, M.O., Beukes, N.J., Armstrong, R.A., 2012. New SHRIMP U–Pb ages from theHartswater Group, South Africa: implications for correlations of the NeoarcheanVentersdorp Supergroup on the Kaapvaal craton and with the Fortescue Groupon the Pilbara craton. Precambrian Research 204–205, 66–74.
De Wit, M.J., Tinker, J., 2004. Crustal structures across the central Kaapvaal craton fromdeep-seismic reflection data. South African Journal of Geology 107, 185–206.
Engelbrecht, C.J., Baumbach, G.W.S., Mathysen, J.L., Fletcher, P., 1986. The West WitsLine. In: Anhaeusser, C.R., Maske, S. (Eds.), Mineral Deposits of Southern Africa,1. Geological Society of South Africa, pp. 599–648.
Eriksson, P.G., Reczko, B.F.F., 1995. The sedimentary and tectonic setting of the Trans-vaal Supergroup floor rocks to the Bushveld Complex. Journal of African Earth Sci-ences 21, 487–504.
Eriksson, P.G., Hattingh, P.J., Altermann,W., 1995. An overviewof the geology of the Trans-vaal Sequence and Bushveld Complex, South Africa. MineraliumDeposita 30, 98–111.
Eriksson, P.G., Altermann, W., Catuneanu, O., Van der Merwe, R., Bumby, A.J., 2001.Major influences on the evolution of the 2.67–2.1 Ga Transvaal basin, Kaapvaalcraton. Sedimentary Geology 141–142, 205–231.
Eriksson, P.G., Mazumder, R., Catuneanu, O., Bumby, A.J., Ilondo, B.O., 2006. Precambri-an continental freeboard and geological evolution: a time perspective. Earth-Science Reviews 79, 165–204.
Eriksson, P.G., Altermann, W., Hartzer, F.J., 2007. The Transvaal Supergroup and its pre-cursors. In: Johnson, M.R., Anhaeusser, C.R., Thomas, R.J. (Eds.), The Geology ofSouth Africa. Geological Society of South Africa, Johannesburg/Council for Geosci-ence, Pretoria, pp. 237–260.
Eriksson, P.G., Banjeree, S., Nelson, D.R., Rigby, M.J., Catuneanu, O., Sarkar, S., Roberst,R.J., Ruban, D., Mtimkulu, M.N., Sundur Raju, P.V., 2009. A Kaapvaal craton debate:nucleus of an early small supercontinent or affected by an enhanced accretionevent. Gondwana Research 15, 354–372.
Fletcher, P., Gay, N.C., 1971. Analysis of gravity sliding and orogenic translation. Discus-sion Geological Society of America Bulletin 82, 2677–2682.
Fletcher, P.R., Reimold, W.U., 1989. Some notes and speculations on the pseudotachylites inthe Witwatersrand Basin and Vredefort Dome. South African Journal of Geology 92,223–234.
Frimmel, H.E., 2005. Archaean atmospheric evolution evidence from the Witwaters-rand gold fields, South Africa. Earth-Science Reviews 70, 1–46.
Frimmel, H.E., Minter, W.E.L., 2002. Recent developments concerning the geologicalhistory of the Witwatersrand gold deposits, South Africa. In: Goldfarb, R., Nielsen,R.L. (Eds.), Global Exploration 2002 — Integrated Methods for Discovery. : SpecialPublication, 9. Society of Economic Geologists, Littleton, pp. 17–45.
Frimmel, H.E., Hallbauer, D.K., Gartz, V.H., 1999. Goldmobilizing fluids in theWitwatersrandBasin: composition and possible sources. Mineralogy and Petrology 55–81.
Frimmel, H.E., Groves, D.I., Kirk, J., Ruiz, J., Chesley, J., Minter, W.E.L., 2005. The forma-tion and preservation of the Witwatersrand goldfields, the largest gold province inthe world. In: Hedenquist, J.W., Thompson, J.F.H., Goldfarb, R.J., Richards, J.P. (Eds.),Economic Geology One Hundreth Anniversary Volume. Society of Economic Geol-ogists, Littleton, Colorado, pp. 769–797.
Gartz, V.H., Frimmel, H.E., 1999. Complex metasomatism of an Archean placer in theWitwatersrand Basin, South Africa: the Ventersdorp Contact Reef — a hydrother-mal aquifer? Economic Geology 94, 689–706.
Gibson, M.A.S., 2004. Goldfields KEA 3D Seismic Project: Final Report. Unpublished re-port to Gold Fields Mining, 52 pp.
Gibson, M.A.S., 2005. Interpretation of the 2003 South Deep 3D Seismic Survey. Unpublishedreport to Gold Fields Mining, 62 pp.
Gibson, M.A.S., Jolley, S.J., Barnicoat, A.C., 2000. Interpretation of the Western UltraDeep Levels 3D seismic survey. The Leading Edge 19, 730–735.
Jolley, S.J., Stuart, G.W., Freeman, S.R., Knipe, R.J., Kershaw, D., McAllister, E., Barnicoat, A.C.,Tucker, R.F., 2007. Progressive deformation of a Late Orogenic Thrust System, fromdu-plex development to extensional reactivation and disruption: Witwatersrand Basin,South Africa. Geological Society, London, Special Publications, 272, pp. 543–569.
Killick, A.M., Roering, C., 1995. The relative age of pseudotachylite formation in theWest Rand region, Witwatersrand basin, South Africa, as deduced from structural(sic) observations. South African Journal of Geology 98, 78–81.
Killick, A.M., Roering, C., 1998. An estimate of the physical conditions of pseudotachylite for-mation in theWest Rand Goldfield, Witwatersrand Basin, South Africa. Tectonophysics284, 247–259.
Kositcin, N., Krapež, B., 2004. Relationship between detrital zircon age-spectra and thetectonic evolution of the Late Archaean Witwatersrand Basin, South Africa. Pre-cambrian Research 129, 141–168.
Kositcin, N., McNaughton, N.J., Griffin, B.J., Fletcher, I.R., David, I., Groves, D.I., BirgerRasmussen, B., 2003. Textural and geochemical discrimination between xenotimeof different origin in the Archaean Witwatersrand Basin, South Africa. Geochimicaet Cosmochimica Acta 67, 709–731.
Krapež, B., 1985. The Ventersdorp Contact placer: a gold–pyrite placer of stream anddebris-flow origins from the Archaean Witwatersrand Basin of South Africa. Sedi-mentology 32, 223–234.
Lindesay, J.P., 1989. The Fresnel zone and its interpretive significance. The Leading Edgeof Exploration 8, 33–39.
Malehmir, A., Koivisto, E., Manzi, M., Cheraghi, S., Durrheim, R.J., Bellefleur, G., Hein, K.,King, N., 2013. A review of reflection seismic investigations in three majormetallogenic regions: the Kevitsa Ni-Cu-PGE district (Finland), Witwatersrandgoldfields (South Africa), and the Bathurst Mining Camp (Canada). Ore GeologyReviews, http://dx.doi.org/10.1016/j.oregeorev.2013.01.003.
Mambane, P.W., Hein, K.A.A., Twemlow, S.G., Manzi, M.S.D., 2011. Pseudotachylite inthe South Boundary Fault at the Cooke Shaft, Witwatersrand Basin, South Africa.South African Journal of Geology 114 (2), 109–120.
Manzi, M.S.D., Durrheim, R.J., Hein, K.A.A., King, N., 2012a. 3D edge detection seismicattributes used to map potential conduits for water and methane in deep goldmines in the Witwatersrand basin, South Africa. Geophysics 77, WC133–WC147,http://dx.doi.org/10.1190/GEO2012-0135.1.
Manzi, M., Gibson, M.A.S., Hein, K.A.A., King, N., Durrheim, R.J., 2012b. Application of 3D seis-mic techniques in evaluation of ore resources in the West Wits Line goldfield and por-tions of the West Rand Goldfield, South Africa. Geophysics 77, WC163–WC171, http://dx.doi.org/10.1190/GEO2012-0133.1.
Martin, D. McB, Clendenin, C.W., Krapĕz, B., McNaughton, N.J., 1998. Tectonic and geo-chronological constraints on late Archaean and Palaeoproterozoic stratigraphiccorrelation within and between the Kaapvaal and Pilbara Cratons. Journal of theGeological Society 155, 311–322.
Mashabella, S., 2011. Structural Geology of the Panvlakte Anticline in the Cooke 3 GoldMine. Honours Thesis, University of the Witwatersrand Johannesburg, 39 pp.
McCarthy, T.S., 2006. The Witwatersrand Supergroup. In: Johnson, M.R., Anhaeusser,C.R., Thomas, R.J. (Eds.), The Geology of South Africa. Geological Society of SouthAfrica, Johannesburg/Council for Geosciences, Pretoria, pp. 155–186.
McCarthy, T.S., Cadle, A.B., Horrocks, P., 1982. Thrusting in Witwatersrand rocks atLangerman's Kop, Johannesburg. Transactions of the Geological Society ofSouth Africa 85, 189–201.
Minter, W.E.L., 1982. The Golden Proterozoic. (Chapter 4) In: Tankard, A.J., Jackson,M.P.A., Eriksson, K.A., Hobday, D.H., Hunter, D.R., Minter, W.E.L. (Eds.), Crustal Evo-lution of Southern Africa: 3.8 Billion Years of Earth History. Springer-Verlag, NewYork, Heidelberg and Berlin, pp. 115–150.
Mohale, M., 2010. Structural Geology of the South Boundary Fault in the Cooke 3,West Rand Goldfield. Honours Thesis, University of the Witwatersrand Johan-nesburg, 83 pp.
Myers, R.E., McCarthy, T.S., Stanistreet, I.G., 1989. A tectono-sedimentary reconstruc-tion of the development of the Witwatersrand Basin, with particular emphasison the Central Rand Group. Economic Geology Research Unit Information Circular,No. 216, pp. 497–540.
Robb, L.J., Robb, V.M., 1998. Gold in the Witwatersrand basin. In: Wilson, M.G.C.,Anhaeusser, C.R. (Eds.), The Mineral Resources of South Africa. : Handbook, 16.Council for Geoscience, Pretoria, pp. 294–349.
105M.S.D. Manzi et al. / Tectonophysics 590 (2013) 94–105
Robb, L.J., Davis, D.W., Kamo, S.L., 1991. Chronological framework for the Witwaters-rand basin and environs: towards a time-constrained depositional model. SouthAfrican Journal of Geology 94, 86–95.
Roering, C., 1990. The Vredefort structure: a perspective with regard to new tectonicdata from adjoining terranes. Tectonophysics 171, 7–22.
Roering, C., Berlenbach, J., Schweitzer, J.K., 1991. Guidelines for the classification offault rocks. COMRO. User Guide, 21 (22 pp.).
SACS, South African Committee for Stratigraphy, 1980. Stratigraphy of South Africa. Part 1:Lithostratigraphy of the Republic of South Africa. South West Africa/Namibia and theRepublics of Bophuthatswana, Transkei and Venda, Geological Survey of South AfricaHandbook, Pretoria, 8 (690 pp.).
Schmitz, M.D., Bowring, S.A., de Wit, M.J., Gartz, V., 2004. Subduction and terrane colli-sion stabilize the western Kaapvaal craton tectosphere 2.9 billion years ago. Earthand Planetary Science Letters 222, 363–376.
Spencer, R.M., 1992. Late Archean Tectonics and Sedimentation of the South Rand Area,Witwatersrand Basin. Ph.D. Dissertation (unpubl.), University of the Witwaters-rand, Johannesburg, South Africa.
Stanistreet, I.G., McCarthy, T.S., Charlesworth, E.G., Myers, R.E., Armstrong, R.A.,1986. Pre-Transvaal wrench tectonics along the northern margin of the Witwa-tersrand Basin. Tectonophysics 131, 53–74.
Tankard, A.J., Jackson, M.P.A., Eriksson, K.A., Hobday, D.K., Hunter, D.R., Minter, W.E.L.,1982. Crustal Evolution of Southern Africa: 3.8 Billion Years of Earth History.Springer-Verlag, New York (523 pp.).
Taylor, J., Stevens, G., Armstrong, R., Kisters, A.F.M., 2010. Granulite facies anatexis inthe Ancient Gneiss Complex, Swaziland, at 2.73 Ga: mid-crustal metamorphic ev-
idence for mantle heating of the Kaapvaal craton during Ventersdorp magmatism.Precambrian Research 177, 88–102.
Tinker, J., de Wit, M., Grotzinger, J., 2002. Seismic stratigraphic constraints onNeoarchean-Paleoproterozoic evolution of the western margin of the Kaapvaal cra-ton. South Africa: South African Journal of Geology 105, 107–134.
Van der Westhuizen, W.A., De Bruiyn, H., Meintjes, P.G., 1991. The Ventersdorp Super-group: an overview. Journal of African Earth Sciences 13, 83–105.
Vermaakt, D.T., 1995. The Structural Evolution of a Portion of the Witwatersrand Basinwith Special Reference to the Bank Break and Surrounding Areas. Ph.D. Disserta-tion (unpubl.), Rand Afrikaans University, Johannesburg, South Africa, 303 pp.
Vermaakt, D.T., Chunnet, I.E., 1994. Tectono-sedimentary processes which controlledthe deposition of the Ventersdorp Contact Reef within the West Wits Line. In:Anhaeusser, C.R. (Ed.), Proceedings of the 15th Congress of the Council for Miningand Metallurgical Institutions, Volume 3 (Geology): South African Institute of Min-ing and Metallurgy, pp. 117–130.
Vos, R.G., 1975. An alluvial plain and lacustrine model for the Precambrian Witwaters-rand deposits of South Africa. Journal of Sedimentary Petrology 45, 480–493.
Widess, M.B., 1973. How thin is thin bed? Geophysics 38, 1176–1180.Winter, H. de La R., 1994. Foreland depobasin results of theWitwatersrand Supergroup in
the Rietfontein— East Rand Region: eustaticmarine parallels and tectonic continentalcontrasts around the proximal rim. South African Journal of Geology 97, 119–134.
Yilmaz, O., 1987. Seismic Data Processing. Society of Exploration Geophysicists.