Page 1
Functional Annotation and Transcript Expression Analysis of RNA-Seq Data (via
NGS) from White Kelampayan (Neolamarckia cadamba) using Bioinformatics
Approach
Lim Leong Rui (36728)
Bachelor of Science with Honours (Resource Biotechnology)
2015
Page 2
Functional Annotation and Transcript Expression Analysis of RNA-Seq Data (via
NGS) from White Kelampayan (Neolamarckia cadamba) using Bioinformatics
Approach
Lim Leong Rui (36728)
This dissertation is submitted in partial fulfilment of the requirements for the Degree of
Bachelor of Science with Honours in Resource Biotechnology.
Supervisor: Dr. Ho Wei Seng
Resource Biotechnology
Department of Molecular Biology
Faculty of Resource Science and Technology
Universiti Malaysia Sarawak
12/5/2015
Page 3
I
ACKNOWLEDGEMENT
First and foremost, I would like to express my sincere gratitude to God for His blessings
upon the completion of the project. Secondly, I would like to thank to my supervisor, Dr.
Ho Wei Seng for giving me an opportunity to work on this project. Also, thanks to his fully
support, guidance and advices, I am able to explore more and understand more on this
project. Thirdly, I would like to show my gratitude to my course mates, Che Nurul Fariza
bt Che Hasnan and Nuradilah bt. Mohammad Nor for giving me some ideas on doing this
project. Last but not least, I would like to give a big thank to my family and housemates.
Without their supports and patience to listen my joy and frustration, I would not have
enough strength and focus to stay on this project.
Page 4
II
DECLARATION
Hereby, I declare that this thesis is my original work except for quotation and citations, all
of which have been duly acknowledged. In addition, I would like to declare that it has not
been previously or concurrently submitted for any other degree at UNIMAS or other
institutions.
________________________________________
Lim Leong Rui
Resource Biotechnology Programme
Department of Molecular Biology
Faculty of Resource Science and Technology
Universiti Malaysia Sarawak
Page 5
III
TABLE OF CONTENT
ACKNOWLEDGEMENT I
DECLARATION II
TABLE OF CONTENTS III
LIST OF ABBREVIATIONS V
LIST OF FIGURES VII
LIST OF TABLES IX
ABSTRACT X
1.0 INTRODUCTION 1
2.0 LITERATURE REVIEW 3
2.1 White kelampayan 3
2.2 Next generation sequencing (NGS) 4
2.3 RNA-sequencing (RNA-Seq) 5
2.4 Functional annotation and gene ontology (GO) 6
2.5 Reads per kb per million reads (RPKM) and Blast2GO program 7
2.6.1 Reads per kb per million reads (RPKM)
2.6.2 Blast2GO program
2.7 WEGO tool 7
2.8 Fold Change 8
3.0 MATERIALS AND METHODS
Page 6
IV
3.1 RNA-Seq data generation 9
3.2 Gene ontology annotation using Blast2GO® 9
3.3 Visualization of GO annotation via WEGO Tool 12
3.4 Differential expression analysis 12
4.0 RESULTS AND DISCUSSION
4.1 Gene ontology analysis 16
4.2 General transcripts expression analysis 26
4.3 Genes involved in lignin biosynthesis 29
4.4 Genes involved in cellulose biosynthesis 32
4.5 Genes involved in response to oxidative stress 35
4.6 Genes involved in response to water deprivation 37
4.7 Genes involved in plant defense response to bacterium 38
5.0 CONCLUSION 42
REFERENCES 43
APPENDICES 47
Page 7
V
LIST OF ABBREVIATIONS
ABI/SOLiD Applied Biosystems/Sequencing by Oligonucleotide Ligation and
Detection
APX Ascorbate peroxidase
C4H Cinnamate 4-hydroxylase
CAD Cinnamoyl alcohol dehydrogenase
Cat Catalase
cDNA Complementary deoxyribonucleic acid
CelS Cellulose synthase complex
CHIP-Seq Chromatin immunoprecipitation sequencing
Csl Cellulose synthase-like protein
DNA Deoxyribonucleic acid
EMBL-EBI European Molecular Biology Laboratory – The European
Bioinformatics Institute
ESTs Expressed sequence tags
FDR False discovery rate
Gb Gigabyte
GO Gene ontology
GPX Gluthathione peroxidase
Hsps Heat shock protein
LRR-RLKs Leucine-rich repeat receptor-like protein kinase
Mb Megabyte
MODs Model organisms database
Page 8
VI
NCBI National Center for Biotechnology Information
NGS Next generation sequencing
PCR Polymerase chain reaction
RNA Ribonucleic acid
RNA-Seq Ribonucleic acid sequencing
RPKM Reads per kb per million reads
SAGE Serial analysis of gene expression
WEGO Web Gene Ontology Annotation
Page 9
VII
LIST OF FIGURES
Figure Page
3.1 The annotated transcripts appeared on main sequence table (blue
colour).
10
3.2 The “Sequence name” and “GO ID” were removed in order to be
compatible with the input file format supported by WEGO tool.
11
3.3 WEGO website. The annotation file was uploaded in “Input file
1” by clicking “Choose file” button. Input file format can be
chosen as WEGO Native Format, which is compatible with the
uploaded annotation file.
13
3.4 A list of level 2 and level 3 GO terms for 3 GO categories
appeared on the monitor screen.
14
3.5 A column entitled “Up-/Down- regulated” was added beside with
Fold Change column.
15
4.1 Number of annotated transcripts assigned to GO terms in
biological process (Level 2).
17
4.2 Number of annotated transcripts assigned to GO terms in
molecular function (Level 2).
18
4.3 Number of annotated transcripts assigned to GO terms in cellular
component (Level 2).
19
4.4 A visualized graph showed the distributions of selected GO terms
(Level 2) where the x-axis was GO main categories and y-axis
was transcripts number and percentages.
20
Page 10
VIII
4.5 The number of up-regulated transcripts was higher than the
number of down-regulated transcripts.
27
4.6 A graph showing the comparison between significant expressed
transcripts and non-significant expressed transcripts. In
significantly expressed transcripts, 20,828 were up-regulated
(blue), 6,357 were down-regulated (red) and 4,508 (green) were
expressed either in developing xylem or leaves tissues.
27
4.7 Volcano plot was constructed via CLC Genomics Workbench 7.5.
Most of the transcripts were expressed where the fold change is
less than 2-fold.
28
4.8 Lignin biosynthesis pathway (Acker et al., 2013). 31
4.9 Cellulose biosynthesis pathway. The cellulose synthase complex
(CelS) is formed by six subunits of cellulose synthase
polypeptides.
34
4.10 Genes involved in response to oxidative stress. 36
Appendix
A
Official website of EMBL-EBI Quick GO
(http://www.ebi.ac.uk/QuickGO/).
46
Appendix
B
Official website of Gene Ontology Consortium
(http://geneontology.org/)
47
Appendix
C
Selected GO terms in Biological Process. 48
Appendix
D
Selected GO terms in Molecular Function. 52
Appendix
E
Selected GO terms in Cellular Component. 53
Page 11
IX
LIST OF TABLES
Table Page
2.1 Taxonomy of white kelampayan tree species 3
4.1 A table was constructed showing GO functional categorization
of expressed transcripts and differentially expressed transcripts
with biological process, one of the main GO categories.
21
4.2 A table was constructed showing GO functional categorization
of expressed transcripts and differentially expressed transcripts
with molecular function, one of the main GO categories.
24
4.3 A table was constructed showing GO functional categorization
of expressed transcripts and differentially expressed transcripts
with cellular component, one of the main GO categories.
25
4.4 Number of expressed transcripts in lignin biosynthesis. 29
4.5 Number of expressed transcripts in cellulose biosynthesis. 32
4.6 Number of selected genes that were up-regulated and down-
regulated in response to oxidative stress.
35
4.7 Number of expressed transcripts in plant defense response to
bacterium.
38
4.8 Number of expressed transcripts in plant defense response to
fungus.
38
4.9 Number of selected genes that were up-regulated and down-
regulated in defense response to bacterium (GO: 0042742).
40
4.10 Number of selected genes that were up-regulated and down-
regulated in defense response to fungus (GO: 0050832).
41
Page 12
X
Functional Annotation and Transcript Expression Analysis of RNA-Seq Data (via NGS) from White
Kelampayan (Neolamarckia cadamba) using bioinformatics approach
Lim Leong Rui
Resource Biotechnology Progrramme
Faculty of Resource Science and Technology
Universiti Malaysia Sarawak
ABSTRACT
White kelampayan (Neolamarckia cadamba) is an indigenous tree species under Rubiaceae family. It has a
high economic value due to its fast growing properties. However, an understanding on genetics study of
kelampayan still remains scarce. Objectives of this study were to define functional annotation and analyse
transcripts expression level of the RNA-Seq data from the white kelampayan. In this study, there were 66,468
transcripts expressed via sequence reads assembly. Out of the total expressed transcripts, 29,495 transcripts
were annotated and mapped with the gene ontology (GO) terms by using bioinformatics approaches such as
the CLC Genomics Workbench 7.5, Blast2GO® and WEGO tool. Differential expression of transcripts was
studied and certain candidate genes involving in wood formation, stress response and plant defence were
identified. In this study, out of 66,468 transcripts, the number of up-regulated transcripts was higher than the
number of down-regulated transcripts, showing more transcripts expressed in the developing xylem tissues.
In gene ontology analysis, the biological processes showed the highest distribution of annotated transcripts.
Besides, cinnamoyl-dehydrogenase, cinnamoyl 4-hydroxylase, cellulose synthase, enzyme antioxidant, heat
shock protein, aquaporin, and genes involved in plant defense were annotated and discussed in this study.
This study provides another useful genomic reference for future research on the tree species.
Key words: Neolamarckia cadamba, Functional annotation, Wood formation, response to stress, plant
defense.
ABSTRAK
Neolamarckia cadamba merupakan spesies pokok tempatan di bawah keluarga Rubiaceae. Pokok ini
mempunyai nilai ekonomi yang tinggi kerana pokok ini cepat tumbuh besar. Walau bagaimanapun,
pemahaman mengenai kajian genetik kelampayan masih terhad. Objektif kajian ini adalah untuk mengkaji
anotasi kefungsian dan menganalisis tahap ungkapan transkrip data RNA-Seq pokok kelampayan. Dalam
kajian ini, terdapat 66,468 transkrip dihasilkan melalui himpunan bacaan jujukan. Daripada jumlah
keseluruhan transkrip yang dihasilkan, 29,495 transkrip telah dicatatkan dengan istilah gen ontologi (GO)
melalui pendekatan bioinformatik seperti CLC Genomics Workbench 7.5, Blast2GO® and WEGO tool.
Ungkapan perbezaan transkrip telah dikaji dan calon gen yang melibatkan pembentukan kayu, tindak balas
stres dan pertahanan tumbuhan juga telah dikenalpasti dalam kajian ini. Bilangan transkrip yang lebih
terungkap melebihi bilangan transkrip yang kurang terungkap dalam kajian ini. Hal ini menunjukkan
kebanyakan transkrip diungkap dalam bahagian tisu xylem membangun. Dalam analisis gen ontologi (GO),
kategori proses biologi menunjukkan taburan transkrip yang paling tinggi berbanding dua kategori yang
lain. Selain itu, cinnamoyl-dehidrogenase, cinnamoyl 4-hidroksilase, selulosa sintase, enzim antioksidan,
protein kejutan haba, aquaporin dan gen yang terlibat dalam pertahanan tumbuhan dibincangkan dan
dinyatakan dalam kajian ini. Kajian ini menyediakan rujukan berguna untuk kajian akan datang kepada
spesies pokok.
Kata kunci: Neolamarckia cadamba, anotasi kefungsian, pembentukan kayu, tindak balas stres dan
pertahanan tumbuhan.
Page 13
1
1.0 INTRODUCTION
White kelampayan or Neolamarckia cadamba is a fast growing tree species that generates
economics profits in 8 to 10 years (Ho et al., 2014). It is an indigenous tree species under
Rubiaceae family (Sarawak Timber Industry Development Corporation (STIDC), 2009;
Dubey et al., 2011). The tree species plays its important role in pulp and paper production,
medical industry, plywood industry as well as furniture production (Joker as cited in Ho et
al., 2014). These important roles of this kelampayan tree species bring great potential
benefits to economics nowadays. However, genetic research on the kelampayan tree is less
to be found. As of February 2014, the number of nucleotide sequences available in NCBI
database is 1227.
Recently, many sequencing technologies are developed from time being. One of the
developing technologies is next generation sequencing (NGS). It is an alternative to first
generation sequencing such as Sanger sequencing. In 2005, it is exposed commercially to
the world (Bubnoff, 2008). Certain plants such as Saccharomyces cerevisae and
Arabidopsis thaliana were investigated and studied via using next generation sequencing
(NGS) technologies (Wang et al., 2010), but unfortunately, there was no any NGS research
being done on the kelampayan tree species. There are several types of NGS technologies
are widely used nowadays such as 454 sequencing technology, Illumina sequencing and
ABI/SOLiD sequencing system, while applications of NGS are RNA-sequencing (RNA-
Seq), genomic sequencing and epigenetic applications (Morozova & Marra, 2008;
Perdacher, 2011).
Page 14
2
RNA-Seq is a revolutionary tool in transcriptomic study (Wang et al., 2010). It is
one of the next generation sequencing (NGS) applications. It is mainly used in
transcriptomic study which the whole transcriptomes is mapped and quantified. Comparing
to microarray technology, the usage of RNA-Seq is more attractive for transcriptomic
researchers as this technology provides high-throughput analysis such as high coverage
level and resolution in whole transcriptomics study (Sekhon et al., 2013).
In this study, the transcriptome analysis of kelampayan tree was studied via RNA-
sequencing (RNA-Seq) technology. A total of 66,468 transcripts were expressed. Out of
the total expressed transcripts, 29,495 were annotated against non-redundant NCBI
database before mapping to Gene Ontology database by using Blast2GO. Also, differential
expression levels of transcripts with default parameters such as fold change and false
discovery rate (FDR) corrected p-value were identified. Certain candidate genes were
found to be mainly involved in lignin biosynthesis, cellulose biosynthesis, response to
oxidative stress, response to water deprivation and plant defense. These functional groups
were important in studying wood formation, stress response and plant defense mechanism
in kelampayan tree.
The objectives of this study were:
a) To define the functional annotation of RNA-Seq data from the white kelampayan in
terms of gene ontology via Blast2GO programme, and
b) To analyse the transcript expression level of RNA-Seq data from the white
kelampayan.
Page 15
3
2.0 LITERATURE REVIEW
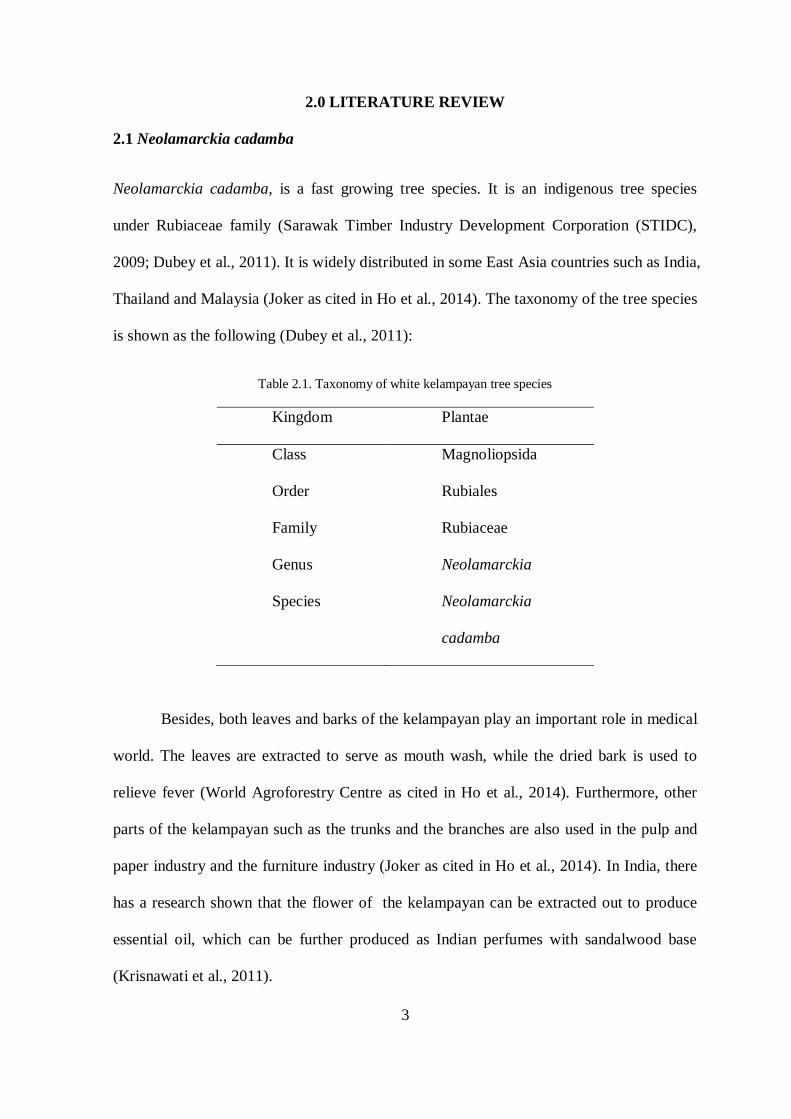
2.1 Neolamarckia cadamba
Neolamarckia cadamba, is a fast growing tree species. It is an indigenous tree species
under Rubiaceae family (Sarawak Timber Industry Development Corporation (STIDC),
2009; Dubey et al., 2011). It is widely distributed in some East Asia countries such as India,
Thailand and Malaysia (Joker as cited in Ho et al., 2014). The taxonomy of the tree species
is shown as the following (Dubey et al., 2011):
Table 2.1. Taxonomy of white kelampayan tree species
Kingdom Plantae
Class Magnoliopsida
Order Rubiales
Family Rubiaceae
Genus Neolamarckia
Species Neolamarckia
cadamba
Besides, both leaves and barks of the kelampayan play an important role in medical
world. The leaves are extracted to serve as mouth wash, while the dried bark is used to
relieve fever (World Agroforestry Centre as cited in Ho et al., 2014). Furthermore, other
parts of the kelampayan such as the trunks and the branches are also used in the pulp and
paper industry and the furniture industry (Joker as cited in Ho et al., 2014). In India, there
has a research shown that the flower of the kelampayan can be extracted out to produce
essential oil, which can be further produced as Indian perfumes with sandalwood base
(Krisnawati et al., 2011).
Page 16
4
2.2 Next generation sequencing
Next generation sequencing (NGS) is an alternative way to overcome limitations of the
first generation sequencing, Sanger sequencing. It was firstly introduced in 2005
(Morozova & Marra, 2008), and this gives a huge impact to the computational biology
world.
It brings much advantages compared to Sanger sequencing in terms of time
efficiency and cost. According to Bubnoff (2008, p. 721), he stated that “NGS technology
is up to 200 times faster and cheaper than the traditional Sanger sequencing.” He also
mentioned that NGS technologies simplify the bacterial cloning process.
There are three types of NGS technologies, which are 454 sequencing technology,
Illumina sequencing and ABI/SOLiD sequencing system (Bubnoff, 2008; Morozova &
Marra, 2008; Perdacher, 2011). These three technologies have a same feature where the
DNA can be amplified via polymerase chain reaction (PCR) without applying any bacterial
cloning process (Bubnoff, 2008). Furthermore, there are several applications used in NGS
technology such as transcriptome sequencing or RNA-sequencing (RNA-Seq), genomic
sequencing and epigenetic applications which use CHIP-Seq and methylation profiling to
work out analysis on interaction in between proteins and DNA and analysis on regulating
chromatin structure respectively (Perdacher, 2011).
Page 17
5
2.3 RNA-sequencing (RNA-Seq)
RNA-Seq, known as Whole Transcriptome Shotgun Sequencing, is “a revolutionary tool
for transcriptomes” (Perdacher, 2011; Wang et al., 2010, p. 57). It has been applied in
some studied objects such as Saccharomyces cerevisae, Schizosaccharomyces pombe,
Arabidopsis thaliana, mouse and human cells (Wang et al., 2010). RNA-Seq is widely
applied in scientific study because it can give a clearer and more understanding image
about transcriptomes compared to DNA microarray and serial analysis of gene expression
(SAGE) approach. Before next generation sequencing such as RNA-Seq is introduced,
Sanger sequencing of cDNA or EST libraries are used to study the cDNA sequence (Wang
et al., 2010). However, there are limitations of using EST libraries such as low throughput,
less quantitative and expensive. Therefore, RNA-Seq, one of methods for mapping and
quantifying whole transcriptomes is introduced to overcome the limitations of the first
generation sequencing (Wang et al., 2010). Benefits of RNA-Seq are listed as the
followings (Nagalakshmi et al., 2010; Perdacher, 2011; Wang et al., 2010) :
1) Undefined genome sequences from non-model organisms such as centipedes can be
studied and determined via RNA-Seq;
2) A hypothesis-free experiment can be designed and created;
3) Species with low resolution of genome annotation can be investigated in a high
throughput way, and
4) Transcription start codon and boundaries can be easily located and identified, while
exon expression and splicing variants can be measured in precise.
Page 18
6
2.4 Functional annotation and gene ontology (GO)
Functional annotation is a term where the information about a gene’s identity such as
biological process, cellular component and molecular component is collected, analysed and
described by referring controlled vocabularies, the gene ontology (GO) (Berardini et al.,
2010).
GO is a method where the various vocabularies about biological process, cellular
component and molecular functions are standardized via consortium of model organisms
database (MODs) (Xiong, 2006). He also stated that three parts of GO: biological process,
cellular component and molecular functions are described in a hierarchy way, in which the
specificity of a functional gene is described from general (top level) to more specified (low
level).
Besides, it is a project which its function is to address the gene products with
consistent descriptions across the databases. Furthermore, there are 3 considerations in GO
as shown in the followings (Gene Ontology Consortium, n.d.):
a) Development and maintenance of the ontologies;
b) Gene products annotation, and
c) Tools development in facilitating the maintenance and use of ontologies.
Page 19
7
2.5 Reads per kb per million reads (RPKM) and Blast2GO® program
2.5.1 RPKM
The RPKM is a method where the calculation of gene expression is not influenced by the
gene length and sequencing discrepancy (Zheng et al., 2012). The comparison of gene
expression between samples can be directly determined once RPKM is used.
2.5.2 Blast2GO® program
Blast2GO, a software tool, was developed in 2005 (Conesa et al., 2005). It was developed
to overcome limitations faced in applying gene ontology (GO) terms such as low
throughput sequence annotation, low visualization degree and high restriction to annotated
sequences from public database. The software tool is initiated by 5 processes: Blast
searching from public database such as NCBI, mapping to extract GO terms, application of
annotation rule in annotation step, statistical analysis which performs in bar or pie charts
and lastly, visualization process (Conesa et al., 2005). There are many features found in the
program: vocabularies, data mining, high configuration, high-throughput, user-friendly and
low maintenance (Conesa et al., 2005).
2.6 WEGO tool
WEGO, or Web Gene Ontology Annotation, is a useful web tool playing its role in graph
plotting, visualization and comparison (Ye et al., 2006). By using the WEGO, a histogram
with GO annotation results is created via directed acyclic graph (DAG) structure.
According to Ye et al. (2006), the WEGO tool has been widely applied in rice genome
project and silkworm genome project. They also mentioned that the web tool is user-
friendly and operating system independent, which allows user easy to manipulate the GO
annotation distribution graph plotting.
Page 20
8
2.7 Fold change
There are two definitions of fold change, which are FCratio and FC difference. FCratio is the
ratio of the mean control and mean treatment observation as studied by Tusher et al. (2001).
Meanwhile, FC difference defines as the difference of the mean log control and mean log
treatment data (Guo et al. as cited in Witten and Tibshirani, 2007). The fold change is
widely used in the study of differentially-expressed genes. Witten and Tibshirani (2007)
also stated that the fold change in identifying differential-expressed genes is more
preferable to be studied and measured in biological way compared to statistical way.
Page 21
9
3.0 MATERIALS AND METHODS
3.1 RNA-Seq data generation
The developing xylem and leaves tissues were collected from a 2-year old kelampayan tree.
RNA was extracted from the collected tissues and further prepared for cDNA library
construction. cDNA libraries were constructed by using ScriptSeqTM Complete Kit
(Epicentre, USA) and Illumina HiSeq 2500 (Illumina Inc. USA) was applied to carry out
sequencing. By using CLC Genomics Workbench 7.5 (Qiagen, Denmark), low quality
reads and unwanted adaptors were removed by quality trimming process with default
parameters. The good reads were then mapped to the reference transcriptome which was
obtained via ESTs and transcripts combination. RPKM was applied in normalizing the
expression value of the matched transcripts. The differential expression level of the
transcripts was analysed in a spread sheet.
3.2 Gene ontology annotation using Blast2GO®
Before the functional annotation analysis began, Blast2GO basic version was downloaded
into the notebook. The annotation file was loaded from the computer to the downloaded
Blast2GO software by clicking File > Load project. The time period for loading the
annotation files was depending on the speed of internet and the notebook.
After loading the file, the annotated transcripts with descriptions appeared on main
sequence table (Figure 3.1). After that, in order to show an overall picture of GO
annotations, the file was then being exported into a WEGO format by clicking File >
Export > Export Annotations. The exported file was later be used in WEGO web tool.
However, before using the WEGO tool, a little modification was applied to the exported
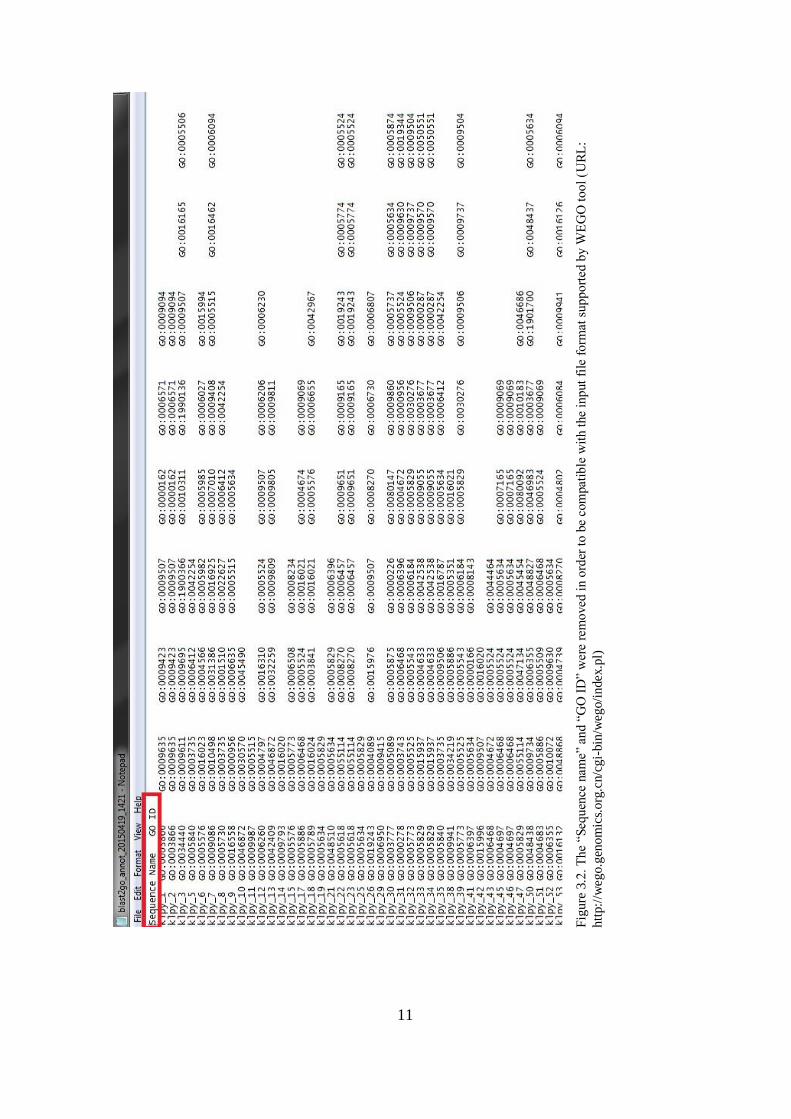
file, which the words of “Sequence name” and “GO ID” were removed (Figure 3.2).
Page 22
10
Fig
ure
3.1
. T
he
annota
ted t
ransc
rip
ts a
ppea
red o
n m
ain s
equen
ce t
able
(b
lue
colo
ur)
.
Page 23
11
Fig
ure
3.2
. T
he
“Seq
uen
ce n
ame”
an
d “
GO
ID
” w
ere
rem
oved
in
ord
er t
o b
e co
mpat
ible
wit
h t
he
input
file
form
at s
upport
ed b
y W
EG
O t
ool
(UR
L:
htt
p:/
/weg
o.g
enom
ics.
org
.cn/c
gi-
bin
/weg
o/i
ndex
.pl)
Page 24
12
3.3 Visualization of GO annotation via WEGO tool
After that, the internet browser was opened and the WEGO web tool website was found
(Figure 3.3). The file was uploaded to a place provided by the website. The GO archive
date was set as the latest period provided by the WEGO website. Also, the input file format
of the WEGO website was set as WEGO Native Format. The “upload” button was clicked
and few minutes were taken for loading the analysis.
A list of level 2 and level 3 GO terms for 3 GO categories appeared on the monitor
screen as shown in Figure 3.4. The interested level 2 GO terms was selected by ticking the
box provided. After selecting, the “plot” button was clicked. A histogram setting appeared
on the screen. The setting such as colour, width and length of the graph were adjusted.
Then, a histogram showed the GO annotations distributions were created by downloading
it in jpeg or png format. An analysis of the graph was studied and recorded in Results and
Discussion section.
3.4 Differential expression analysis
Besides functional annotation analysis, transcripts expression analysis was studied by
using Microsoft Excel. A column entitled “Up-/Down-regulated” was added beside with
Fold Change column (Figure 3.5). Each transcript was determined whether it was up-/
down-regulated based on Fold Change value. A series of analysis activity such as the
number of expressed transcripts, the number of up-regulated transcripts, the number of
down-regulated transcripts, and the number of differentially expressed transcripts were
determined. Graphs and tables were constructed and studied in Results and Discussion
section.