5 Country Case Study 1 Nepal: Glaciers, glacier retreat and its impacts Background Shaped roughly like a rectangle, there are about 23.6 million people inhabiting Nepal. With China to the north and India on three other sides, the Nepali economy faces the uphill task of rectifying highly skewed development indices: access to electricity, drinking water and telecommunications are far outnumbered by people living on less than USD two per day. Agriculture is the mainstay of the economy, providing livelihoods for over 80 percent of the population. Nepal also has one of the highest population densities in the world with respect to cultivable land (MOPE 2000). In the fiscal year 2001-02, the share of agriculture in GDP was 37.9 percent. The total land used for agricultural operation is 20.2 percent of the total area of Nepal. Industrial activity mainly involves the processing of agricultural products including sugarcane, tobacco, jute and grain. The climate varies from sub-tropical to arctic in a span of less than 200 km. There is a wide range of natural resources, the most prominent among them being water and the Himalayas. In theory, the hydropower potential in Nepal is estimated at 83,000 MW (Shrestha 1985). While the practical potential might only be 50 percent of the theoretical, the total installed capacity of hydropower is only 494.9 MW on the ground—about 0.6 percent of the theoretical potential. Clearly, there is a lot to achieve in this field alone if hydropower is to be an indubitable anchor of Nepal’s future development. Irrigation facilities and water supply also have to be enhanced. Geography Nepal is situated between latitudes of 26 0 22' to 30 0 27' north and between longitudes of 80 0 4' to 88 0 12' east. The east-west length of the country is about 800 km, roughly parallel to the Himalayan axis, and the average north-south width is 140 km. Within the 147,181 km 2 area of the country, physiographic regions range from tropical forests in the south to the snow and ice covered Himalayas in the north. Nepal has a very diverse environment resulting from its impressive topography. A cross-section of the country reveals that the topography generally progresses from altitudes of less than 100 m in the southern Terai plain, up to more than 8,000 m peaks in the north. Nepal can be divided into five ecological regions according to the Department of Survey (1978): 1. Terai: This is the northern part of Indo-Gangetic plain. The Terai extends nearly 800 km from east to west and about 30-40 km from north to south. The average elevation is below 750 m, including Terai region, Bhavar Terai and Inner Terai. 2. Siwalik: Commonly referred to as the Churia Hills, the elevation in the Siwalik ranges from 700 to 1,500 m. Due to its loose friable nature and extensive deforestation in past decades, this region experiences frequent landslides that contributes largely to the sediment load in many Nepali rivers.
Transcript
5
Country Case Study 1 Nepal: Glaciers, glacier retreat and its impacts Background Shaped roughly like a rectangle, there are about 23.6 million people inhabiting Nepal. With China to the north and India on three other sides, the Nepali economy faces the uphill task of rectifying highly skewed development indices: access to electricity, drinking water and telecommunications are far outnumbered by people living on less than USD two per day. Agriculture is the mainstay of the economy, providing livelihoods for over 80 percent of the population. Nepal also has one of the highest population densities in the world with respect to cultivable land (MOPE 2000). In the fiscal year 2001-02, the share of agriculture in GDP was 37.9 percent. The total land used for agricultural operation is 20.2 percent of the total area of Nepal. Industrial activity mainly involves the processing of agricultural products including sugarcane, tobacco, jute and grain. The climate varies from sub-tropical to arctic in a span of less than 200 km. There is a wide range of natural resources, the most prominent among them being water and the Himalayas. In theory, the hydropower potential in Nepal is estimated at 83,000 MW (Shrestha 1985). While the practical potential might only be 50 percent of the theoretical, the total installed capacity of hydropower is only 494.9 MW on the ground—about 0.6 percent of the theoretical potential. Clearly, there is a lot to achieve in this field alone if hydropower is to be an indubitable anchor of Nepal’s future development. Irrigation facilities and water supply also have to be enhanced. Geography Nepal is situated between latitudes of 26022' to 30027' north and between longitudes of 8004' to 88012' east. The east-west length of the country is about 800 km, roughly parallel to the Himalayan axis, and the average north-south width is 140 km. Within the 147,181 km2 area of the country, physiographic regions range from tropical forests in the south to the snow and ice covered Himalayas in the north. Nepal has a very diverse environment resulting from its impressive topography. A cross-section of the country reveals that the topography generally progresses from altitudes of less than 100 m in the southern Terai plain, up to more than 8,000 m peaks in the north. Nepal can be divided into five ecological regions according to the Department of Survey (1978): 1. Terai: This is the northern part of Indo-Gangetic plain. The Terai extends nearly 800 km from east to west and about 30-40 km from north to south. The average elevation is below 750 m, including Terai region, Bhavar Terai and Inner Terai. 2. Siwalik: Commonly referred to as the Churia Hills, the elevation in the Siwalik ranges from 700 to 1,500 m. Due to its loose friable nature and extensive deforestation in past decades, this region experiences frequent landslides that contributes largely to the sediment load in many Nepali rivers.
6
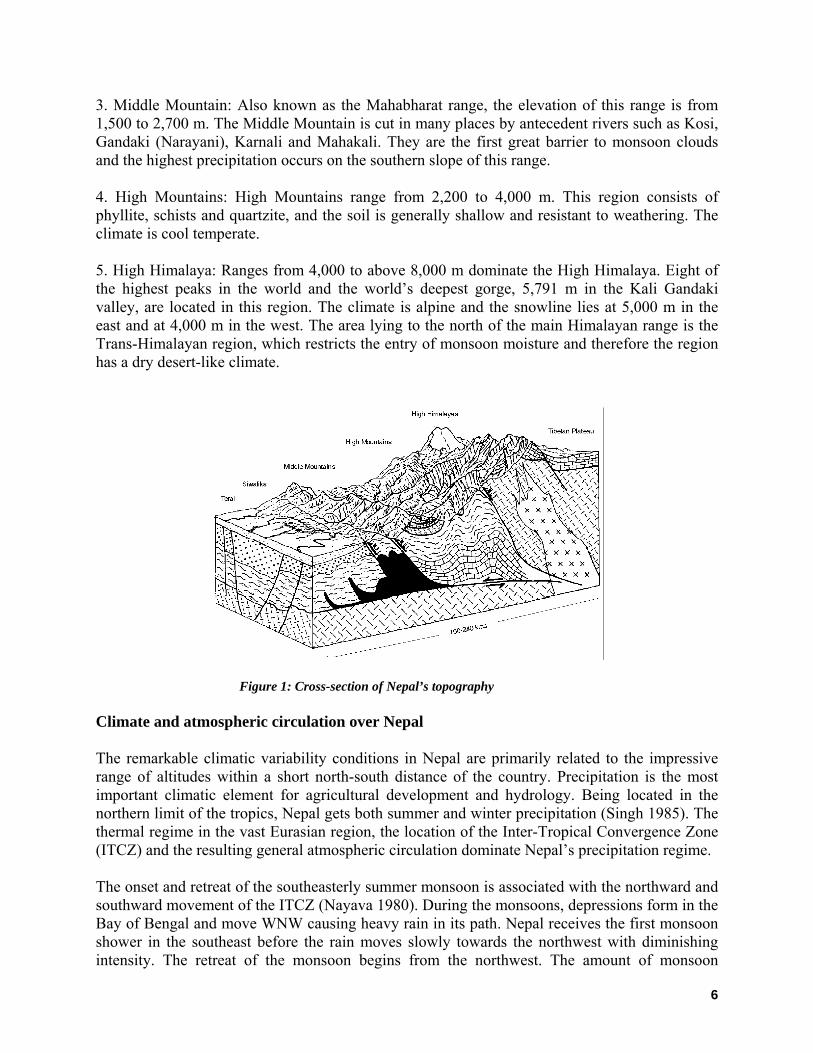
3. Middle Mountain: Also known as the Mahabharat range, the elevation of this range is from 1,500 to 2,700 m. The Middle Mountain is cut in many places by antecedent rivers such as Kosi, Gandaki (Narayani), Karnali and Mahakali. They are the first great barrier to monsoon clouds and the highest precipitation occurs on the southern slope of this range. 4. High Mountains: High Mountains range from 2,200 to 4,000 m. This region consists of phyllite, schists and quartzite, and the soil is generally shallow and resistant to weathering. The climate is cool temperate. 5. High Himalaya: Ranges from 4,000 to above 8,000 m dominate the High Himalaya. Eight of the highest peaks in the world and the world’s deepest gorge, 5,791 m in the Kali Gandaki valley, are located in this region. The climate is alpine and the snowline lies at 5,000 m in the east and at 4,000 m in the west. The area lying to the north of the main Himalayan range is the Trans-Himalayan region, which restricts the entry of monsoon moisture and therefore the region has a dry desert-like climate.
Figure 1: Cross-section of Nepal’s topography Climate and atmospheric circulation over Nepal The remarkable climatic variability conditions in Nepal are primarily related to the impressive range of altitudes within a short north-south distance of the country. Precipitation is the most important climatic element for agricultural development and hydrology. Being located in the northern limit of the tropics, Nepal gets both summer and winter precipitation (Singh 1985). The thermal regime in the vast Eurasian region, the location of the Inter-Tropical Convergence Zone (ITCZ) and the resulting general atmospheric circulation dominate Nepal’s precipitation regime. The onset and retreat of the southeasterly summer monsoon is associated with the northward and southward movement of the ITCZ (Nayava 1980). During the monsoons, depressions form in the Bay of Bengal and move WNW causing heavy rain in its path. Nepal receives the first monsoon shower in the southeast before the rain moves slowly towards the northwest with diminishing intensity. The retreat of the monsoon begins from the northwest. The amount of monsoon
7
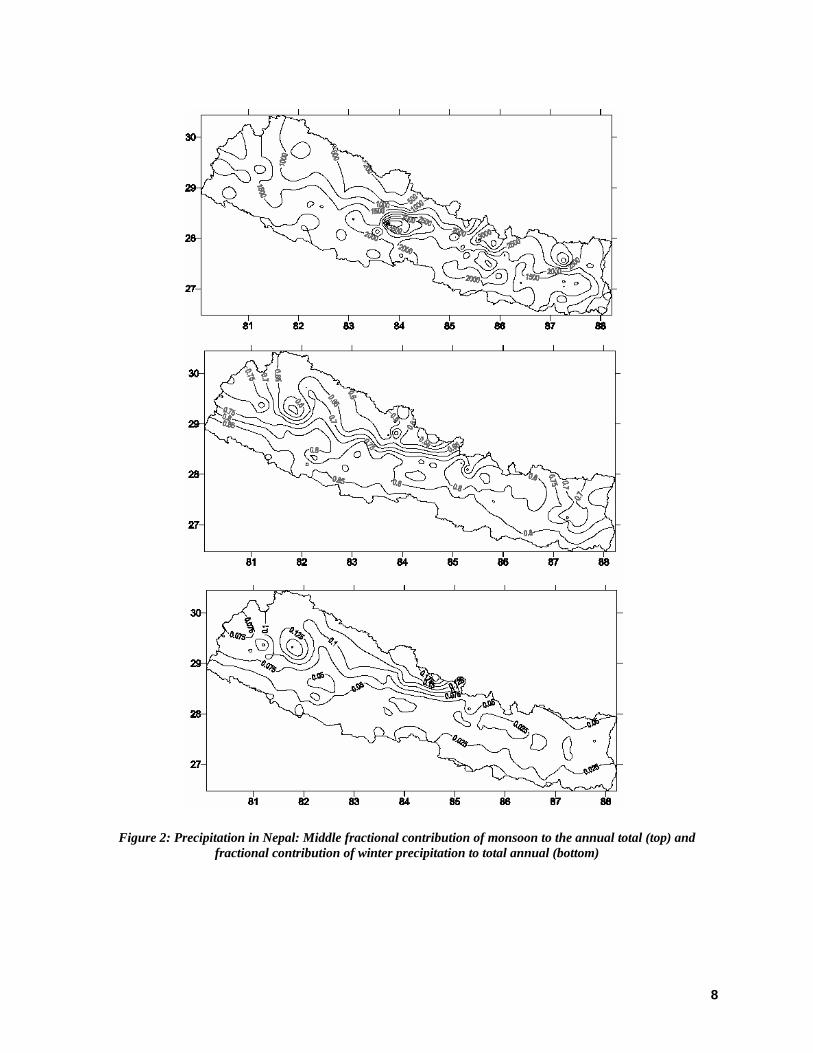
precipitation shows a marked variation from south to north and east to west. Further, the contribution of the monsoon precipitation to the annual total is substantially greater in the southeastern part of the country compared to the northwest. In addition, there is also the altitudinal dependence of monsoon precipitation. Maximum precipitation occurs around 1,000 m in the Narayani basin, at around 1,500 m in the Sapta Kosi basin, whereas in the Karnali basin for the maximum precipitation, altitude is ambiguous (Alford 1992). Winter precipitation is caused by the westerly disturbances originating in the Mediterranean. The lows formed here are steered and swept eastwards by the westerly aloft. Westerly disturbances affect the northern and western parts of Nepal (Singh 1985). Winter precipitation contributes significantly to the annual total precipitation in Nepal’s northwest. It plays a major role in the mass balance of glaciers in western Nepal while playing a secondary role in the glaciers of eastern and central Nepal (Seko and Takahashi 1991). Although winter precipitation is not as impressive in volume or intensity as the summer monsoon, it is of vital importance in generating lean flow for agriculture. Most of the winter precipitation falls as snow and nourishes snowfields and glaciers and generates melt water in dry seasons between February and April. Lower temperatures mean less evaporation and rain of lesser intensity can have a higher rate of percolation that nourishes the root zone of the soil. The summer monsoon is economically the most important season. The average precipitation in the country is 1,768 mm (Shrestha 2000), but it varies greatly from place to place owing to sharp topographical variation (Nayava 1980). As the rain bearing winds approach Nepal from the southeast in the summer monsoon season, heavier rainfall occurs in the foothills of the Churia range, increasing with altitude on the windward side and sharply decreasing in the leeward side. Monsoon precipitation occupies 70 to 85 percent of total precipitation depending on the location (Singh 1985; Ives & Messerli 1989). The precipitation occurs in a solid form in the high altitude and plays an important role in the nourishment of numerous Himalayan glaciers, most of which are of the summer accumulation type in central and eastern Nepal. The maximum temperature of the year occurs in May or early June. Temperature starts decreasing from October and reaches the minimum in December or January. As temperature decreases with height, spatial variations are influenced by altitude. The hottest part of the country is the Terai belt where maximum temperatures cross 45ºC. The highest temperature ever recorded is 46.4 ºC in Dhangadhi, a town in far western Terai, in June 1995.
8
Figure 2: Precipitation in Nepal: Middle fractional contribution of monsoon to the annual total (top) and fractional contribution of winter precipitation to total annual (bottom)
9
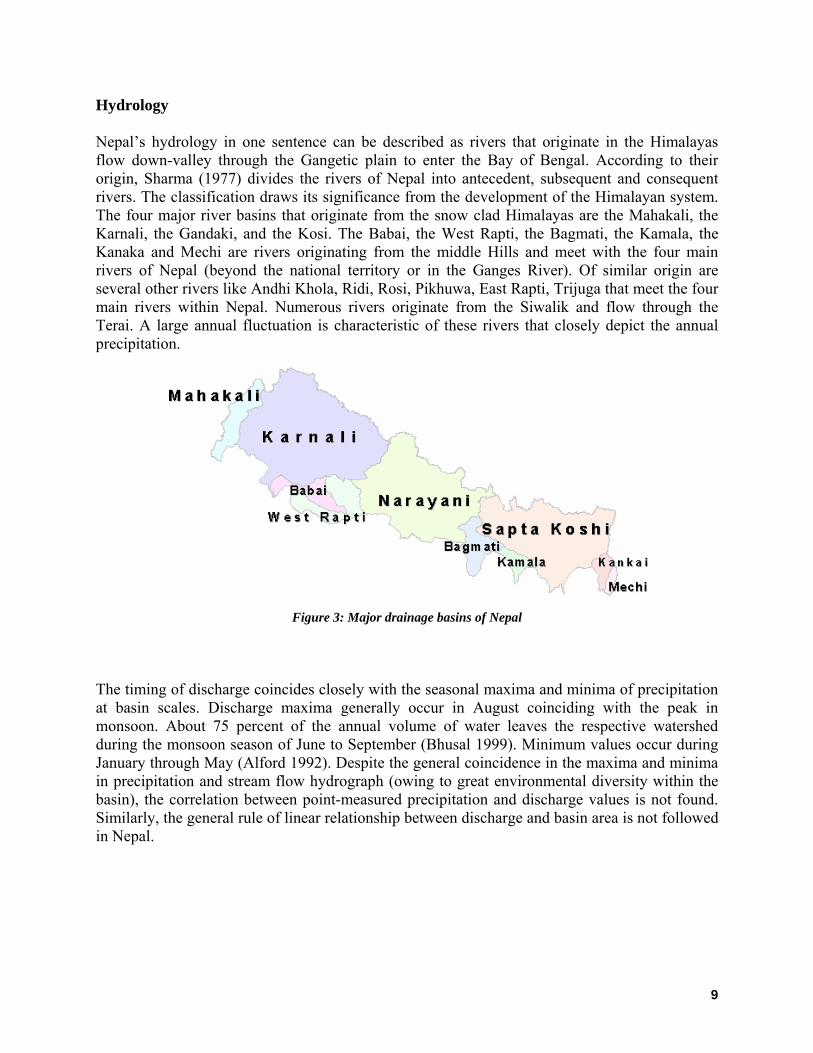
Hydrology Nepal’s hydrology in one sentence can be described as rivers that originate in the Himalayas flow down-valley through the Gangetic plain to enter the Bay of Bengal. According to their origin, Sharma (1977) divides the rivers of Nepal into antecedent, subsequent and consequent rivers. The classification draws its significance from the development of the Himalayan system. The four major river basins that originate from the snow clad Himalayas are the Mahakali, the Karnali, the Gandaki, and the Kosi. The Babai, the West Rapti, the Bagmati, the Kamala, the Kanaka and Mechi are rivers originating from the middle Hills and meet with the four main rivers of Nepal (beyond the national territory or in the Ganges River). Of similar origin are several other rivers like Andhi Khola, Ridi, Rosi, Pikhuwa, East Rapti, Trijuga that meet the four main rivers within Nepal. Numerous rivers originate from the Siwalik and flow through the Terai. A large annual fluctuation is characteristic of these rivers that closely depict the annual precipitation.
Figure 3: Major drainage basins of Nepal The timing of discharge coincides closely with the seasonal maxima and minima of precipitation at basin scales. Discharge maxima generally occur in August coinciding with the peak in monsoon. About 75 percent of the annual volume of water leaves the respective watershed during the monsoon season of June to September (Bhusal 1999). Minimum values occur during January through May (Alford 1992). Despite the general coincidence in the maxima and minima in precipitation and stream flow hydrograph (owing to great environmental diversity within the basin), the correlation between point-measured precipitation and discharge values is not found. Similarly, the general rule of linear relationship between discharge and basin area is not followed in Nepal.
10
DrainageRiver Area Jan Feb Mar Apr May Jun Jul Aug Sep Oct Nov Dec Year
1 data taken from DHM, 19982 data taken from Bhusal, 1999
Discharge (cumec)Table 1. Discharge data of major rivers of Nepal.
The topography and geology of Nepal is favorable to soil erosion and mass wasting. Erosion rates vary largely and range between 800 to 57,000 T per km2 (Bhusal 1998 and references therein). As a result, sediment loads in the rivers of Nepal are among the highest in the world. The monsoon is mainly responsible for surface erosion and sediment load closely follows the river discharge, peaking in August. Relevance of climate change Climate plays a large role in determining the feasibility of hydro-projects. Climate projections show that potential change in precipitation and temperature brought about by climate change could affect runoff. This in turn affects the potential water utilization and the benefits of establishing or continuing to operate a hydropower plant. It may also affect demand for electricity, although the influence of climate change on demand would probably be quite low. Extreme events such as glacial lake outburst floods (GLOFs) have the largest potential affect on water resources project because the force of a GLOF is often capable of destroying all hydropower infrastructure in a very short period. This happened in the Dig Tsho GLOF in 1985 that completely swept away the recently completed USD 1.5 Million Namche Hydropower Plant in the Khumbu region. These climate concerns can span a variety of time scales, ranging from seasonal to interannual variability. In the coming years, hydropower planners may also need to incorporate measures to adapt to climate change, particularly in Nepal where GLOF events occur on a massive scale.
11
Observed climatic trends in Nepal Temperature Analyses of observed temperature and precipitation data in Nepal are limited. One of the reasons behind this is the relatively short length of records of about 30 years. From available studies, it has been found that temperatures in Nepal are increasing at a rather high rate. The warming seems to be consistent and continuous after the mid-1970s. The average warming in annual temperature between 1977 and 1994 was 0.06 ºC/yr (Shrestha et al. 1999). The warming is found to be more pronounced in the high altitude regions of Nepal such as the Middle Mountain and the High Himalaya, while the warming is significantly lower or even lacking in the Terai and Siwalik regions. Further, warming in the winter is more pronounced compared to other seasons. In this sense the trends in observed data are in agreement with projections made by climate models. The temperature data for Kathmandu (the longest record from Nepal) was compared to the global data (mean over a ban of 24o to 40 o N latitude around the globe; see Fig 5). It can be seen that there is a general resemblance between these two series: the generally decreasing trend from the 1940s to the 1970s and the continuous increasing trend thereafter. This suggests that the climatic variations in Nepal are closely connected to global climatic changes, probably being influenced by global greenhouse gas emissions. Similar warming trends observed in Nepal are also observed in the Tibetan Plateau. Liu et al. (2002) show that warming is more pronounced in higher altitude stations than in lower ones in the Tibetan Plateau. In contrast, the widespread area of lowland India does not show significant warming. This suggests that the Himalayas and the Tibetan Plateau, being elevated regions of the globe, are sensitive to and affected by climate change.
12
Figure 4: Spatial distribution of annual average maximum temperature trends in Nepal (1977 to 1994)
Table 2: Regional Annual Average Maximum Temperature Trends for the period 1977-94 (°C per year)
Seasonal Annual Regions Winter Pre-monsoon Monsoon Post-monsoon Jan-Dec
Dec-Feb Mar-May Jun-Sep Oct-Nov
Trans-Himalaya 0.12a 0.01 0.11b 0.10c 0.09 b Himalaya 0.09 b 0.05 0.06 b 0.08 a 0.06 b Middle Mountains 0.06 c 0.05 0.06 b 0.09 b 0.08 b Siwalik 0.02 0.01 0.02 0.08 a 0.04 a Terai 0.01 0.00 0.01 0.07 a 0.04 a All-Nepal 0.06 a 0.03 0.051 a 0.08 b 0.06 b a p ≥ 0.01 b p ≥ 0.001 c p ≥ 0.05
-0.09 -0.05 0.00 0.05 0.09
0.00
82 84 86 88
30
29
28
27
Longitude (oE)
Color Coding of temperature trends
(oC year-1)
13
-3-2-10123
1960 1970 1980 1990
b) Himalaya W
-3-2-10123
1960 1970 1980 1990
c) Himalaya E
-3-2-10123
1960 1970 1980 1990
d) Middle Mountain W
-3-2-10123
1960 1970 1980 1990
e) Middle Mountain E
-3-2-10123
1960 1970 1980 1990
f) Terai/Siwalik W
Years1960 1970 1980 1990
-3-2-10123
g) Terai/Siwalik E
Years
-3-2-10123
All-Nepal All-Nepal Smoothed
1950 1960 1970 1980 1990
a) All-Nepal
-0.6
-0.4
-0.2
0.0
0.2
0.4
0.6
0.8
-2.0
-1.0
0.0
1.0
2.0
3.0
1900 1920 1940 1960 1980 2000
24-40oN LatitudeKathmandu
All-NepalK
athm
andu
and
24-
40o N
Lat
itude
Tem
pera
ture
Ano
mal
y (o C
)
All-N
epal Temperature A
nomaly ( oC
)
Year
Figure 5: Comparison between temperature trends in Kathmandu, All-Nepal and globally. The Kathmandu data is a 5 year running mean of annual mean maximum temperature data from Kathmandu Indian Embassy station, which after 1976 was closed and the data after 1976 was extrapolated using data of four other station in Kathmandu Valley.The zonal mean temperature of 24 to 40oN latitude band developed by Hansen (1996) was used as a global temperature indicator. All-Nepal temperature was developed by Shrestha et al (1999) based on annual mean maximum temperature of 49 stations around Nepal. Figure 6: Time series of precipitation in Nepal: a. All-Nepal, b. Western Himalaya c. Eastern Himalaya d. Western Middle-Mountan, e. Eastern Middle-Mountain f. Western Terai and Siwalik g. Eastern terai and Siwalik.
14
Precipitation Similar analysis on precipitation data, however, does not reveal any significant trends though oscillatory characteristics are present in the precipitation series (Shrestha et al. 2000). Similar to temperature, precipitation in Nepal is found to be influenced by or correlated to several large-scale climatological phenomena including El Niño/Southern Oscillation, regional scale land and sea-surface temperature changes and extreme events such as volcanic eruptions. Climate change projections The Intergovernmental Panel on Climate change (IPCC) provides a comprehensive review of climate models’ results in terms of temperature and precipitation projections (IPCC 2001). The most complex climate models are called atmosphere-ocean general circulation models (AOGCMs) that couple atmospheric general circulation models with ocean general circulation models, sea-ice models and models of land-surface processes. These show greater than average warming in the South Asian region in summer. There is a general consistency among the models in their output for winter while the agreement is less for summer. The mean temperature increases for the period 2071 to 2100 relative to the period 1961 to 1990 is about 4ºC for the Special Report on Emission Scenario (SRES) A2 and about 3ºC for SRES B2 (see Fig 7, top). In contrast, the consistency among models in precipitation predictions, as well as the significance of projected changes is low both for the winter as well as the summer seasons (see Fig 7, bottom). The Organization for Economic Co-operation and Development (OECD) performed an assessment of 12 recent General Circulation Models (GCMs) in 2003. The best seven GCM were run with the SRES B2 scenario. The results show significant and consistent increase in temperature projected for Nepal for the years 2030, 2050 and 2100 across various models. This analysis also shows somewhat larger warming in winter months than in summer. The projected change above the baseline average is 1.2ºC for 2030, 1.7ºC for 2050 and 3.0ºC for 2100. This analysis also agrees with the IPCC analysis on the projection of precipitation change i.e. less significant change and high standard deviation among the model results. A similar analysis done for Nepal under the First National Communication for United Nations Framework convention on Climate Change (UNFCCC) is also somewhat in agreement with the IPCC and OECD results (DHM 2004). The effect of climate change on stream flow varies regionally and between climate scenarios, largely following projected changes in precipitation. In South Asia, HadCM3 shows increase in annual runoff ranging from 0 to150 mm/yr by the year 2050, relative to average runoff for the period 1961-1990, while the older version HadCM2 projects show a decrease of up to 250 mm/yr. These climate models are unable to highlight the details on seasonal variations in runoff, although it is generally suggested that due to higher evaporation and decrease in glacier mass, the low flows are likely to decrease (IPCC 2001).
15
Figure 7: Changes in temperature (top) and precipitation (bottom) for SERES scenario B2. The background shows the annual mean changes and the boxes are inter-model consistency in regional temperature and precipitation changes.
Table 3: GCM Estimates for temperature and precipitation changes in Nepal
16
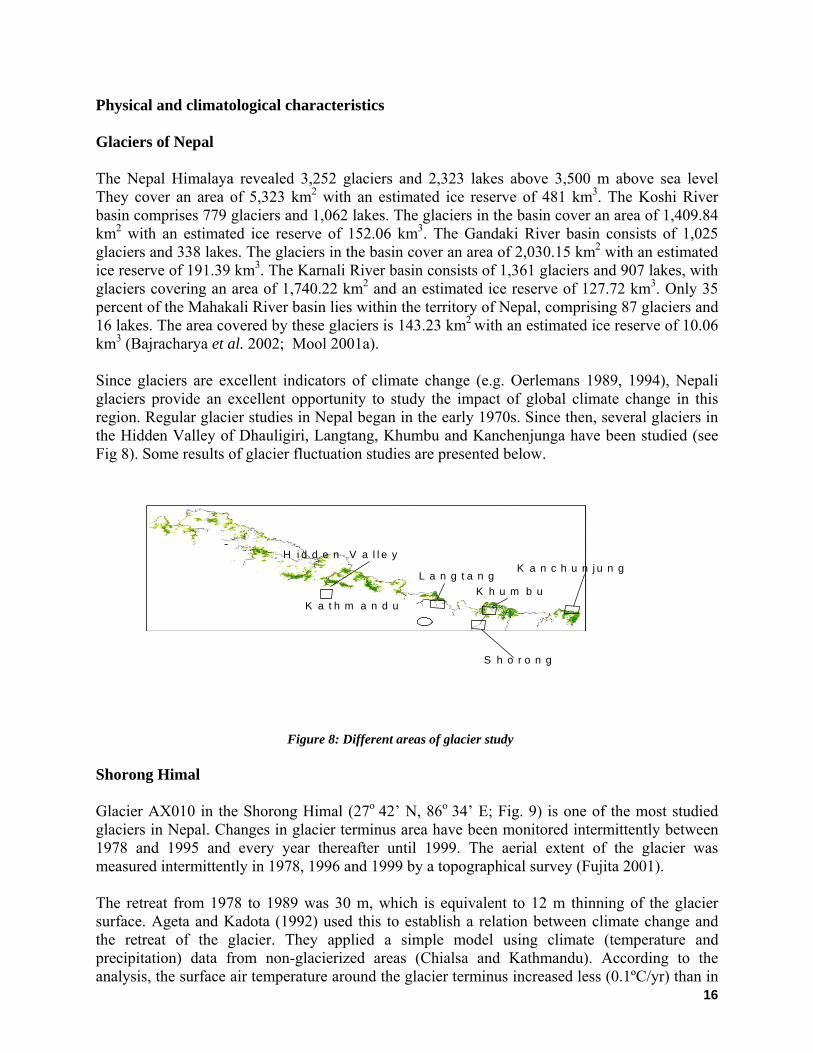
Physical and climatological characteristics Glaciers of Nepal The Nepal Himalaya revealed 3,252 glaciers and 2,323 lakes above 3,500 m above sea level They cover an area of 5,323 km2 with an estimated ice reserve of 481 km3. The Koshi River basin comprises 779 glaciers and 1,062 lakes. The glaciers in the basin cover an area of 1,409.84 km2 with an estimated ice reserve of 152.06 km3. The Gandaki River basin consists of 1,025 glaciers and 338 lakes. The glaciers in the basin cover an area of 2,030.15 km2 with an estimated ice reserve of 191.39 km3. The Karnali River basin consists of 1,361 glaciers and 907 lakes, with glaciers covering an area of 1,740.22 km2 and an estimated ice reserve of 127.72 km3. Only 35 percent of the Mahakali River basin lies within the territory of Nepal, comprising 87 glaciers and 16 lakes. The area covered by these glaciers is 143.23 km2 with an estimated ice reserve of 10.06 km3 (Bajracharya et al. 2002; Mool 2001a). Since glaciers are excellent indicators of climate change (e.g. Oerlemans 1989, 1994), Nepali glaciers provide an excellent opportunity to study the impact of global climate change in this region. Regular glacier studies in Nepal began in the early 1970s. Since then, several glaciers in the Hidden Valley of Dhauligiri, Langtang, Khumbu and Kanchenjunga have been studied (see Fig 8). Some results of glacier fluctuation studies are presented below.
K a t h m a n d u
H i d d e n V a l l e y
L a n g t a n gK h u m b u
S h o r o n g
K a n c h u n j u n g
Figure 8: Different areas of glacier study
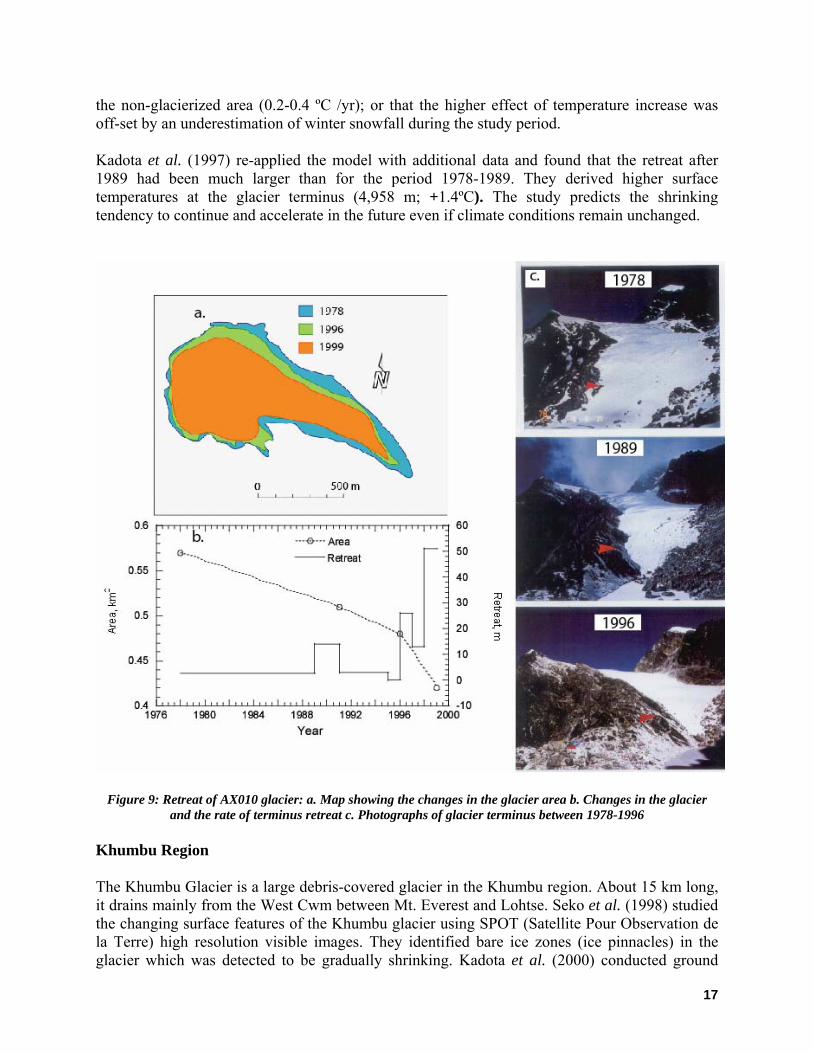
Shorong Himal Glacier AX010 in the Shorong Himal (27o 42’ N, 86o 34’ E; Fig. 9) is one of the most studied glaciers in Nepal. Changes in glacier terminus area have been monitored intermittently between 1978 and 1995 and every year thereafter until 1999. The aerial extent of the glacier was measured intermittently in 1978, 1996 and 1999 by a topographical survey (Fujita 2001). The retreat from 1978 to 1989 was 30 m, which is equivalent to 12 m thinning of the glacier surface. Ageta and Kadota (1992) used this to establish a relation between climate change and the retreat of the glacier. They applied a simple model using climate (temperature and precipitation) data from non-glacierized areas (Chialsa and Kathmandu). According to the analysis, the surface air temperature around the glacier terminus increased less (0.1ºC/yr) than in
17
the non-glacierized area (0.2-0.4 ºC /yr); or that the higher effect of temperature increase was off-set by an underestimation of winter snowfall during the study period. Kadota et al. (1997) re-applied the model with additional data and found that the retreat after 1989 had been much larger than for the period 1978-1989. They derived higher surface temperatures at the glacier terminus (4,958 m; +1.4ºC). The study predicts the shrinking tendency to continue and accelerate in the future even if climate conditions remain unchanged.
Figure 9: Retreat of AX010 glacier: a. Map showing the changes in the glacier area b. Changes in the glacier and the rate of terminus retreat c. Photographs of glacier terminus between 1978-1996
Khumbu Region The Khumbu Glacier is a large debris-covered glacier in the Khumbu region. About 15 km long, it drains mainly from the West Cwm between Mt. Everest and Lohtse. Seko et al. (1998) studied the changing surface features of the Khumbu glacier using SPOT (Satellite Pour Observation de la Terre) high resolution visible images. They identified bare ice zones (ice pinnacles) in the glacier which was detected to be gradually shrinking. Kadota et al. (2000) conducted ground
18
surveys of the Khumbu glacier in 1995 and compared the results with those of the 1978 survey. They found that the surface of the glacier lowered about 10 m throughout the debris-covered ablation area. Slowing down of the ice flow was also detected, which means shrinkage may accelerate even if ablation conditions remain unchanged. Naito et al. (2000) developed a model coupling mass balance and flow dynamics of debris-covered glaciers and applied it to the Khumbu Glacier. The model predicts formation and enlargement of a depression in the lower ablation area about 5 km upstream of the terminus. This depression could transform into a glacier lake in future (see Fig 10).
Figure 10. The longitudinal profile of Khumbu Glacier. The solid line represents the profile of 1978, the dashed
line represents simulated result for 1999 and dotted lines are simulated results for 2020, 2040 and 2060. The circles and cross symbols represent survey positions in 1978 and 1999 respectively.
Yamada et el (1992) reviewed terminus fluctuations of seven clean-type glaciers in the Khumbu region for the 1970s to 1989 period. A majority of the glaciers were found to have retreated in the range of 30 to 60 m during the observed period. Langtang Region Yala Glacier is the most studied glacier in the Langtang region in terms of glacier fluctuations. The glacier terminus was surveyed in 1982 (Ageta et al. 1984) and glacier fluctuation was studied both by photogrametry and ground survey. Fujita et al. (1998) conducted a survey of the Yala Glacier terminus in September 1994, and in May and October of 1996. The retreat rate along an arbitrary line X on the glacier as shown in the figure below makes it clear that the retreat rate and surface lowering have accelerated in recent years.
19
Figure 11: a: Fluctuation of nine different points on the terminus of Yala Glacier b: Terminus retreat and surface lowering of Yala Glacier during different periods.
Similarly, a transverse profile of the Lirung Glacier with debris-covered lower parts was surveyed in 1987 and in 1989. While there is no major change in the profile, photographs taken at different times show the glacier’s retreat (see Fig 12). There is an indication that the upper steep part and the lower flatter part will separate in the near future. The Department of Hydrology and Meteorology (DHM) has been measuring different meteorological parameters including air temperature at Kyangjing, Langtang since 1987. There is a clear indication of an annual temperature rise at this region is at the rate of 0.27ºC/yr. However, this is quite a high rate and the relatively short record-length may not provide true judgment of the climatic trends prevailing in that region.
-10 -5 0 5 10 15
123456789
Terminus F luctuation (m)
Base Points
-5
-4
-3
-2
-1
0
1
1980 1985 1990 1995 2000
YearR
etre
at R
ate
(m y
-1)/
Surf
ace
Low
erin
g (m
)
Terminus Retreat
Surface Low ering
a. b.
20
Figure12: Lirung Glacier in a. 1985 and b. 2002
y = 0.2716x - 538.68R2 = 0.6006
0.0
1.0
2.0
3.0
4.0
5.0
6.0
1986 1988 1990 1992 1994 1996 1998 2000 2002
Years
Tem
pera
ture
(o C)
Figure 13: Annual mean temperature trend in Kyangjing, Langtang station (3,900 m)
21
Dhaulagiri Region Rika Samba Glacier (28o50' N 83o30' E) is the most studied glacier in the Hidden Valley, Kali Gandaki basin. The terminus position was surveyed initially in 1974 (Nakawo et al. 1976) and thereafter intermittently in 1994 (Fujita et al. 1997), 1998 and 1999 (Fujita et al. 2001). The terminus retreat is illustrated in Figure 14. The rate increased dramatically in the period between 1994 and 1998. A study on temperature trends at seven stations in this basin showed warming in average 0.025 oC per year in last 30 years.
Figure 14: Terminus position changes of Rika Samba Glacier Besides Rika Samba, termini altitudes of six other glaciers in the region were measured in 1994 using the altimeter and was compared with those found in 1974 (Fujita 1997). It confirmed that glacier retreat was a general trend in the Hidden Valley. Kanchenjunga Region Asahi et al. (2000) studied glacier fluctuations in the Ghunsa Khola basin, Kanchenjunga area. Based on aerial photo interpretation and field observations, clear morphological changes were indicated. These suggest glacier variation in the region during various stages in the past [Historical stage (around the early part of the 20th century), the Little Ice Age, the Holocene, and the late and early sub-stages of the Last Glaciation]. Further, a comparison of the 1992 glaciers with those of 1958 in the area revealed that out of 57 glaciers, 50 percent had retreated in the period from 1958 to 1992. In addition, 38 percent of the glaciers were under stationary conditions and 12 percent were advancing.
22
Impact of glacier retreat in Nepal River discharge More than 6,000 rivers and rivulets flow through Nepal. A comprehensive analysis of trends in river flow has not been performed yet. However, a preliminary analysis of river discharge i.e. trends in large outlet rivers, southern rivers and snow-fed rivers, has been carried out (Fig 15). Among the large rivers, Karnali and Sapta Koshi show decreasing trends although the records for Sapta Koshi are quite short. In contrast, the Narayani, another large river, displays an increasing trend. Southern rivers do not show any trend. All of the three snow-fed rivers examined showed declining trends in discharge. While these observations in river discharge are neither consistent nor significant in magnitude due to the short record-lengths and high inter-annual variability in discharge data, a separate study suggests that the number of flood days and consecutive days of flood events are increasing (Shrestha et al. 2003).
23
Figure 15: Discharge data of selected rivers: Large rivers (top); Southern rivers (middle) and Snowfed rivers (bottom) Source: DHM (1996)
1200
1400
1600
1800
2000
1960 1970 1980 1990 2000
Narayani
1000
1200
1400
1600
1800Sapta Kosi
1960 1970 1980 1990 2000500
1000
1500
2000
2500
Karnali
1960 1970 1980 1990 2000
m3 s
-1
50
100
150
200
250
1960 1970 1980 1990 2000
Rapti
40
60
80
100
120
1960 1970 1980 1990 2000
Kankai Mai
0
50
100
150
200
1960 1970 1980 1990 2000
Babai
m3 s
-1
150
200
250
300
350
1960 1970 1980 1990 2000
Dudh Kosi
Year
200
300
400
500
600
1960 1970 1980 1990 2000
Tamur
Year
300
400
500
600
700
1960 1970 1980 1990 2000
Kali Gandaki
m3 s
-1
Year
24
Glacier lakes and outburst floods
There are 2,315 glacier lakes of varies sizes, the total area of which is 75 km2. (ICIMOD/UNEP 2001). The formation and growth of glacier lakes is a phenomenon closely related to deglaciation. Valley glaciers generally contain supra-glacial ponds. Due to warming climate, these ponds grow bigger and merge. This process is accelerated by rapid retreat of glaciers. As the glacier retreats it leaves a large void behind. The ponds occupy the depression earlier occupied by glacial ice. The moraine walls that act as dams are structurally weak and unstable and under go constant changes due to slope failures, slumping, etc. and are in danger of catastrophic failure, causing glacier lake outburst floods (GLOFs). Principally, a moraine dam may break by the action of some external trigger or self-destruction. A huge displacement wave generated by rockslide or snow/ ice avalanche from glacier terminus into the lake may cause the water to overtop the moraines, create a large breach and eventually cause the dam failure (Ives 1986). Earthquakes may also be one of the factors triggering dam break depending upon its magnitude, location and characteristics. Self-destruction is caused by the failure of the dam slope and seepage from the natural drainage network of the dam.
A GLOF is characterized by a sudden release of a huge amount of lake water that rushes along the stream channel downstream in the form of dangerous flood waves. These floods waves comprise of water mixed with morainic materials and cause devastating consequences for riparian communities, hydropower stations and other infrastructure. The severity of flood wave depends upon the amount of water released, debris load and on basin characteristics of the watershed. Discharge rates of such floods are typically several thousand cubic meters per second.
The record of past disastrous GLOF event in Nepal is shown in Table 4 below. Although not new in Nepal, GLOFs attracted scientific and government attention only when Dig Tsho Glacier Lake flooded on 4 August 1985 in the Langmoche valley, Khumbu (Ives 1986; Yamada 1998). The lake, crescent in shape, was dammed by a 50 m high terminal moraine. The lake had a length of 0.605 km and width of up to 0.230 km in 1974 (ICIMOD/UNEP 2001). The GLOF was caused by detachment of a large ice mass from the upper portion of the Langmoche glacier after clear weather in July. The ice mass overran the glacier and splashed into the lake, which was full. The impact caused significant rise in the water level, overtopped the moraine dame cutting a V-shaped trench. The GLOF emptied the lake water within four to six hours. The flood water surged 10 to 15 m high in the valley and the effect was felt for more than 90 km downstream.
It had caused serious damage to the nearly completed Namche Hydropower Project, washed away cultivated land, bridges, houses, livestock and people. The flood waves that lasted for about four hours released about 6 to 10 million cubic meter of water (Ives 1986). Since then, His Majesty’s Government of Nepal (HMG/N) has considered GLOFs as a threat to the development of water resources of the country and has focused on glacier flood studies.
25
Table 4: List of GLOF events recorded in Nepal Date River Basin Name of Lake
450 Years ago Seti Khola Machhapuchhare August, 1935 Sun Koshi Taraco, Tibet
21 September, 1964 Arun Gelaipco, Tibet 1964 Sun Koshi Zhangzangbo, Tibet 1964 Trishuli Longda, Tibet 1968 Arun Ayaco, Tibet 1969 Arun Ayaco, Tibet 1970 Arun Ayaco, Tibet
3rd September, 1977 Dudh Koshi Nare, Tibet 23rd June, 1980 Tamur Nagmapokhri, Nepal 11th July, 1981 Sun Koshi Zhangzagbo, Tibet
Figure 16: The Dig Tsho GLOF: The site of Namche Hydropower Project destroyed by the GLOF on 4 August 1985 (left) ( Source: WECS). The lake in 2004 (bottom) (Source: WWF Nepal Program)
26
Imja Tsho is another potentially dangerous glacier lake in the Khumbu region. This lake is the headwater of the Imja River and is fed by Imja Glacier. Located at an altitude of 5,000 m, this lake did not exist before the 1950s. A few small ponds started forming as shown by a 1955-63 Schnider map. According to data from a survey in 1992, the length and width of the lake was 1.3 km and 0.5 km respectively, the average depth was 47 m and the maximum was 99 m. The lake occupied an area of 0.60 km2. The accumulation of water was estimated at about 28 million m3. The next survey of Imja in 2002 showed that the lake had expanded to an area of 0.86 km2– 28 percent larger than the last survey.
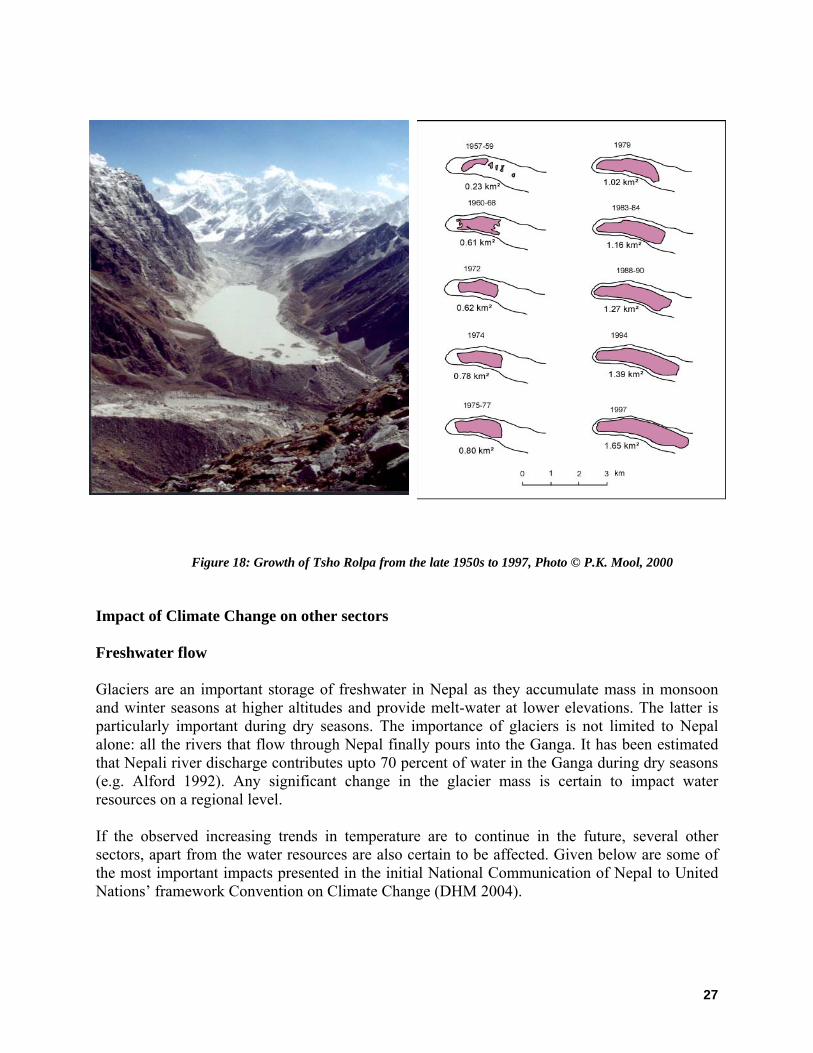
Figure 17: Imja Tsho in 2004 (Source: WWF Nepal Program) Tsho Rolpa is the largest glacier lake in Nepal occupying an area of 1.76 km2. This lake began as a cluster of small supra-glacier ponds in the late 1950s that merged and grew to its present stage (see Fig 18). Studies suggest a high risk of GLOF based on the growth of the lake, rapid degradation of terminal and lateral moraines holding lake water, melting of fossil ice inside the moraine, seepage of lake water from end-moraines, and rapid ice calving from glacier terminus. This is the only lake in Nepal where some mitigation work and an early-warning scheme has been implemented (Rana 2000; Shrestha 2001). However, mitigation work is extremely expensive and it is not possible to set up at all dangerous lakes. Moreover, this does not completely exclude the possibility of GLOFs. The other glacier lakes listed as dangerous are Imja, Lower Barun and Thulagi. In a 2001 survey by ICIMOD and UNEP, 26 lakes in Nepal were identified as potentially dangerous lakes, although many of these need field verification.
Impact of Climate Change on other sectors Freshwater flow Glaciers are an important storage of freshwater in Nepal as they accumulate mass in monsoon and winter seasons at higher altitudes and provide melt-water at lower elevations. The latter is particularly important during dry seasons. The importance of glaciers is not limited to Nepal alone: all the rivers that flow through Nepal finally pours into the Ganga. It has been estimated that Nepali river discharge contributes upto 70 percent of water in the Ganga during dry seasons (e.g. Alford 1992). Any significant change in the glacier mass is certain to impact water resources on a regional level. If the observed increasing trends in temperature are to continue in the future, several other sectors, apart from the water resources are also certain to be affected. Given below are some of the most important impacts presented in the initial National Communication of Nepal to United Nations’ framework Convention on Climate Change (DHM 2004).
28
Agriculture In an agrarian country like Nepal, with staggering increase in population and food demand, even a slight decline in annual food production is a matter of great concern. This sector is adversely affected by the loss of top fertile soil due to soil erosion, landslides and floods. Soil loss is a major cause of decline in agriculture production in Nepal and the negative effects of climate change may further aggravate this situation. It has been suggested that at 4ºC temperature and 20 percent precipitation rise, there could be marginal yield increase in rice; that yield will continue to decline between 0.09 to 7.5 percent and beyond. However, temperature rise has evoked mixed reactions in the case of wheat as the actual yield of wheat has increased in the western region with the rise in temperature while there has been a decline in other regions. Similarly, a rise in temperature has a negative effect on maize as yields decreased with warmer temperatures (the trend is almost similar to wheat). Biodiversity and wildlife A majority of the people in Nepal rely on forest products such as firewood, food, fodder, timber and medicines. Its extensive utilization and increasing demand has led to a decline both in area and quality. Global warming may cause forest damage through mitigation of forests towards the polar region, change in their composition and extinction of species. This could affect not only on Nepal’s biodiversity but the very livelihoods of people. Tropical wet forests and warm temperate rain forests would disappear, and cool temperate vegetation would turn to warm temperate vegetation. Vegetation patterns would be different under the incremental scenario (at 2ºC rise of temperature and 20 percent rise of rainfall) than the existing types. Thus climate change will have a direct impact on vegetation, biodiversity and even wildlife. Health The risk of malaria, kalaazar and Japanese encephalitis is suggested under climate change scenarios for Nepal. The subtropical and warm temperate regions of Nepal would be particularly vulnerable to malaria and kalaazar. Similarly, an increase of temperature would make the subtropical region of Nepal more vulnerable to Japanese encephalitis. While climate change model results are highly variable concerning South Asia, the projections for temperature change are more or less consistent and significant with projected mean temperature increase of 1.2 and 3ºC by 2050 and 2100 and 2.3 to 4.3ºC at 2 CO2. Though an overall increase in precipitation is projected; the magnitude of change is low. The observed trends in temperature generally agree with climate model results and show warming in the last few decades. More warming is observed in high altitudes. No significant trend is found in precipitation. Both temperature and precipitation are found to be related to large-scale climatological phenomena.


![East Rapti Irrigation Project (Loan 867-NEP[SF])](https://static.documents.pub/doc/80x56/577ce66d1a28abf10392ca42/east-rapti-irrigation-project-loan-867-nepsf.jpg)