Marn Senkbeil, Jan Marten Ihme, & Esther Dameria Adrian NEPS TECHNICAL REPORT FOR COMPUTER LITERACY – SCALING RESULTS OF STARTING COHORT 3 IN GRADE 6 NEPS Working Paper No. 39 Bamberg, April 2014 NEPS WORKING PAPERS
Transcript
Martin Senkbeil, Jan Marten Ihme, & Esther
Dameria Adrian
NEPS TECHNICAL REPORT FOR COMPUTER LITERACY – SCALING RESULTS OF STARTING COHORT 3 IN GRADE 6
NEPS Working Paper No. 39Bamberg, April 2014
NEPS WORKING PAPERS
Working Papers of the German National Educational Panel Study (NEPS) at the Leibniz Institute for Educational Trajectories (LIfBi) at the University of Bamberg The NEPS Working Papers publish articles, expertises, and findings related to the German National Educational Panel Study (NEPS). The NEPS Working Papers are edited by a board of researchers representing the wide range of disciplines covered by NEPS. The series started in 2011. Papers appear in this series as work in progress and may also appear elsewhere. They often represent preliminary studies and are circulated to encourage discussion. Citation of such a paper should account for its provisional character. Any opinions expressed in this series are those of the author(s) and not those of the NEPS Consortium. The NEPS Working Papers are available at https://www.neps-data.de/projektübersicht/publikationen/nepsworkingpapers Editorial Board: Jutta Allmendinger, WZB Berlin Cordula Artelt, University of Bamberg Jürgen Baumert, MPIB Berlin Hans-Peter Blossfeld, EUI Florence Wilfried Bos, University of Dortmund Edith Braun, DZHW Hannover Claus H. Carstensen, University of Bamberg Henriette Engelhardt-Wölfler, University of Bamberg Frank Kalter, University of Mannheim Corinna Kleinert, IAB Nürnberg Eckhard Klieme, DIPF Frankfurt Cornelia Kristen, University of Bamberg Wolfgang Ludwig-Mayerhofer, University of Siegen Thomas Martens, DIPF Frankfurt
Manfred Prenzel, TU Munich Susanne Rässler, University of Bamberg Marc Rittberger, DIPF Frankfurt Hans-Günther Roßbach, LIfBi Hildegard Schaeper, DZHW Hannover Thorsten Schneider, University of Leipzig Heike Solga, WZB Berlin Petra Stanat, IQB Berlin Volker Stocké, University of Kassel Olaf Struck, University of Bamberg Ulrich Trautwein, University of Tübingen Jutta von Maurice, LIfBi Sabine Weinert, University of Bamberg
Contact: German National Educational Panel Study (NEPS) – Leibniz Institute for Educational Trajectories – Wilhelmsplatz 3 – 96047 Bamberg − Germany − [email protected]
NEPS Technical Report for Computer Literacy – Scaling
Results of Starting Cohort 3 in Grade 6
Martin Senkbeil, Jan Marten Ihme & Esther Dameria Adrian
Leibniz Institute for Science and Mathematics Education at the University of Kiel, National Educational Panel Study
Senkbeil, M., Ihme, J. M., & Adrian, E. D. (2014). NEPS Technical Report for Computer Literacy – Scaling results of Starting Cohort 3 in Grade 6 (Wave 2) (NEPS Working Paper No. 39). Bamberg: Leibniz Institute for Educational Trajectories, National Educational Panel Study.
We would like to thank Steffi Pohl and Kerstin Haberkorn for developing and providing standards for the technical reports and Ingrid Koller and Kerstin Haberkorn for giving valuable feedback on previous drafts of this manuscript.
NEPS Technical Report for Computer Literacy – Scaling Results of Starting Cohort 3 in Sixth Grade
Abstract
The National Educational Panel Study (NEPS) aims at investigating the development of competences across the whole life span. Furthermore, NEPS develops tests for assessing the different competence domains. In order to evaluate the quality of the competence tests, a wide range of analyses have been performed based on Item Response Theory (IRT). This paper describes the computer literacy data of Starting Cohort 3 in Grade 6 (Wave 2). Next to descriptive statistics of the data, the scaling model applied to estimate competence scores, the analyses performed to investigate the quality of the scale as well as the results of these analyses are presented. The computer literacy test in Grade 6 consisted of 30 items, which represented different cognitive requirements and software applications. A multiple choice format was used. The test was administered to 4,872 students. A Rasch model was used for scaling the data. Item fit statistics, differential item functioning, Rasch homogeneity, the tests’ dimensionality, and local item independence were evaluated to ensure the quality of the test. The results show that the items exhibited good item fit and measurement invariance across various subgroups. Moreover, the test showed acceptable reliability and the different comprehension requirements foster a unidimensional construct. Challenges of the test are the small number of very difficult items and the relatively low reliability of the test. In summary, the scaling procedures show that the test is a reliable instrument with satisfying psychometric properties for assessing computer literacy. In the paper, the data available in the Scientific Use File are described and ConQuest-Syntax for scaling the data is provided.
Keywords item response theory, scaling, computer literacy, Scientific Use File
1 Introduction Within the National Educational Panel Study (NEPS), different competences are measured coherently across the life span. Tests have been developed for different competence domains. These include, amongst others, reading competence, mathematical competence, scientific literacy, information and communication literacy, metacognition, vocabulary, and domain general cognitive functioning. Weinert et al. (2011) give an overview of the competence domains measured in NEPS.
Most of the competence data are scaled using models that are based on Item Response Theory (IRT). Since most of the competence tests were developed specifically for implementation in NEPS, several analyses have been performed to evaluate the quality of the tests. The IRT models chosen for scaling the competence data and the analyses performed for checking the quality of the scales are described in Pohl and Carstensen (2012a). In this paper, the results of these analyses are presented for computer literacy in the Starting Cohort 3 (Grade 6, Wave 2). We first introduce the main concepts of the computer literacy test. Then, we describe the computer literacy data of Starting Cohort 3 and the analyses performed on the data for estimating competence scores and for checking the quality of the test. The results of these analyses are presented and discussed. Finally, we describe the data that are available for public in the Scientific Use File.
The present report has been modeled along the technical report of Senkbeil and Ihme (2012). Note that the analyses of this report are based on the data set available at some time before data release. Due to data protection and data cleaning issues, the data set in the Scientific Use File (SUF) may differ slightly from the data set used for the analyses in this paper. We do not, however, expect severe changes in the results.
2 Testing Computer Literacy The framework and test development for the computer literacy test is described in Weinert et al. (2011) and Senkbeil, Ihme and Wittwer (2013). In the following, we point out specific aspects of the reading test that are necessary for understanding the scaling results presented in this paper.
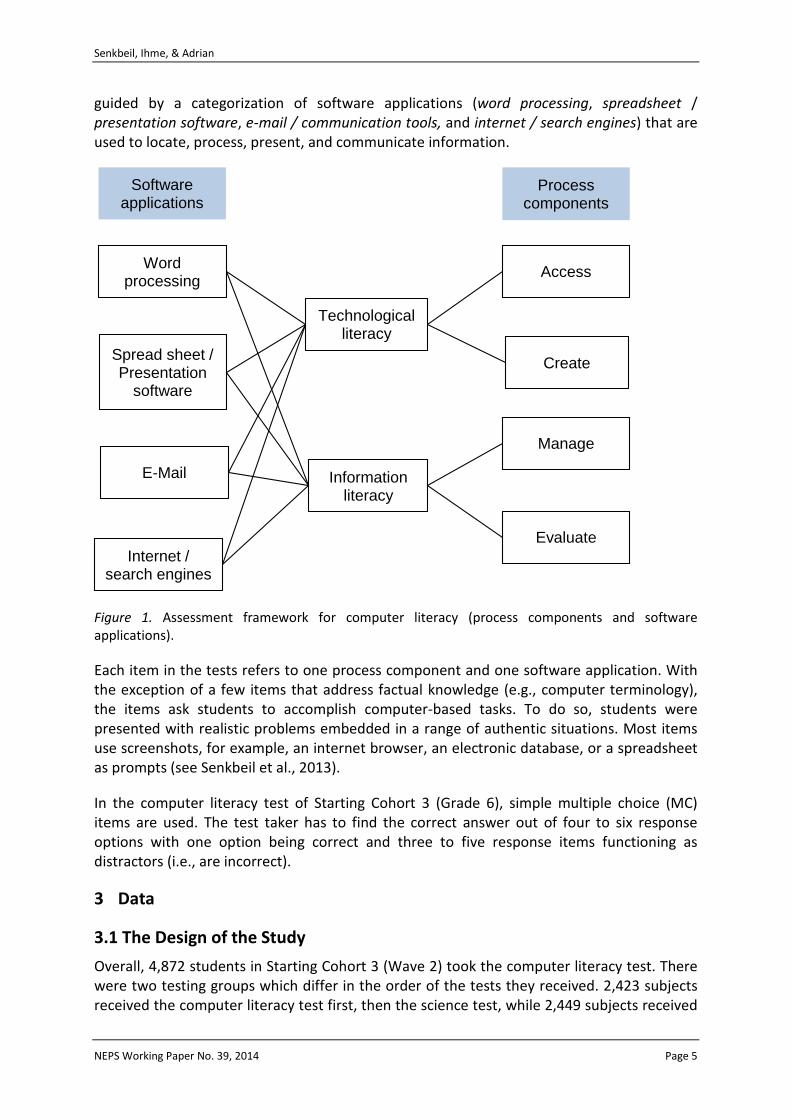
Computer literacy is conceptualized as a unidimensional construct comprising the facets of technological and information literacy. In line with the literacy concepts of international large-scale assessments, we define computer literacy from a functional perspective. That is, functional literacy is understood to include the knowledge and skills that people need to live satisfying lives in terms of personal and economic satisfaction in modern-day societies. This leads to an assessment framework that relies heavily on everyday problems which are more or less distant to school curricula. As a basis for the construction of the instrument that assesses computer literacy in NEPS, we use a framework that identifies four process components (access, create, manage, and evaluate) of computer literacy that represent the knowledge and skills needed for a problem-oriented use of modern information and communication technology. The first two process components (access, create) refer to the facet of technological literacy, whereas the other two process components (manage, evaluate) refer to the facet of information literacy (see Figure 1). Apart from the process components, the test construction of TILT (Test of Technological and Information Literacy) is
NEPS Working Paper No. 39, 2014 Page 4
Senkbeil, Ihme, & Adrian
guided by a categorization of software applications (word processing, spreadsheet / presentation software, e-mail / communication tools, and internet / search engines) that are used to locate, process, present, and communicate information.
Figure 1. Assessment framework for computer literacy (process components and software applications).
Each item in the tests refers to one process component and one software application. With the exception of a few items that address factual knowledge (e.g., computer terminology), the items ask students to accomplish computer-based tasks. To do so, students were presented with realistic problems embedded in a range of authentic situations. Most items use screenshots, for example, an internet browser, an electronic database, or a spreadsheet as prompts (see Senkbeil et al., 2013).
In the computer literacy test of Starting Cohort 3 (Grade 6), simple multiple choice (MC) items are used. The test taker has to find the correct answer out of four to six response options with one option being correct and three to five response items functioning as distractors (i.e., are incorrect).
3 Data
3.1 The Design of the Study Overall, 4,872 students in Starting Cohort 3 (Wave 2) took the computer literacy test. There were two testing groups which differ in the order of the tests they received. 2,423 subjects received the computer literacy test first, then the science test, while 2,449 subjects received
Word processing
Spread sheet / Presentation
software
E-Mail
Internet / search engines
Process components
Software applications
Access
Create
Manage
Evaluate
Technological literacy
Information literacy
NEPS Working Paper No. 39, 2014 Page 5
Senkbeil, Ihme, & Adrian
the computer literacy test after completing the science test. The test time for the computer literacy test was 29 minutes, with one additional minute for the procedural metacognition item. There was no multi-matrix design regarding the choice and order of the items within a test. All students got the same test items in the same order.
The computer literacy test in Grade 6 consists of 30 items which represent the knowledge and skills needed for a problem-oriented use of modern information and communication technology (for more information see the NEPS website)1. The characteristics of the 30 items are depicted in Table 1, on process components, and Table 2, on software applications.
Table 1
Distribution of the Number of Test Items by Process Components in the Computer Literacy Test Grade 6
Process components Frequency Access 10 Create 6 Manage 7 Evaluate 7 Total number of items 30
Table 2
Distribution of the Number of the Test Items by Software Applications in the Computer Literacy Test Grade 6
Software applications Frequency Word processing 9 Spreadsheet / Presentation software 8 E-Mail / Communication tools 4 Internet / search engines 9 Total number of items 30
3.2 Sample The description of the sample, the sampling procedure as well as information on the implementation along with a description of the design of the study and the competence measures used can be found at the NEPS website2.
4,872 persons took the computer literacy test. None of the cases had less than three valid responses to the test items, consequently no case had to be excluded from further analyses.
4.1 Missing Responses There are different kinds of missing responses. These are a) invalid responses, b) missing responses due to omitted items, c) missing responses due to items that are not reached, d) missing responses due to items that are not administered, and e) missing responses that are not determinable. In this study, all subjects received the same set of items, thus, there are no items that were not administered to a person. Invalid responses are, for example, ticking two response options in simple MC items where just one is required. Missing responses due to omitted items occur when a person skips some items. Due to time limits, it may happen that not every person finishes the test within time. As a consequence, missing responses due to items that are not reached result.
Missing responses provide information on how well the test worked (e.g., time limits, understanding of instructions) and need to be accounted for in the estimation of item and person parameters. We, therefore, thoroughly investigated the occurrence of missing responses in the test. First, we looked at the occurrence of the different types of missing responses per person. This gave an indication on how well the persons got along with the test. We then looked at the occurrence of missing responses per item in order to get some information on how well the items worked.
4.2 Scaling Model For estimating item and person parameters for computer literacy competence, a Rasch model was used and estimated in ConQuest (Wu, Adams, & Wilson, 1997). A detailed description of the scaling model can be found in Pohl and Carstensen (2012a). Ability estimates for computer literacy were estimated as weighted maximum likelihood estimates (WLEs). Person parameter estimation in NEPS is described in Pohl & Carstensen (2012a), while the data available in the SUF are described in Section 7.
4.3 Checking the Quality of the Scale The computer literacy test was specifically constructed to be implemented in NEPS. In order to ensure appropriate psychometric properties, the quality of the test was checked in several analyses.
In MC items, there are a number of distractors (incorrect response options). We investigated if the distractors worked well that is, if they are more often chosen by the students with a low ability than by students with a high ability. For this, we evaluated the point-biserial correlation of giving a certain incorrect response and the total score. We judged correlations below zero as very good, correlations below 0.05 as acceptable, and correlations above 0.05 as problematic.
Item fit was then evaluated for the test items based on results of a Rasch model. The weighted mean square error (WMNSQ), the respective t-value, correlations of the item score with the total score (equal to the discrimination value as computed in ConQuest), and the item characteristic curve were evaluated for each item. Items with a WMNSQ > 1.15 (t-value > 6) were considered having a noticeable misfit and items with a WMNSQ > 1.2 (t-
NEPS Working Paper No. 39, 2014 Page 7
Senkbeil, Ihme, & Adrian
value > 8) were judged having a considerable misfit and their performance was further investigated. Correlations of the item score with the total score greater than 0.3 were considered as good, greater than 0.2 as acceptable, and below 0.2 as problematic. Overall, judgment of the fit of an item was based on all fit indicators.
We aim at constructing a computer literacy test that measures the same construct for all students. If there are items that favor certain subgroups (e.g., that are easier for males than for females), measurement invariance would be violated and a comparison of competence scores between the subgroups (e.g., males and females) would be biased and, thus unfair. Test fairness was investigated for the variables test position, gender, the number of books at home (as a proxy for socioeconomic status), and migration background (see Pohl and Carstensen, 2012a, for a description of these variables). In order to test for measurement invariance, differential item functioning (DIF) analysis is done using a multi-group IRT model, in which main effects of the subgroups as well as differential effects of the subgroups on item difficulty are estimated. Differences in the estimated item difficulties between the subgroups are evaluated. Based on experiences with preliminary data, we consider absolute differences in estimated difficulties that are greater than 1 logit as very strong DIF, absolute differences between .6 and 1 noteworthy to further investigate, differences between 0.4 and 0.6 as considerable but not severe, and differences smaller than 0.4 as no considerable DIF. Additionally, model fit was investigated by comparing a model including DIF to a model that only includes main effects and no DIF.
The competence data in NEPS were scaled using the Rasch model (1PL). This model was chosen because it preserves the weighting of the different aspects of the framework intended by the test developers (Pohl & Carstensen, 2012a). Nevertheless, Rasch’s assumption of equal item discrimination was tested. Thus, the data were analyzed with a generalized partial credit model (2PL) (Muraki, 1992) using the software mdltm (von Davier, 2005), and the deviations of the estimated discrimination parameters from a uniform discrimination were evaluated. The computer literacy test is constructed to measure computer literacy on a unidimensional scale (Senkbeil et al., 2013). The assumption of unidimensionality was, nevertheless, tested in the data by specifying different multidimensional models. The different subdimensions of the multidimensional models were specified based on the different construction criteria. First, a model with four process components representing the knowledge and skills needed for a problem-oriented use of ICT, and second, a model with four different subdimensions based on different software applications was fitted to the data. The correlation between the subdimensions as well as differences in model fit between the unidimensional model and the respective multidimensional model were used to evaluate the unidimensionality of the scale.
5 Results
5.1 Missing Responses 5.1.1 Missing responses per person
The number of invalid responses per person is shown in Figure 2. This number is very small. 97.5% of persons did not give any invalid response. Only 0.7% of subjects have more than one invalid response.
NEPS Working Paper No. 39, 2014 Page 8
Senkbeil, Ihme, & Adrian
Figure 2. Number of invalid responses.
Missing responses may occur when people skip (omit) some items. The number of omitted responses per person is depicted in Figure 3. The figure shows that there is some tendency to omit items. 69% of the subjects omitted no item at all. Five percent of the subjects omitted more than 3 items.
Figure 3. Number of omitted items.
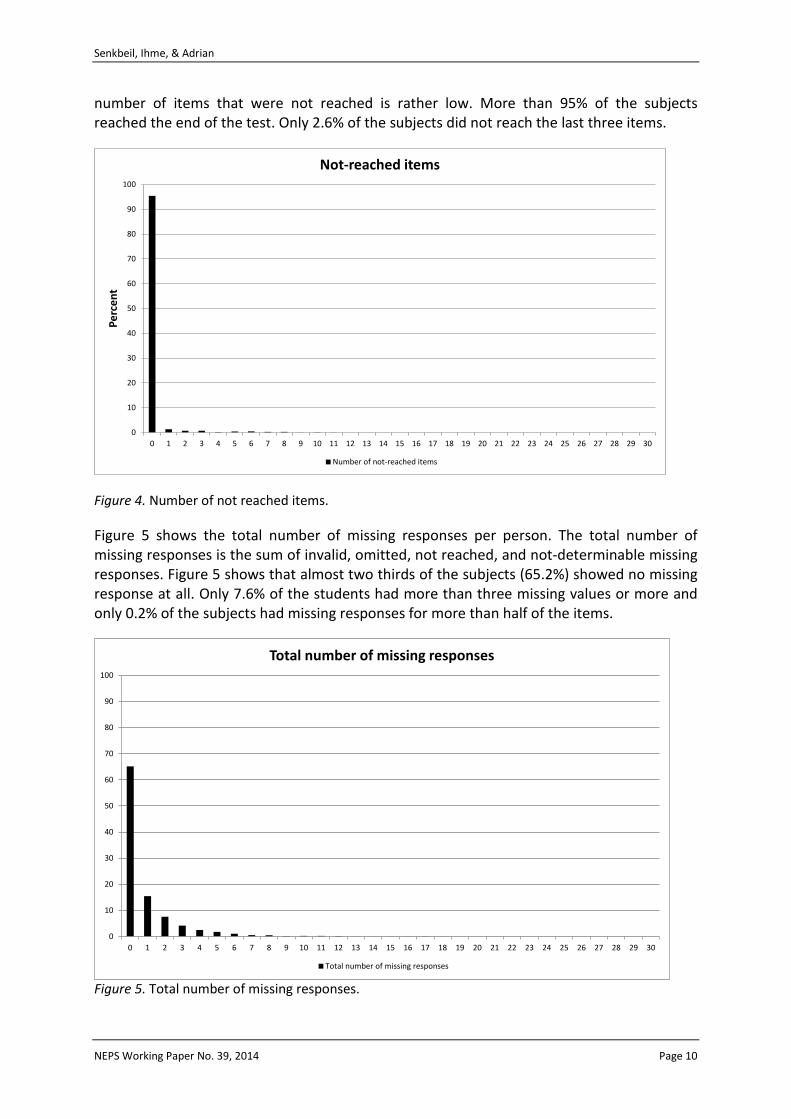
Due to time limits, not all subjects reached the end of the test within the given time. Items are considered to be not reached when they are omitted and stand after the last response given in a test. Figure 4 shows the number of items that were not reached per person. The
number of items that were not reached is rather low. More than 95% of the subjects reached the end of the test. Only 2.6% of the subjects did not reach the last three items.
Figure 4. Number of not reached items.
Figure 5 shows the total number of missing responses per person. The total number of missing responses is the sum of invalid, omitted, not reached, and not-determinable missing responses. Figure 5 shows that almost two thirds of the subjects (65.2%) showed no missing response at all. Only 7.6% of the students had more than three missing values or more and only 0.2% of the subjects had missing responses for more than half of the items.
Overall, there is a small amount of invalid responses and a small amount of omitted items. The number of not reached items is rather low and, therefore also the total number of missing responses.
5.1.2 Missing responses per item
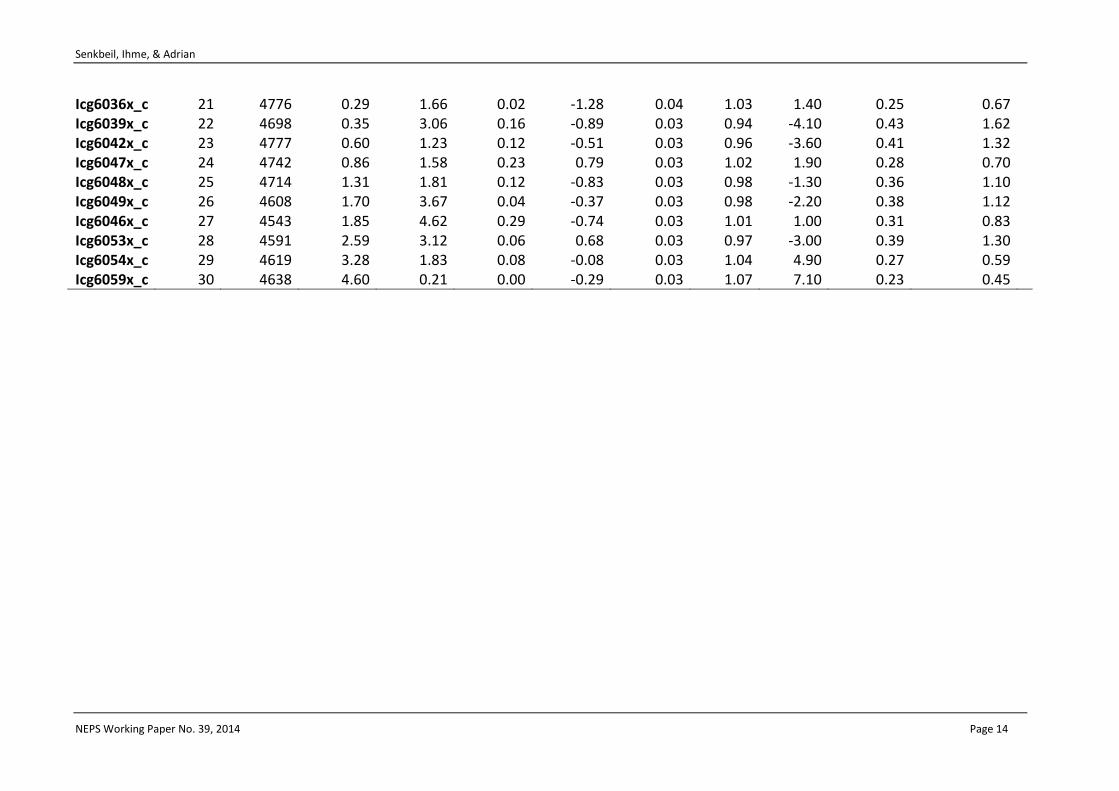
Table 3 shows the number of valid responses for each item as well as the percentage of missing responses (total number, invalid responses, omitted responses, and not-reached responses). The number of invalid responses per item is small. The highest number is 0.35% for item icg6011_c. Overall, the number of persons that omit an item is acceptable. There are two items with an omission rate above 5% (icg6025_c and icg6033_c). The highest omission rate occurs for item icg6033_c (9.7% of the persons omitted this item). The number of omitted responses is correlated to .25 with the difficulty of the item. This result indicates that the test takers tend to omit items that are more difficult. It is noticeable that items measuring spread sheets are omitted more than twice as often (4.2%) than items measuring word processing (1.7%), presentation software (1.9%), or e-mail / communication tools (1.1%) and are omitted more often than items related to internet applications (2.8%). The number of persons that did not reach an item increases with the position of the item in the test to up to 4.6%. This is a rather low amount. The total number of missing responses (sum of invalid, omitted, and not-reached responses) per item varies between 0.60% (item icg6006_c) and 10.14% (item icg6033_c).
5.2 Parameter Estimates 5.2.1 Item parameters
The estimated item difficulties are depicted in Table 3. The item difficulties were estimated by constraining the mean of the ability distribution to be zero. The estimated item difficulties vary between -2.17 (item icg6020x_c) and 1.21 (item icg6001x_c) with a mean of 0.40. The mean probability for solving an item was .58, indicating a good fit between item difficulties and person abilities (see Figure 6). Overall, the item difficulties are a little bit low, and there are only a few items with a high difficulty. Due to the large sample size, the standard error of the estimated item difficulties is very small (SE(ß) ≤ 0.05).
5.2.2 Person parameters
Person parameters are estimated as WLEs (Pohl & Carstensen, 2012a). WLEs are provided in the first release of the SUF. A description of the data in the SUF can be found in Section 7. An overview of how to work with competence data can be found in Pohl and Carstensen (2012a).
5.2.3 Test targeting and reliability
Test targeting was investigated in order to evaluate the measurement precision of the estimated ability scores and to judge the appropriateness of the test for the specific target population. In the analyses, the mean of ability is constrained to be zero. The variance was
NEPS Working Paper No. 39, 2014 Page 11
Senkbeil, Ihme, & Adrian
estimated to be 0.40, indicating that the test differentiates satisfying between subjects. The reliability of the test (EAP/PV reliability =.70, WLE reliability = .69) is sufficient.
The amount to which the item difficulties and location parameters are targeted to the ability of the persons is shown in Figure 6. The Figure shows that the items cover a great range of the ability distribution of the persons. However, only few items cover a very high degree of ability. There is a large number of items with a medium or low difficulty. As a consequence, subjects with a medium and low ability are measured relatively precisely while subjects with a high ability have a larger standard error.
Figure 6. Test targeting. The distribution of person ability in the sample is depicted on the left side of the graph. Each ‘X’ represents 7.0 cases. Item difficulty is depicted on the right side of the graph. Each number represents one item (see Table 3).
scale in logits Person ability Item difficulty 2 1 0 -1 -2
In addition to the overall item fit, we specifically investigated how well the distractors performed in the test by evaluating the pointbiserial correlation between each incorrect response (distractor) and the students’ total score. All but one distractor ( r pbis: 0.00) had a pointbiserial correlation with ability below zero (Median = -.15). The results indicate a good model fit.
5.3.2 Item fit
The item fit is very good. WMNSQ is close to 1 with the lowest value being 0.94 (item icg6005x_c, icg6032x_c, and item icg6039x_c) and the highest being 1.07 (item icg6059x_c). There is only one item with a t-value above 6 (item icg6059x_c). The correlation of the item score with the total score varies between .20 (for item icg6006x_c) and .45 (for item icg6011x_c and item icg6032x_c) with an average correlation of .33. Many items (18 out of 30 items) had a correlation with the total score between .30 und .45. All item characteristic curves showed a good fit of the items. The mean probability for solving an item was .58, indicating a good targeting of item difficulties and person abilities.
5.3.3 Differential item functioning
The test fairness for different groups (i.e., measurement invariance) was investigated by estimating the amount of differential item functioning (DIF). Differential item functioning was investigated for the variables test position, gender, the number of books at home (as a proxy for socioeconomic status), migration background, and school type (see Pohl & Carstensen, 2012a, for a description of these variables). Table 5 shows the difference between the estimated item difficulties in different groups. Female vs. male, for example, indicates the difference in difficulty ß(female) – ß(male). A positive value indicates a higher difficulty for females, a negative value a lower difficulty for females as opposed to males.
The computer literacy test was administered in two different positions (see section 3.1 for the design of the study). 2,423 (49.7%) persons received the computer literacy test before the science test (Position 1), and 2,449 (50.3%) of the persons received the computer literacy test after having completed the science test (Position 2). The subjects were randomly assigned to either of the two design groups. Differential item functioning of the position of the test may, for example, occur if there are differential fatigue effects for certain items. The results show a small average effect of item position. Subjects who received the computer literacy test before the science test perform on average 0.09 logits (Cohen’s d = 0.22) better than subjects who received the computer literacy test after the science test3. There is no DIF due to the position of the test in the booklet. The highest difference in difficulty between the two design groups is 0.21 logits.
The investigation of DIF for gender showed that 2,364 (48.5%) of the test takers were female and 2,508 (51.5%) were male. On average, male students have a slightly higher computer literacy than female students (main effect = -0.06 logits, Cohen’s d = -0.14). There is no item
3 Note that this main effect does not indicate a threat to measurement invariance. Instead, it may be an indication of fatigue effects that are similar for all items.
NEPS Working Paper No. 39, 2014 Page 16
Senkbeil, Ihme, & Adrian
with a considerable gender DIF. The highest difference in difficulties between the two groups is -0.41 logits.
The number of books at home was used as a proxy for socioeconomic status. There were 1,763 (36.2%) test takers with 0 to 100 books at home, 2,432 (49.9%) test takers with more than 100 books at home, and 677 (13.9%) test takers without a valid response. DIF was investigated using these three groups. There are considerable average differences between the three groups. Participants with 100 or less books at home perform on average 0.26 logits (Cohen’s d = 0.64) lower in reading than participants with more than 100 books. Participants without a valid response on the variable ‘books at home’ performed 0.51 logits (Cohen’s d = 1.26) or 0.25 logits (Cohen’s d = 0.62) worse than participants with up to 100 and ,respectively, more than 100 books, . There is considerable but not sincerely DIF comparing participants with many or fewer books (highest DIF = 0.47). Comparing the group without valid responses to the two groups with valid responses, DIF occurs up to 0.40 logits. This is a rather small difference, so that there is no considerable socioeconomic DIF.
There were 3,264 (67.0%) participants without a migration background, 972 (20.0%) participants with a migration background, and 329 (6.7%) students could not be allocated to either group. 307 (6.3%) students were excluded from the analyses due to missing or invalid responses. The first three groups were used for investigating DIF of migration. There is a medium-sized difference in the average performance of participants with or without migration background (main effect = 0.22 logits, Cohen’s d = 0.54). Participants without a migration background have a higher computer literacy than participants with a migration background. Also subjects with unknown background on migration differ from those without a migration background (main effect = 0.26 logits, Cohen’s d = 0.64), they do not differ much from subjects with a migration background (main effect = 0.04 logits, Cohen’s d = 0.10). There is considerable but not sincerely DIF. The highest difference in difficulties between groups is 0.64 logits.
DIF was also investigated for school type. 2,254 (46.3%) of the test takers were high school students and 2,340 (48.0%) were non high school students. In Grade 6, 278 (5.7%) students were still in primary school and could not be assigned to high school or non high school. These cases were excluded from the analyses. On average, high school students have a higher computer literacy than non high school students (main effect = 0.62 logits, Cohen’s d = 1.54). There is considerable but not sincerely DIF. The highest difference in difficulties between the two groups is 0.52 logits.
Besides investigating DIF for each single item, an overall test for DIF was performed by comparing models which are allowed for DIF with those that are allowed only for main effects. In Table 4, the models including only main effects are compared with those that additionally estimate DIF. The Akaike's (1974) information criterion (AIC) favors the models estimating DIF for all DIF variables except position. The Bayesian information criterion (BIC, Schwarz, 1978) takes the number of estimated parameters into account and thus prevents from overparameterization of models. Using BIC, the more parsimonious model including only the main effect is preferred over the more complex DIF model for the most DIF variables (position, books, migration). Only for the DIF variables gender and school type, the more complex DIF model have slightly better information criterions.
NEPS Working Paper No. 39, 2014 Page 17
Senkbeil, Ihme, & Adrian
Table 4
Comparison of Models With and Without DIF
DIF variable Model Deviance Number of parameters
AIC BIC
Position main effect 171159.034 32 171223.034 171430.754 DIF 171105.925 62 171229.925 171632.383 Gender main effect 171168.968 32 171232.968 171440.689 DIF 170906.181 62 171030.181 171432.639 Books main effect 170845.836 33 170911.836 171126.048 DIF 170630.526 93 170816.526 171420.213 Migration main effect 160128.801 33 160194.801 160408.965 DIF 159890.706 93 160076.706 160680.259 School type main effect 160644.257 32 160708.257 160914.097 DIF 160241.471 62 160365.471 160764.287
Most of the differences in item difficulties estimated via the DIF-analyses are in absolute values below 0.5. Only four items showed a DIF value above the threshold of 0.5: The items are icg6032x_c (school type), icg6025x_c (migration background), icg6034x_c (migration background), and icg6036x_c (migration background). But all values of these items (0.522, 0.518, 0.509, 0.635) are only scarcely above the threshold. Overall, the results indicate that there is no considerable DIF and the test is fair for the considered groups.
NEPS Working Paper No. 39, 2014 Page 18
Senkbeil, Ihme, & Adrian
Table 5
Differential Item Functioning (Absolute Differences Between Difficulties)
Item Booklet Gender Books Immigration background School
In order to test the assumption of Rasch-homogeneity, we also fitted a generalized partial credit model (2PL) to the data. The estimated discrimination parameters are depicted in Table 3. They range from 0.45 (item icg6059x_c) to 1.73 (icg6032x_c). Since the discriminations differ considerably among the items (from 0.45 to 1.73), the 2PL model (BIC=170898, number of parameters=71) fits the data slightly better than the Rasch model (BIC=171175, number of parameters=32). Since the theoretical aim was to construct a test that equally represents the different aspects of the framework (see Pohl & Carstensen, 2012a, 2012b, for a discussion of this issue), the Rasch model was used to preserve the item weightings intended in the constructional framework.
5.3.5 Unidimensionality
The unidimensionality of the test was investigated by specifying two different multidimensional models. The first model is based on the four process components and the second model is based on the four different types of software applications (the categories spreadsheet and presentation software were collapsed for dimensionality analyses due to the scarce number of items in both categories).
To estimate a mulitdimensional (MD) model based on the four process components, Gauss’ estimation in ConQuest (nodes = 15) was used. The variances and correlations of the three dimensions are shown in Table 6. All four dimensions show a substantive variance with the highest discrimination between subjects for Evaluate and the lowest for Manage. The correlations between the dimensions vary between .845 and .936. The lowest correlation is found between Dimension 2 (Create) and Dimension 3 (Manage).Thus the results indicate some degree of multidimensionality.
Table 6
Results of Four-Dimensional Scaling (Process Components). Variance of the Dimensions are Depicted in the Diagonal; Correlations are Displayed in the Off-Diagonal
Dim 1 Dim 2 Dim 3 Dim 4
Access (10 Items)
.485
Create (6 Items)
.896 .300
Manage (7 Items)
.904 .845 .290
Evaluate (7 Items)
.936 .909 .901 .774
To estimate a four-dimensional model based on the different types of software applications Gauss’ estimation (nodes = 15) was used (see Table 7). The results of the analyses are depicted in Table 7. All four dimensions show a substantive variation. The correlations
NEPS Working Paper No. 39, 2014 Page 21
Senkbeil, Ihme, & Adrian
between the four dimensions are very high (between .889 and .942). The four software applications do not measure different constructs but a unidimensional construct.
Table 7
Results of Four-Dimensional Scaling (Software Applications). Variance of the Dimensions are Depicted in the Diagonal; Correlations are given in the Off-Diagonal
Dim 1 Dim 2 Dim 3 Dim 4
Word processing (9 Items)
.295
Spreadsheet / presentation software (8 Items)
.932 .516
E-Mail / communication tools (4 Items)
.903 .889 .584
Internet / search engines (9 Items)
.925 .912 .942 .484
6 Discussion The analyses in the previous sections aimed at providing information on the quality of the computer literacy test in Starting Cohort 3 (Grade 6, Wave 2) and at describing how the computer literacy score is estimated. The analyses we conducted and described in this report indicate good measurement properties for the instrument.
We investigated different kinds of missing responses and examined the item and test parameters. We thoroughly checked item fit statistics for the test items and examined the correlations between correct and incorrect responses and the total score. Further quality inspections were conducted by examining differential item functioning, testing Rasch-homogeneity, and investigating the tests’ dimensionality.
The results indicate a good fit of the data to the Rasch model: The item fit (WMNSQ) of all items are within the usually accepted interval from .85 to 1.15, and the dimensionality analyses indicate that the unidimensional model describes the data appropriately,although there is some evidence for multidimensionality.
The distribution of item difficulties and the distribution of person parameters overlap to a great extent, with one limitation: There are only few items which are very difficult, leading to an increased standard error of estimation for persons with very high ability. The distractor analysis showed a satisfying result.
The analyses of missing data revealed that only few items were omitted (skipped) by test takers, and even less of the given responses were invalid. The proportion of items not reached was very low. This may suggest that the amount of items fitted perfectly with the test time of 29 minutes.
NEPS Working Paper No. 39, 2014 Page 22
Senkbeil, Ihme, & Adrian
In summary, the scaling procedures show that the test is a reliable instrument with satisfying psychometric properties for assessing computer literacy.
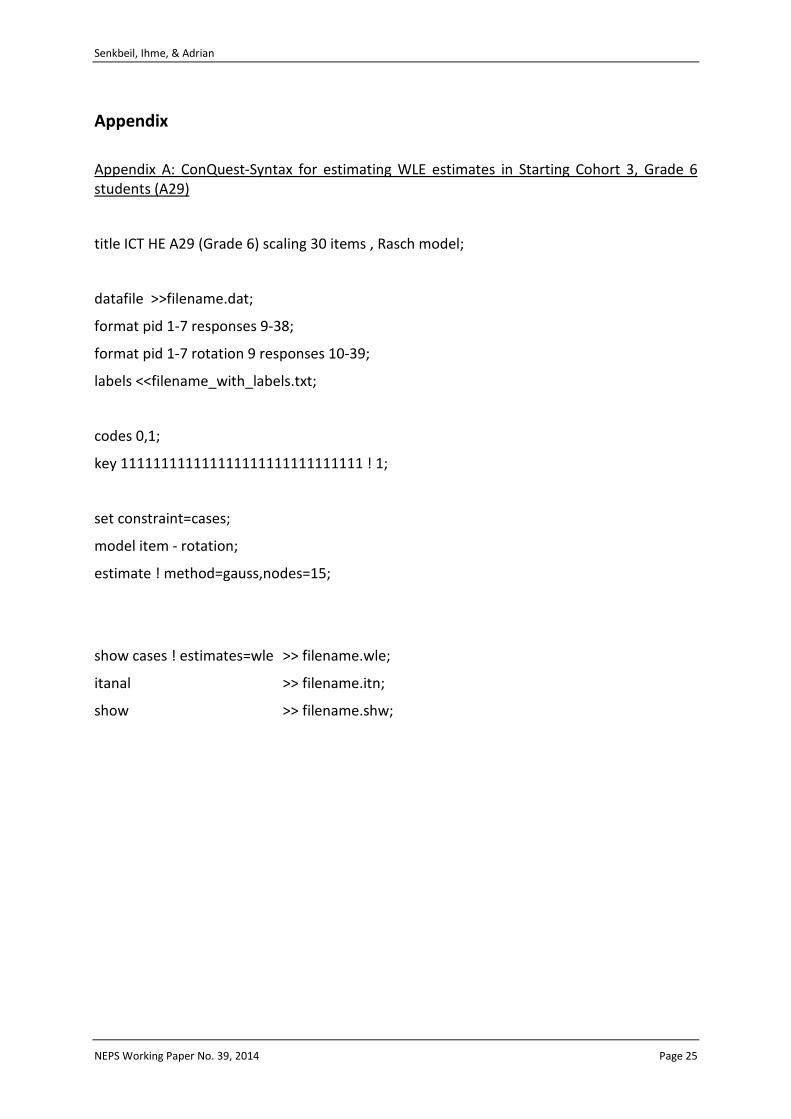
7 Data in the Scientific Use File There are 30 items in the data set that are scored as dichotomous variables (MC items) with 0 indicating an incorrect response and 1 indicating a correct response. The dichotomous variables are marked with a ‘x_c’ at the end of the variable name. Manifest scale scores are provided in form of WLE estimates (ic_wle) including the respective standard error (ic_wle_se). The ConQuest syntax for estimating the WLE scores from the items is provided in appendix A.
Plausible values that allow investigating latent relationships of competence scores with other variables (see e.g., Pohl & Carstensen, 2012a) will be provided in later data releases. User interested in investigating latent relationships may alternatively either include the measurement model in their analyses or estimate plausible values themselves. A description of these approaches can be found in Pohl and Carstensen (2012a).
NEPS Working Paper No. 39, 2014 Page 23
Senkbeil, Ihme, & Adrian
References Akaike, H. (1974). A new look at the statistical model identification. IEEE Transactions on
Automatic Control, 19, 716-723
Haberkorn, K., Pohl, S., Carstensen, C., & Wiegand, E. (2012). Incorporating different response formats in the IRT-scaling model for competence data. Manuscript submitted for publication.
Mislevy, R. J. (1991). Randomization-based inference about latent variables from complex samples. Psychometrika, 56(2), 177–196.
Muraki, E. (1992). A generalized partial credit model. Application of an EM algorithm. Applied Psychological Measurement, 16, 159-176.
Pohl, S. & Carstensen, C. H. (2012a). NEPS Technical Report – Scaling the data of the competence tests (NEPS Working Paper No. 14). Bamberg: University of Bamberg, National Educational Panel Study.
Pohl, S. & Carstensen, C. H. (2012b). Scaling the competence tests in the National Educational Panel Study – Many questions, some answers, and further challenges. Journal for Educational Research Online, 5, 189-216.
Schwarz, G. (1978). Estimating the dimension of a model. The Annals of Statistics, 6, 461-464.
Senkbeil, M. & Ihme, J. M. (2012). NEPS Technical Report for Computer Literacy – Scaling Results of Starting Cohort 4 in Ninth Grade (NEPS Working Paper No. 14). Bamberg: University of Bamberg, National Educational Panel Study.
Senkbeil, M., Ihme, J. M., & Wittwer, J. (2013). The test of technological and information literacy (TILT) in the National Educational Panel Study: Development, empirical testing, and evidence for validity. Journal for Educational Research Online, 5, 139-161.
von Davier, M. (2005). Mdltm: Software for the general diagnostic model and for estimating mixtures of multidimensional discrete latent trait models [Computer Software]. Princeton, NJ: ETS.
Weinert, S., Artelt, C., Prenzel, M., Senkbeil, M., Ehmke, T., & Carstensen C. H. (2011). Development of competencies across the life span. In H. P. Blossfeld, H. G. Roßbach & J. v. Maurice & (Eds.), Zeitschrift für Erziehungswissenschaften, 14. Education as a lifelong process: The German National Educational Panel Study (NEPS) (pp. 67-86) Wiesbaden: VS Verlag für Sozialwissenschaften.