32
Place and crop your image here and send to back Neste Q2 2021 Peter Vanacker | President and CEO| 27 Jul 2021
Place and crop your
image here and send to back
Neste Q2 2021
Peter Vanacker | President and CEO| 27 Jul 2021

Place and crop your
image here
Contents
1. Q2 2021 review
2. Group financials
3. Segment reviews
4. Current topics
5. Appendix
2
Disclaimer
The following information contains, or may be deemed to contain, “forward-looking statements”. These statements relate
to future events or our future financial performance, including, but not limited to, strategic plans, potential growth,
planned operational changes, expected capital expenditures, future cash sources and requirements, liquidity and cost
savings that involve known and unknown risks, uncertainties and other factors that may cause Neste Corporation’s or its
businesses’ actual results, levels of activity, performance or achievements to be materially different from those
expressed or implied by any forward-looking statements. In some cases, such forward-looking statements can be
identified by terminology such as “may”, “will”, “could”, “would”, “should”, “expect”, “plan”, “anticipate”, “intend”, “believe”,
“estimate”, “predict”, “potential”, or “continue”, or the negative of those terms or other comparable terminology. By their
nature, forward-looking statements involve risks and uncertainties because they relate to events and depend on
circumstances that may or may not occur in the future. Future results may vary from the results expressed in, or implied
by, the following forward-looking statements, possibly to a material degree. All forward-looking statements made in this
presentation are based on information presently available to management and Neste Corporation assumes no obligation
to update any forward-looking statements. Nothing in this presentation constitutes investment advice and this
presentation shall not constitute an offer to sell or the solicitation of an offer to buy any securities or otherwise to engage
in any investment activity.
3

Place and crop your
image here
Solid performance in Renewable Products – Porvoo refinery major turnaround completed
• Group comparable EBIT 241 MEUR in Q2
• Renewable Products with healthy margin as a result
of high sales performance
• Oil Products’ quarter mainly characterized by the
Porvoo refinery major turnaround
• Marketing & Services performed very well
• Focus on strategy execution
4

Solid financial position
ROACE, rolling 12 months, % Leverage, %
5
15.6%
0
5
10
15
20
25
30
Q2/20 Q3/20 Q4/20 Q1/21 Q2/21
Target 15%
-10
0
10
20
30
40
Q2/20 Q3/20 Q4/20 Q1/21 Q2/21
7.7%
Target below 40%
Place and crop your
image here and send to back
Q2 2021Group financials
6

Group financials Q2/21
7
MEUR Q2/21 Q2/20 H1/21 H1/20 2020
Revenue 3,022 2,572 6,155 5,842 11,751
EBITDA 599 333 1,184 659 1,508
Comparable operating profit 241 255 542 663 1,416
Renewable Products 287 314 580 644 1,334
Oil Products -58 -60 -66 14 50
Marketing & Services 18 19 35 27 68
Others (incl. eliminations) -7 -18 -7 -21 -36
Operating profit 463 208 920 405 828
Cash flow before financing activities 261 -246 -384 -366 1,019
Comparable earnings per share, EUR 0.31 0.26 0.62 0.76 1.60

Resilient Renewables and Porvoo refinery major turnaround
8
Group comparable EBIT by segments Q2/21 vs. Q2/20, MEUR
Q2/20 Renewable Products Oil Products Marketing & Services Others (incl.eliminations)
Q2/21
255
+2
-28+12 241
0

Q2/20 Volumes Sales margin Fx changes Fixed costs Other items Q2/21
+13+19
Higher sales margin compensated lower volumes
9
Group comparable EBIT Q2/21 vs. Q2/20, MEUR
255 -72 -45241
+71

H1/20 Volumes Sales margin Fx changes Fixed costs Other items H1/21
+43+41
Half-year result impacted by scheduled Porvoo turnaround and weak USD
10
Group comparable EBIT H1/21 vs. H1/20, MEUR
663 -105
-101 542+1

Place and crop your
image here and send to back
Q2 2021Segment reviews
11
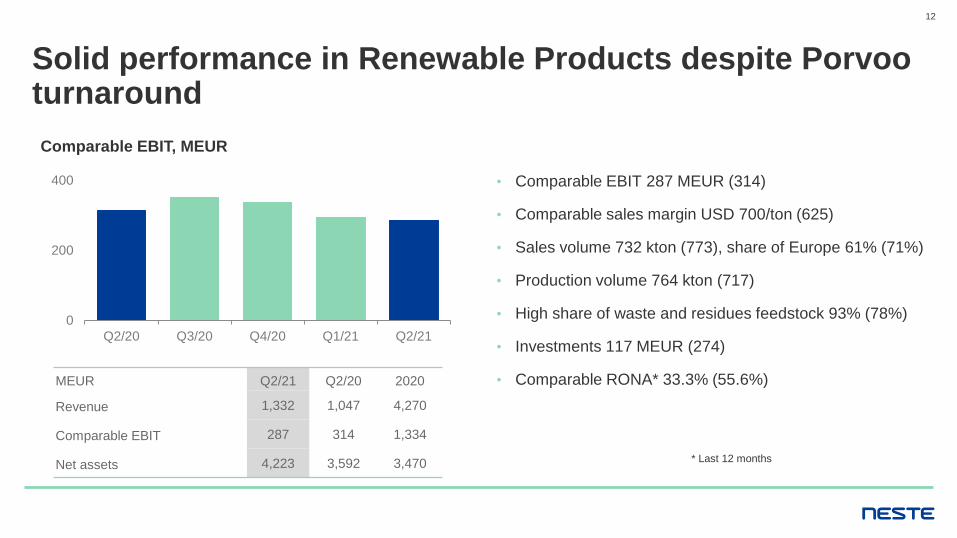
Solid performance in Renewable Products despite Porvooturnaround
• Comparable EBIT 287 MEUR (314)
• Comparable sales margin USD 700/ton (625)
• Sales volume 732 kton (773), share of Europe 61% (71%)
• Production volume 764 kton (717)
• High share of waste and residues feedstock 93% (78%)
• Investments 117 MEUR (274)
• Comparable RONA* 33.3% (55.6%)
12
0
200
400
Q2/20 Q3/20 Q4/20 Q1/21 Q2/21
MEUR Q2/21 Q2/20 2020
Revenue 1,332 1,047 4,270
Comparable EBIT 287 314 1,334
Net assets 4,223 3,592 3,470
Comparable EBIT, MEUR
* Last 12 months

Q2/20 Volumes Sales margin Fx changes Fixed costs Other items Q2/21
Healthy sales margin and stable volumes
13
Comparable EBIT Q2/21 vs. Q2/20, MEUR
314-37
287
+48-24 -4 -11

Feedstock market continued to be tight
14
Vegetable oil and animal fat prices*, USD/ton
*Quotations in NWE, source: Oil World, The Jacobsen
400
600
800
1,000
1,200
1,400
1,600
1,800
Jan-17 Jan-18 Jan-19 Jan-20 Jan-21
Soybean Rapeseed Palm oil Animal fat

High RIN and stable LCFS prices supported US margins
15
California Low Carbon Fuel Standard, LCFS credit price, USD/ton RIN prices, US cent /gal
0
30
60
90
120
150
180
210
240
Jan-17 Jan-18 Jan-19 Jan-20 Jan-21
0
40
80
120
160
200
Jan-17 Jan-18 Jan-19 Jan-20 Jan-21
Biomass-based diesel (D4) Conventional renewable fuel (D6)

Strong sales performance and volume allocation supported sales margin
• Comparable sales margin USD 700/ton (625)
• California LCFS credit USD 185/ton (201)
• D4 RIN USD 1.70/gal (0.52)
• Sales of 100% Neste MY diesel 28% (27%)
• Utilization rate 96% (90%)
Comparable sales margin, USD/ton
16
0
200
400
600
800
Q2/20 Q3/20 Q4/20 Q1/21 Q2/21

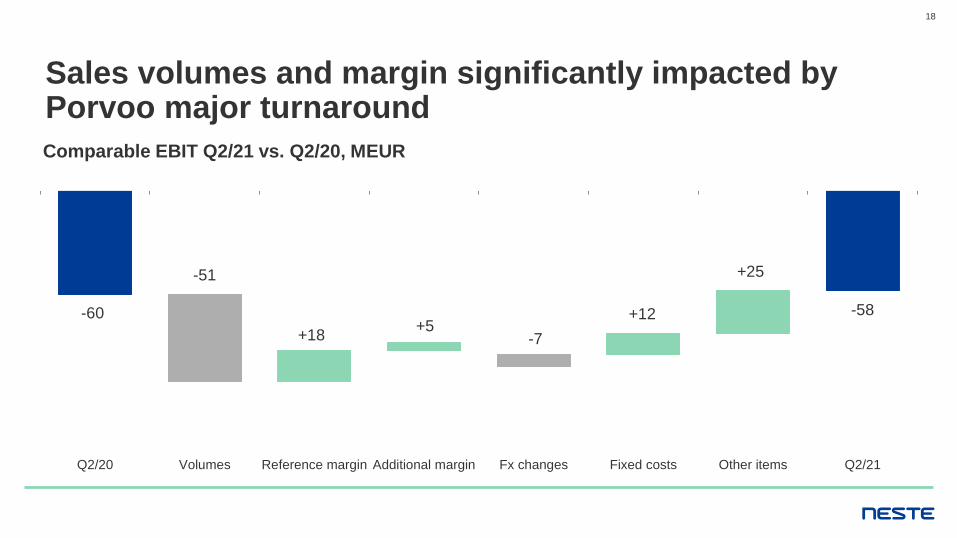
Oil Products’ major turnaround in Porvoo completed
• Comparable EBIT -58 MEUR (-60)
• Sales volume 1.2 Mton (3.1)
• Refinery average utilization rate 20% (67%)
• Urals’ share of feed 70% (67%)
• Investments 115 MEUR (58)
• Comparable RONA* -1.3% (9.6%)
17
MEUR Q2/21 Q2/20 2020
Revenue 1,331 1,218 6,063
Comparable EBIT -58 -60 50
Net assets 2,321 2,579 1,848
Comparable EBIT, MEUR
* Last 12 months
-60
0
60
120
Q2/20 Q3/20 Q4/20 Q1/21 Q2/21
Q2/20 Volumes Reference margin Additional margin Fx changes Fixed costs Other items Q2/21
Sales volumes and margin significantly impacted by Porvoo major turnaround
18
Comparable EBIT Q2/21 vs. Q2/20, MEUR
-60
-51
-7
-58+5
+18
+12
+25
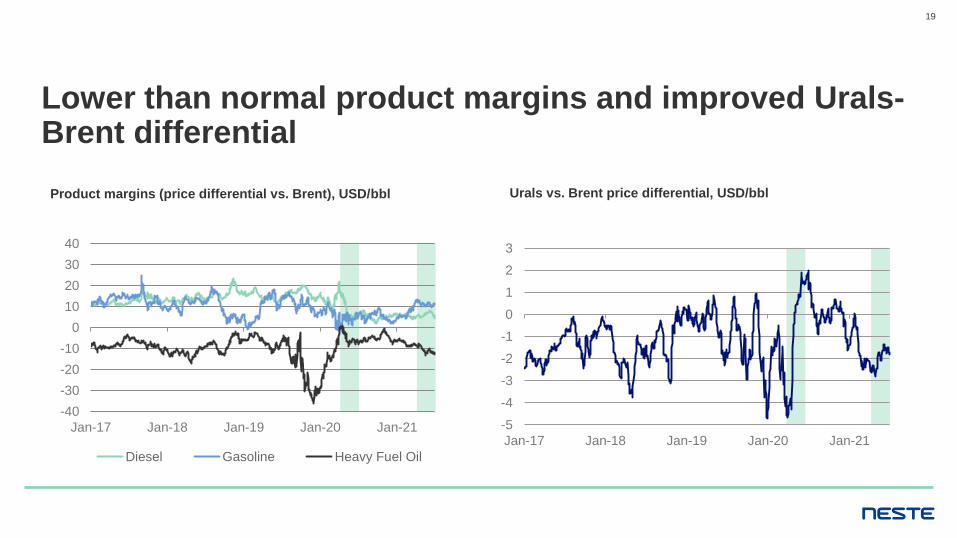
Lower than normal product margins and improved Urals-Brent differential
19
Product margins (price differential vs. Brent), USD/bbl Urals vs. Brent price differential, USD/bbl
-40
-30
-20
-10
0
10
20
30
40
Jan-17 Jan-18 Jan-19 Jan-20 Jan-21
Diesel Gasoline Heavy Fuel Oil
-5
-4
-3
-2
-1
0
1
2
3
Jan-17 Jan-18 Jan-19 Jan-20 Jan-21

Additional margin supported by currency hedging
• Total refining margin USD 9.7/bbl (4.8)
• Reference margin USD 2.2/bbl (-0.3)
• Additional margin USD 7.5/bbl (5.1)
• Exceptionally high refinery production costs USD
21.5/bbl (5.6) mainly due to maintenance
Total refining margin, USD/bbl
20
-2
0
2
4
6
8
10
12
14
Q2/20 Q3/20 Q4/20 Q1/21 Q2/21
Reference margin Additional margin

Marketing & Services performed very well
• Comparable EBIT 18 MEUR (19)
• Normalized unit margins
• Slightly higher sales volumes, aviation and marine still
impacted by COVID-19
• Successful fixed cost management
• Investments 3 MEUR (4)
• Comparable RONA* 37.8% (24.7%)
21
MEUR Q2/21 Q2/20 2020
Revenue 886 664 3,055
Comparable EBIT 18 19 68
Net assets 185 206 192
Comparable EBIT, MEUR
* Last 12 months
0
10
20
30
Q2/20 Q3/20 Q4/20 Q1/21 Q2/21

Place and crop your
image here and send to backCurrent topics
22

Place and crop your
image here and send to
back
Place and crop your
image here and send to
back
Place and crop your
image here and send to
back
Focusing on strategy implementation
Progress during Q2
• Singapore expansion project proceeding
according to schedule
• Rotterdam 500 kton SAF optionality
project moving ahead
• Definition phase in preparation for possible
next renewable products refinery in
Rotterdam, aim at investment decision
readiness late this year or early 2022
• Several commercial agreements and
partnerships in Renewable Aviation and
Renewable Polymers & Chemicals
Progress during Q2
• IPCEI (Important Projects of Common
European Interest) status for Porvoo
clean hydrogen related projects being
applied for
• Business Finland Circular Economy
investment aid received for chemical
recycling related site and laboratory
investments
• Promising purification concepts found
for challenging waste and residues
Scale up faster and bolder Increase innovations
Progress during Q2
• Porvoo refinery major turnaround
completed
• Short-term cost reduction measures
successfully continued
Drive efficiency in operations
23
Place and crop your
image here and send to back
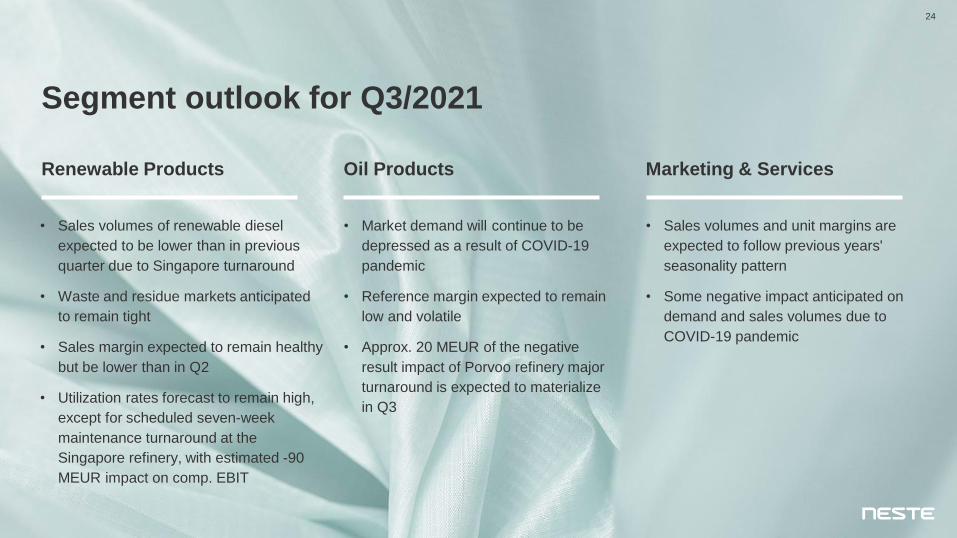
Segment outlook for Q3/2021
• Sales volumes of renewable diesel
expected to be lower than in previous
quarter due to Singapore turnaround
• Waste and residue markets anticipated
to remain tight
• Sales margin expected to remain healthy
but be lower than in Q2
• Utilization rates forecast to remain high,
except for scheduled seven-week
maintenance turnaround at the
Singapore refinery, with estimated -90
MEUR impact on comp. EBIT
• Sales volumes and unit margins are
expected to follow previous years'
seasonality pattern
• Some negative impact anticipated on
demand and sales volumes due to
COVID-19 pandemic
Renewable Products Marketing & Services
• Market demand will continue to be
depressed as a result of COVID-19
pandemic
• Reference margin expected to remain
low and volatile
• Approx. 20 MEUR of the negative
result impact of Porvoo refinery major
turnaround is expected to materialize
in Q3
Oil Products
24

Place and crop your
image here and send to back
Other 2021 topics
• Cash-out capital expenditure in 2021
estimated to be approx. 1.2 BEUR,
excluding M&A
Group CAPEX
• Scheduled 4-week catalyst change at
Rotterdam refinery in Q4, which is
estimated to have negative impact of
approx. 50 MEUR on comp. EBIT
Renewable Products
25
Place and crop your
image here
Capital Markets Day 2021
• Neste will host Virtual Capital
Markets Day as webcast on
Thursday 23 September
• More information from IR to
follow
26

Place and crop your
image here and send to backAppendix
27

Renewable Products comparable EBIT calculation
28
Q2/20 Q3/20 Q4/20 2020 Q1/21 Q2/21
Sales volume, kton 773 730 732 2,966 743 732
Comparable sales margin, USD/ton 625 744 760 703 699 700
Comparable sales margin, MEUR 439 464 466 1,824 432 425
Fixed costs, MEUR -82 -66 -79 -307 -88 -86
Depreciations, MEUR -43 -47 -50 -184 -51 -54
Comparable EBIT, MEUR 314 352 338 1,334 294 287

Oil Products’ refinery production costs
29
Q2/20 Q3/20 Q4/20 2020 Q1/21 Q2/21
Refined products Million barrels 23.0 26.7 23.8 103.3 22.8 5.8
Exchange rate EUR/USD 1.10 1.17 1.19 1.14 1.21 1.21
Utilities costsMEUR 41.3 48.7 45.8 185.4 61.0 38.6
USD/bbl 2.0 2.1 2.3 2.1 3.2 8.1
Fixed costsMEUR 76.6 48.4 53.2 241.4 45.8 64.7
USD/bbl 3.7 2.1 2.7 2.7 2.4 13.5
External cost salesMEUR -0.3 -0.3 -0.3 -1.3 -0.3 -0.2
USD/bbl 0.0 0.0 0.0 0.0 0.0 0.0
TotalMEUR 117.6 96.8 98.6 425.5 106.4 103.1
USD/bbl 5.6 4.2 4.9 4.7 5.6 21.5

Cash flow
30
MEUR Q2/21 Q2/20 Q1/21 H1/21 H1/20 2020
EBITDA 599 333 585 1,184 659 1,508
Capital gains/losses 0 0 -1 -1 0 -1
Other adjustments -48 219 98 49 99 277
Change in net working capital 75 -432 -801 -726 -395 460
Net finance costs -18 -19 -6 -24 -19 -54
Income taxes paid -41 -40 -27 -68 -90 -133
Net cash generated from operating activities 567 61 -153 413 254 2,057
Capital expenditure -239 -348 -417 -657 -546 -972
Other investing activities -67 41 -74 -141 -74 -67
Cash flow before financing activities 261 -246 -645 -384 -366 1,019

Liquidity & maturity profile
• Group’s liquidity EUR 2,667 million at end of June 2021
• Liquid funds EUR 1,317 million
• Unused committed credit facilities EUR 1,350
million
• Average interest rate for interest-bearing liabilities was
1.5% and maturity 3.6 years at end of June 2021
• No financial covenants in Group companies’ existing
loan agreements
31
0
200
400
600
2021 2022 2023 2024 2025 2026 2027 2028 2029
Short-term Long-term
MEUR


