39
Nestlé India Limited Gurgaon, 5 th August 2008 14 th Financial Analysts’ Meet

Nestlé India Limited
Gurgaon, 5th August 2008
14th Financial Analysts’ Meet

Agenda
Opening Remarks Martial Rolland
Key Financials Shobinder Duggal
Questions & Answers All

Disclaimer
This presentation may contain statements which reflect Management’s current views and estimates and could be construed as forward looking statements. The future involves certain risks and uncertainties that could cause actual results to differ materially from the current views being expressed. Potential risks and uncertainties include such factors as general economic conditions, foreign exchange fluctuations, competitive product and pricing pressures and regulatory developments.
Responses can only be given to questions, which are not price sensitive.

2008
RIG OGNet Sales
INR 21.3 Bio
INR 17.0 Bio
+ 24.9% + 60bp
18.8%
18.2%
Volumes
& Prices
22.6%26.0%
22.4%17.7%
EBIT
+ 29.6%
INR 4.0 Bio
INR 3.1 Bio
1st Half snap shot
All calculations are based on non-rounded figures
2007Economic
Profit
+ 30.8%
INR 2.3 Bio
INR 1.8 Bio
Includes Figures from Nestlé Internal Reporting Standards
+ INR 4.3 Bio
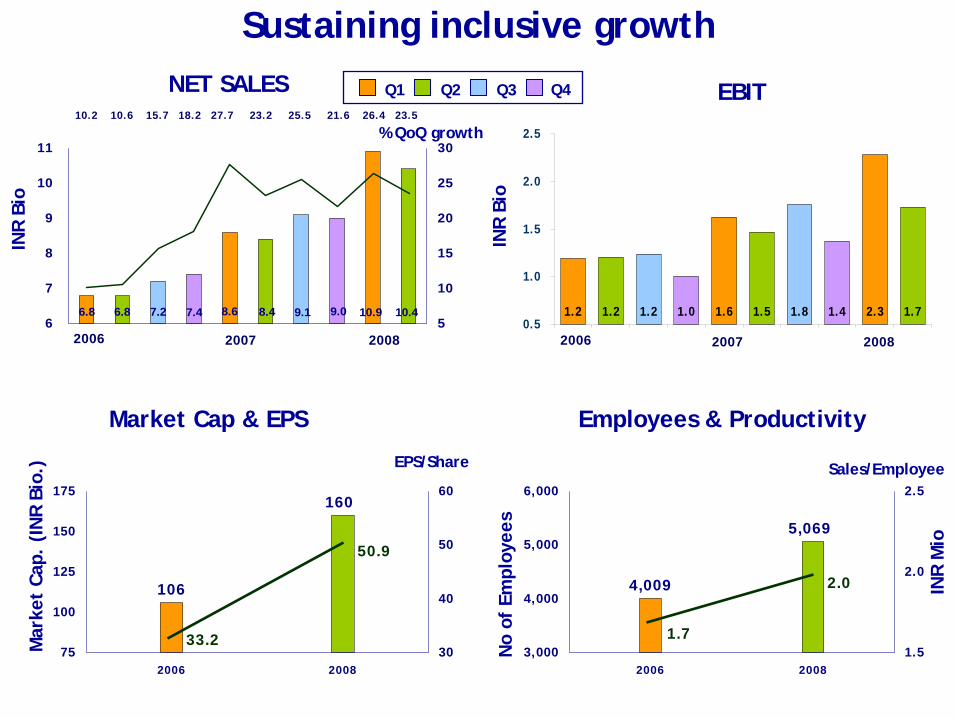
Sustaining inclusive growth
1.2 1.2 1.2 1.0 1.6 1.5 1.8 1.4 2.3 1.70.5
1.0
1.5
2.0
2.5
160
106
50.9
33.275
100
125
150
175
2006 200830
40
50
60
Q1 EBITQ2 Q3 Q4
INR
Bio
INR
Bio
Market Cap & EPS
5,069
4,009 2.0
1.73,000
4,000
5,000
6,000
2006 20081.5
2.0
2.5
Employees & Productivity
NET SALES
Mar
ket
Cap.
(IN
R Bi
o.)
No
of E
mpl
oyee
s
EPS/Share
2006 2007 2008 2006 2007 2008
10.9 10.49.09.17.4 8.66.86.8 7.2 8.46
7
8
9
10
11
5
10
15
20
25
30
10.2 10.6 15.7 18.2 27.7 23.2 25.5 21.6 26.4 23.5
Sales/Employee
INR
Mio
% QoQ growth
UNLEASHING 100% POTENTIAL6
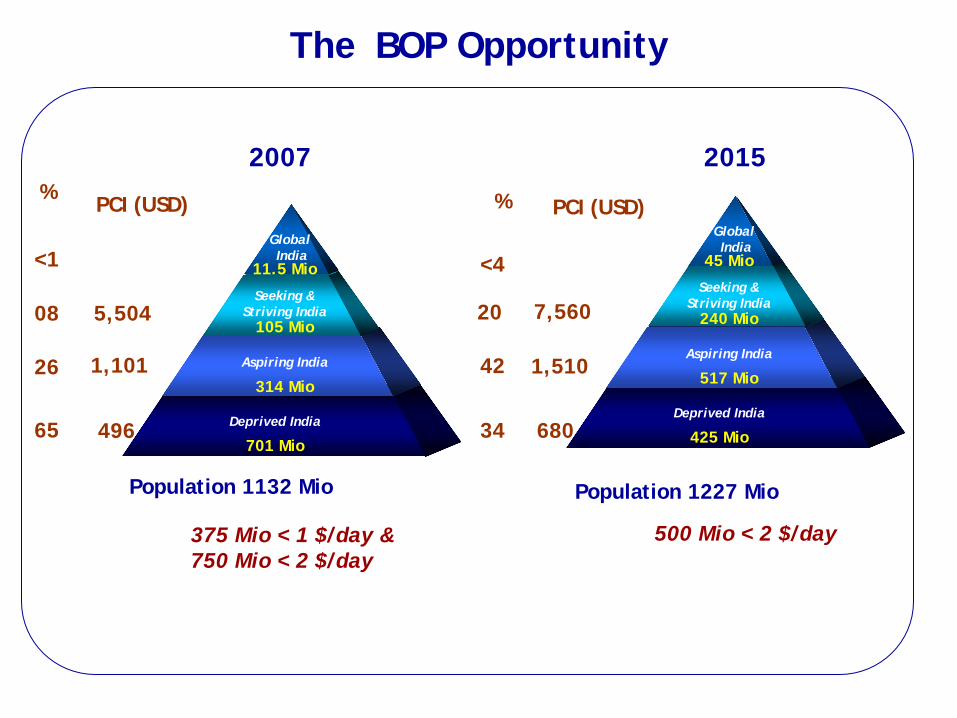
The BOP Opportunity
375 Mio < 1 $/day &750 Mio < 2 $/day
Population 1132 Mio
Deprived India
701 Mio
Aspiring India
314 Mio
Seeking & Striving India
105 Mio
GlobalIndia
11.5 Mio
65
26
08
<1
%
5,504
1,101
496
PCI (USD)
2007
Population 1227 Mio
Deprived India
425 Mio
Aspiring India
517 Mio
Seeking & Striving India
240 Mio
GlobalIndia
45 Mio
34
42
20
<4
%
2015
7,560
1,510
680
PCI (USD)
500 Mio < 2 $/day
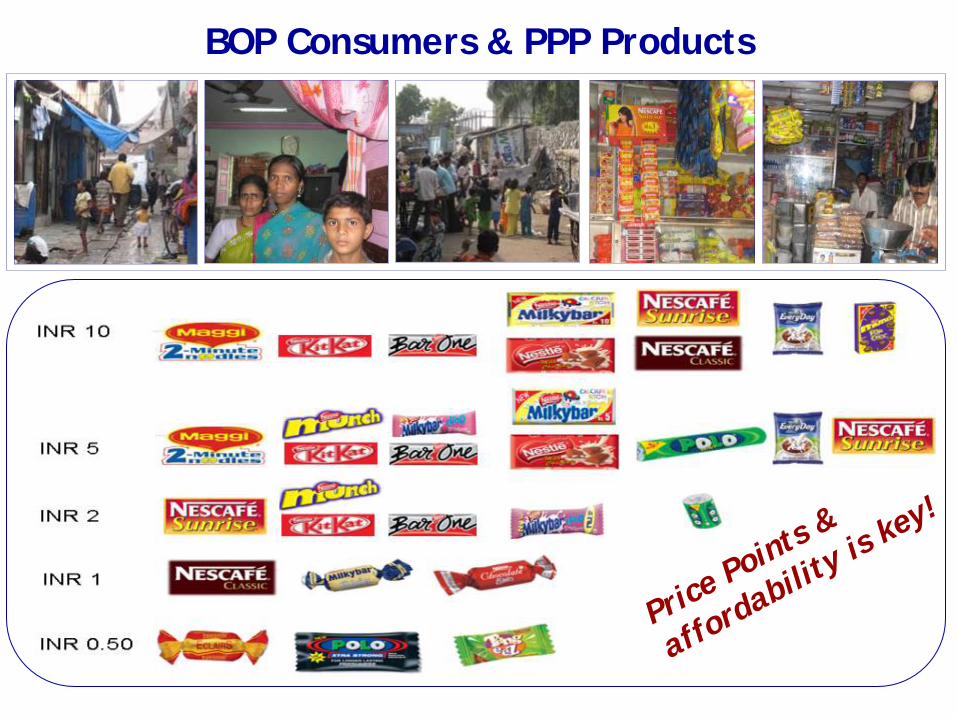
BOP Consumers & PPP Products
Price Points &
affordabilit
y is key!
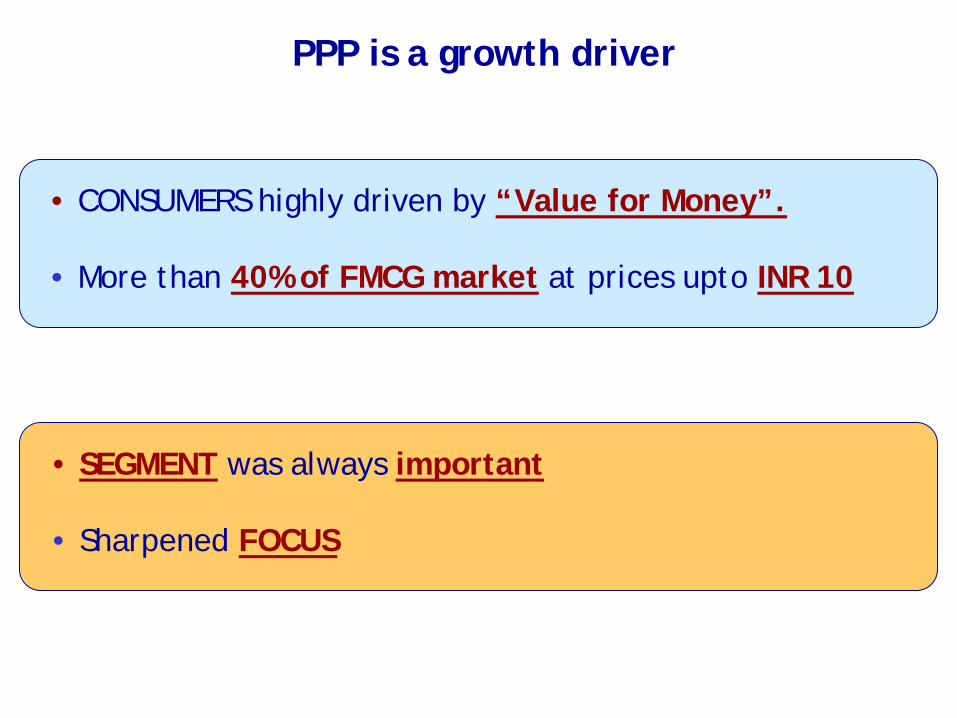
• CONSUMERS highly driven by “Value for Money”.
• More than 40% of FMCG market at prices upto INR 10
PPP is a growth driver
• SEGMENT was always important
• Sharpened FOCUS
UNLEASHING 100% POTENTIAL9
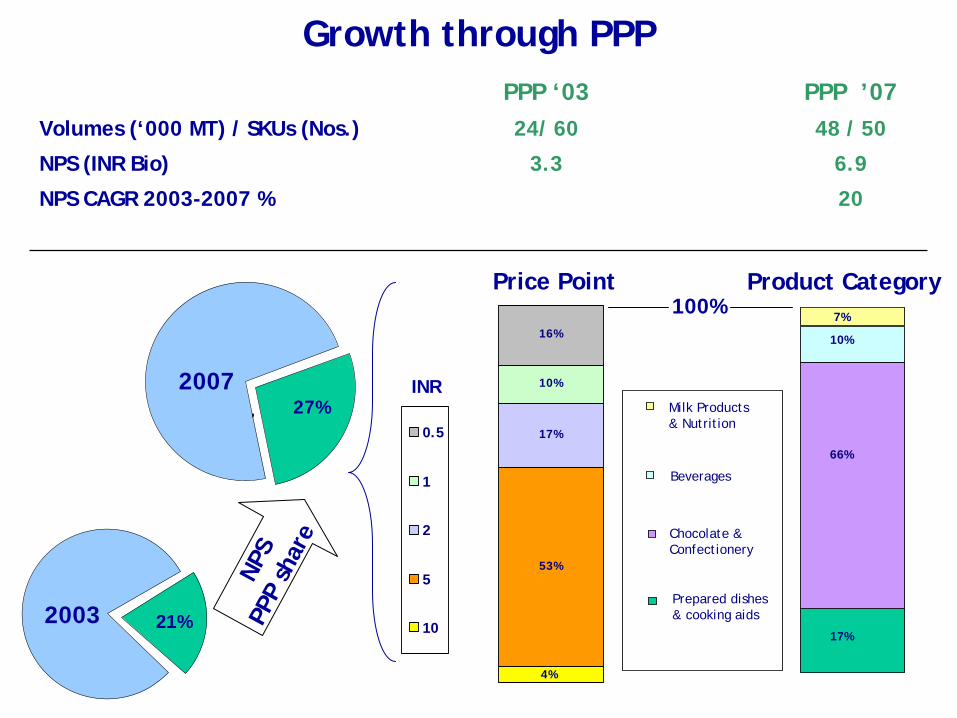
Growth through PPP PPP ‘03 PPP ’07
Volumes (‘000 MT) / SKUs (Nos.) 24/ 60 48 / 50
NPS (INR Bio) 3.3 6.9
NPS CAGR 2003-2007 % 20
53%
17%
10%
16%
4%
0.5
1
2
5
10
Price Point Product Category100%
INR
NPS
PPP
shar
e
2003
200727%
21%
2007
200317%
66%
10%
7%
Milk Products& Nutrition
Beverages
Chocolate & Confectionery
Prepared dishes& cooking aids
UNLEASHING 100% POTENTIAL10
Managing a PPP business demands a creative
‘mindset’ which challenges traditional thinking
and re-defines paradigms.
Conclusion
SALES GROWTH (1)

26.7 29.7 36.8 17.8 22.2
7.99.7
17.7
22.6
19.8
23.3
11.412.1
22.4
26.0
10.0
14.0
18.0
22.0
26.0
30.0
34.0
38.0
2005 2006 2007 H1 07 H1 080
7
14
21
28
Sales INR Bio Real Internal Growth (%) Organic Growth (%)
Sales Evolution
Basis Nestlé Internal Reporting Standards
Sale
s in
INR
bio
(%)
RIG
&O
G
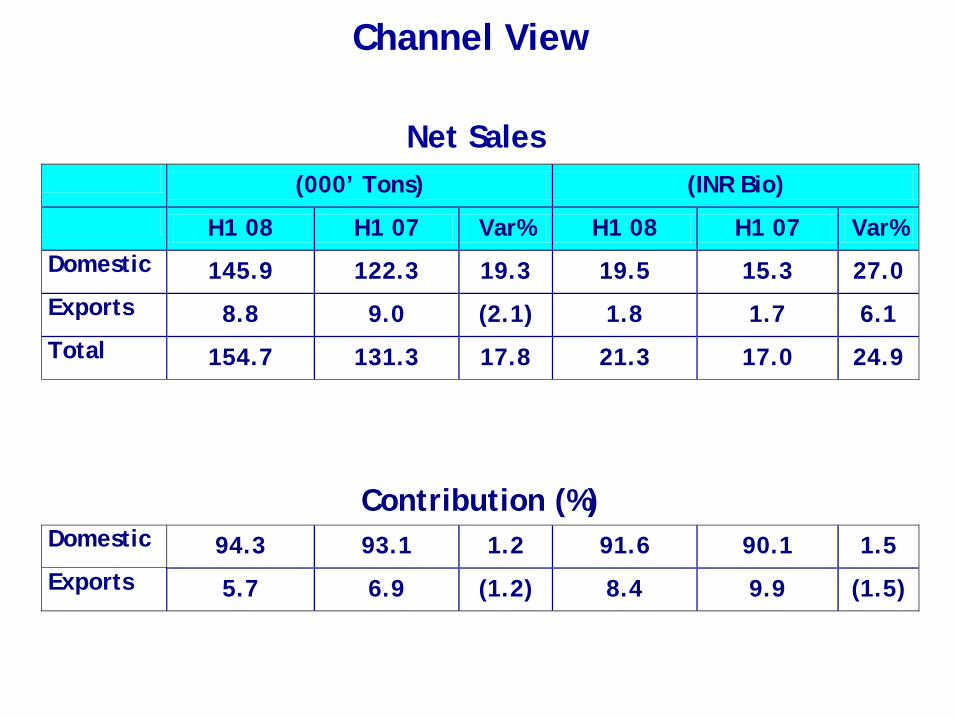
(000’ Tons) (INR Bio) H1 08 H1 07 Var% H1 08 H1 07 Var% Domestic 145.9 122.3 19.3 19.5 15.3 27.0 Exports 8.8 9.0 (2.1) 1.8 1.7 6.1 Total 154.7 131.3 17.8 21.3 17.0 24.9
Contribution (%) Domestic 94.3 93.1 1.2 91.6 90.1 1.5 Exports 5.7 6.9 (1.2) 8.4 9.9 (1.5)
Channel View
All calculations are based on non-rounded figures
Net Sales
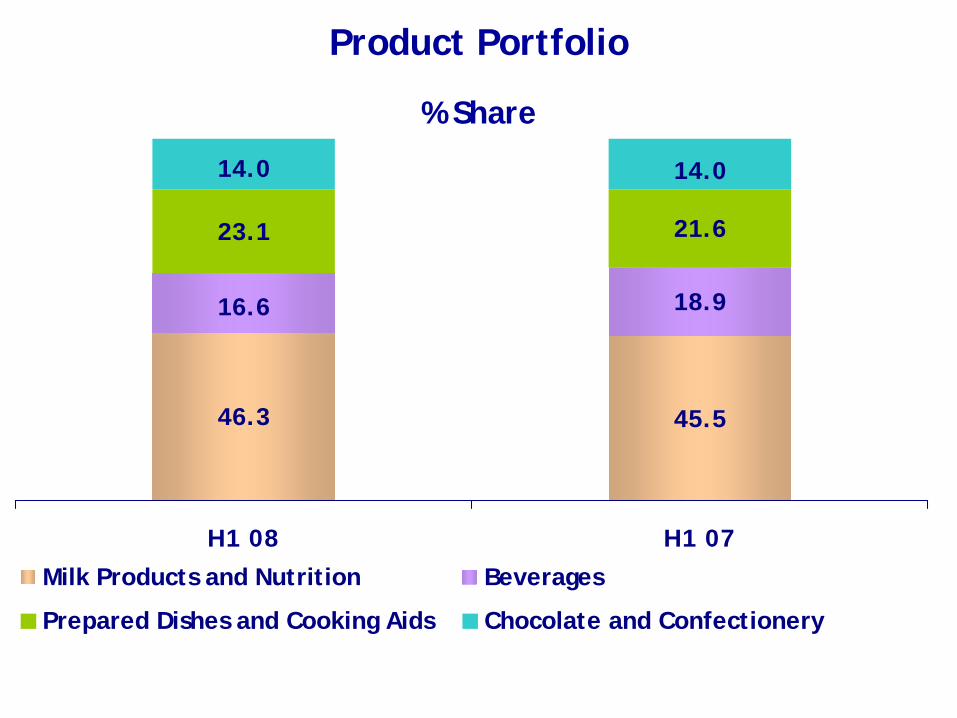
45.546.3
18.916.6
21.623.1
14.014.0
H1 08 H1 07Milk Products and Nutrition Beverages
Prepared Dishes and Cooking Aids Chocolate and Confectionery
% Share
Product Portfolio
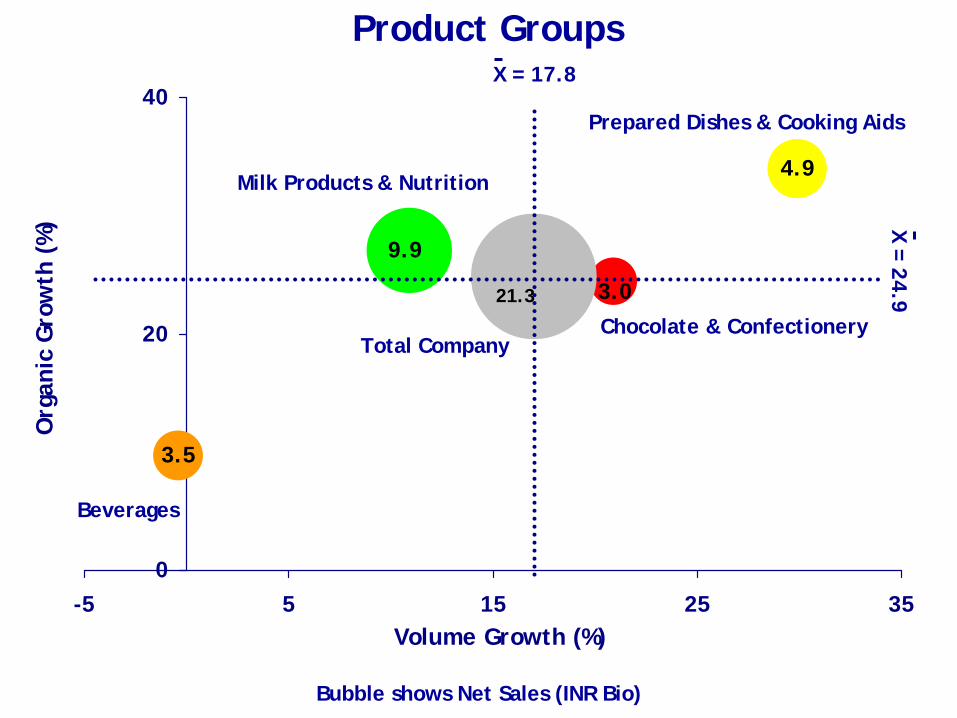
Product Groups
9.9
4.9
3.5
3.0 21.3
0
20
40
-5 5 15 25 35Volume Growth (%)
Org
anic
Gro
wth
(%
)
Chocolate & Confectionery
Milk Products & Nutrition
Beverages
Prepared Dishes & Cooking Aids
Bubble shows Net Sales (INR Bio)
X = 24.9X = 17.8
Total Company
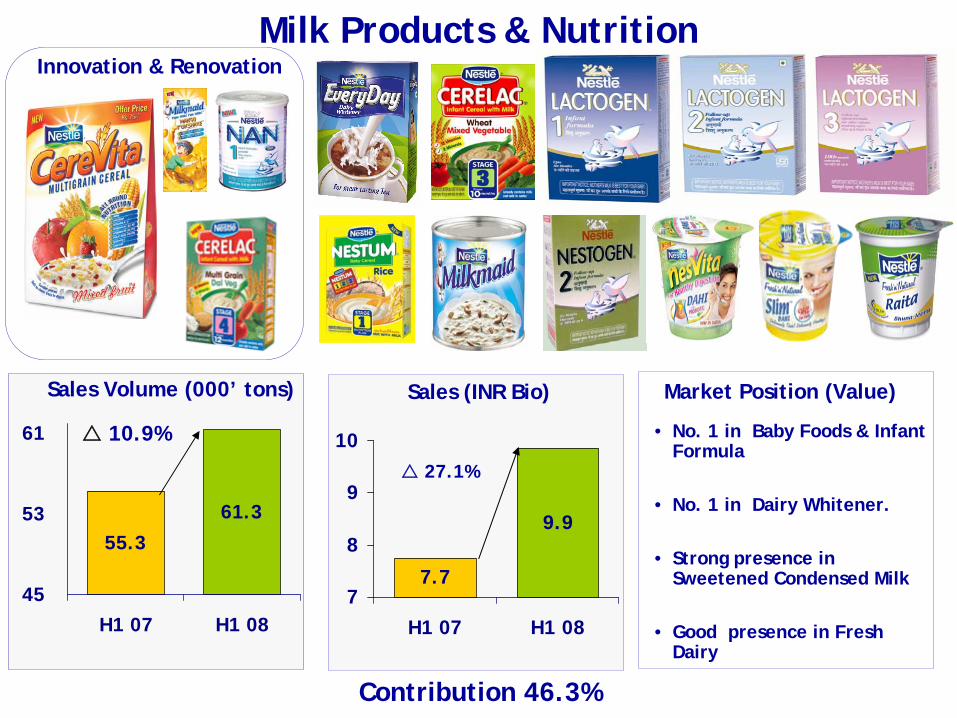
55.3
61.3
45
53
61
H1 07 H1 08
7.7
9.9
7
8
9
10
H1 07 H1 08
Milk Products & Nutrition
Sales Volume (000’ tons)
10.9%
Sales (INR Bio)
27.1%
• No. 1 in Baby Foods & Infant Formula
• No. 1 in Dairy Whitener.
• Strong presence in Sweetened Condensed Milk
• Good presence in Fresh Dairy
Innovation & Renovation
Contribution 46.3%
Market Position (Value)
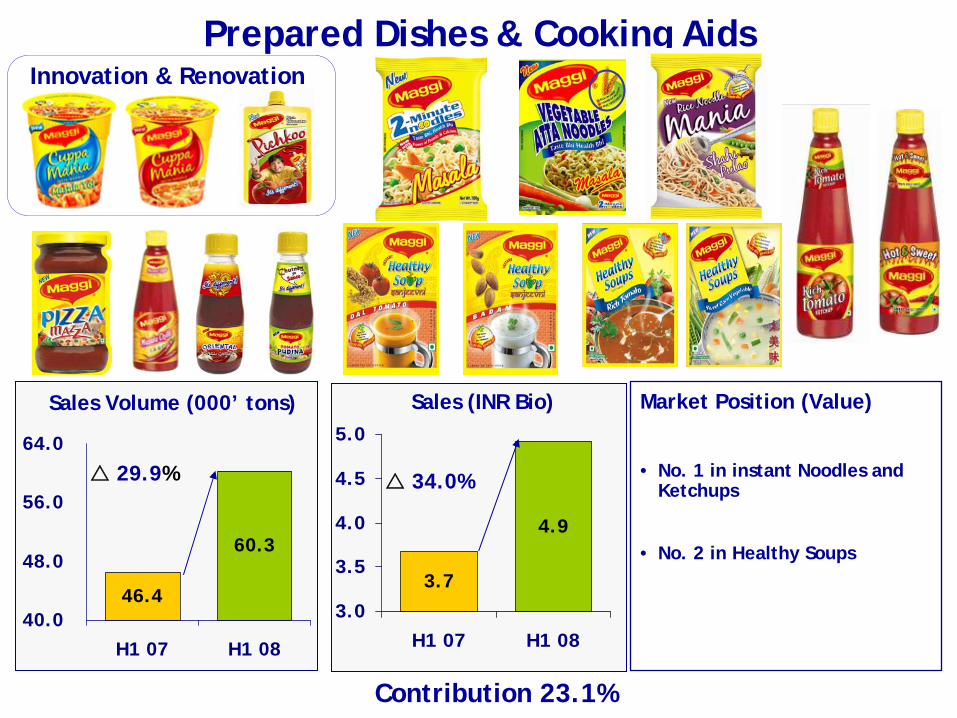
3.7
4.9
3.0
3.5
4.0
4.5
5.0
H1 07 H1 08
34.0%
46.4
60.3
40.0
48.0
56.0
64.0
H1 07 H1 08
Sales Volume (000’ tons)
Prepared Dishes & Cooking Aids
29.9%
Sales (INR Bio) Market Position (Value)
• No. 1 in instant Noodles and Ketchups
• No. 2 in Healthy Soups
Innovation & Renovation
Contribution 23.1%
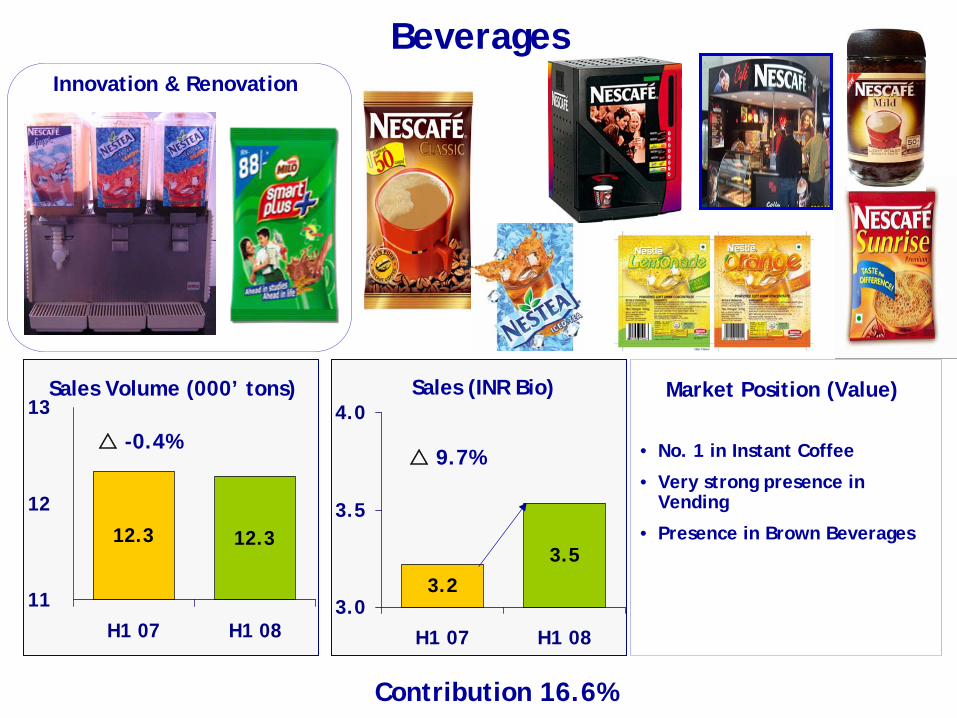
12.3 12.3
11
12
13
H1 07 H1 08
Sales (INR Bio)
3.23.5
3.0
3.5
4.0
H1 07 H1 08
9.7%-0.4%
Beverages
Sales Volume (000’ tons)
Innovation & Renovation
Market Position (Value)
• No. 1 in Instant Coffee
• Very strong presence in Vending
• Presence in Brown Beverages
Contribution 16.6%
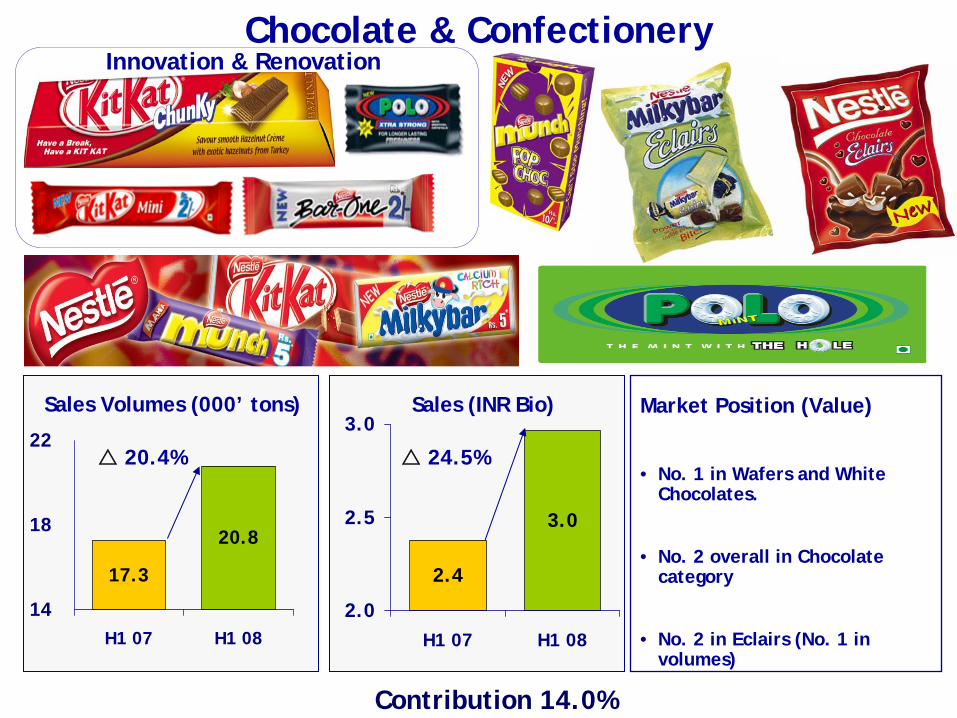
2.4
3.0
2.0
2.5
3.0
H1 07 H1 08
17.3
20.8
14
18
22
H1 07 H1 08
Chocolate & Confectionery
Sales Volumes (000’ tons)
20.4%
Sales (INR Bio)
24.5%
Market Position (Value)
• No. 1 in Wafers and White Chocolates.
• No. 2 overall in Chocolate category
• No. 2 in Eclairs (No. 1 in volumes)
Innovation & Renovation
Contribution 14.0%
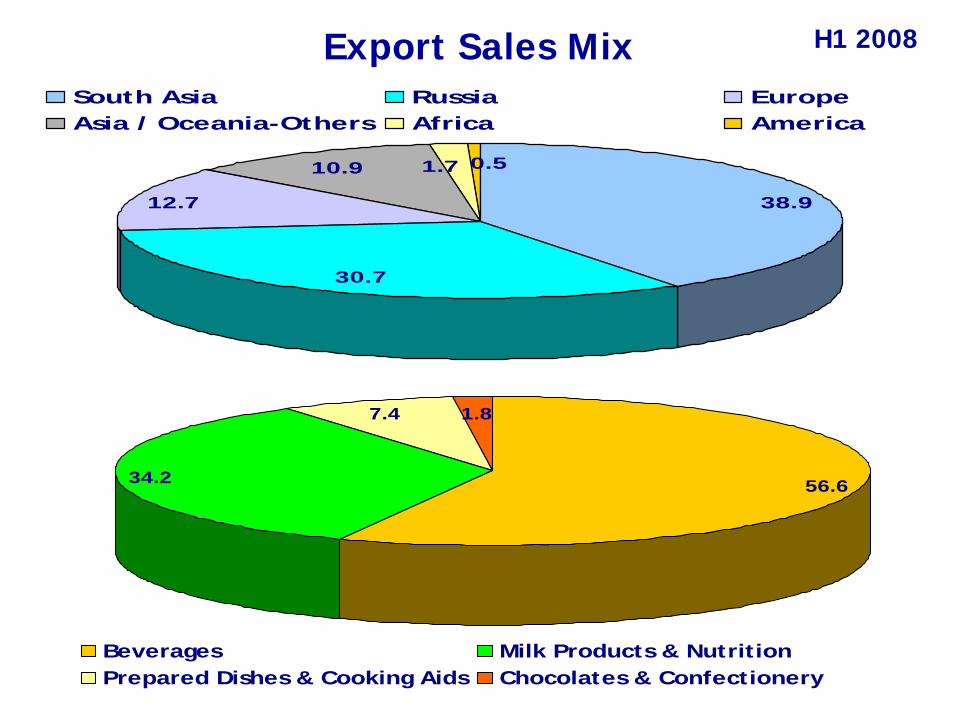
Export Sales Mix
38.9
30.7
12.7
10.9 1.7 0.5
South Asia Russia EuropeAsia / Oceania-Others Africa America
56.634.2
7.4 1.8
Beverages Milk Products & NutritionPrepared Dishes & Cooking Aids Chocolates & Confectionery
H1 2008

PROFIT MARGINS (2)
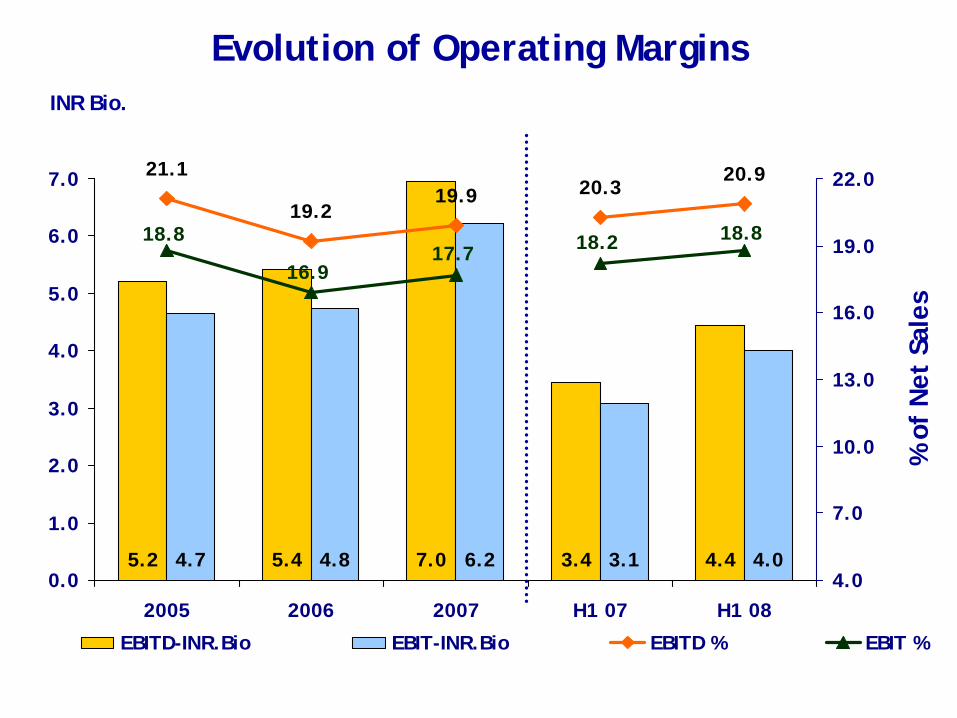
Evolution of Operating MarginsINR Bio.
5.2 7.0 4.05.4 4.43.44.7 3.16.24.8
20.920.319.9
19.2
21.1
18.8
16.917.7 18.2 18.8
0.0
1.0
2.0
3.0
4.0
5.0
6.0
7.0
2005 2006 2007 H1 07 H1 084.0
7.0
10.0
13.0
16.0
19.0
22.0
EBITD-INR.Bio EBIT-INR.Bio EBITD % EBIT %
% o
f N
et S
ales
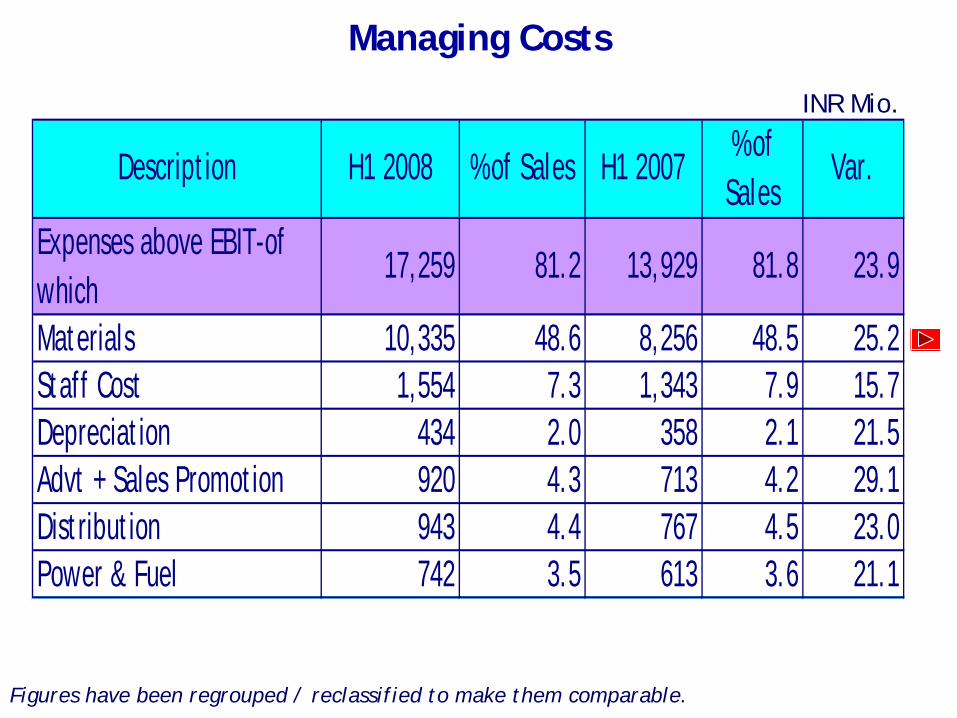
INR Mio.
Managing Costs
Figures have been regrouped / reclassified to make them comparable.
Description H1 2008 % of Sales H1 2007% of Sales
Var.
Expenses above EBIT-of which
17,259 81.2 13,929 81.8 23.9
Materials 10,335 48.6 8,256 48.5 25.2 Staff Cost 1,554 7.3 1,343 7.9 15.7 Depreciation 434 2.0 358 2.1 21.5 Advt + Sales Promotion 920 4.3 713 4.2 29.1 Distribution 943 4.4 767 4.5 23.0 Power & Fuel 742 3.5 613 3.6 21.1

Evolution of Net Profit Margins
INR Bio.
3.1 3.2 4.1 2.0 2.8
12.5
11.212.0
13.211.8
1
2
3
4
5
2005 2006 2007 H1 07 H1 085
10
15
Amount % of Net Sales
% of Net sales
WORKING CAPITAL INTENSITY (3)

Trade Net Working Capital (TNWC)
INR Mio
30th Jun 2008
30th Jun 2007
Receivables from Customers 731 629
Inventories 5,161 4,409
Less: Trade Payables * 2,594 1,998
TNWC 3,298 3,040
As % of Sales (12 rolling months ) 8.0 9.2
Basis Nestle Internal Reporting Standards and including affiliated customers and vendors
* Excludes payables for taxes, Staff Costs, Capex, provisions for contingencies etc.
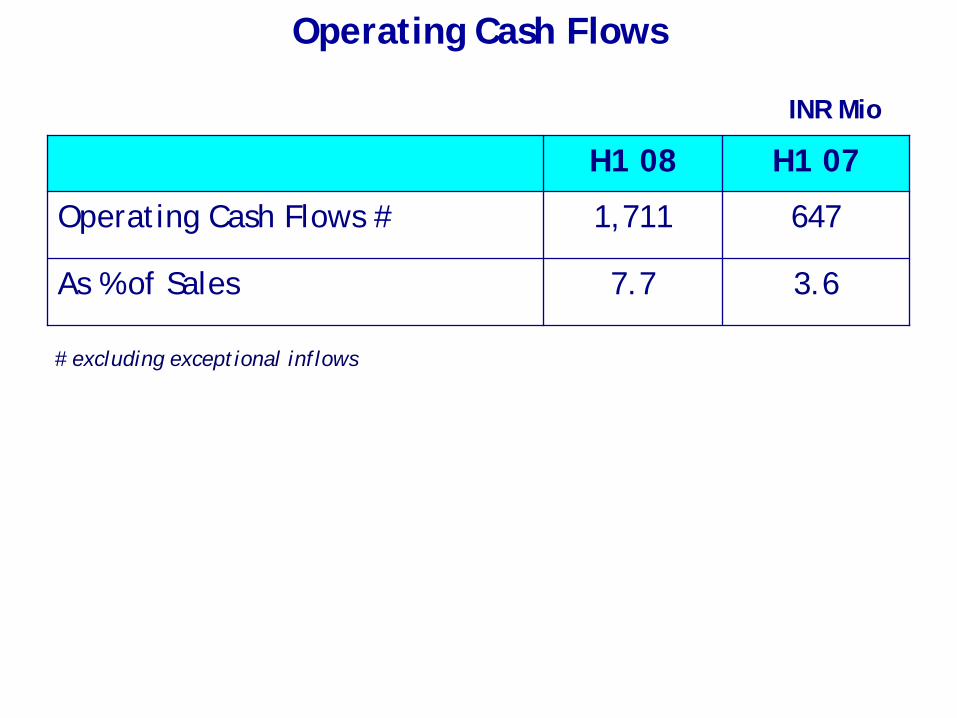
Operating Cash Flows
INR Mio
H1 08 H1 07
Operating Cash Flows # 1,711 647
As % of Sales 7.7 3.6
Basis Nestle Internal Reporting Standards
# excluding exceptional inflows
FIXED CAPITAL INTENSITY (4)

INR mio. % of Net sales
Investment in Fixed Assets
1,522 1,698 442 733781
4.8
2.6
3.4
5.4
3.2
300
800
1300
1800
2005 2006 2007 H1 07 H1 081.0
3.0
5.0
7.0
Amount % of Net sales
Depreciation 498 555 640 305 381
Excludes Intangibles

Rotation of Average Tangible Fixed AssetsTimes
Basis Nestlé Internal Reporting Standards
6.6
6.97.0
7.2
6.5
6.0
6.3
6.6
6.9
7.2
7.5
2005 2006 2007 H1 07 H1 08
INCOME TAX RATE (5)
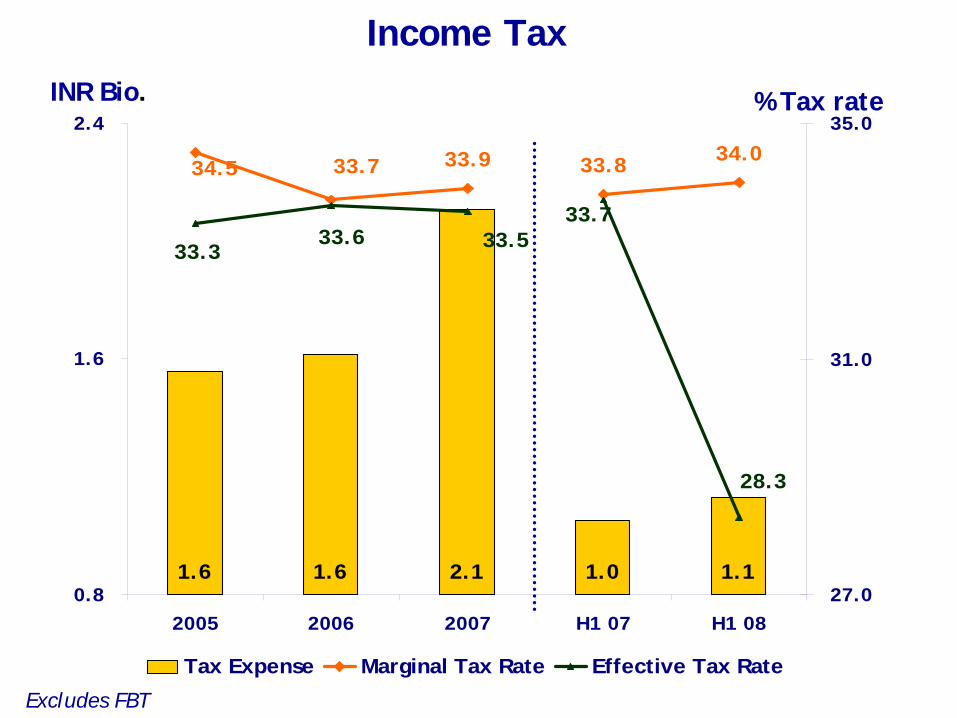
1.6 1.6 2.1 1.0 1.1
34.5 33.7 33.8 34.033.9
33.533.333.6
33.7
28.3
0.8
1.6
2.4
2005 2006 2007 H1 07 H1 0827.0
31.0
35.0
Tax Expense Marginal Tax Rate Effective Tax Rate
INR Bio. % Tax rate
Excludes FBT
Income Tax
COST OF CAPITAL (6)

Cost of Capital
Basis Nestlé Internal Reporting Standards
11.3 11.2
7.27.7 7.7
7.9
11.7
10.5
9.3
6.6
5.0
8.5
12.0
2005 2006 2007 H1 07 H1 08
Adjusted Cost of Capital (ACC) Risk Free Rate

VALUE GROWTH DURATION (7)
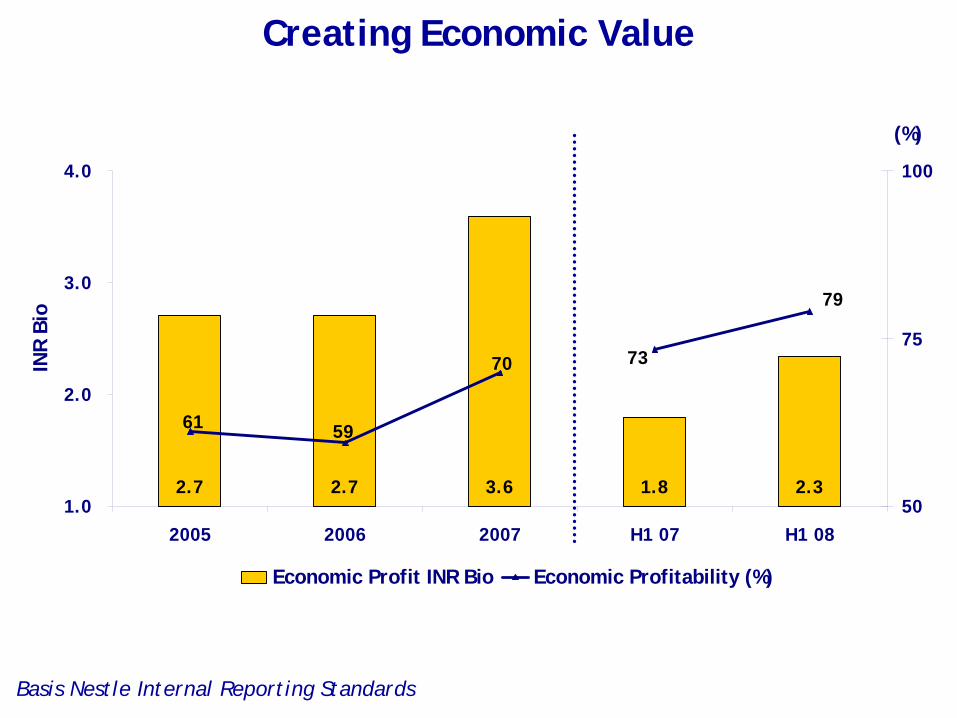
2.7 2.7 3.6 1.8 2.3
70
61 59
73
79
1.0
2.0
3.0
4.0
2005 2006 2007 H1 07 H1 08
INR
Bio
50
75
100
(%)
Economic Profit INR Bio Economic Profitability (%)
Basis Nestle Internal Reporting Standards
Creating Economic Value
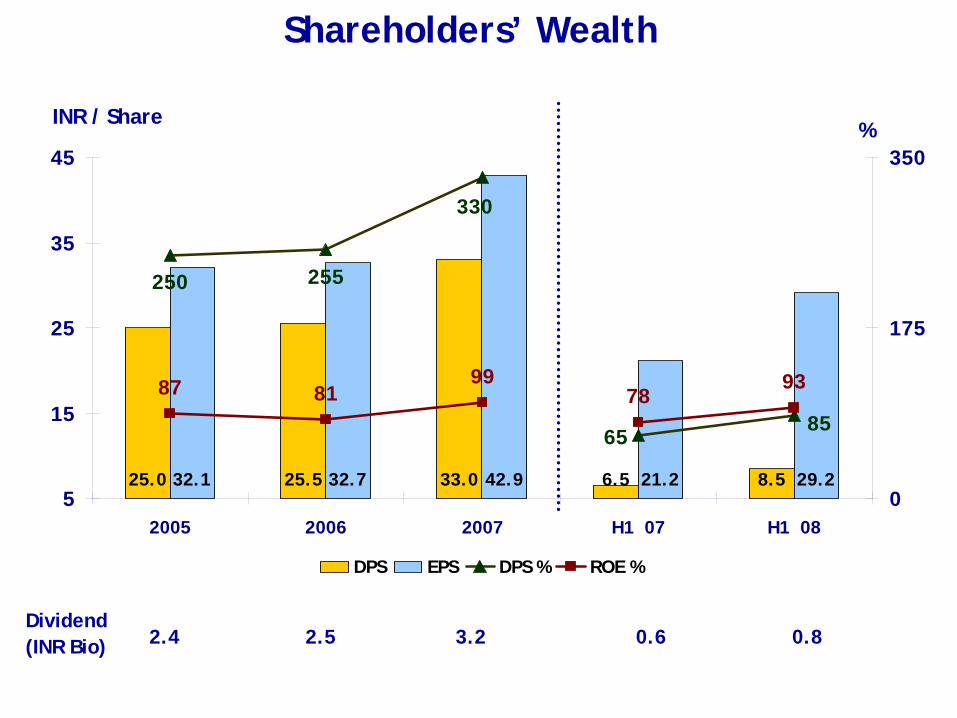
25.0 25.5 33.0 6.5 8.532.1 32.7 42.9 21.2 29.2
87 8199
7893
250
65
255
330
85
5
15
25
35
45
2005 2006 2007 H1 07 H1 080
175
350
DPS EPS DPS % ROE %
INR / Share%
Shareholders’ Wealth
2.4 2.5 3.2 0.6 0.8Dividend(INR Bio)
THANK YOU

10.0
21.7
-1.6
5.4
23.5
-5
0
5
10
15
20
25
Inde
xed
cos
t in
crea
se %
Commodity Costs - Ongoing Challenge
H1 2007
Reference point - Jan-Jun 2007 prices
Green Coffee
Milk Solids
Wheat Flour
Oils
Sugar
H1 2008


