Table of Contents Creating Usable Customer Intelligence from Social Media Data: Network Analytics meets Text Mining ............................................................................................................................................ 1
Summary: “Water water everywhere and not a drop to drink” ............................................................ 3
Social Media Channel-Reporting Tools. .................................................................................................. 3
Social Media Scorecards .......................................................................................................................... 4
Summary: “Water water everywhere and not a drop to drink” The Rime of the Ancient Mariner, Samuel Taylor Coolidge
In today’s world of social media and the wide variety of social media channels available, there is a huge amount of data available. The challenge comes in accessing that data and transforming it into something that is usable and actionable. Generally, organizations want to use the social media data to understand the needs and behavior of their customers or specific targeted groups of individuals with respect to the organizations’ current or future products or services. There are three major approaches to looking at social media – channel reporting tools, overview score-carding systems and predictive analytic techniques (primarily text mining). Each has its useful aspects, but each also has limitations. In this paper we will discuss a fourth approach – using a predictive analytic platform that includes not only text mining, but network analysis as well as other predictive techniques such as clustering to overcome not only the limitations of the previous techniques, but generate new fact based insight as well. This approach was first used at a major European Telco. To explain the detailed approach, this white paper will work on publicly available data. We show not only sentiment analysis and influencers, but we are able to combine these techniques and – in our example – prove that participants who are very negative in their sentiment are actually not highly regarded as thought leaders by the rest of the community. This is an amazing result which goes against the popular marketing adage that negative users have a very high effect on the community at large. Note: To enable our approach to be repeated by the reader, we used the KNIME open source platform throughout this white paper. Sample data and workflows showing these techniques are available on the KNIME site at WWW.KNIME.COM .
Social Media Channel-Reporting Tools. A wide number of tools – both open source and commercial – is now available to gain a first impression of a particular social media channel. Whether this is Twitter, Facebook, Google, YouTube or any of the other popular social media channels, tools or services can be found to provide an overview of that channel. These tools are generally surfaced as websites or web application components and serve as an interface to a cloud-based application that collects the data. Channel-reporting tools are particularly useful for gaining an instant overview on a focused subset of activity, or for looking at recent changes either in real time or for a fixed time frame. Virtually all provide some capacity for focusing or limiting what is looked at. This can be very helpful if you are first starting out on the road to understanding social media tools or if you have a responsibility to respond quickly to tactical activity on a particular channel. A good example of such an activity is monitoring a number of Tweet feeds related to the travel industry. If you work for an airline and that airline is mentioned, you will want to know whenever it is mentioned in order to be able to respond quickly with an offer of help or clarification. While these tools can give you an initial overview, and can be very valuable tactically, they are not suitable for gaining a deeper insight into the behavior or needs, concerns, wishes or trends of the individuals contributing since these tools and services do not actually provide the data, nor do they provide any context for the summarized data being presented.
Social Media Scorecards These tools are generally cloud-based applications that pull many different social media data sources together including communities and blogs. They are able to do this because they generally incorporate a massive back end infrastructure that constantly crawls and captures new data as it occurs. They all provide an interface to filter the data and enter selection criteria to look across a broad range of channel choices. The results usually take some form of a visual scorecard that combines different graphical and tabular techniques for displaying the summarized information. Many allow an interactive “drill down” to see further details, most of them allowing you to drill right through to the original source of the data. These scorecards are very good for keeping an overview. They can give a high level perspective on such topics as positive and negative users and writings as well as the quantity and relative popularity of an individual or a topic. The disadvantages are again that the actual data collected and displayed by the cloud application cannot be made available for enhancement, contextual focusing or for doing any sort of predictive analytics.
Predictive Analytic Techniques Predictive analytic techniques used on social media enable us to start generating new fact-based insight on the social media data. Generally, social media data contained in public forums is now accessible through standard APIs or tools that allow the data to be downloaded from the cloud. There are also specialized service providers that will scan and deliver all the data in a usable form. Traditionally, text mining has been used to perform sentiment analysis on social media data. Sentiment analysis takes the written text and translates it into different contexts, such as positive or negative. In addition, there are a number of new visualization techniques, such as the word cloud or tag cloud, that help translate the vast quantities of text-mined words into something that is more compact and therefore understandable. Text mining can be very powerful. Sentiment analysis depends on an appropriate subjectivity lexicon that understands the relative positive, neutral or negative context of a word or expression. It is both language and context specific. A good example can be seen in Figure 1.
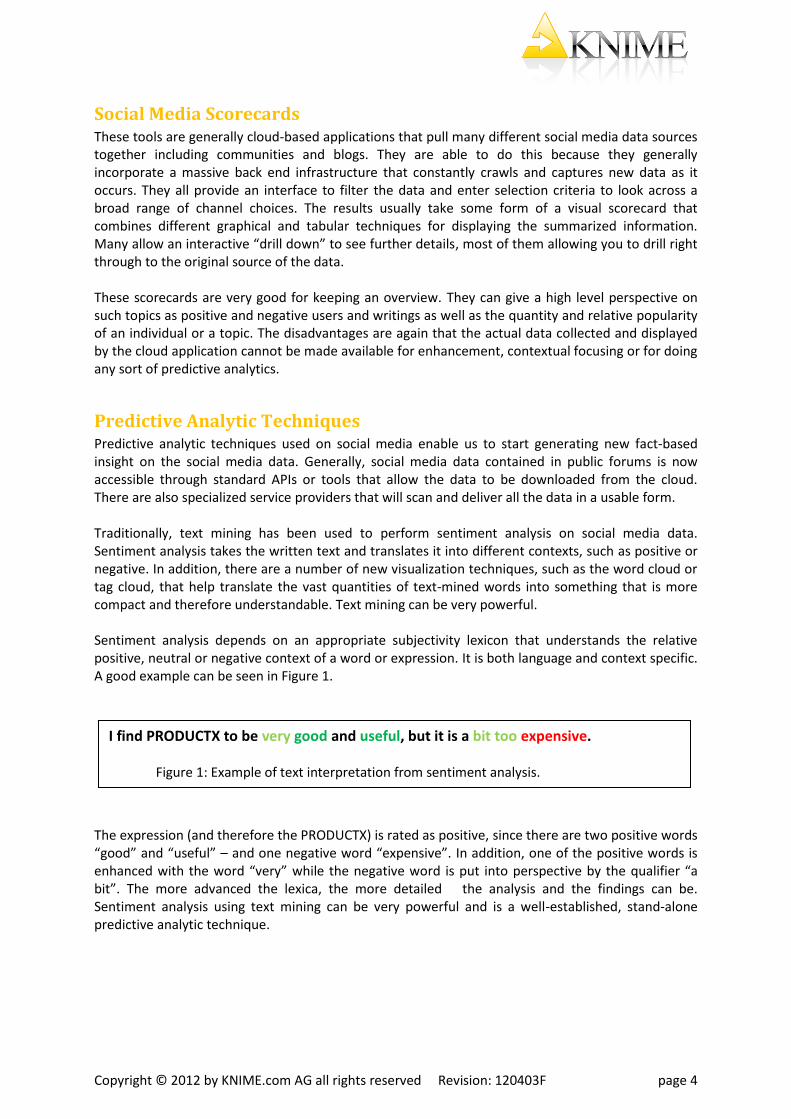
The expression (and therefore the PRODUCTX) is rated as positive, since there are two positive words “good” and “useful” – and one negative word “expensive”. In addition, one of the positive words is enhanced with the word “very” while the negative word is put into perspective by the qualifier “a bit”. The more advanced the lexica, the more detailed the analysis and the findings can be. Sentiment analysis using text mining can be very powerful and is a well-established, stand-alone predictive analytic technique.
I find PRODUCTX to be very good and useful, but it is a bit too expensive. Figure 1: Example of text interpretation from sentiment analysis.
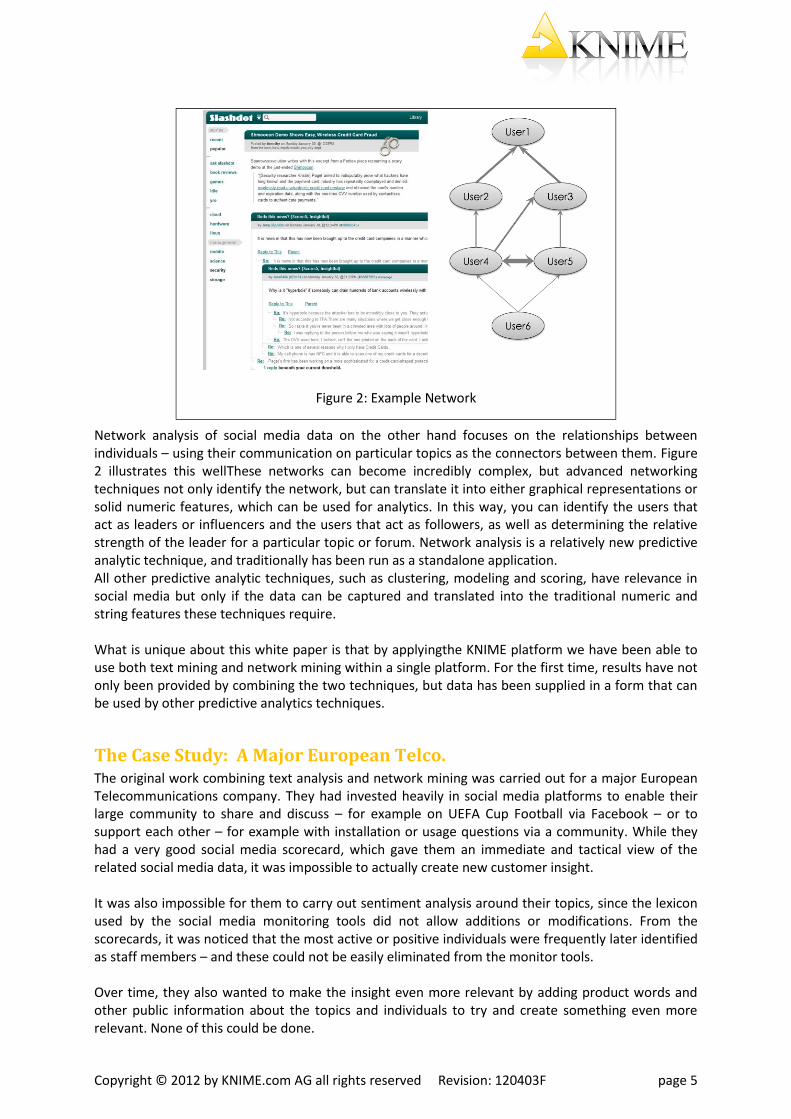
Network analysis of social media data on the other hand focuses on the relationships between individuals – using their communication on particular topics as the connectors between them. Figure 2 illustrates this wellThese networks can become incredibly complex, but advanced networking techniques not only identify the network, but can translate it into either graphical representations or solid numeric features, which can be used for analytics. In this way, you can identify the users that act as leaders or influencers and the users that act as followers, as well as determining the relative strength of the leader for a particular topic or forum. Network analysis is a relatively new predictive analytic technique, and traditionally has been run as a standalone application. All other predictive analytic techniques, such as clustering, modeling and scoring, have relevance in social media but only if the data can be captured and translated into the traditional numeric and string features these techniques require. What is unique about this white paper is that by applyingthe KNIME platform we have been able to use both text mining and network mining within a single platform. For the first time, results have not only been provided by combining the two techniques, but data has been supplied in a form that can be used by other predictive analytics techniques.
The Case Study: A Major European Telco. The original work combining text analysis and network mining was carried out for a major European Telecommunications company. They had invested heavily in social media platforms to enable their large community to share and discuss – for example on UEFA Cup Football via Facebook – or to support each other – for example with installation or usage questions via a community. While they had a very good social media scorecard, which gave them an immediate and tactical view of the related social media data, it was impossible to actually create new customer insight. It was also impossible for them to carry out sentiment analysis around their topics, since the lexicon used by the social media monitoring tools did not allow additions or modifications. From the scorecards, it was noticed that the most active or positive individuals were frequently later identified as staff members – and these could not be easily eliminated from the monitor tools. Over time, they also wanted to make the insight even more relevant by adding product words and other public information about the topics and individuals to try and create something even more relevant. None of this could be done.
So the public data was extracted from the cloud and brought in house. It was enhanced with product information and staff information so that very specific queries and techniques could be applied. Not only text mining and network analytic techniques were performed, but after converting the raw text back into normal data, clustering and modeling techniques were applied. The results were fascinating: insight into not only positive and negative sentiment, but an indication of how well the users were regarded within the community. Staff entries could be eliminated, and clusters of individuals with similar needs and response patterns were discovered. It soon became clear that the applied techniques were extremely powerful, and the desire to create a white paper documenting these new approaches was great. There was also a desire to actually share in the form of working examples. This required us to find a publicly available source of data that everyone could use. We discovered a public social media data set very similar in shape and structure to the one used for the European Telco and the data that is used throughout this white paper.
Public Social Media Data: Slashdot Slashdot is a popular website, which was created in 1997. It publishes frequent short news posts mostly about technological questions and allows its readers to comment on them. The user community is quite active with more than 200 responses to a thread tending to be the rule rather than the exception. Most of the users are registered and leave comments by their nickname, although some participate anonymously. The data we used is a subset of the Slashdot homepage which is provided by Fundación Barcelona Media4 (http://caw2.barcelonamedia.org/node/25 ). The subset contains about 140,000 comments to 496 articles about politics from a total of about 24,000 users.
Text Mining the Slashdot Data In a first step our goal is to identify negative and positive users, that is to determine whether the known (not anonymous) users express predominantly positive or negative opinions, attitudes, feelings, or sentiments in their comments and articles. In order to measure the sentiment of a user a level of attitude is determined, which measures whether a user writes his or her comments and articles mainly negatively or positively. The level of attitude can also be used to categorize the users afterwards. To categorize sentiment a lexicon containing words (clues) and, in addition to other information, their polarity is used. The polarity of a word specifies whether the word seems to evoke something positive or something negative. Possible polarity values are: positive, negative, both, and neutral. Naturally, the lexicon is incredibly important as not only the language but the contextual usage of the language for the given audience is significant. With KNIME, you can freely choose the lexicon that is most appropriate for your text data or – alternately – use KNIME to build or modify an available lexicon to suit your tasks. For the Slashdot data, the sentiment analysis of the user comments and articles is based on a publicly available lexicon called the MPQA subjectivity lexicon (http://www.cs.pitt.edu/mpqa/lexicons.html). In the MPQA lexicon, the words as well as their polarity have been identified and collected manually and automatically from annotated and non-annotated data.
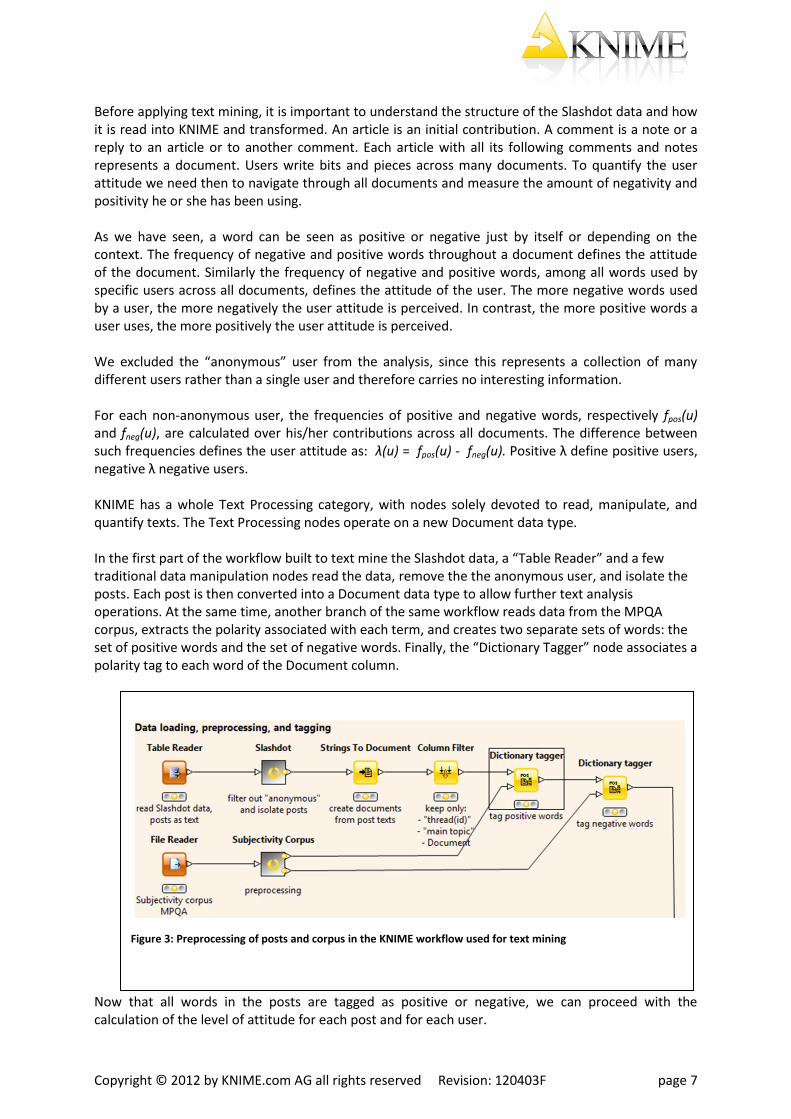
Before applying text mining, it is important to understand the structure of the Slashdot data and how it is read into KNIME and transformed. An article is an initial contribution. A comment is a note or a reply to an article or to another comment. Each article with all its following comments and notes represents a document. Users write bits and pieces across many documents. To quantify the user attitude we need then to navigate through all documents and measure the amount of negativity and positivity he or she has been using. As we have seen, a word can be seen as positive or negative just by itself or depending on the context. The frequency of negative and positive words throughout a document defines the attitude of the document. Similarly the frequency of negative and positive words, among all words used by specific users across all documents, defines the attitude of the user. The more negative words used by a user, the more negatively the user attitude is perceived. In contrast, the more positive words a user uses, the more positively the user attitude is perceived. We excluded the “anonymous” user from the analysis, since this represents a collection of many different users rather than a single user and therefore carries no interesting information. For each non-anonymous user, the frequencies of positive and negative words, respectively fpos(u) and fneg(u), are calculated over his/her contributions across all documents. The difference between such frequencies defines the user attitude as: λ(u) = fpos(u) - fneg(u). Positive λ define positive users, negative λ negative users. KNIME has a whole Text Processing category, with nodes solely devoted to read, manipulate, and quantify texts. The Text Processing nodes operate on a new Document data type. In the first part of the workflow built to text mine the Slashdot data, a “Table Reader” and a few traditional data manipulation nodes read the data, remove the the anonymous user, and isolate the posts. Each post is then converted into a Document data type to allow further text analysis operations. At the same time, another branch of the same workflow reads data from the MPQA corpus, extracts the polarity associated with each term, and creates two separate sets of words: the set of positive words and the set of negative words. Finally, the “Dictionary Tagger” node associates a polarity tag to each word of the Document column.
Now that all words in the posts are tagged as positive or negative, we can proceed with the calculation of the level of attitude for each post and for each user.
Figure 3: Preprocessing of posts and corpus in the KNIME workflow used for text mining
There are two very important nodes in KNIME’s Text Processing category:
- The “BoW creator” node creates a bag of words (BoW) for a set of documents. A BoW
consists of at least two columns: one containing the documents and one containing the
terms occurring in the corresponding post.
- The “TF” node computes the relative term frequency (TF) of each term in each document and
adds a column containing the term frequency value. The term frequency value is computed
by dividing the absolute frequency of a term occurring in a post by the number of all terms of
that post.
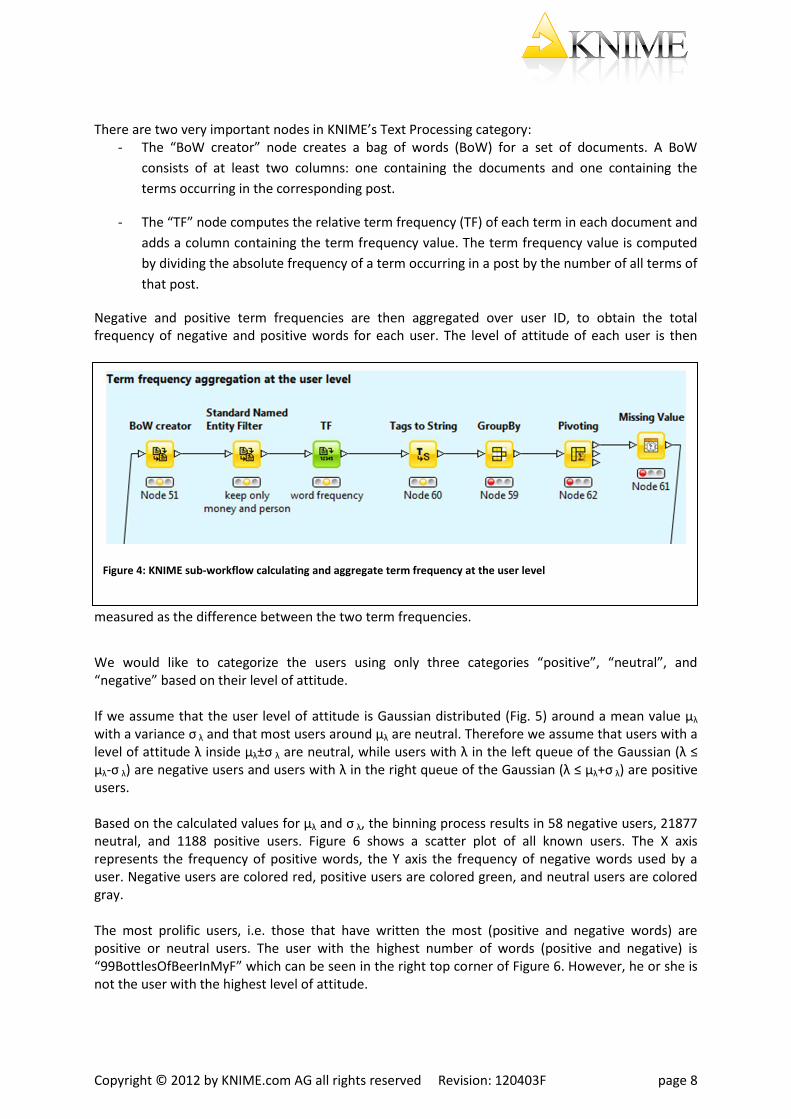
Negative and positive term frequencies are then aggregated over user ID, to obtain the total frequency of negative and positive words for each user. The level of attitude of each user is then
measured as the difference between the two term frequencies.
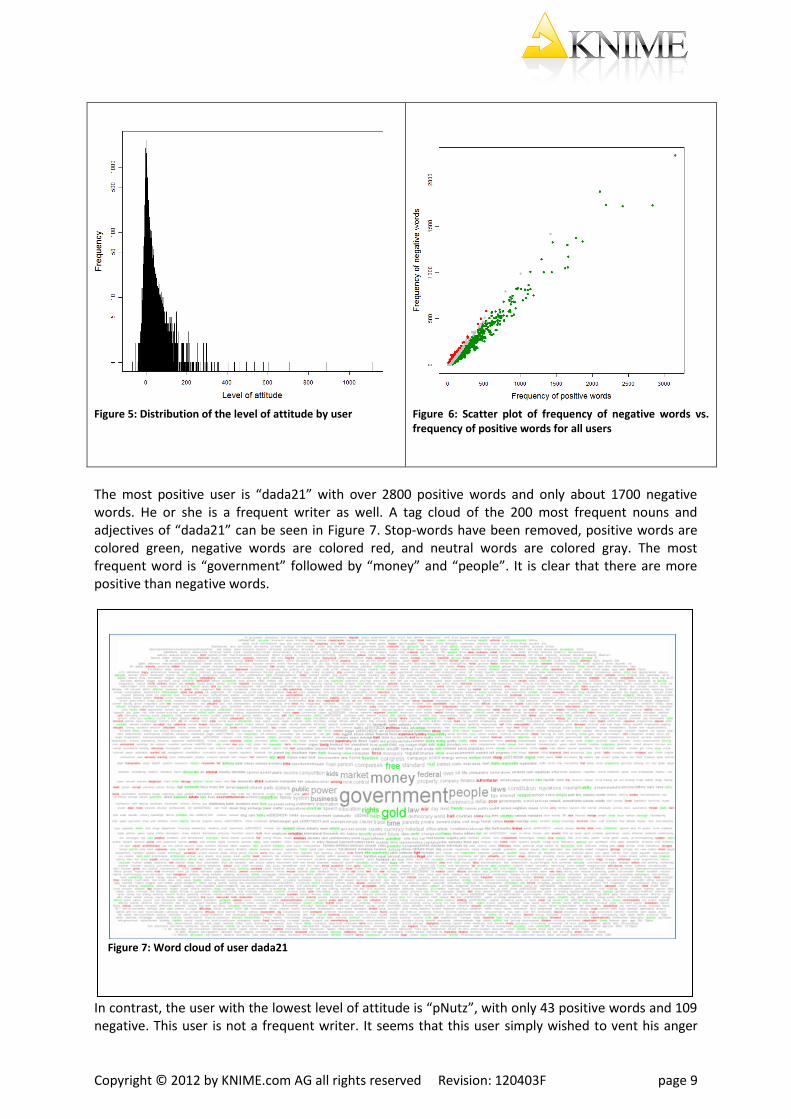
We would like to categorize the users using only three categories “positive”, “neutral”, and “negative” based on their level of attitude. If we assume that the user level of attitude is Gaussian distributed (Fig. 5) around a mean value µλ with a variance σ λ and that most users around µλ are neutral. Therefore we assume that users with a level of attitude λ inside µλ±σ λ are neutral, while users with λ in the left queue of the Gaussian (λ ≤ µλ-σ λ) are negative users and users with λ in the right queue of the Gaussian (λ ≤ µλ+σ λ) are positive users. Based on the calculated values for µλ and σ λ, the binning process results in 58 negative users, 21877 neutral, and 1188 positive users. Figure 6 shows a scatter plot of all known users. The X axis represents the frequency of positive words, the Y axis the frequency of negative words used by a user. Negative users are colored red, positive users are colored green, and neutral users are colored gray. The most prolific users, i.e. those that have written the most (positive and negative words) are positive or neutral users. The user with the highest number of words (positive and negative) is “99BottlesOfBeerInMyF” which can be seen in the right top corner of Figure 6. However, he or she is not the user with the highest level of attitude.
Figure 4: KNIME sub-workflow calculating and aggregate term frequency at the user level
Figure 5: Distribution of the level of attitude by user
Figure 6: Scatter plot of frequency of negative words vs. frequency of positive words for all users
The most positive user is “dada21” with over 2800 positive words and only about 1700 negative words. He or she is a frequent writer as well. A tag cloud of the 200 most frequent nouns and adjectives of “dada21” can be seen in Figure 7. Stop-words have been removed, positive words are colored green, negative words are colored red, and neutral words are colored gray. The most frequent word is “government” followed by “money” and “people”. It is clear that there are more positive than negative words.
In contrast, the user with the lowest level of attitude is “pNutz”, with only 43 positive words and 109 negative. This user is not a frequent writer. It seems that this user simply wished to vent his anger
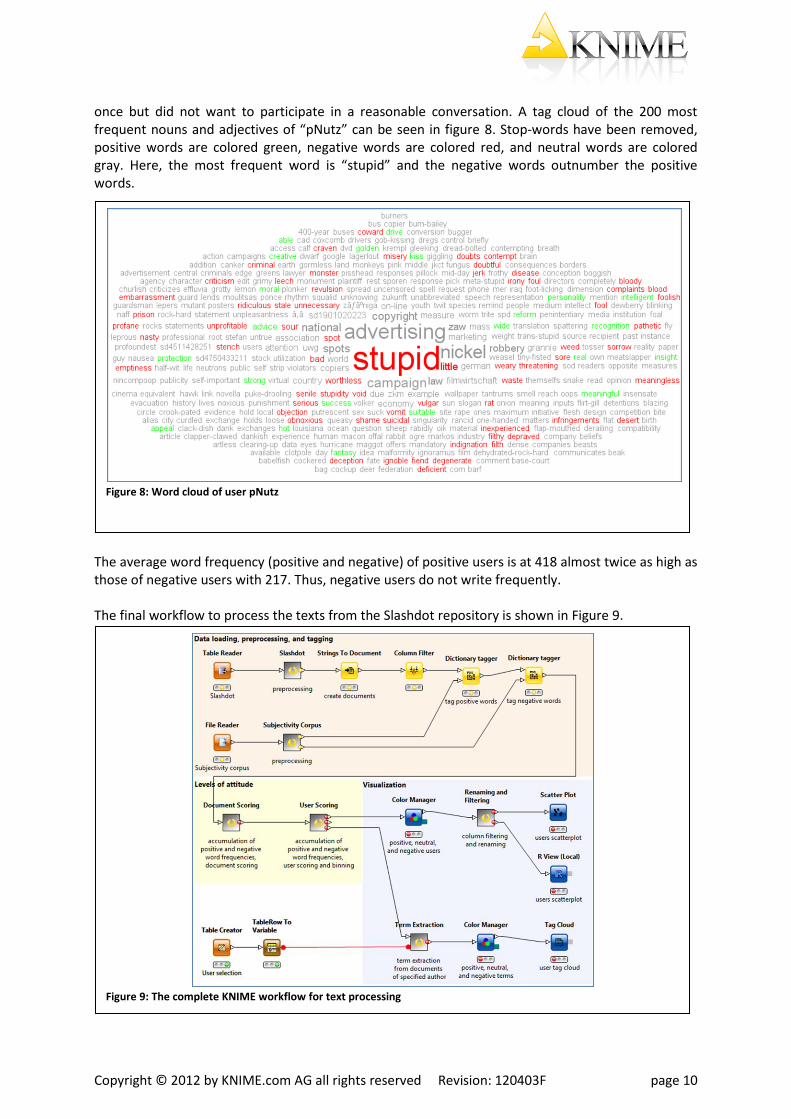
once but did not want to participate in a reasonable conversation. A tag cloud of the 200 most frequent nouns and adjectives of “pNutz” can be seen in figure 8. Stop-words have been removed, positive words are colored green, negative words are colored red, and neutral words are colored gray. Here, the most frequent word is “stupid” and the negative words outnumber the positive words.
The average word frequency (positive and negative) of positive users is at 418 almost twice as high as those of negative users with 217. Thus, negative users do not write frequently. The final workflow to process the texts from the Slashdot repository is shown in Figure 9.
Figure 8: Word cloud of user pNutz
Figure 9: The complete KNIME workflow for text processing
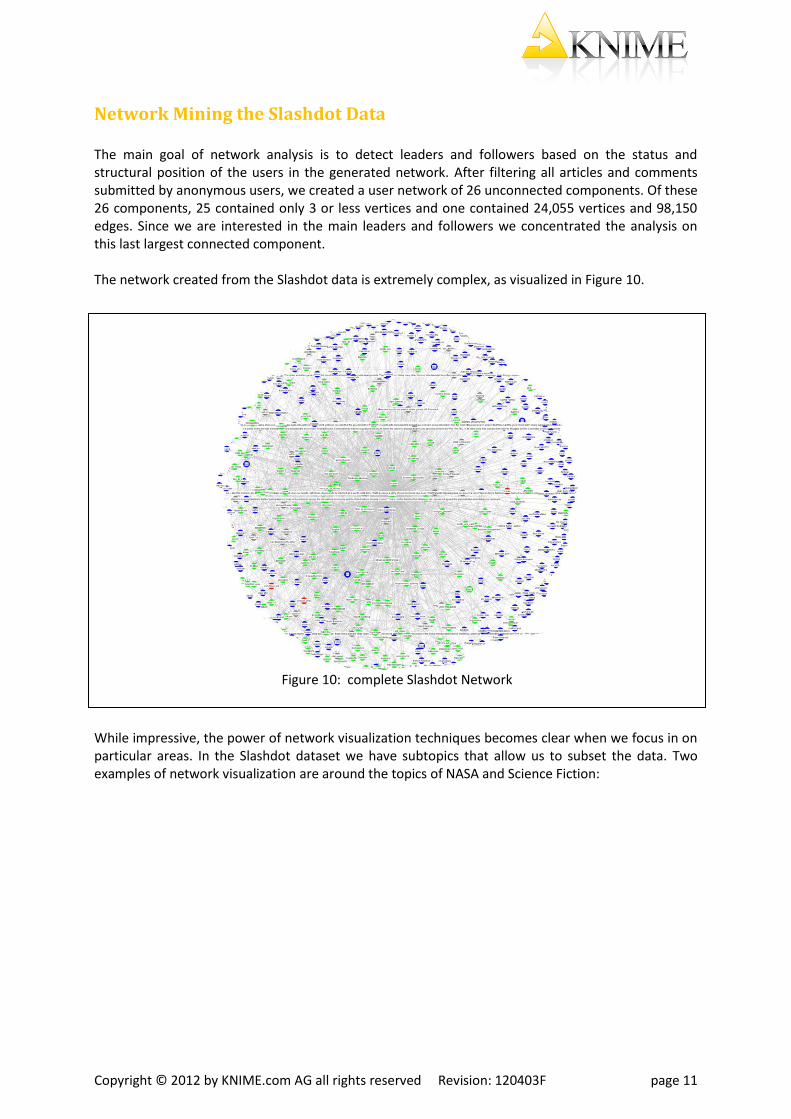
Network Mining the Slashdot Data The main goal of network analysis is to detect leaders and followers based on the status and structural position of the users in the generated network. After filtering all articles and comments submitted by anonymous users, we created a user network of 26 unconnected components. Of these 26 components, 25 contained only 3 or less vertices and one contained 24,055 vertices and 98,150 edges. Since we are interested in the main leaders and followers we concentrated the analysis on this last largest connected component. The network created from the Slashdot data is extremely complex, as visualized in Figure 10.
While impressive, the power of network visualization techniques becomes clear when we focus in on particular areas. In the Slashdot dataset we have subtopics that allow us to subset the data. Two examples of network visualization are around the topics of NASA and Science Fiction:
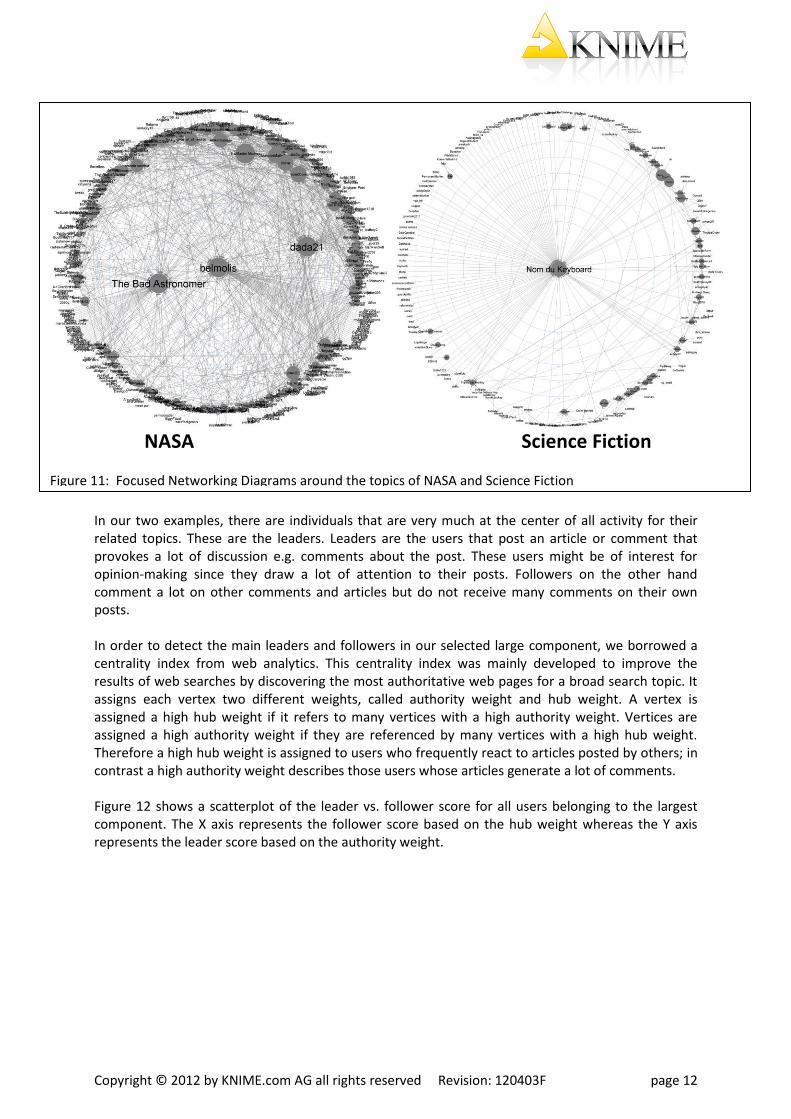
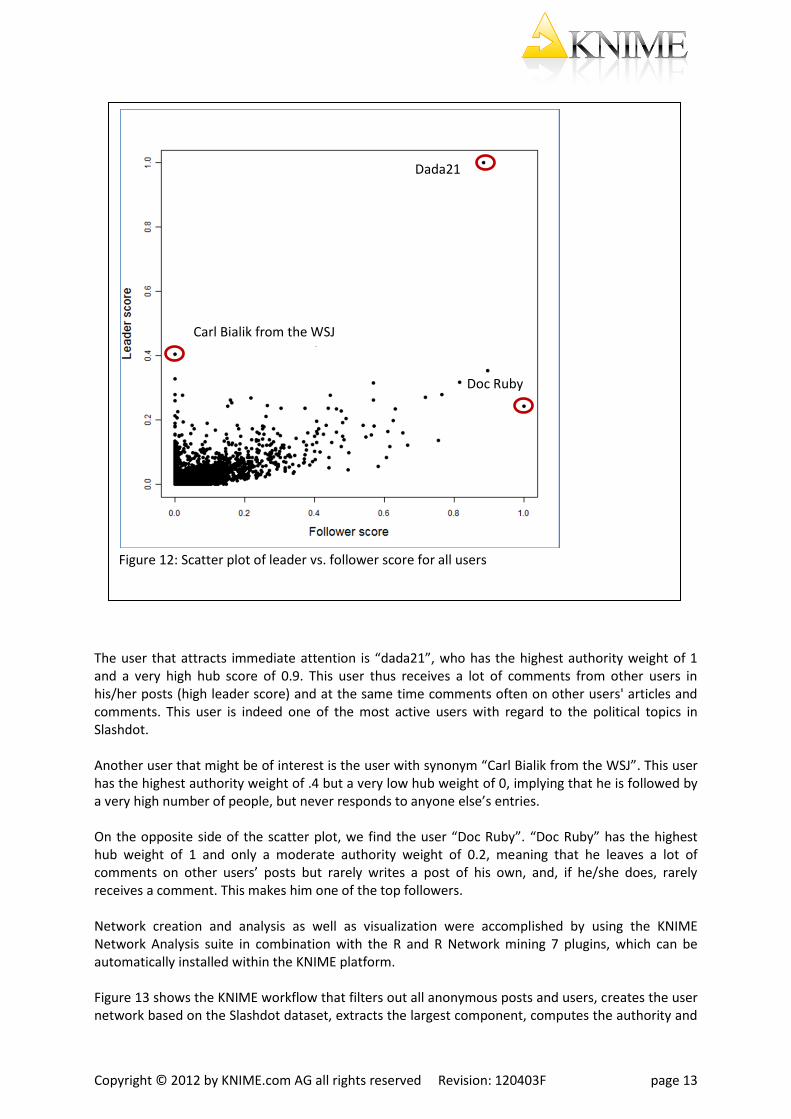
In our two examples, there are individuals that are very much at the center of all activity for their related topics. These are the leaders. Leaders are the users that post an article or comment that provokes a lot of discussion e.g. comments about the post. These users might be of interest for opinion-making since they draw a lot of attention to their posts. Followers on the other hand comment a lot on other comments and articles but do not receive many comments on their own posts. In order to detect the main leaders and followers in our selected large component, we borrowed a centrality index from web analytics. This centrality index was mainly developed to improve the results of web searches by discovering the most authoritative web pages for a broad search topic. It assigns each vertex two different weights, called authority weight and hub weight. A vertex is assigned a high hub weight if it refers to many vertices with a high authority weight. Vertices are assigned a high authority weight if they are referenced by many vertices with a high hub weight. Therefore a high hub weight is assigned to users who frequently react to articles posted by others; in contrast a high authority weight describes those users whose articles generate a lot of comments. Figure 12 shows a scatterplot of the leader vs. follower score for all users belonging to the largest component. The X axis represents the follower score based on the hub weight whereas the Y axis represents the leader score based on the authority weight.
NASA Science Fiction Figure 11: Focused Networking Diagrams around the topics of NASA and Science Fiction
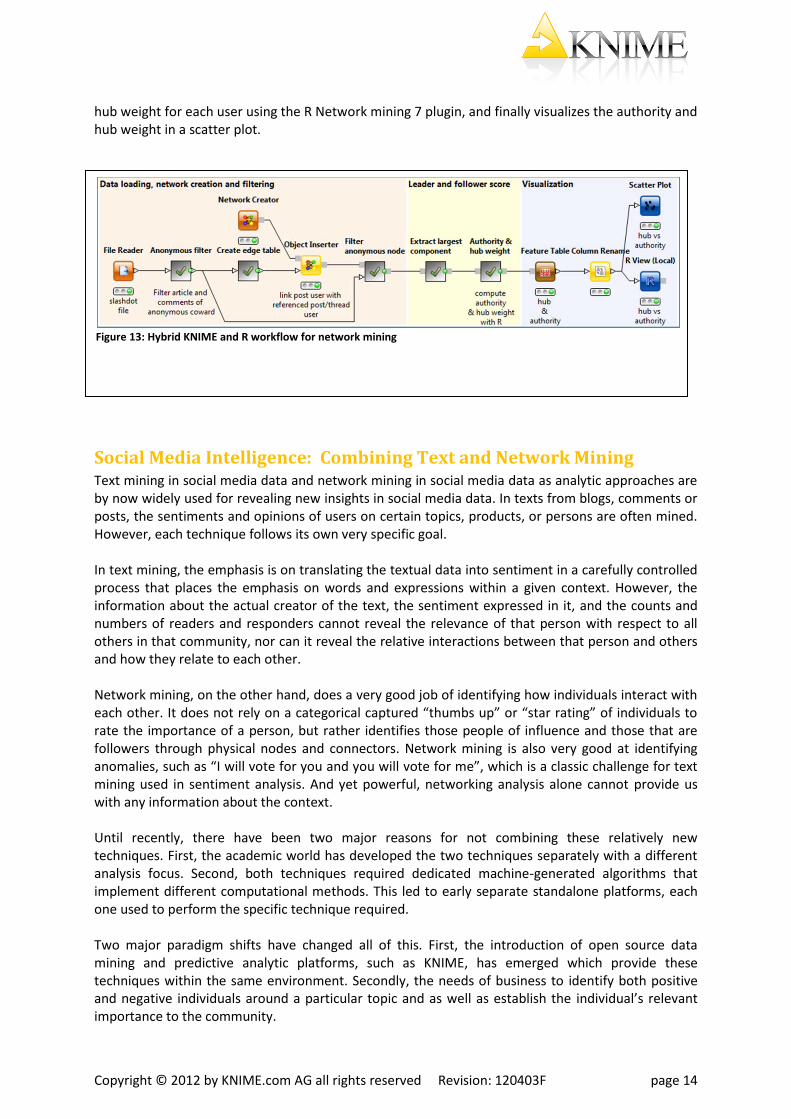
The user that attracts immediate attention is “dada21”, who has the highest authority weight of 1 and a very high hub score of 0.9. This user thus receives a lot of comments from other users in his/her posts (high leader score) and at the same time comments often on other users' articles and comments. This user is indeed one of the most active users with regard to the political topics in Slashdot. Another user that might be of interest is the user with synonym “Carl Bialik from the WSJ”. This user has the highest authority weight of .4 but a very low hub weight of 0, implying that he is followed by a very high number of people, but never responds to anyone else’s entries. On the opposite side of the scatter plot, we find the user “Doc Ruby”. “Doc Ruby” has the highest hub weight of 1 and only a moderate authority weight of 0.2, meaning that he leaves a lot of comments on other users’ posts but rarely writes a post of his own, and, if he/she does, rarely receives a comment. This makes him one of the top followers. Network creation and analysis as well as visualization were accomplished by using the KNIME Network Analysis suite in combination with the R and R Network mining 7 plugins, which can be automatically installed within the KNIME platform. Figure 13 shows the KNIME workflow that filters out all anonymous posts and users, creates the user network based on the Slashdot dataset, extracts the largest component, computes the authority and
Figure 12: Scatter plot of leader vs. follower score for all users
hub weight for each user using the R Network mining 7 plugin, and finally visualizes the authority and hub weight in a scatter plot.
Social Media Intelligence: Combining Text and Network Mining Text mining in social media data and network mining in social media data as analytic approaches are by now widely used for revealing new insights in social media data. In texts from blogs, comments or posts, the sentiments and opinions of users on certain topics, products, or persons are often mined. However, each technique follows its own very specific goal. In text mining, the emphasis is on translating the textual data into sentiment in a carefully controlled process that places the emphasis on words and expressions within a given context. However, the information about the actual creator of the text, the sentiment expressed in it, and the counts and numbers of readers and responders cannot reveal the relevance of that person with respect to all others in that community, nor can it reveal the relative interactions between that person and others and how they relate to each other. Network mining, on the other hand, does a very good job of identifying how individuals interact with each other. It does not rely on a categorical captured “thumbs up” or “star rating” of individuals to rate the importance of a person, but rather identifies those people of influence and those that are followers through physical nodes and connectors. Network mining is also very good at identifying anomalies, such as “I will vote for you and you will vote for me”, which is a classic challenge for text mining used in sentiment analysis. And yet powerful, networking analysis alone cannot provide us with any information about the context. Until recently, there have been two major reasons for not combining these relatively new techniques. First, the academic world has developed the two techniques separately with a different analysis focus. Second, both techniques required dedicated machine-generated algorithms that implement different computational methods. This led to early separate standalone platforms, each one used to perform the specific technique required. Two major paradigm shifts have changed all of this. First, the introduction of open source data mining and predictive analytic platforms, such as KNIME, has emerged which provide these techniques within the same environment. Secondly, the needs of business to identify both positive and negative individuals around a particular topic and as well as establish the individual’s relevant importance to the community.
Figure 13: Hybrid KNIME and R workflow for network mining
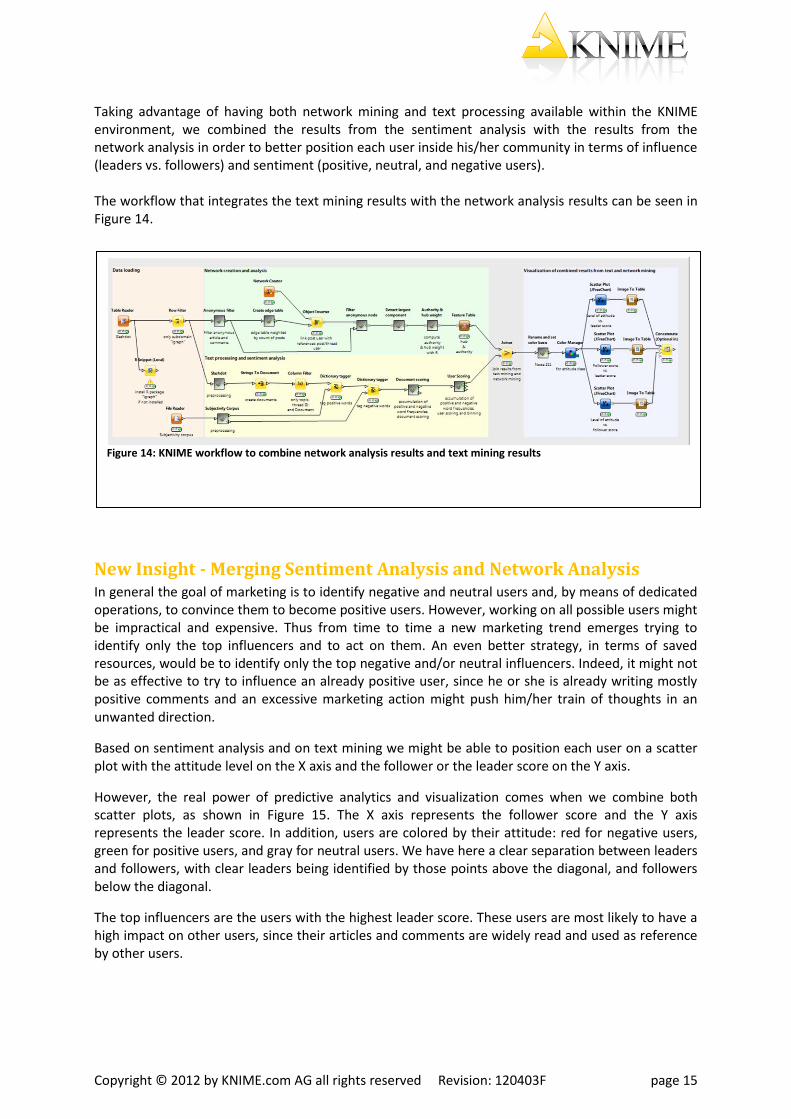
Taking advantage of having both network mining and text processing available within the KNIME environment, we combined the results from the sentiment analysis with the results from the network analysis in order to better position each user inside his/her community in terms of influence (leaders vs. followers) and sentiment (positive, neutral, and negative users). The workflow that integrates the text mining results with the network analysis results can be seen in Figure 14.
New Insight - Merging Sentiment Analysis and Network Analysis In general the goal of marketing is to identify negative and neutral users and, by means of dedicated operations, to convince them to become positive users. However, working on all possible users might be impractical and expensive. Thus from time to time a new marketing trend emerges trying to identify only the top influencers and to act on them. An even better strategy, in terms of saved resources, would be to identify only the top negative and/or neutral influencers. Indeed, it might not be as effective to try to influence an already positive user, since he or she is already writing mostly positive comments and an excessive marketing action might push him/her train of thoughts in an unwanted direction.
Based on sentiment analysis and on text mining we might be able to position each user on a scatter plot with the attitude level on the X axis and the follower or the leader score on the Y axis.
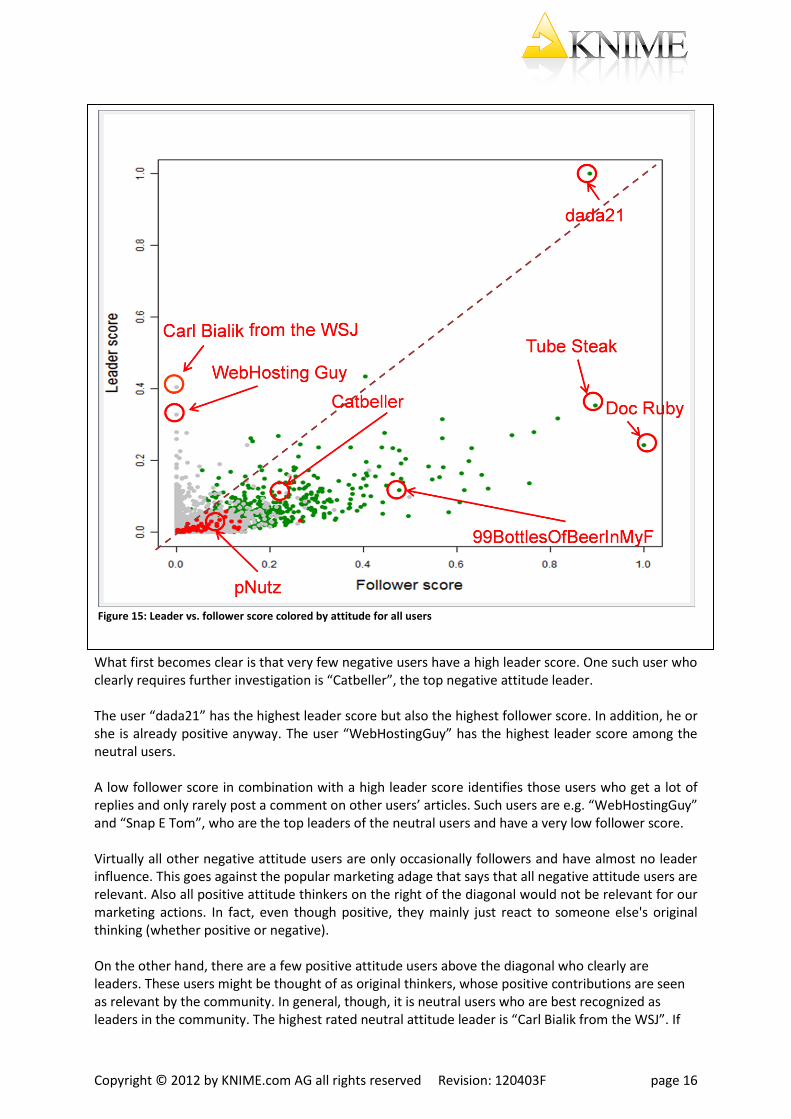
However, the real power of predictive analytics and visualization comes when we combine both scatter plots, as shown in Figure 15. The X axis represents the follower score and the Y axis represents the leader score. In addition, users are colored by their attitude: red for negative users, green for positive users, and gray for neutral users. We have here a clear separation between leaders and followers, with clear leaders being identified by those points above the diagonal, and followers below the diagonal.
The top influencers are the users with the highest leader score. These users are most likely to have a high impact on other users, since their articles and comments are widely read and used as reference by other users.
Figure 14: KNIME workflow to combine network analysis results and text mining results
What first becomes clear is that very few negative users have a high leader score. One such user who clearly requires further investigation is “Catbeller”, the top negative attitude leader. The user “dada21” has the highest leader score but also the highest follower score. In addition, he or she is already positive anyway. The user “WebHostingGuy” has the highest leader score among the neutral users. A low follower score in combination with a high leader score identifies those users who get a lot of replies and only rarely post a comment on other users’ articles. Such users are e.g. “WebHostingGuy” and “Snap E Tom”, who are the top leaders of the neutral users and have a very low follower score. Virtually all other negative attitude users are only occasionally followers and have almost no leader influence. This goes against the popular marketing adage that says that all negative attitude users are relevant. Also all positive attitude thinkers on the right of the diagonal would not be relevant for our marketing actions. In fact, even though positive, they mainly just react to someone else's original thinking (whether positive or negative). On the other hand, there are a few positive attitude users above the diagonal who clearly are leaders. These users might be thought of as original thinkers, whose positive contributions are seen as relevant by the community. In general, though, it is neutral users who are best recognized as leaders in the community. The highest rated neutral attitude leader is “Carl Bialik from the WSJ”. If
Figure 15: Leader vs. follower score colored by attitude for all users
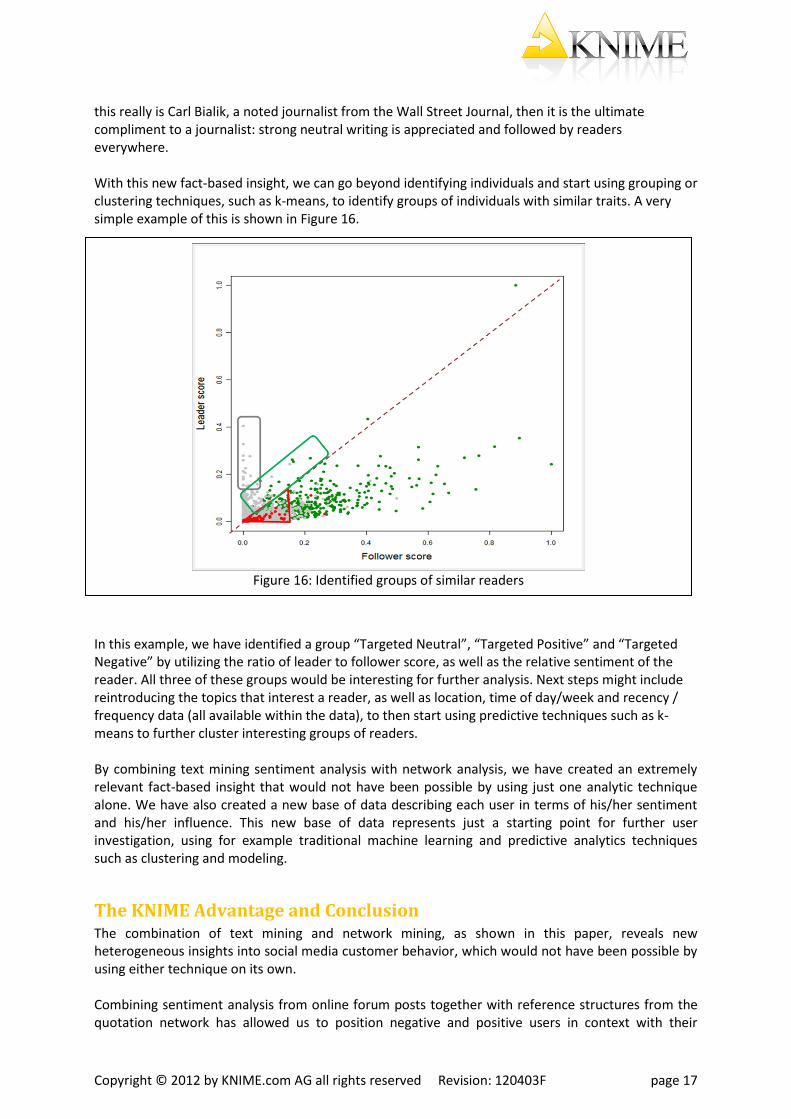
this really is Carl Bialik, a noted journalist from the Wall Street Journal, then it is the ultimate compliment to a journalist: strong neutral writing is appreciated and followed by readers everywhere. With this new fact-based insight, we can go beyond identifying individuals and start using grouping or clustering techniques, such as k-means, to identify groups of individuals with similar traits. A very simple example of this is shown in Figure 16.
In this example, we have identified a group “Targeted Neutral”, “Targeted Positive” and “Targeted Negative” by utilizing the ratio of leader to follower score, as well as the relative sentiment of the reader. All three of these groups would be interesting for further analysis. Next steps might include reintroducing the topics that interest a reader, as well as location, time of day/week and recency / frequency data (all available within the data), to then start using predictive techniques such as k-means to further cluster interesting groups of readers. By combining text mining sentiment analysis with network analysis, we have created an extremely relevant fact-based insight that would not have been possible by using just one analytic technique alone. We have also created a new base of data describing each user in terms of his/her sentiment and his/her influence. This new base of data represents just a starting point for further user investigation, using for example traditional machine learning and predictive analytics techniques such as clustering and modeling.
The KNIME Advantage and Conclusion The combination of text mining and network mining, as shown in this paper, reveals new heterogeneous insights into social media customer behavior, which would not have been possible by using either technique on its own. Combining sentiment analysis from online forum posts together with reference structures from the quotation network has allowed us to position negative and positive users in context with their
relative weight as influencers or followers in the underlying discussion forum. Although originally performed for a major European Telco and repeated here using publicly available data, this study has a strong relevance for other industries as well, as long as they can access information containing both text and networking relationship data. This approach can also be enhanced by including additional relevant data sources regarding particular focus areas, such as company and product names, political parties, known users of products, and so on. The additional data would further enhance the method capability of identifying, segmenting and drilling down to interesting user groups. This technique introduces additional features into the user data, to improve the process of analytic investigation as popularized by the CRISP (Cross Industry Standard Process) methodology. This new fact-based insight provides a foundation for applying other types of investigative analytic, segmentation, predictive, and machine learning techniques. The ability to group individuals into clearly defined social media segments has of course a strong relevance for all companies that already use data mining and customer intelligence techniques within their organization. In fact, a good understanding of the social media segments can provide an invaluable contribution on the decision about how to invest and shape the company’s social media and marketing strategies. In conclusion, we see this technique as a basis for further data exploration. By using the KNIME platform, which allows not only traditional data mining, predictive analytics and machine learning, but also text mining and network analysis, we have been able to quickly and effectively create this new insight with a minimum of delay. Final Note: We used KNIME open source software and publicly available data sources, therefore the complete workflows that also include the data can be freely downloaded from www.knime.com.


![The Slashdot Zoo: Mining a Social Network with Negative Edges · Learning; H.4.0 [Information Systems Applications]: General General Terms Experimentation, Theory Keywords Social](https://static.documents.pub/doc/80x56/5f04b5207e708231d40f4e70/the-slashdot-zoo-mining-a-social-network-with-negative-edges-learning-h40-information.jpg)


