nt Review 28 (2008) 455–468www.elsevier.com/locate/eiar
Environmental Impact Assessme
Network and system diagrams revisited: Satisfying CEArequirements for causality analysis
Anastássios Perdicoúlis a,b,⁎, Jake Piper c
a University of Trás-os-Montes e Alto Douro, 5001-801 Vila Real, Portugalb Oxford Institute for Sustainable Development, Oxford Brookes University, Oxford, UK
c Oxford Institute for Sustainable Development, Oxford Brookes University, Headington Campus, Gipsy, Lane, Oxford OX3 0BP, UK
Received 5 June 2007; received in revised form 25 July 2007; accepted 13 August 2007
The identification of causality, or cause-and-effectrelationships, is strongly advocated in the CumulativeEffects Assessment (CEA) literature, and is explicitlyidentified in key CEA guidance documents as a currentneed (CEQ, 1997; Hegmann et al., 1999; Hyder, 1999).Causality has also been recognised as an important issue
⁎ Corresponding author. University of Trás-os-Montes e Alto Douro,5001-801 Vila Real, Portugal. Tel.: +351 259 372 627; fax: +351 259350 480.
in earlier literature in the wider impact assessment field(Canter, 1996; Wathern, 1998). Moreover, causality isidentified as a fundamental premise of impact assess-ment, as it relates to the way impacts arise from thedevelopment action (Perdicoulis et al., 2007).
Despite the apparent importance of causality, there isvery little practice or theoretical guidance onmethods fordealing with it in impact assessment, including CEA(Perdicoúlis and Glasson, 2006; Perdicoúlis et al., 2007).This may be due to limited understanding of cause-and-effect relationships and the workings of key linkages andinteractions within systems (Hegmann et al., 1999), orother reasons that may be case-specific (Perdicoúlis andGlasson, 2006).
1 Note: There is no widely accepted definition distinguishingbetween impacts and effects; in this article both terms are used.2 Note: The case of CEA in Strategic Environmental Assessment
(SEA) is not addressed in this article, though the proposed methodmay also have relevance there.
456 A. Perdicoúlis, J. Piper / Environmental Impact Assessment Review 28 (2008) 455–468
This article aims to contribute to CEA by proposing amethod which (a) assists in establishing causality, i.e.linking effects to causes in a transparent way, to satisfythe needs of CEA in that respect, and (b) assists EISreaders and others learning about a project by providinga set of diagrams which may be more explicit and easierto grasp than text.
The article identifies the special requirements of CEAregarding causality in the key literature, including thedefinitions of cumulative effects (Section 2). To respond tothese requirements, the article starts by revisiting networkand system diagrams that are known to be appropriate forcausality analysis, suggests amendments to meet reportedshortcomings, adds methodological features from othermethods and defines a resulting “composite” method forcausality analysis and representation (Section 3). Thismethod is then applied to three selected EIS case studies(Section 4). Finally, the article evaluates the performanceof the applied composite method against the specificrequirements of CEA (Section 5).
2. Background
2.1. Definitions
In its guidance, the US Council on EnvironmentalQuality (CEQ) defines cumulative impacts as follows:“Cumulative impact is the impact on the environmentwhich results from the incremental impact of the actionwhen added to other past, present, and reasonably fore-seeable future actions regardless of what agency […] orperson undertakes such other actions. Cumulative im-pacts can result from individually minor but collectivelysignificant actions taking place over a period of time.”(CEQ, 1997, p.1). Ross defines cumulative effects moresimply as “The effects of the project under review incombination with the effects of other past, present orfuture human activities” (Ross, 1998, p.267).
Other authors have touched upon causality — forexample Canter (1999, p.406) identifies three themes inCEA. He suggests that cumulative effects may arisefrom (a) multiple actions giving rise to impact-causingactivities; (b) multiple pathways/linkages betweensources and receptors of impacts (air, water, humanfeet). Moreover, impacts may be: additive, synergistic,or may act to offset other impacts— i.e. antagonistic, oralso called “countervailing” impacts (Canter, 1999).
2.2. The need for CEA
CEA addresses the complex interactions that may beobserved as a result of development projects: interac-
tions between projects, interactions between effect types(e.g. noise, lighting), interactions between sites andresources, or interactions between pathways of effects.1
The concept of cumulative effects has been integral toEIA since the origins of the practice in the USANationalEnvironmental Protection Act (NEPA) of 1969. TheCouncil on Environmental Quality (CEQ) has suggestedthat “… cumulative effects analysis is essential toeffectively managing the consequences of humanactivities on the environment”, without which “it willbe impossible to move towards sustainable develop-ment” (CEQ, 1997, p.2). Appropriate methods for CEAhave been developed over the years: important earlysources on cumulative effects assessment (also known ascumulative impacts analysis in some US sources)include Beanlands and Duinker (1983), Peterson et al.(1987), and Bedford and Preston (1988). Three manualswith practical guidance were published in the late 1990s:CEQ (1997) for the USA, Hegmann et al. (1999) forCanada, and Hyder (1999) for the EU.
CEQ (1997) states that:
“Although the regulations [of the NEPA, 1969] touch onevery aspect of environmental impact analysis, verylittle has been said about cumulative effects. As a result,federal agencies have independently developed proce-dures and methods to analyze the cumulative effects oftheir actions on environmental resources, with mixedresults.” (CEQ, 1997, p.v.)
Whereas the NEPA called for the assessment of direct,indirect and cumulative effects, within the EU, theoriginal Directive on EIA (85/337/EEC) requires assess-ment of: “the direct effects and any indirect, secondary,cumulative, short, medium and long-term permanent ortemporary, positive and negative effects of the project”(EC, 1985, Annex III, 7(1)). Subsequently the amendingDirective 97/11/EC on EIA establishes that selection cri-teria for projects to be assessed include: “the cumulationwith other projects” (EC, 1997, Annex III, 1) and “theexisting land use” (EC, 1997, Annex III, 2), thus requiringthe assessment of past effects with current effects.
2.3. Circumstances in which CEA is carried out
This article is concerned with project EIA,2 where cu-mulative effects may be identified either (a) in connection
with a number of projects within a local or defined areahaving potential to affect a set of resources/receptors, or (b)where a linear project affects resources/receptors along itsroute.
The complexity of CEA derives from the fact that (a)many different project types may be developed at a site;(b) the affected area may be wide and may be discon-tinuous; and (c) there may be several competent author-ities with different areas of responsibility and interest, orthe work may be carried out under different statutes orregulations — for example, where projects of differenttypes cluster together at a site (Piper, 2000, 2001a,b).
Consequently, a task for the cumulative effectsassessor is to reduce the complexity to a form whichcan be readily appraised by stakeholders, reviewers andauthorities involved in the impact assessment process—providing a route to an understanding of the interactivesystem and, if possible, also providing a means ofweighing and comparing the various factors at work.Whilst clear textual description of effects should alwaysbe provided by assessors, this is not always easilyconstrued by all readers and those participating instakeholder events.
A concept which has emerged in CEA, that of valuedecosystem component (VEC), helps to focus assessmentwork and reduce complexity. The VEC concept, des-cribed by Ross (1998), is recommended by the CanadianPractitioners Guide (Hegmann et al., 1999). Theapproach proposes that specific, representative compo-nents of an ecosystem should be selected and used as thebasis for a CEA study, setting aside other effect re-ceptors. The VECs selected may be, for example, aprotected species, a designated landscape, breeding/spawning, feeding or nesting habitats of individualspecies, or protected habitats. Human communities or,for instance, soils may also be the VEC chosen for aparticular case. A study for the Countryside Commis-sion for Wales (CCW, 2002), developing a methodologyfor CEA and investigating cumulative effects of marineactivities in Liverpool Bay, UK, used duck feedinghabitat, plaice spawning grounds and offshore seascapesas VECs.
2.4. Causality in CEA
All three major sources for guidelines on methods forCEA (CEQ, 1997; Hegmann et al., 1999; Hyder, 1999)emphasise that it is essential to identify the relationshipsbetween causes and effects. For example, CEQ specifies aprocess of eleven steps, of which step 8 — in the EIAcomponent “Determining the environmental conse-quences”— is to “identify the important cause and effect
relationships between human activities and resources,ecosystems and human communities” (CEQ, 1997, p.10).
Any impact assessment should (a) “see into thefuture”, predicting actions, interactions, etc., (b) besystematic and formalised, (c) assemble information onbaselines and impacts, (d) appraise information onimpacts, (e) appraise alternatives, (f) present informa-tion, and (g) provide audit potential/transparency (seeSadler (1996, passim.)). Causality is particularlyimportant to some of the above requirements, such asthe need to be systematic and formalised, to presentinformation appropriately, and to provide transparency.To serve CEA in the above aspects, a causality analysismethod must have its own combination of character-istics. Several authors have discussed essential anddesirable characteristics for methods of CEA — e.g.Smit and Spaling (1995, p.86), Dixon and Montz (1995,p.451), CEQ (1997, p.55), and Canter (1999, p.415).
From the above literature, we consider the essentialcharacteristics of a causality analysis (CA) method forCEA purposes to be: (a) represent interactions, direc-tionality, multiple actions, (b) permit comparison ofalternatives, (c) identify significance of cumulativeeffects, feedback loops, underlying causes, and (d) berobust, widely applicable and flexible, and transparentand systematic in scoping. We suggest that the desirablecharacteristics of a CA method for CEA purposes are to(a) represent time, space, and impact magnitude, (b) haveevaluation capacity and “reasonable” data requirement,and (c) be easy to use, to learn to use, and to interpret, andbe transferable between levels (EIA–SEA). Finally,characteristics of a CA method for CEA purposes whichwould be also welcome are (a) to be compatible withother tools and methods, and (b) to identify mitigation/compensation opportunities. These three types ofcharacteristics (essential, desirable, and also welcome)are used below in Table 1 to evaluate the method pro-posed in this article.
3. Methodology
3.1. Existing CA methods in CEA
Several causality analysis methods exist globally,employing graphical or non-graphical means of expres-sion. Although they do not all have the same analyticalvalue, and some designations may overlap conceptually(e.g. a digraph is a kind of diagram), the following typesare identified: text, matrices, digraphs, cause-and-effectdiagrams, flow diagrams, tree diagrams, data mining,fuzzy logic, causal-loop-diagrams, stock-and-flow dia-grams, mathematical models, and geographic information
458 A. Perdicoúlis, J. Piper / Environmental Impact Assessment Review 28 (2008) 455–468
systems (CEQ, 1997; Hyder, 1999; Perdicoulis andGlasson, 2006).
Cooper and Canter reviewed practice in 1997, toidentify which CEA methods were commonly used byEIA professionals in the USA. Although the sampleresponse is rather poor, it is evident that causal networkanalysis had made little headway at that point. Pro-fessional knowledge/expert judgement was the mostcommonly used method, followed by checklists andimpact evaluation models. Elsewhere, GIS has beenidentified as a particularly promising method for CEA(CCW, 2002).
A number of authors have highlighted the use of someform of causal network analysis as particularly suited forcausality analysis. Both CEQ (1997) and Hegmann et al.(1999) list this approach under the methods discussed.Smit and Spaling (1995) compare a set of ten methods,including “cause–effect diagramming”. Sporbeck(1997), quoted by Hyder (1999), discusses “impactinteraction networks”. Despite the theoretical sugges-tions, recent studies have found that causality analysis isnot widespread in impact assessment practice (Perdi-coulis and Glasson, 2006; Perdicoúlis et al., 2007; Woodet al., 2006), supporting the findings of Cooper andCanter (1997).
3.2. Components in an appropriate CA method
CEQ (1997, p.56) reports that networks and systemdiagrams are an “excellent method for the cause-and-effect relationships resulting in cumulative effects”.Both CEQ (1997) and Hyder (1999) credit this group ofmethods for addressing cause-and-effect relationshipsexplicitly, facilitating conceptualisation and the under-standing of impacts, and identifying indirect effects. Themain difficulties reported, namely the addressing ofspace and time dimensions and the potential complexityof the diagrams, still remain to be resolved.
Regarding cause-and-effect pathways, Spaling(1994, p.232) identifies two types in the CEA context:(a) linkages which illustrate cause-and-effect relation-ships and link from sources to impacts via explicitpathways, whilst (b) feedback mechanisms link (someor all of) these components in a reverse direction.
More resolution about these pathways is sought inthe definitions of cumulative effects from the key CEAliterature, about what the CA method should contain orhighlight. Keywords such as “incremental” (CEQ, 1997;Hyder, 1999), “combination” (Ross, 1998), “pathways”(Canter, 1999; Spaling, 1994), “linkages” (Canter, 1999;Spaling, 1994), “cause-and-effect relationships” (Spal-ing, 1994), and “feedback mechanisms” (Spaling,
1994), refer to different types of sequences of eventsor cause-and-effect pathways. In the simplest case,“pathways”, “linkages” and “cause-and-effect relation-ships” suggest linear sequences, of the type A→B.“Combination” (e.g. A+B→C) and “incremental” (e.g.A1 +A2 +…→Atotal) suggest branching pathways (withconfluence, in the given examples). Finally, “feedbackmechanisms” concerns information about closed loops,which indicate circular sequences. The combination ofthe special characteristics of cumulative effects and howthey may be best represented are taken to guide acomposite visually-oriented analysis and representationtechnique employing interaction networks or systemdiagrams that, together with the conventions of itsapplication, will constitute an appropriate method forcausality analysis in CEA. It is the purpose of this articleto devise this method and test it, not by the classic “nullhypothesis” scientific paradigm, appropriate to “puresciences”, but using an approach more like “test-driving”, better suited to “applied sciences” (Schrolland Stærdahl, 2001).
3.3. The proposed “composite” method
The article proposes network and system diagrams asa working base, due to their acknowledged suitabilityfor the purpose. We suggest certain amendments to meettheir reported shortcomings, mainly (a) addressing timeand space dimensions, and (b) controlling the complex-ity of the diagrams. Then, the article “fine tunes” themethod for the special requirements of CEA (Section2.4). Thus, a composite method for causality analysisemerges, especially developed for use in CEA.
The proposed conventions of the composite CAmethod for CEAwhich follow are compiled from similarmethods from varied literature: mathematics/graph theory(Gentil and Montmain, 2004; Harary, 1969; Rosen,2003), impact assessment, (Canter, 1996; Glasson et al.,2005; Wathern, 1998), and system dynamics/systemsthinking (Open University, 2000; Sterman, 2000). Theseconventions are kept simple so that the resulting graphicstructures (also known as networks, diagrams, digraphs,CLDs, etc.) are easy to draw, communicate, and interpret.The conventions of the composite CA method areorganised, presented, and commented below. Fig. 1illustrates the first four conventions, regarding elements,action, causality, and impacts, in a simple graphicstructure.
3.3.1. ElementsThe elements of the environmental system to be
represented (e.g. humans, land, dust), are indicated as
Fig. 1. Illustration of a generic low-aggregation (high-detail) causal digraph modified for impact assessment purposes, demonstrating its components.
3 This could be the case in Fig. 6, if sufficient information wereavailable to identify the loop as reinforcing.
text— e.g. Fig. 1. Additional graphical aids can be usedto highlight the elements, such as shapes to contain thetext (e.g. circles, rectangles), as well as colour orimages, such as photographs or logotypes. Systemelements can be active (e.g. element A in Fig. 1) orpassive (e.g. element B in Fig. 1).
3.3.2. ActionAction usually occurs relatively early (“upstream”) in
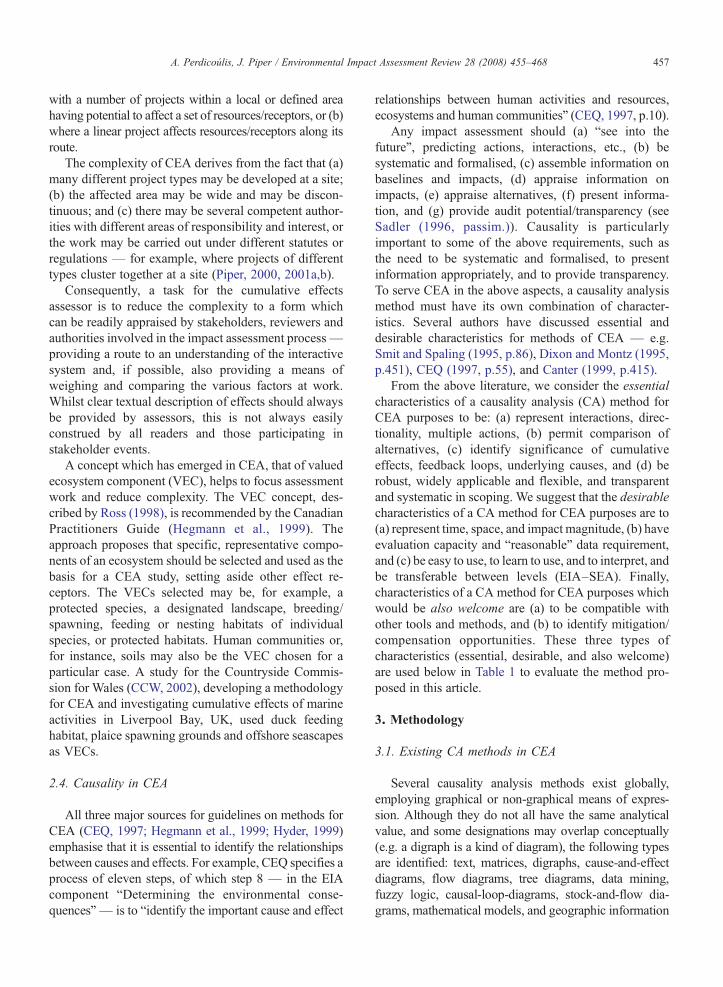
a sequence of events, or pathway. The effects of anaction are always “downstream” (i.e. occurring later inthe sequence). Any action associated with an elementmust be marked within that element, typically using averb (e.g. construct) or the corresponding noun (e.g.construction). Passive elements can still cause effects“downstream” due to changes they have suffered (i.e.induced changes) — e.g. Fig. 2.
3.3.3. CausalityCause-and-effect relationships are always considered
in pairs of system elements. Combinations of many suchpairs constitute pathways (in a linear sense) or networks(i.e. inter-connected pathways). Causality between twosystem elements is uni-directional (from cause to effect),and thus marked by a uni-directional arrow. The arrow isattached from the “upstream” element causing the actionor which has been induced to change, to the “down-stream” element manifesting the effect.
3.3.4. ImpactsEffects or impacts are changes shown next to the
“downstream” element, by the end of the causalityarrow — e.g. Figs. 1 and 2. To avoid mistakes, impactscannot be marked inside the “downstream” elements, asthis is reserved for actions— see Action, above. Impactsmay have a short or a long description, such as text, spacemap, time graph, or symbol for probability, recurrence,importance, etc. Two types of impacts are identified: (a)likely impacts,marked by text (e.g. decrease) or respective
abbreviations (e.g. “D”), and (b) relative impacts, markedby symbols such as “+/−”. Impact assessment is typicallyinterested in the likely impacts. However, relative impactsprovide structural information (i.e. types of relationships)about the pairs of system elements— for instance: the pair“increase in traffic→ increase in noise level” denotes a “+”type of relationship because the direction of change (i.e.increase) is maintained. Conversely, when the direction ofthe change in a pair is inverted, this relationship is markedas “−”. Structural information need not be presented in thefinal diagrams, but is indispensable in (a) the reasoning fordetermining the likely impacts, and (b) the identification offeedback loops — see Feedback, below.
3.3.5. FeedbackClosed, uni-directional loops in the graphical structure
indicate feedback— e.g. Fig. 6(a). If enough informationis available, then feedback loops can be also labelledaccording to their type: (a) positive, or reinforcing,typically marked as or , which tend to lead the parti-cular loop towards extreme behaviours, such as “explo-sions” or “extinctions”, and (b) negative, or balancing,typically marked as or , which tend to stabilise theparticular loop (although not necessarily the wholesystem). Feedback information is typically not of directinterest to impact assessment, but indispensable for (a)determining behaviour of the elements involved in theloops, and (b) identifying effective mitigations (e.g. forbreaking reinforcing loops).3
3.3.6. Aggregation levelsThe utilisation of different aggregation levels permits
the analysis to adjust to the perception and representationneeds of the projects, impact topics, and specific impacts.Aggregation levels help to keep the graphic structures atthe appropriate level of detail and, consequently, simple.
Fig. 2. Perception of the more complicated impacts, and representation in terms of causal digraphs; adapted from Hyder (1999).
460 A. Perdicoúlis, J. Piper / Environmental Impact Assessment Review 28 (2008) 455–468
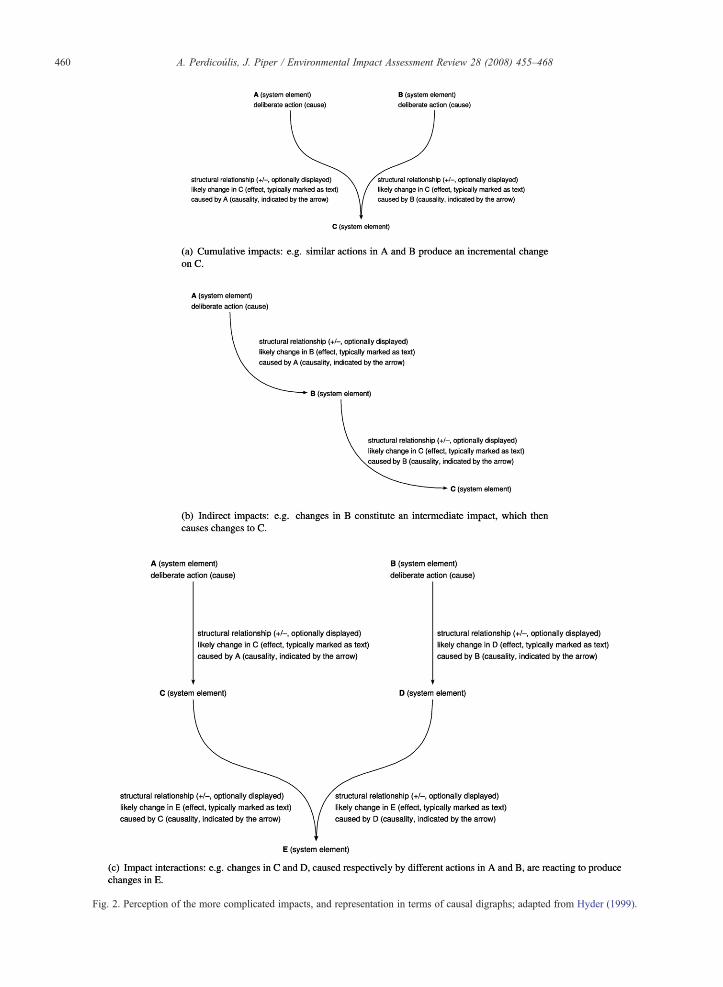
At the high-aggregation level (e.g. Fig. 3), the directionof the interactions (e.g. among projects) may be filteredout, or not considered at all, in which case the graphic
Fig. 3. Crossrail co-exists in space and time with other projects— seetext for details. The relationships among these projects are representedin the form of high-aggregation (low-detail) non-causal, non-directedgraphs. Source: Crossrail (2005).
structures are not causal, and may be not directed, either.At the low-aggregation level (e.g. Fig. 4), the graphs aretypically directed and causal.
Hyder (1999) provides some graphic guidance for theperception of the more complicated impacts. Fig. 2provides an equivalent representation with the conven-tions of the proposed composite method. There is scopehere for the more precise representation of synergisticand countervailing effects, as defined by Canter (1999).
In the application of the proposed composite method,the types of relationships (i.e. relative impacts) shouldbe identified first, as these represent the characteristicsof the relationships. After the identification and markingof the types of relationships with “+/−” symbols, everyproposed action can be followed through, step by step,to the terminal system elements (e.g. VECs) or back tothe original element where the action originated (i.e. bya feedback loop). Thus, the likely impacts can bemarked in a final diagram.
Following the sequence of events from action toimpacts is a type of simulation. When the informationinvolved is qualitative (e.g. “increase”, “decrease”), suchas in the examples given in this article, the simulation isqualitative.Quantitative or “numerical” simulation,whichneeds numerical data and is executed by software, can beused for more detailed forecasting, when that is desirableand possible.
3.4. Case studies
In order to demonstrate the use of the proposed“composite” graphic method, appropriate real cases ofEIAwith CEAwere sought both in the literature and viathe internet. To be useful as an example for the purposesof the current exercise, the EIS needed to present suf-ficient and clear or unambiguous information on base-lines, actions, and impacts. The examples have beenchosen to cover different project types (though all con-cern infrastructure) and CEA types: the cases involvebothmultiple projects and linear projects interacting witheither many other developed sites or with a range ofhabitats.
Three cases were selected and are used in the text andexamples which follow. The first of these concerns theproposed London Crossrail project (Crossrail, 2005)which provides a well elaborated cumulative effectsanalysis, detailed in text and accompanying set of tables,in Chapter 12 of the EIS for the project. Crossrail is aproposed urban railway across London, linking Maiden-head (Berkshire) and Heathrow airport in the west toShenfield (Essex) in the east and connecting with majorcentral London rail termini. A Bill to promote the
462 A. Perdicoúlis, J. Piper / Environmental Impact Assessment Review 28 (2008) 455–468
construction of Crossrail is currently passing throughthe Select Committee process in the UK Parliament.Once approved and constructed, it may become ope-rational from 2015. The other projects mentioned are atdifferent stages of approval and construction.
The second case study was chosen from a previouspublication on CEA (Piper, 2000) and concerns severalmajor projects (including, energy, flood defence andfreight transport) proposed for adjoining sites along5 km of the north bank of the Humber estuary, UK.Again, good information is available for this case from anumber of publications; the majority of these projectshave now been built.
The third case study is taken from the Hyder (1999)study of CEA undertaken for the European Commission.This case relates to the widening of the Kiel Canal(Germany) over a distance of 5 km, and the stabilisa-tion of the banks. This case was presented by Hyder asit was seen as one that illustrates a technique, networkanalysis, and describes cause-and-effect relationshipswithin “a very complex system of interactions” (Hyder,1999, p.A2-30).
Note that for the purposes of this article the networkdiagrams which follow have been built up frominformation in an EIS. This is the reverse of the processwhich would be used in any real world case, where(most likely) the network diagrams would be con-structed directly from the information collected duringthe assessment process. See Section 5.2 on the timing ofthe use of the CA method.
The format in which the information was originallypresented in each respective EIS (e.g. text, diagrams,lists, tables) did not determine the suitability of eachcase for its use in the present article. What was importantwas that sufficient information regarding causality wasobserved and that cause-and-effect relationships wereexplicit in the documentation.
4. Causality analysis and results
This section applies the composite causality analysismethod to selected parts of the case studies and, when-ever possible, produces results at one or two levels ofaggregation of information: a high-aggregation level,with less detail, and a low-aggregation level, with moredetail.
4.1. Case study 1: Crossrail
The major developments considered in the first casestudy are listed in the EIS as follows (Crossrail, 2005,p.495):
• Thameslink, 2000• The East London Line Extension (ELLX)• The Lower Lea Valley Olympics and LegacyDevelopments (Olympics)
• Stratford City• The Thames Gateway Bridge (TGB)• The Docklands Light Railway, Woolwich ArsenalExtension (DLR).
Special topics are considered pairwise betweenCrossrail and the other development projects. Thiscreates a daisy-like interaction scheme (Fig. 3(a)), whichis not quite a complete network as it lacks the peripheralinteractions — contrast this with Fig. 3(b).
A sample of the EIS (Crossrail, 2005, Table 12.1),used here to give the detailed graph representing the firstcase study, is transcribed below:
Crossrail impact. 2 residential properties on Cow-cross Street impacted for one month during thedaytime. 1 commercial property on Farringdon Roadimpacted during the day.Thameslink 2000 impact. 5 residential properties onCowcross Street will be affected on occasional nightsover a period of about 21 weeks as well as over a fewweekends. Up to 5 commercial properties on Cow-cross Street will be significantly affected during theday for a period of up to 11 weeks; a further 10 to 15will be similarly affected for up to 35 weekends. 25to 30 residential properties on Turnmill Street will beaffected regularly during the night over a period ofabout 52 weeks and for about 10 weekends. Up to 5commercial properties on Turnmill Street will besignificantly affected during the day for up to 16weeksand for up to 10 weekends. 5 to 10 residential proper-ties on Farringdon Road will be affected regularlyduring the night over a period of about 28 weeks.Cumulative impact. The combination of these twoprojects [i.e. Crossrail and Thameslink, 2000] over aperiod of 36 months is likely to result in significantcumulative impacts arising from construction noise.This, together with the significant dust and visualintrusion impacts that will arise from the Thameslinkproject, likely combines to create a heightened sense ofawareness of two large-scale construction projects.(Crossrail, 2005, Table 12.1).
Fig. 4, containing the information of the text above,shows a small section of the total causality network whichmight represent all Crossrail interactions, and relatesspecifically to cumulative impacts resulting from con-struction generated by both Crossrail and Thameslink,
Fig. 4. Low-level (high-detail) causal directed graph of cumulative impacts arising from construction generated by both Crossrail and Thameslink,2000; based on Table 12.1 of Crossrail (2005). Some information regarding certain impacts was either not clear or not present in the EIS; text insquare brackets (e.g. [increase]) indicates implied impacts, whilst […] indicates that no information is given. See text for methodological information.
2000. Two system elements and associated actions(construction) produce changes to three subsequent systemelements (noise level, dust level, and visual intrusionlevel). Where available from the EIS, the location andtiming of these impacts is noted. Note that noise levelreceives contributions from both developments.
The three primary impacts produce a combined impactto the “sense of awareness” element. Thus, the combinedimpacts are seen as likely to cross an “awareness thresh-old” to give a new sense of awareness— see Table 12.1 ofCrossrail (2005). Note that in this case no VEC isidentified explicitly, so human beings are not included as aseparate element in the digraph. Nevertheless, it isapparent that people near the site who are affected bynoise may be seen as the relevant VEC.
4.2. Case study 2: Humber estuary
The second case relates to the developments onthe Middle Humber estuary (UK), and is based on the textof Piper (2000), from which Fig. 5 is drawn following theconventions of the proposed composite method.
The general direction of the pathways in Fig. 5 is fromleft to right— i.e. from the actions to the impacts upon theVEC. The sub-figures show two types of impacts in thesame system: (a) the likely impacts, which are of primeinterest to impact assessment, and (b) the relative impacts,or types of relationships, which helped in following thechanges from actions to the final impacts upon the VEC.
The relative impacts were marked according tothe conventions of the composite method (Section 3.3):(a) “+” indicates that the direction of change of an impactis maintained — i.e. when an increase in the upstreamelement causes an increase in the downstream element,but also when a decrease in the upstream element causesa decrease in the downstream element— e.g. an increasein estuary bed disturbance causes an increase in waterturbidity; (b) “−” indicates that the direction of changereverses — i.e. when an increase in the upstreamelement causes an decrease in the downstream element,but also when a decrease in the upstream elementcauses a increase in the downstream element— e.g. thegreater turbidity of water causes a fall in birdpopulations.
Whilst the relative impacts are characteristics of therelationships, the likely impacts (“I/D”) depend on twofactors: (a) the action in the “upstream” element of arelationship, and (b) the type of relationship (i.e. “+/−”).For instance, in the pair “turbidity of water birdpopulation and breeding success”, the likely effect onthe “downstream” element is a “decrease”, marked by a“D” in Fig. 5(b). Besides the physical sense of thecommunicated event, this is confirmed in the diagrams:(a) the likely change in the “turbidity of water” has beenforecast to be an increase, and (b) the type of relation-ship of the target pair is of “−” type, so it inverses thedirection of change from “I” in “turbidity of water” to“D” in “bird population and breeding success”.
Fig. 5. The Humber case, adapted from the text of Piper (2000). Sub-Fig. (a) is marked with the relative impacts, or type of relationship for each pair(“+” or “−”). Sub-Fig. (b) is marked with the likely impacts in every pair of interactions as “increase” or “decrease” (“I” or “D”). See text for therelationship of the two types of impacts.
464 A. Perdicoúlis, J. Piper / Environmental Impact Assessment Review 28 (2008) 455–468
4.3. Case study 3: Kiel canal
The original source for the third case study, thewideningof the Kiel canal, Germany, expresses causality in plain textas presented in the following selected passage:
The loss of vegetation would occur as a result of thesetting back of the banks, the storage and disposal ofspoil, the diversion of the Wehrau Brook and theconstruction of a berm road. The direct impacts on
the vegetation would, as a result of the interactionsbetween the elements, impact on the associated fau-na which depend on the vegetation. There would bea correspondent change in the habitat network,which would also influence the landscape and ame-nity of the area. The damage caused duringconstruction from the compaction of soil, changein groundwater level and changes in the micro-climate caused by the removal of vegetation wouldalso impact on the habitat networks, causing shifts in
Fig. 6. Diagrammatic form of the information of the third case study, created from the text of Hyder (1999, pp.A2-31 A2-32). The informationincluded in the EIS permitted the identification of one feedback loop, although it was not sufficient to identify whether it is positive or negative. Seetext for discussion of symbols and pathways.
the composition of the animal and plant commu-nities. The shifts themselves influence the wholerespective habitat and function in the ecologicalsystem. (Hyder, 1999, pp.A2-31–A2-32).
Based on the above text, information about thesystem (including causality) is expressed graphically inFig. 6.
Fig. 6(a) demonstrates how each of the variousactions required for the project (e.g. storage and disposalof spoil) has impacts on land vegetation, whilst two havedirect impacts upon terrestrial fauna as well as indirectimpacts on fauna via terrestrial vegetation. The interplayof other interactions e.g. between vegetation and land-scape, as well as a single feedback loop between landvegetation and microclimate (subsequently affectingfauna) are also indicated. This figure denotes the changeon some causality arrows (coincidently they all havevalue “D”, decrease), but the source text does notcontain enough information to determine whether the
identified feedback loop between microclimate andvegetation is reinforcing or balancing.
Fig. 6(b), which could be an overlay to Fig. 6(a),presents the same information plus two example “miti-gation points”, denoted by thick arrow symbols. The firstexample indicates that the compaction of soil could bereduced, to improve conditions for the land vegetationand terrestrial fauna. The second example has tworamifications. First, the land vegetation could beimproved in the desired dimension (e.g. land cover,density), to directly improve the state of the systemelement “land vegetation”, which is likely to be arepresentative indicator of the system in question (e.g. ofhealth or integrity). Secondly, provided there weresufficient information to determine that the identifiedloop were reinforcing (e.g. degradation of land vegeta-tion → degradation of microclimate → degradation ofland vegetation), then improving the state of the landvegetation would be an effective mitigation measure tobreak the reinforcing loop.
466 A. Perdicoúlis, J. Piper / Environmental Impact Assessment Review 28 (2008) 455–468
5. Discussion
5.1. CEA perspective
The performance of the method has been evaluatedusing the criteria suggested in Section 2.4: i.e. essential,desirable, and also welcome characteristics. The pre-sent authors conclude that performance is satisfactoryoverall — see Table 1. Some contributions are assessedas excellent, mostly due to the nature of the medium
Table 1Assessment of extent to which CEA requirements are satisfied by thecomposite CA method, based on the three case studies used in thisarticle
Robust Yes Simple conventions,little risk for errors
Widely applicable, flexible Yes Any causalitycontext
Transparent Yes Excellentcontribution
Systematic in scoping Yes Facilitated bylayout techniques
DesirableRepresent time and space Yes With text or
additional chartsRepresent magnitude Yes With additional
symbolsEasy to use Yes Simple conventionsEasy to interpret Yes Simple conventions“Reasonable” data requirement Yes QualitativeTransferable between levels(EIA–SEA)
Yes In differentdiagrams
Also welcomeCompatible with other toolsand methods
Yes Transformable
Identify mitigation/compensation opportunities?
Yes Excellentcontribution
used (specialised graphic structures), and particularlyregarding the representation of cause-and-effect rela-tionships, multiple actions, and impact interactions.
5.2. Use of CA method
The application of the proposed method in the threecase studies suggests some reflections regarding thetiming of causality analysis. The CA outlined in thisarticle is considered to have a particularly important rolein three stages of the assessment process. First, it has arole during the scoping stage, as a means of scoping forinteractions among projects (high-aggregation level),likely impacts (low-aggregation level), and sources ofcumulative effects. At this stage the diagram would bepreliminary, lacking any detail beyond potential projectand impact linkages.
At a later stage, during the preparation of the EISmaterial, the diagram would be reworked and refined toinclude specific information — e.g. on timings ormagnitude of effects. Presentation of both the initialand subsequent refined versions in the EIS could behelpful in assisting understanding in the assessmentprocess. In addition, the diagrams also have a goodpotential for use as part of the stakeholder participationprocess, perhaps as a series of posters at an exhibition,or as presentation slides (perhaps animated), or part ofa video presentation.
5.3. Technical perspective
As VECs help to simplify CEA issues and reducecomplexity, they must be shown clearly in EISs andparticularly in the graphic structures of the compositeCA method. This approach was taken for the Humbercase, where the birds on the protected area are theprincipal VEC; the other two cases do not use the VECconcept. This issue can be expanded to the choice ofelements to include in the diagrams (e.g. “noise”instead of “residential properties”), and the appropriatewording — see more in Sterman (2000, pp.152–153)and Sterman (2001).
The other two main shortcomings of the basicnetwork and system diagrams have been addressed inthe composite method. Time and space can, indeed, bemarked on the causality arrows in a simple form such astext (e.g. Fig. 4). Future experimentation may includeinformation-rich media such as time graphs and spatialmaps. The complexity of diagrams can be defined byfocussing in more closely at the appropriate level of theproblem to be solved by defining the right level ofaggregation for the information, retaining the options of
focussing in or out as necessary (e.g. Figs. 4 and 3,respectively).
Representation requires some more adjustment in thecomposite method. For instance, the likely significance ofimpacts might be represented by arrows of varyingthickness. This would require one more convention andmight also introduce some ambiguity in the interpretationof the graphs. Alternatives such as additional text on thearrows, colour, or line pattern might be more appropriateoptions. Other representational issues include the format-ting of text and the size of additional media such as maps,calendars/timelines, and impact-versus-time graphs.
The Humber case study (above) represents the relativeand the likely impacts in separate diagrams. The Kiel casestudy represents themitigations in a new diagram (Fig. 6b).Although this is done so in this article for illustrationpurposes, the diagrams in each application can be mergedeither as thematic layers or permanently. Further experi-mentation in subsequent applications may indicate userpreferences regarding the optimum representation ofinformation in the diagrams.
The first two examples from the case studies in thisarticle apparently involve no feedback loops, perhapsbecause feedback has been of no particular interest to theEIS authors. The third example presents a single loop(Fig. 6(a)) with some uncertainty— i.e. with inadequateinformation for its characterisation as “reinforcing” or“balancing”. Exploring feedback loops goes one stepbeyond impact identification, and requires the identifica-tion of the type of causal relationships, but brings manyadvantages such as more effective mitigation, as indi-cated in the Kiel case.
In the three case studies used here, the causality analy-sis has been limited by the content of the EIS from whichthe information is taken. If CA is done after the EIS iscompleted, the transformation of the information to graph-ic structures is very likely to identify important omissions,but a significant opportunity to contribute to a better EISwill have been missed. Where the diagrammatic CA andthe EIS are prepared together, a more complete causalityanalysis can be achieved early enough to produce usefulimprovements and not mere criticism. Thus it is recom-mended that causality analysis be carried out with theassistance of the graphic structures and the compositemethod proposed in this article.
The immediate future of this line of research couldinvolve examination of further CEA case study applica-tions, preferably during the elaboration of EISs, includingthe stakeholder participation process. Expected outcomesare (a) the better assessment of the potential contributionsof the method in practice, and (b) methodologicalfeedback to refine the conventions of themethod proposed
here. Further applications may include a possible exten-sion of the method to CEA in the context of SEA.
6. Conclusions
Network and system diagrams are good means toexplore cause-and-effect relationships, or causality inCEA contexts. The complexity of the diagrams can bereduced by using different aggregation levels andVECs tohelp focus on key issues. Other reported shortcomings ofdiagrams, such as time and space representation can beresolved by adding appropriate information in themarking of the impacts. By adding extra capabilities tobasic network diagrams, such as types of relationships andfeedback loops, arranged in a set of formal conventions,this article creates a special composite method to satisfyCEA's requirements regarding causality.
The application of the composite method to threeEIA case studies reveals the method to be generallysatisfactory, with some particular benefits resulting fromthe representational facility of the graphic structures. Ageneral recommendation is that the causality analysis becarried out during the drafting of the EIS, and not after ithas been completed. The next step in future work for inthis line of research is concerned with more applicationsof the method, expecting to (a) assess its contributions inpractice, and (b) to produce some refinement in theconventions of the method.
References
Beanlands GE, Duinker PN. An ecological framework for envi-ronmental impact assessment in Canada. Institute for Resourceand Environmental Studies, Dalhousie University. Published incooperationwith Federal Environmental Assessment ReviewOffice;1983.
Bedford BL, Preston EM. Developing the scientific basis for assessingcumulative effects of wetland loss and degradation on landscapefunctions. Environ Manage 1988;12:751–71.
Canter LW. Cumulative Effects Assessment. In: Petts J, editor.Handbook of Environmental Impact Assessment, vol. I. Oxford:Blackwell Science; 1999. p. 405–40.
CEQ (Council on Environmental Quality). Considering cumulativeeffects under the National Environmental Policy Act. Washing-ton DC, USA: Executive Office of the President; 1997. URL:http://ceq.eh.doe.gov/nepa/nepanet.htm.
CCW (Countryside Council for Wales), 2002. Development of amethodology for the assessment of cumulative effects of marineactivities using Liverpool Bay as a case study. Prepared byOakwood Environmental for CCW. URL: http://www.ccw.gov.uk/generalinfo/index.cfm? Action=View&RID=82&subject=Marine.
Cooper TA, Canter LW. Documentation of cumulative impacts inenvironmental impact statements. Environmental Impact Assess-ment Review 1997;17(6):385–411.
468 A. Perdicoúlis, J. Piper / Environmental Impact Assessment Review 28 (2008) 455–468
Crossrail, 2005. Crossrail EIS — chapter 12: Interactions with OtherMajor Projects. URL: http://billdocuments.crossrail.co.uk/files/Home/Home3/01. Environmental%20Statement/Volume 03/Chapter 12.pdf.
Dixon J, Montz BE. From concept to practice: implementingcumulative impact assessment in New Zealand. Environ Manage1995;19:445–56.
EC (European Council). Council Directive of 27 June 1985 onthe assessment of the effects of certain public and privateprojects on the environment 85/337/EEC.Off J 1985;L 175(05) [July].
EC (European Council). Council Directive 97/11/EC of 3 March 1997amending Directive 85/337/EEC on the assessment of the effects ofcertain public and private projects on the environment. Off J 1997;L 073(14) [March].
Gentil S, Montmain J. Hierarchical representation of complex systemsfor supporting human decision making. Adv Eng Informatics2004;18:143–59.
Glasson J, Thérivel R, Chadwick A. Introduction to EnvironmentalImpact Assessment. (3rd ed.). London: Routledge; 2005.
Harary F. Graph theory. Boston, MA: Addison-Wesley; 1969.Hegmann G, Cocklin C, Creasey R, Dupuis S, Kennedy A, Kingsley
L, et al. Cumulative Effects Assessment practitioners guide.Canada: Canadian Environmental Assessment Agency; 1999.URL: http://www.ceaa-acee.gc.ca/013/0001/0004/index_e.htm.
Hyder, 1999. EC study on indirect & cumulative impacts as well asimpact interactions, Vol. 1: Background to the Study, for EC DGXI— environment, nuclear safety & civil protection. URL: http: //ec.europa.eu/environment/eia/eia-studies-and-reports/volume1.pdf (accessed 14 May 2007).
Open University, 2000. Systems thinking and practice: diagramming(Module T552) — sign graph. The Open University. URL: http://systems.open.ac.uk/materials/t552/pages/sign/sign.html (accessed20 May 2006).
Perdicoúlis A, Glasson J. Causal networks in EIA. Environ ImpactAsses Rev 2006;26:553–69.
Perdicoúlis A, Hanusch M, Kasperidus HD, Weiland U. The handlingof causality in SEA guidance. Enviro Impact Asses Rev2007;27:176–87.
Peterson EB, et al. Cumulative effects assessment in Canada: anagenda for action and research. CEARO, Hull, Quebec, Canada;1987. Quoted by Irwin, F.H., Rhodes, B., 1991. Making decisionson cumulative environmental impacts: a conceptual framework.Washington DC: World Wildlife Fund; 1987.
Piper JM. Cumulative Effects Assessment on the Middle Humber: barriersovercome, benefits derived. J Enviro Plan Manag 2000;43(3):369–87.
Piper JM. Assessing the cumulative effects of project clusters: acomparison of process and methods in four UK cases. J EnvironPlan Manag 2001a;44(3):357–75.
Piper JM. Barriers to implementation of Cumulative Effects Assess-ment. J Environ Asses Policy Manag 2001b;3(4):465–81.
Rosen KH. Discrete mathematics and its applications. (5th ed.).Boston, MA: McGraw-Hill; 2003.
Ross W. Cumulative effects assessment: learning from Canadian casestudies. Impact Asses Proj Apprais 1998;16(4):267–76.
Sadler B, 1996. Environmental assessment in a changing world:evaluating practice to improve performance. Final report for IAIA.URL: http://www.ceaa.gc.ca/017/012/iaia8_e.pdf (accessed 14May 2007).
Schroll H, Stærdahl J. The concept of the Journal of TransdisciplinaryEnvironmental Studies. J Transdiscip Environ Stud 2001:1–6[Nov].
Smit B, Spaling H. Methods for Cumulative Effects Assessment.Environ Impact Asses Rev 1995;15(1):81–106.
Spaling H. Cumulative Effects Assessment: principles. Impact Assess1994;12:231–51.
Sporbeck O, 1997. Arbeitshilfe zur praxisorientierten Einbeziehung derWechselwirkungen in Umweltvertra¨glichkeitsstudien im Strassen-bauvorhaben. Bochum, Germany. Quoted by Hyder (1999).
Sterman JD. Business dynamics. Boston: Irwin-McGraw-Hill; 2000.Sterman JD. Fine-tuning your causal loop diagrams— part I. The Syst
Thinker 2001;12(5):6–7.Wathern P. Environmental Impact Assessment — theory and practice.
London: Routledge; 1998.Wood G, Glasson J, Becker J. EIA scoping in England and Wales:
practitioner approaches, perspectives and constraints. EnvironImpact Asses Rev 2006;26:221–41.
Anastássios Perdicoúlis is a Visiting Research Fellow at the OxfordInstitute for Sustainable Development (OISD), Oxford BrookesUniversity, UK, and an Assistant Professor at the University ofTrás-os-Montes e Alto Douro, Portugal. His research interests arestrategic planning, including strategy-making, assessment, anddecision-making, as well as system dynamics, including conceptualmodelling and causality analysis. He is the founder and first leader ofthe System Dynamics Society's Environmental Special InterestGroup.
Jake Piper is a Senior Research Fellow at the Oxford Institute forSustainable Development (OISD), Oxford Brookes University, UK.Her research interests include impact assessment, and particularlyCumulative Effects Assessment (CEA), and currently the planningresponse to climate change as it affects biodiversity.