50
Network Design Network design and optimization Copyright © 2010 by The McGraw-Hill Companies, Inc. All rights reserved McGraw-Hill/Irwin
| Date post: | 13-Dec-2015 |
| Category: |
Documents |
| Upload: | benjamin-james |
| View: | 214 times |
| Download: | 0 times |
Network Design
Network design and optimization
Copyright © 2010 by The McGraw-Hill Companies, Inc. All rights reserved.
McGraw-Hill/Irwin
13-2
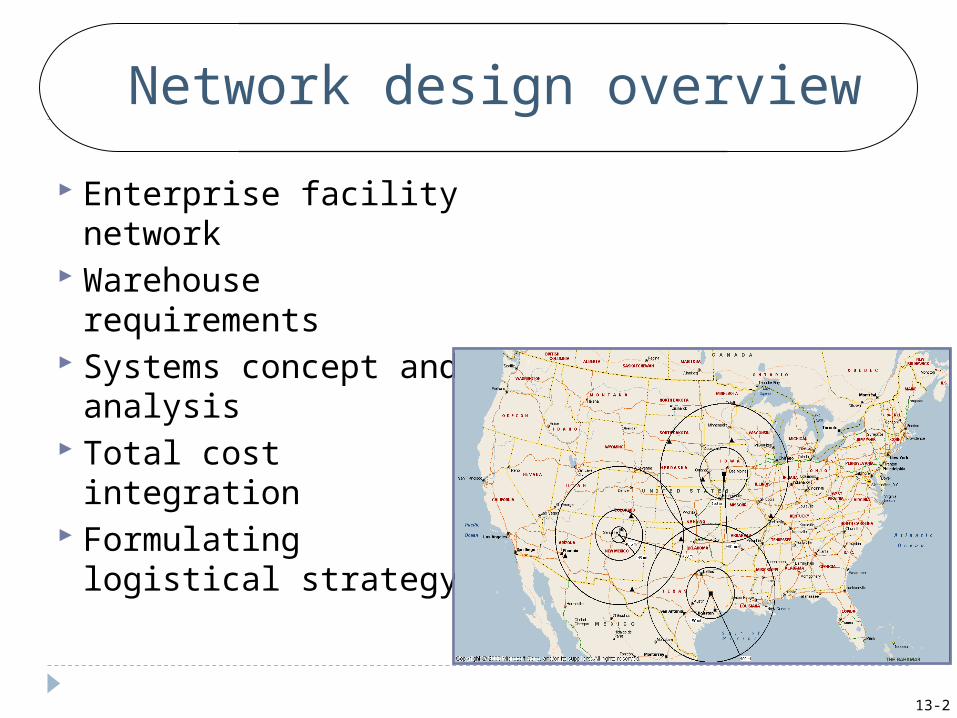
Network design overview
Enterprise facility network
Warehouse requirements
Systems concept and analysis
Total cost integration
Formulating logistical strategy
13-3
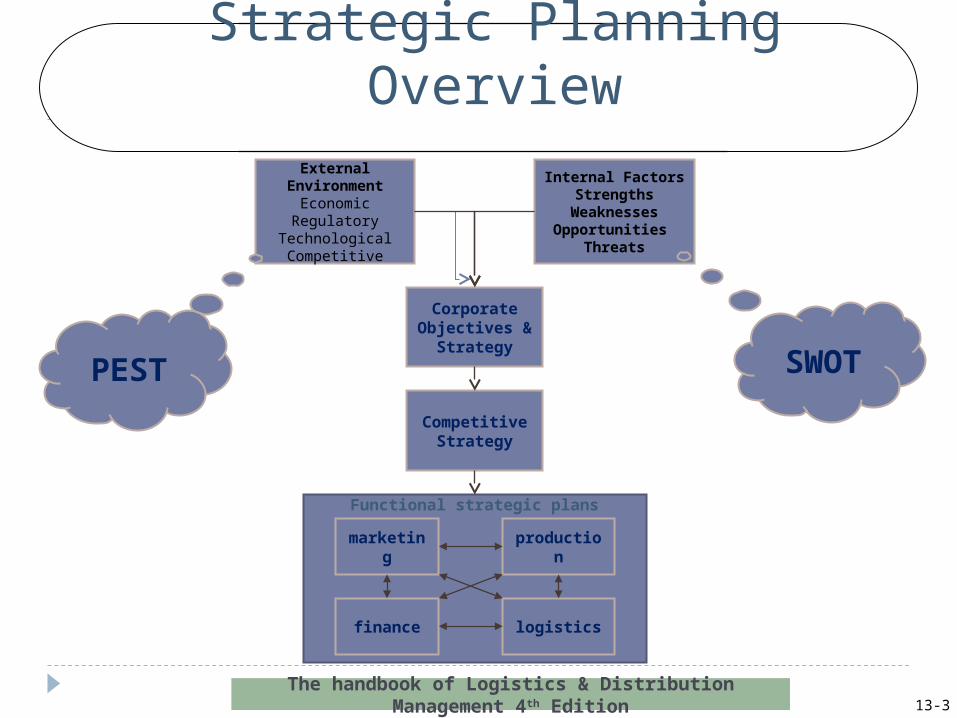
Strategic Planning Overview
The handbook of Logistics & Distribution Management 4th Edition
External Environment
EconomicRegulatory
TechnologicalCompetitive
Corporate Objectives &
Strategy
Internal FactorsStrengths
WeaknessesOpportunities
Threats
Competitive Strategy
production
marketing
logisticsfinance
Functional strategic plans
SWOTPEST
13-4
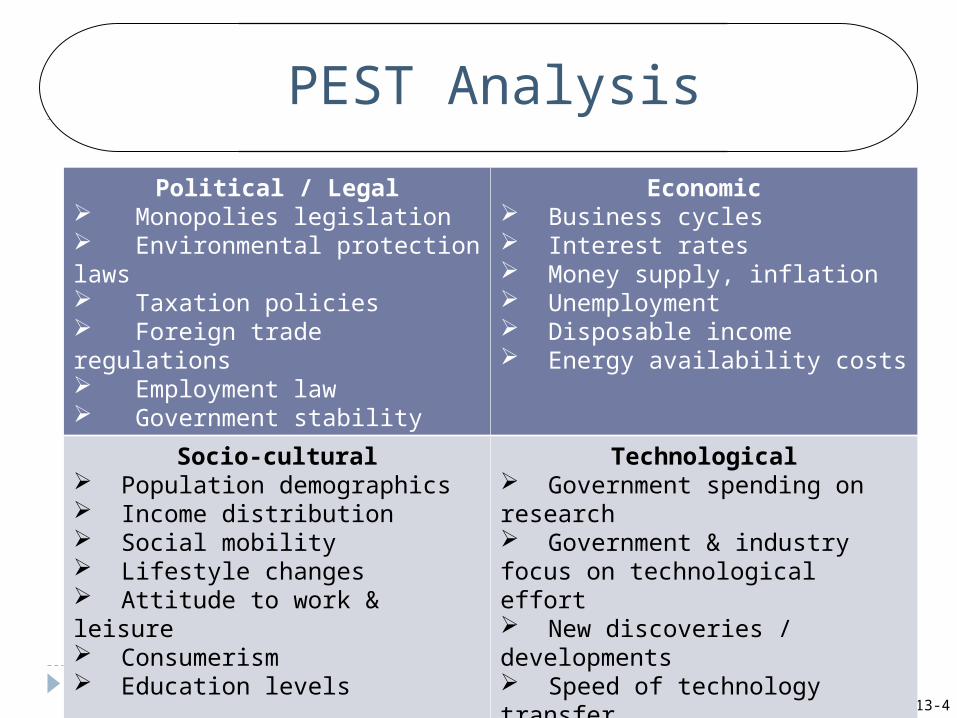
PEST Analysis
Political / Legal Monopolies legislation Environmental protection laws Taxation policies Foreign trade regulations Employment law Government stability
Economic Business cycles Interest rates Money supply, inflation Unemployment Disposable income Energy availability costs
Socio-cultural Population demographics Income distribution Social mobility Lifestyle changes Attitude to work & leisure Consumerism Education levels
Technological Government spending on research Government & industry focus on technological effort New discoveries / developments Speed of technology transfer Rates of obsolescence
13-5The handbook of Logistics & Distribution Management 4th Edition
Corporate Objectives & Strategy
Competitive Strategy
Logistics process design
Competitive Strategy
Logistics network design
Logistics information system design
Logistics organizati
onal structure
Logistics Network Design: Includes aspects related to the physical
flow of the product through a company’s operation, the inventory that should be held, the number and location of warehouses, the use of stockless warehouses, and final product delivery. One key to the determination of an appropriate physical design is the use of trade-offs between logistics competencies and between the different company functions.
Logistics Network Design
13-6
Logistics Network Design
The handbook of Logistics & Distribution Management 4th Edition
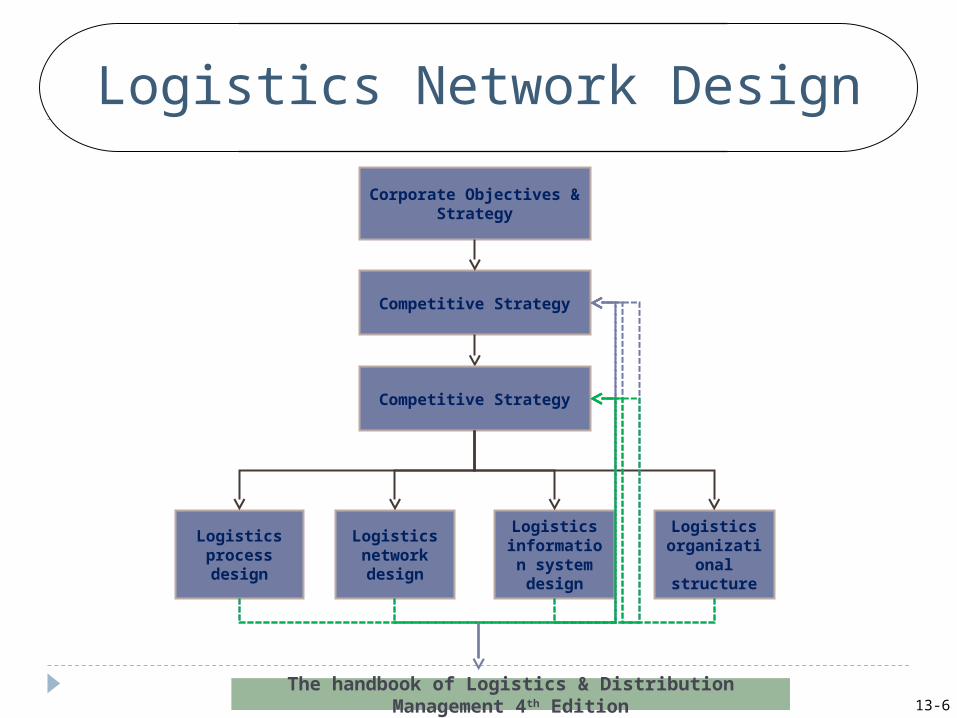
Corporate Objectives & Strategy
Competitive Strategy
Logistics process design
Competitive Strategy
Logistics network design
Logistics information system design
Logistics organizati
onal structure
13-7
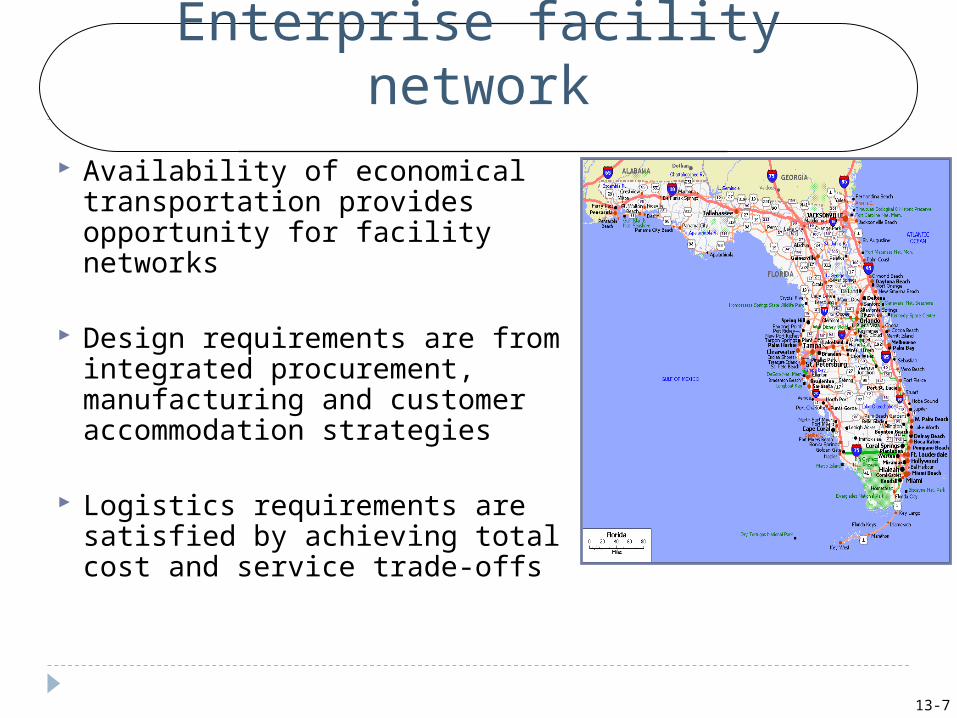
Enterprise facility network Availability of economical
transportation provides opportunity for facility networks
Design requirements are from integrated procurement, manufacturing and customer accommodation strategies
Logistics requirements are satisfied by achieving total cost and service trade-offs
13-8
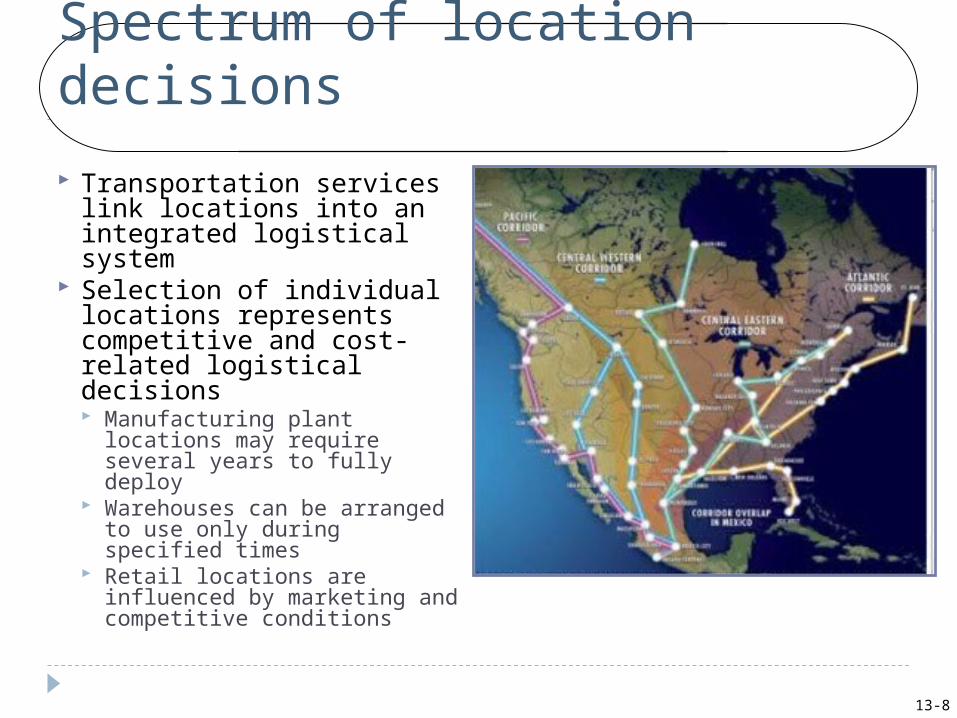
Spectrum of location decisions
Transportation services link locations into an integrated logistical system
Selection of individual locations represents competitive and cost-related logistical decisions Manufacturing plant
locations may require several years to fully deploy
Warehouses can be arranged to use only during specified times
Retail locations are influenced by marketing and competitive conditions
13-9
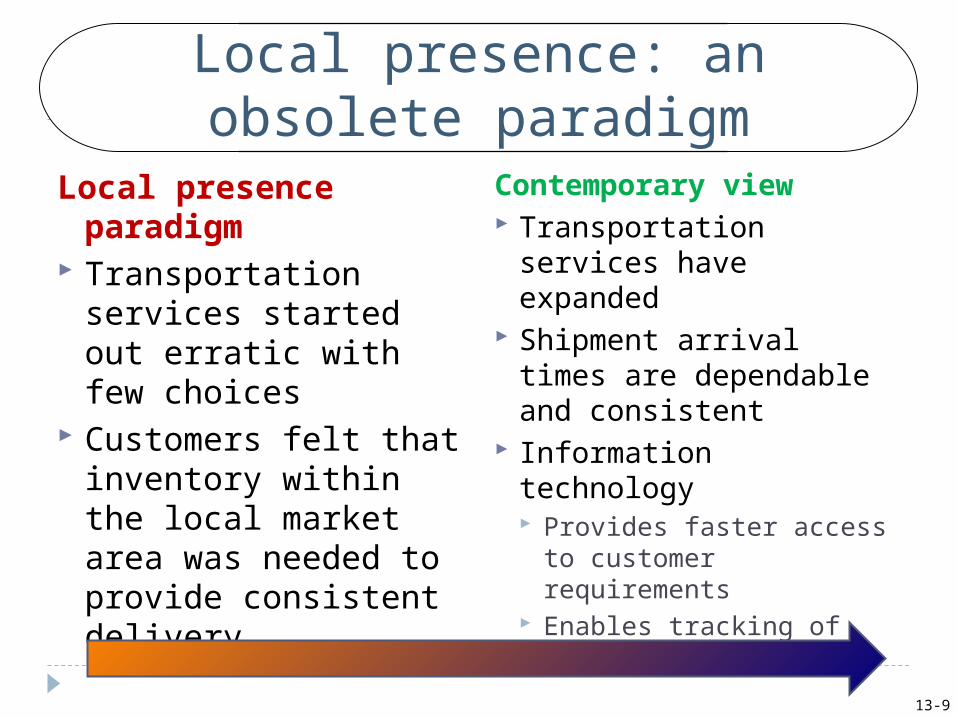
Local presence: an obsolete paradigm
Local presence paradigm
Transportation services started out erratic with few choices
Customers felt that inventory within the local market area was needed to provide consistent delivery
Contemporary view Transportation services
have expanded Shipment arrival times
are dependable and consistent
Information technology Provides faster access to
customer requirements Enables tracking of
transport vehicles
13-10
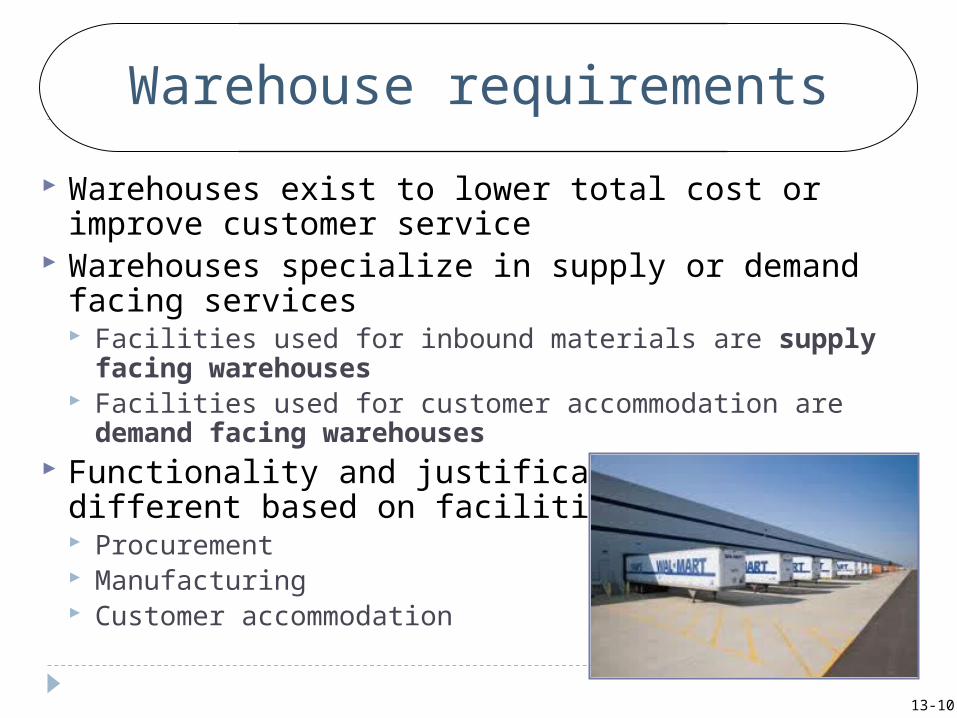
Warehouse requirements
Warehouses exist to lower total cost or improve customer service
Warehouses specialize in supply or demand facing services Facilities used for inbound materials are supply facing
warehouses Facilities used for customer accommodation are demand
facing warehouses Functionality and justification are different based
on facilities support role Procurement Manufacturing Customer accommodation
13-11
Procurement: lowest total inbound cost
Limited number of deeper relationships with suppliers
Life cycle considerations E.g. material purchase, reclamation, and disposal of
unused materials Debundling of value-added services leading to
new structural relationships with suppliers Seasonality of selected supplies Opportunities to purchase at reduced prices Rapid accommodation of manufacturing spikes Facilities placing more emphasis on sorting and
sequencing materials
13-12
Manufacturing drivers: consolidation
Provide customers full-line product assortment on a single invoice at truckload transportation rates
Choice of manufacturing strategy is primary driver Make to plan (MTP)
Requires substantial demand facing warehousing
Make to order (MTO) Requires supply facing support, but
little demand warehousing Assemble to order (ATO)
13-13
Customer accommodation: inventory
Maximize consolidation and length of haul from plants
Rapid replenishment from wholesalers E.g. food and mass merchandise industries
Market-based ATO situations using decentralized warehouses
Size of market served by warehouse based on Number of suppliers Desired service speed Size of average order Cost per unit of local delivery
13-14
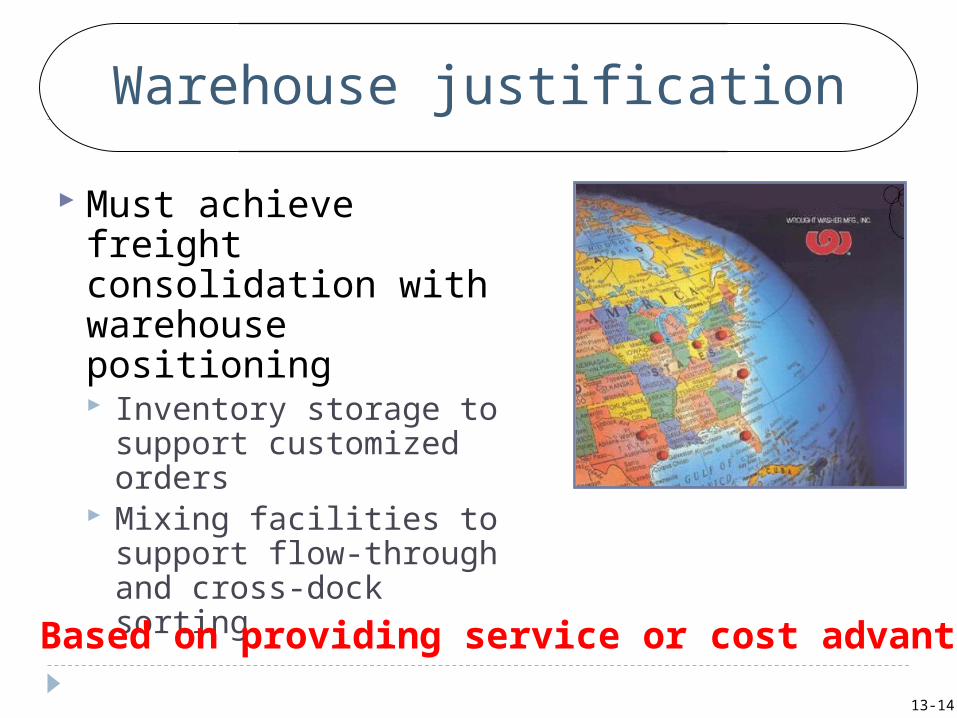
Warehouse justification
Must achieve freight consolidation with warehouse positioning Inventory storage to
support customized orders
Mixing facilities to support flow-through and cross-dock sorting
Based on providing service or cost advantage
13-15
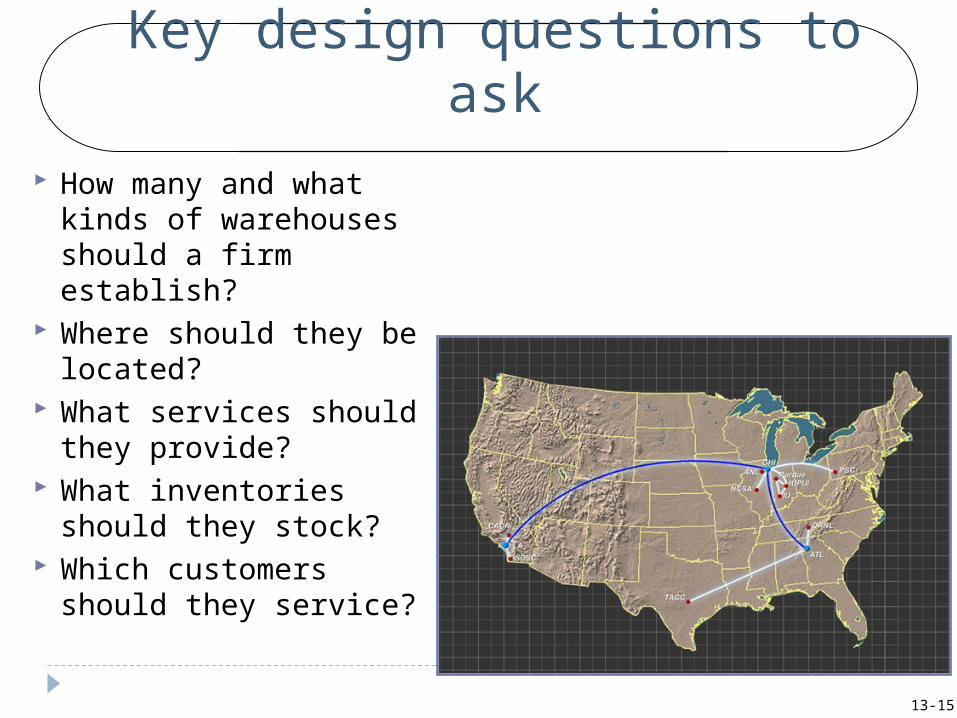
Key design questions to ask How many and what
kinds of warehouses should a firm establish?
Where should they be located?
What services should they provide?
What inventories should they stock?
Which customers should they service?
13-16
The “Systems” Concept
Systems concept is an analytical framework that seeks total integration of components essential to achieving stated objectives
Components of logistical system are its functions Order processing Inventory Transportation Warehousing Materials handling and packaging Facility network design
13-17
Systems analysis
Focus on process perspective balancing performance between functional areas both within the enterprise and across its supply chain
Components linked together in a balanced system will produce greater end results than possible through individual performance
seeks to quantify trade-offs between logistics functions
13-18
A systems concept example
Customer service is an integral part of total system performance
However, Customer service must also be balanced against
other components Accommodating the customer to the extent that you
put yourself out of business is not serving the customer!
There must be a balance between cost and customer service
Building relationships with customers is key to this balance i.e. customers become a component of the supply chain
system
13-19
Total cost integration
Initial network of facilities are driven by economic factors Transportation economics Inventory economics
Cost trade-offs of these individual functions are identified, but A system analysis approach (i.e. total cost
integration) is used to identify the least-total-cost for the combined facility network
13-20
Transportation economics
Two basic principles for economical transportation Quantity principle is that individual shipments
should be as large as the carrier can legally transport in vehicle
Tapering principle is that large shipments should be transported distances as long as possible
13-21
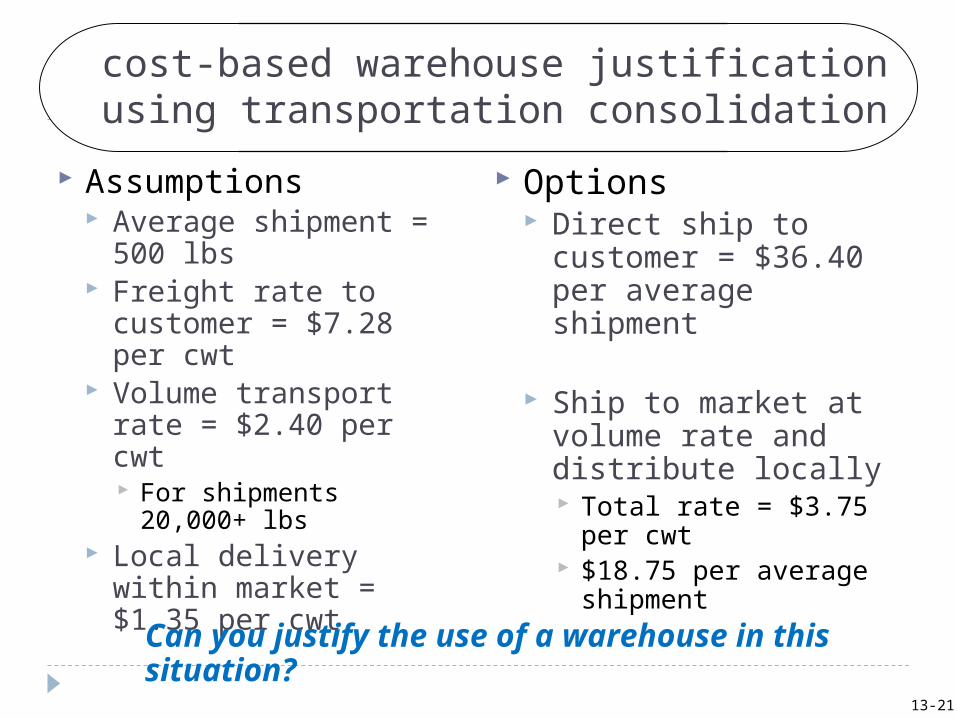
cost-based warehouse justification using transportation consolidation
Assumptions Average shipment =
500 lbs Freight rate to
customer = $7.28 per cwt
Volume transport rate = $2.40 per cwt For shipments 20,000+
lbs Local delivery within
market = $1.35 per cwt
Options Direct ship to
customer = $36.40 per average shipment
Ship to market at volume rate and distribute locally Total rate = $3.75 per
cwt $18.75 per average
shipment
Can you justify the use of a warehouse in this situation?
13-22
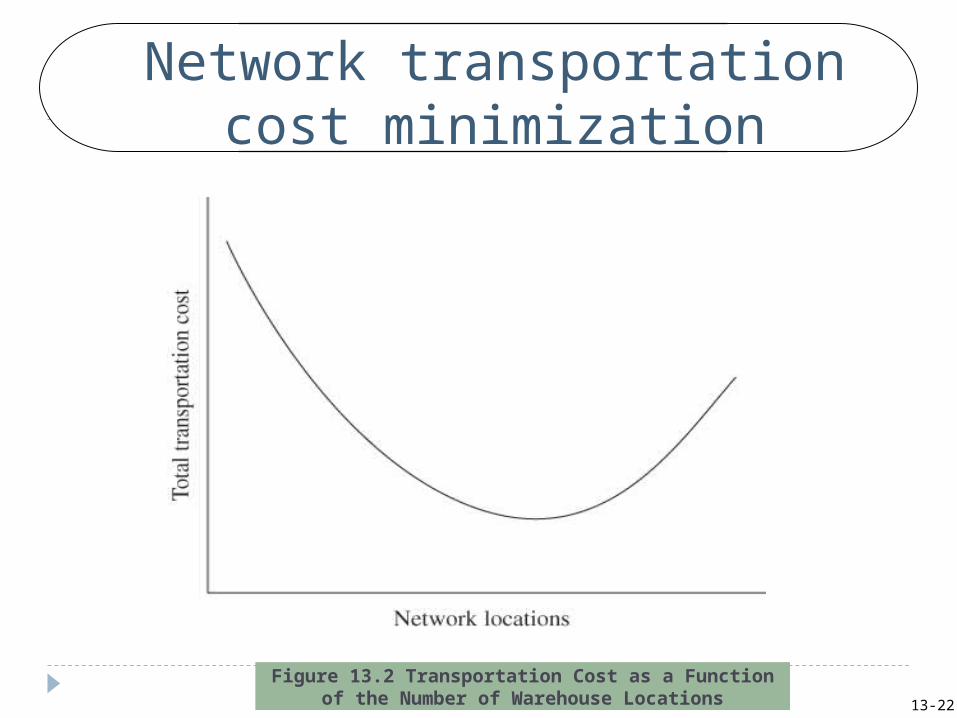
Network transportation cost minimization
Figure 13.2 Transportation Cost as a Function of the Number of Warehouse Locations
13-23
Inventory economics is driven by service response time
Performance cycle is key driver
Forward deployment of inventory potentially improves service response time, but Increases overall
system inventory
13-24
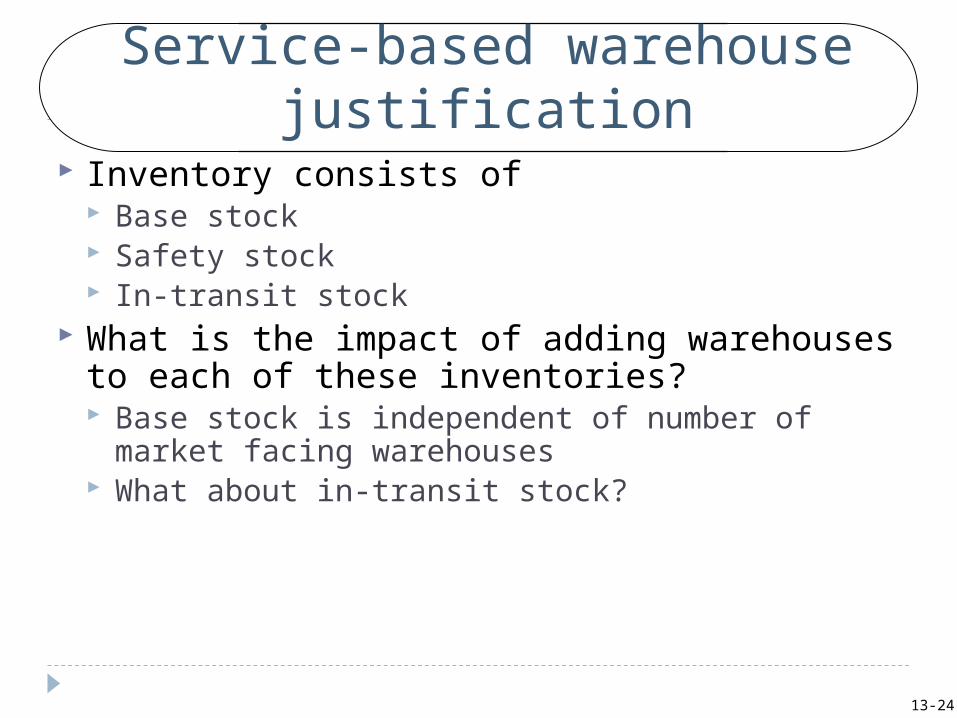
Service-based warehouse justification
Inventory consists of Base stock Safety stock In-transit stock
What is the impact of adding warehouses to each of these inventories? Base stock is independent of number of market
facing warehouses What about in-transit stock?
13-25
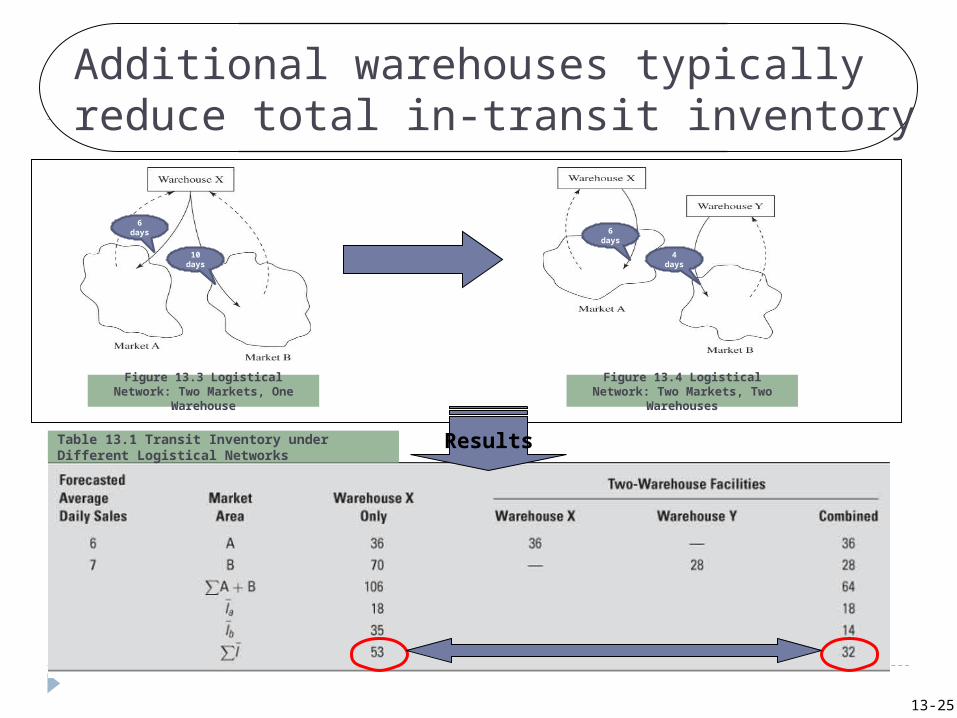
Additional warehouses typically reduce total in-transit inventory
Figure 13.3 Logistical Network: Two Markets, One Warehouse
Figure 13.4 Logistical Network: Two Markets, Two Warehouses
Table 13.1 Transit Inventory under Different Logistical Networks Results
6 day
s
10 day
s
6 day
s4
days
13-26
Inventory summary
Base stock determination is independent of number of market facing warehouses
In-transit stock will typically decrease with the addition of warehouses to the network
Safety stock increases with number of warehouses added to the network New performance cycle requires additional safety
stock
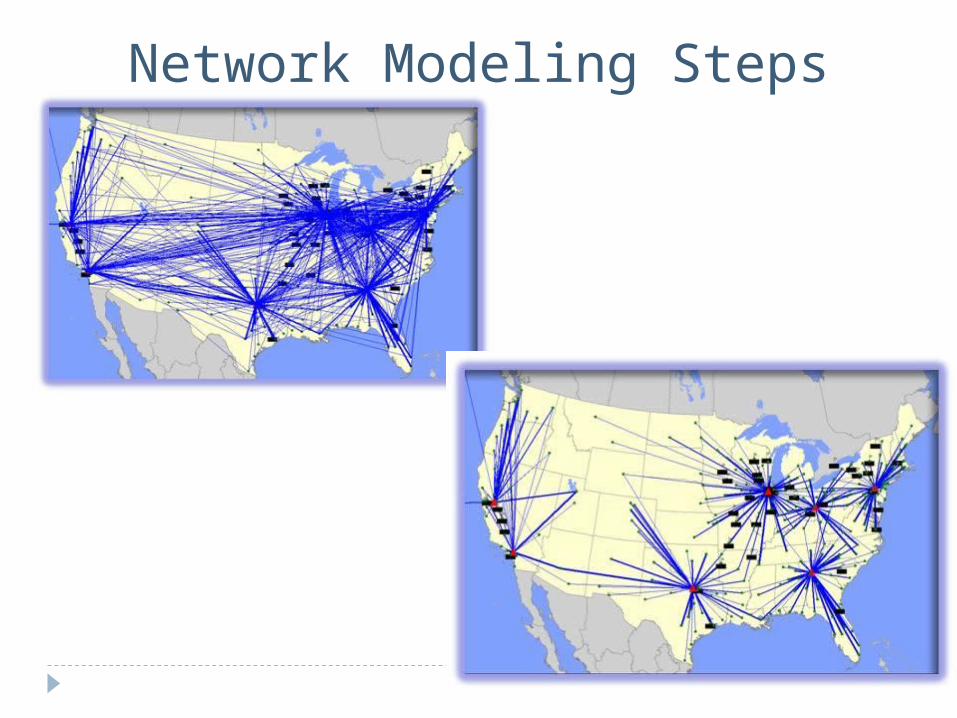
Network Modeling Steps
13-28
Strategic importance of network design
Critical variables in network design: Changing Customer Service Requirements Shifting Locations of Customer and/or Supply
Markets Change in Corporate Ownership Cost Pressures Competitive Capabilities Corporate Organizational Change
13-29
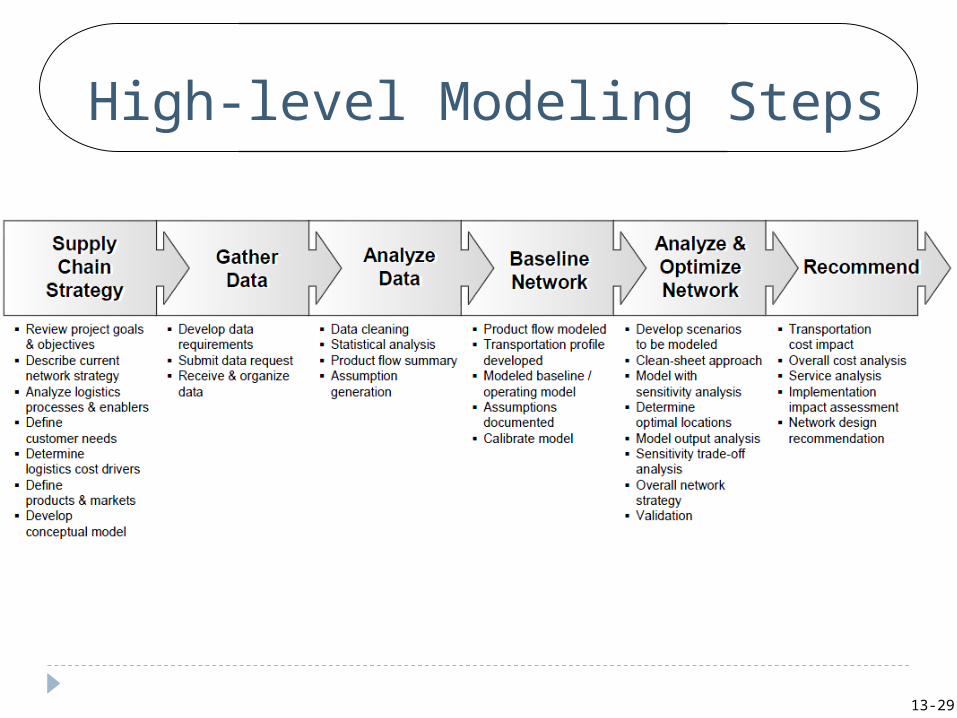
High-level Modeling Steps
13-30
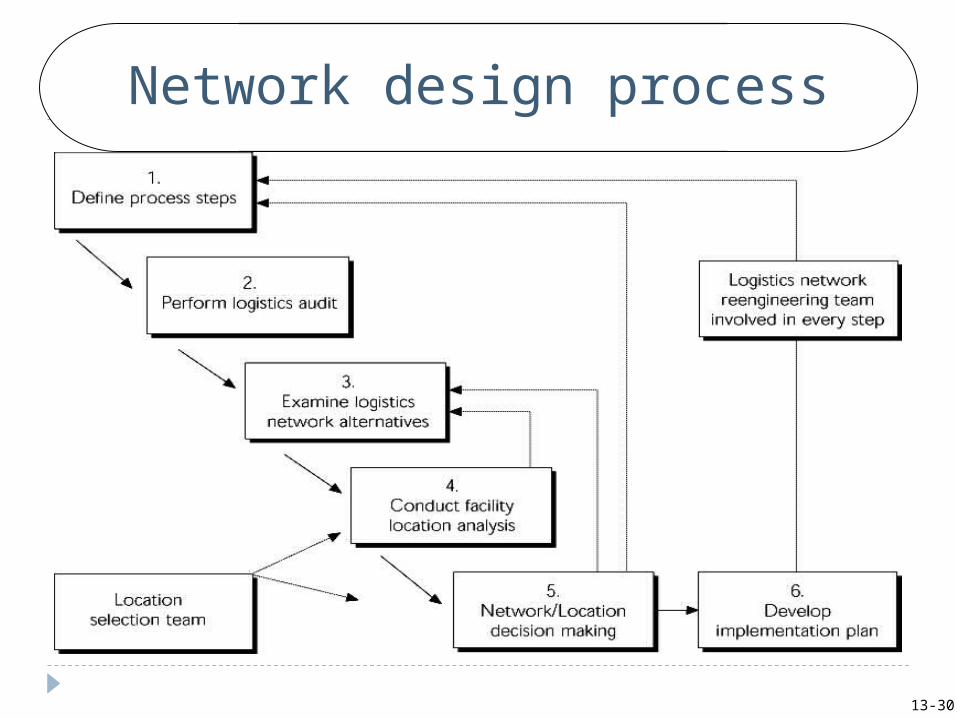
Network design process
13-31
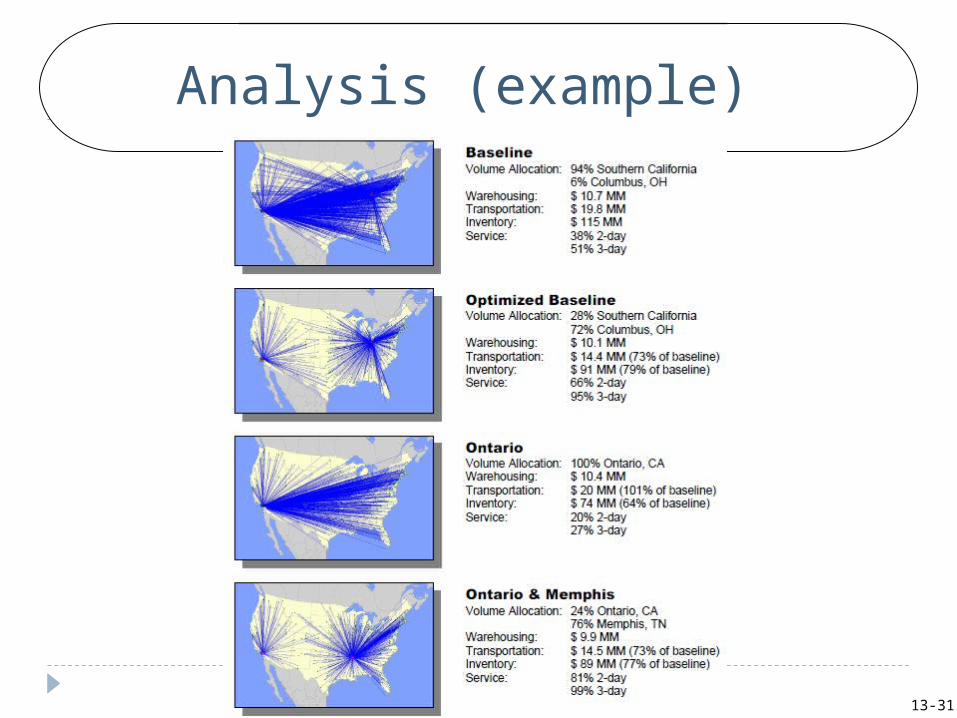
Analysis (example)
13-32
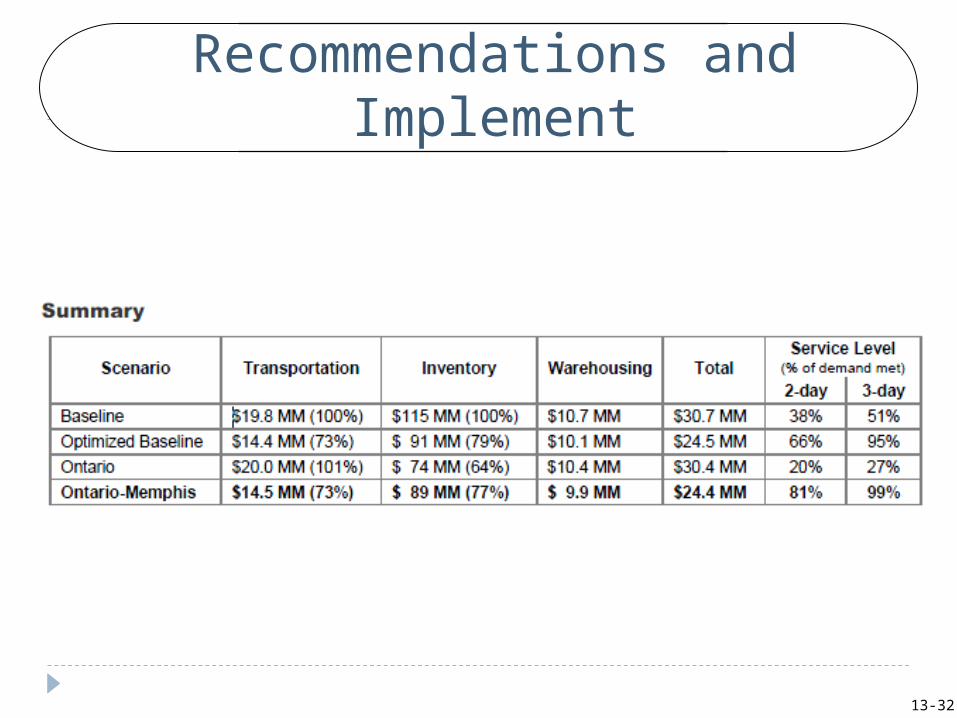
Recommendations and Implement
13-33
Chapter 14Management of Business Logistics, 7th Ed.33
Network Design: Step 1
Step 1: Define Network Strategy & Requirements
Form a design team Includes the overall system including business
strategy requirements and relevant constraints, such as planning and environmental issues.
Also includes approaches described in business and supply chain strategy literature, such as on competitive advantage and consumer value and the use of scenario planning
13-34
Chapter 14Management of Business Logistics, 7th Ed.34
Network Design: Step 2 & 3
Step 2: Perform a Logistics Audit & Collect Data Forces a comprehensive perspective Develops essential information These include product details, order profiles,
shipping patterns, cost data and site information
Step 3: Examine the Logistics Network Alternatives Use modeling to provide additional insights Develop preliminary designs Test model for sensitivity to key variables
13-35
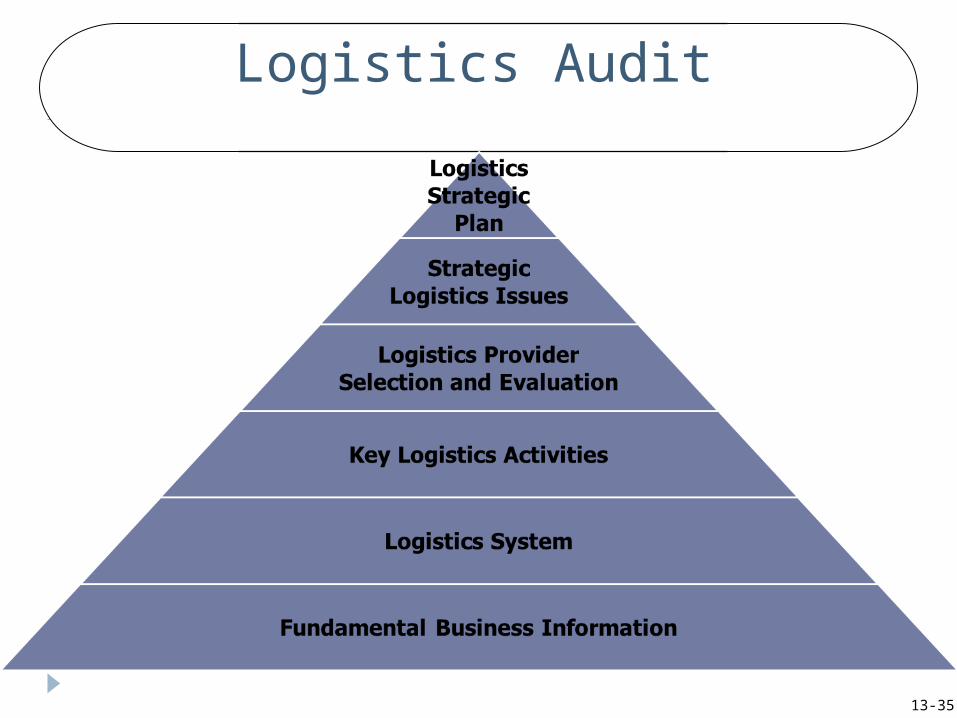
Logistics Audit
13-36
36
Network Design: Steps 4 & 5
Step 4: Conduct a Facility Location Analysis Analyze attributes of candidate sites Apply screening to reduce alternative sites
Step 5: Make Decisions regarding Network and Facility Location Evaluate sites for consistency with design criteria. Confirm types of change needed
13-37
Logistics Network Design
Step 6: Develop an Implementation Plan Plan serves as a road map in moving from current
system to the desired logistics network. Firm must commit funds to implement the
changes recommended by the re-engineering process.
13-38
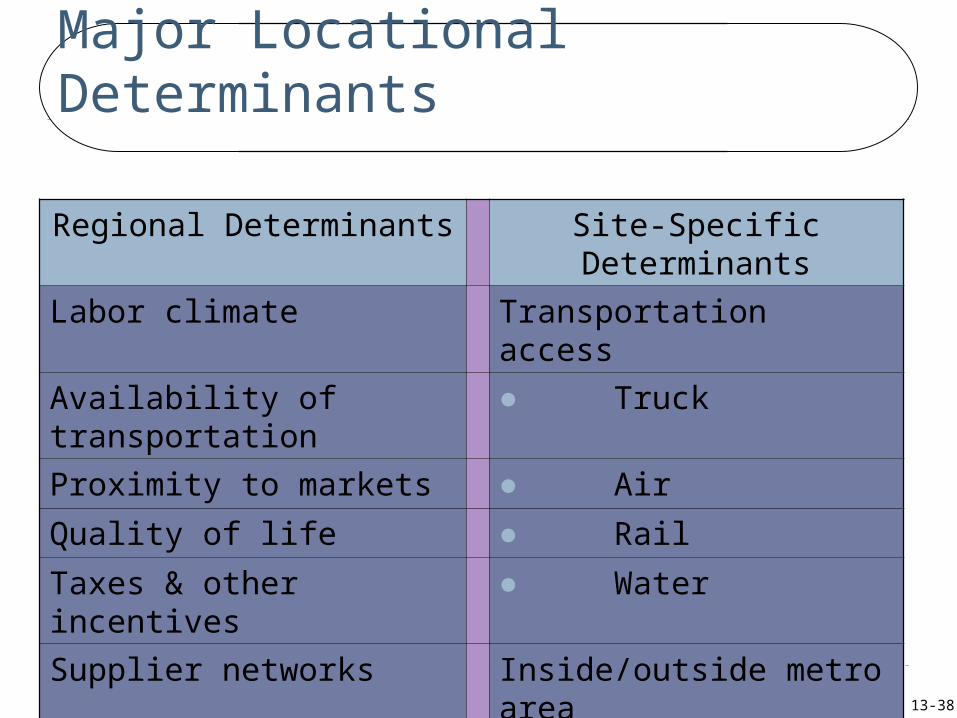
Major Locational Determinants
Regional Determinants Site-Specific Determinants
Labor climate Transportation access
Availability of transportation
● Truck
Proximity to markets ● Air
Quality of life ● Rail
Taxes & other incentives ● Water
Supplier networks Inside/outside metro area
Land costs and utilities Availability of workforce
Company preference Utilities
13-39
Major Locational Determinants: Current Trends Governing Site Selection
Strategic positioning of inventories, with faster moving items located at “market-facing” logistics facilities, and slower moving items at national or regional sites.
Direct plant-to-customer shipments which can reduce or eliminate the need for company-owned supply or distribution facilities.
Growing need and use of “cross-docking” facilities.
Use of third party logistics companies which negate the need for the firm to maintain or establish its own distribution facilities.
13-40
40
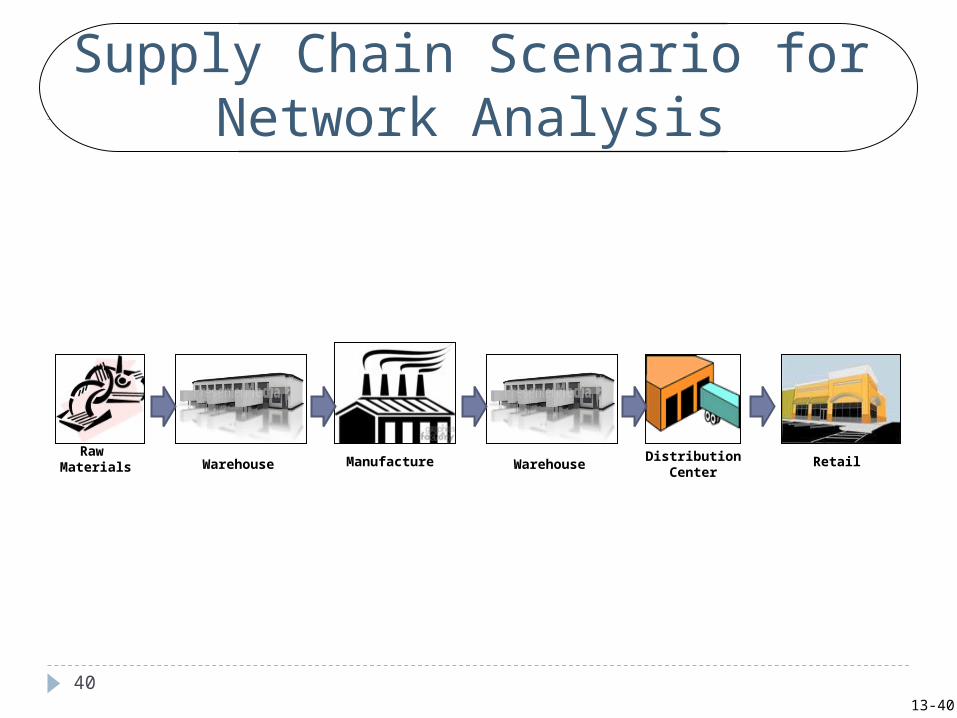
Supply Chain Scenario for Network Analysis
Raw Materials Warehouse Manufacture Warehouse
DistributionCenter
Retail
13-41
Modeling Approaches: Optimization Models
Based on precise mathematical procedures guaranteed to find the “best” solution from among a number of feasible solutions.
One approach is Linear Programming (LP). Useful in linking facilities in a network. Defines optimum distribution patterns. Modern computers facilitate LP modeling.
13-42
Modeling Approaches: Simulation Models
Based on developing a model of a real system and conducting experiments with this model.
In location theory, a firm can test the effect of various locations on costs and profitability.
Does not guarantee an optimum solution but evaluates through the iterative process.
Simulations are either static or dynamic depending upon how whether they incorporate data from each run into the next run.
13-43
Modeling Approaches: Heuristic Models
Based upon developing a model that can provide a good approximation to the least-cost location in a complex decision problem.
Can reduce a problem to a manageable size. This approach can be as sophisticated as
mathematical optimization approaches. The “Grid Technique” is an example of a
heuristic approach and will be demonstrated in the next few slides.
13-44
Heuristic Modeling Approach: The Grid Technique
The Grid Technique attempts to locate a fixed facility such that the location represents the least-cost center for moving inbound materials and outbound product within a geographic grid.
It finds the ton-mile center of mass; that is, the geographic point where transportation costs are minimized (as discussed in class)
This simple approach works where all transportation rates are the same.
However, we know that freight rates for raw materials are generally lower than those for finished goods.
13-45
Example of: The Grid Technique
When we use different freight rates, the grid model will tend to pull the location of our fixed facility toward the higher rated areas.
Thus, the location of a production plant will tend to be nearer the market, reducing the overall transportation of the higher rated finished goods in favor of increasing transportation of lower rated raw materials.
13-46
Heuristic Modeling Approach: The Grid Technique
Advantages Simple to use Provides a starting point for further analysis Can accommodate “what if” questions
Limitations Static approach Linear rates No consideration of topography Does not consider direction of movement
13-47
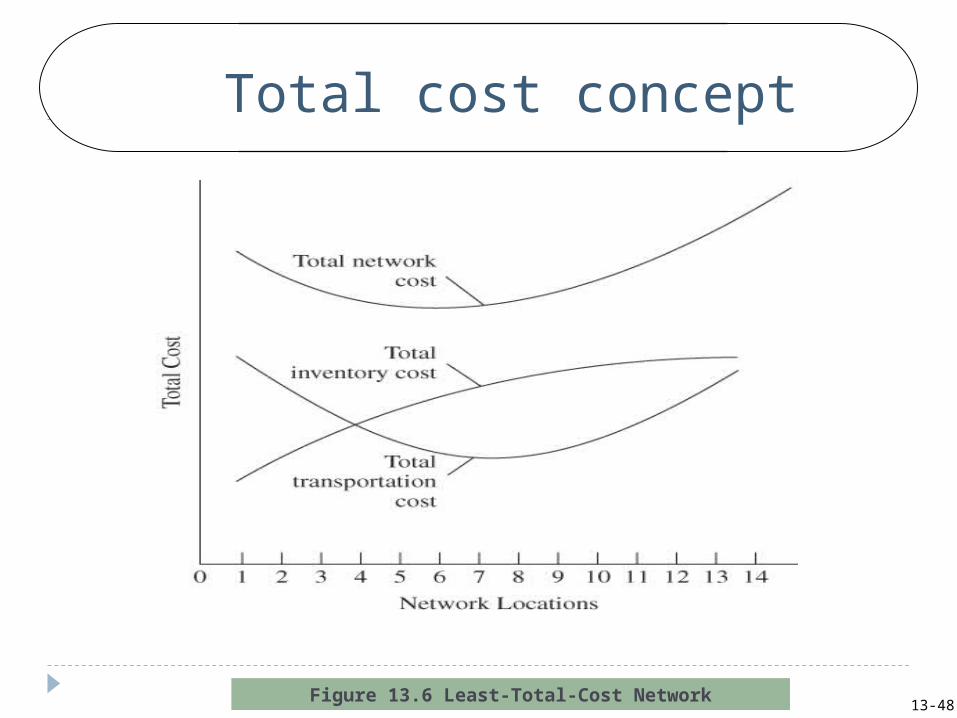
Total cost of the network
Figure 13.6 combines cost curves from Figure 13.2 and 13.5
Lowest cost points on each curve For total transportation cost between 7 and 8
facilities For inventory cost it would be a single warehouse For total cost of network it is 6 locations
Trade-off relationships Minimal total cost point for the system is not at
the point of least cost for either transportation or inventory
13-48
Total cost concept
Figure 13.6 Least-Total-Cost Network
13-49
Limitations to accurate total cost analysis
Many important costs are not specifically measured or reported
Need to consider a wide variety of network design alternatives Alternative shipment
sizes Alternative modes of
shipment Range of available
warehouse locations
13-50
Evaluating alternative customer service levels and
costs General approach to finalizing a logistical
strategy Determine a least-total-cost network
Measure service availability and capability for this network
Conduct sensitivity analysis for incremental service options Use cost and revenue associated with each option
Finalize the plan


