+ All Categories
Home > Documents > Network exploration via the adaptive lasso and scad...

Network exploration via the adaptive lasso and scad...

Date post: 18-Feb-2019
Category:
Upload: ngonhi
View: 217 times
Download: 0 times
Share this document with a friend
26
Submitted to the Annals of Applied Statistics NETWORK EXPLORATION VIA THE ADAPTIVE LASSO AND SCAD PENALTIES * By Jianqing Fan, Yang Feng and Yichao Wu Princeton University Graphical models are frequently used to explore networks, such as genetic networks, among a set of variables. This is usually carried out via exploring the sparsity of the precision matrix of the variables under consideration. Penalized likelihood methods are often used in such explorations. Yet, positive-definiteness constraints of precision matrices make the optimization problem challenging. We introduce non-concave penalties and the adaptive LASSO penalty to attenuate the bias problem in the network estimation. Through the local linear approximation to the non-concave penalty functions, the problem of precision matrix estimation is recast as a sequence of penalized like- lihood problems with a weighted L1 penalty and solved using the efficient algorithm of Friedman et al. (2008). Our estimation schemes are applied to two real datasets. Simulation experiments and asymp- totic theory are used to justify our proposed methods. 1. Introduction. Network modeling is often explored via estimating the sparse precision matrix, the inverse covariance matrix, in which each off-diagonal element represents the con- ditional covariance between its corresponding two variables. The sparsity is often studied via the penalized likelihood method with an appropriately chosen penalty function and the result is usually summarized graphically by linking conditionally dependent variables. This provides a nice understanding of how variables, such as the coexpression of genes, are related to each other. The challenge is to optimize the penalized likelihood subject to the positive-definiteness * The work was supported by the NIH grant R01-GM072611 and NSF grants DMS-0704337 and DMS-0714554. The authors are in deep debt of Professor d’Aspremont for his helpful discussion. AMS 2000 subject classifications: Primary 62H12, 62G05; secondary 62P10 Keywords and phrases: Adaptive LASSO, covariance selection, Gaussian concentration graphical model, genetic network, LASSO, precision matrix, SCAD 1 imsart-aoas ver. 2007/09/18 file: revised_version_0818.tex date: August 24, 2008
Transcript

Submitted to the Annals of Applied Statistics

NETWORK EXPLORATION VIA THE ADAPTIVE LASSO AND SCAD

PENALTIES∗

By Jianqing Fan, Yang Feng and Yichao Wu

Princeton University

Graphical models are frequently used to explore networks, such

as genetic networks, among a set of variables. This is usually carried

out via exploring the sparsity of the precision matrix of the variables

under consideration. Penalized likelihood methods are often used in

such explorations. Yet, positive-definiteness constraints of precision

matrices make the optimization problem challenging. We introduce

non-concave penalties and the adaptive LASSO penalty to attenuate

the bias problem in the network estimation. Through the local linear

approximation to the non-concave penalty functions, the problem of

precision matrix estimation is recast as a sequence of penalized like-

lihood problems with a weighted L1 penalty and solved using the

efficient algorithm of Friedman et al. (2008). Our estimation schemes

are applied to two real datasets. Simulation experiments and asymp-

totic theory are used to justify our proposed methods.

1. Introduction. Network modeling is often explored via estimating the sparse precision

matrix, the inverse covariance matrix, in which each off-diagonal element represents the con-

ditional covariance between its corresponding two variables. The sparsity is often studied via

the penalized likelihood method with an appropriately chosen penalty function and the result

is usually summarized graphically by linking conditionally dependent variables. This provides

a nice understanding of how variables, such as the coexpression of genes, are related to each

other. The challenge is to optimize the penalized likelihood subject to the positive-definiteness∗The work was supported by the NIH grant R01-GM072611 and NSF grants DMS-0704337 and DMS-0714554.

The authors are in deep debt of Professor d’Aspremont for his helpful discussion.

AMS 2000 subject classifications: Primary 62H12, 62G05; secondary 62P10

Keywords and phrases: Adaptive LASSO, covariance selection, Gaussian concentration graphical model, genetic

network, LASSO, precision matrix, SCAD

1imsart-aoas ver. 2007/09/18 file: revised_version_0818.tex date: August 24, 2008

2 J. FAN, Y. FENG AND Y. WU

constraint of the precision matrix and to reduce the biases induced by the penalized likelihood

method.

Let X = (X1, X2, · · · , Xp)T be a p-dimension random vector having a multivariate normal

distribution with mean vector µ and covariance matrix Σ. The research on large covariance ma-

trix estimation surges recently in high-dimensional data analysis, thanks to modern technologies

such as microarray, fMRI, and so on. In many applications like gene classifications and optimal

portfolio allocations, it is the precision matrix Ω = Σ−1 that is needed and plays an important

role. It has a nice interpretation in the Gaussian graphical model as the (i, j)-element of Ω

is exactly the partial correlation between the ith and jth components of X. In the Gaussian

concentration graphical model with undirected graph (V,E), vertices V correspond to compo-

nents of the vector X and edges E = eij , 1 ≤ i, j ≤ p indicate the conditional dependence

among different components of X. The edge eij between Xi and Xj exists if and only if ωij 6= 0,

where ωij is the (i, j)-element of Ω. Hence, of particular interest is to identify null entries in the

precision matrix.

There are many literatures on model selection and parameter estimation in the Gaussian

concentration graphical model, beginning with the seminal paper by Dempster (1972) which

discussed the idea of simplifying the covariance structure by setting some elements of the pre-

cision matrix to zero. For a long time, many methods for covariance or precision matrix esti-

mation are based on two steps: 1) identify the “correct” model; 2) estimate the parameters for

the identified model. One standard approach for identifying the model is the greedy stepwise

forward-selection (or backward-selection), which is achieved through hypothesis testing; see Ed-

wards (2000) for an extensive introduction. Drton and Perlman (2004) noted that it is not clear

whether the stepwise method is valid as a simultaneous testing procedure because its overall

error rate is not controlled. To improve over this stepwise method, Drton and Perlman (2004)

proposed a conservative simultaneous confidence interval to select model in a single step. Using

the least absolute shrinkage and selection operator (LASSO) (Tibshirani, 1996), Meinshausen

and Buhlmann (2006) proposed to perform neighborhood selection at each node in the graph.

This neighborhood selection is computationally very fast, suitable for large-size problems.

imsart-aoas ver. 2007/09/18 file: revised_version_0818.tex date: August 24, 2008

NETWORK EXPLORATION VIA THE ADAPTIVE LASSO AND SCAD PENALTIES 3

The instability of the aforementioned two-step procedures has been recognized by Breiman

(1996). On the other hand, the penalized likelihood (Fan and Li, 2001) can achieve model

selection and parameter estimation simultaneously. This penalized likelihood was later studied by

d’Aspremont et al. (2005), Yuan and Lin (2007), Levina et al. (2007), Rothman et al. (2008), and

Friedman et al. (2008) in the context of precision matrix estimation. While Yuan and Lin (2007)

solved the corresponding optimization problem using the MAXDET algorithm (Vandenberghe

et al., 1998) and focused on the statistical properties of the estimates, d’Aspremont et al. (2005)

emphasized on numerical algorithms and proposed two efficient first-order algorithms with low

memory requirement using different semidefinite programming algorithms, which observe the

positive-definiteness constraint of the precision matrix. Rothman et al. (2008) and Lam and Fan

(2007) showed elegantly that the Frobenius norm between the inverse correlation matrix and its

L1 penalized likelihood estimator is of the order Op(√S log p/n), where S is the number of the

non-zero elements of the inverse of the correlation matrix. This shows that the sparse inverse

correlation matrix is highly estimable and the dimensionality only costs an order of (log p),

a remarkable improvement of the general result of Fan and Peng (2004). Using a coordinate

descent procedure, Friedman et al. (2008) proposed the graphical lasso algorithm to estimate

sparse inverse covariance matrix using the LASSO penalty. The graphical lasso algorithm is

remarkably fast.

The L1 penalty is convex and leads to a desirable convex optimization problem when the

log-likelihood function is convex. Recent invention of the innovative LARS algorithm (Efron, et

al., 2004) enables us to compute the whole solution path of the L1 penalized regression within

O(n2p) operations. This is a remarkable achievement. However, such an algorithm does not apply

to the estimation of the precision matrix, whose parameters are subject to a positive-definiteness

constraint of the matrix.

It has been shown that the LASSO penalty produces biases even in the simple regression

setting (Fan and Li, 2001) due to its linear increase of penalty on regression coefficients. To

remedy this bias issue, two new penalties were proposed recently: one is the non-concave penalty

such as the Smoothly Clipped Absolute Deviation (SCAD) penalty (Fan and Li, 2001) and the

imsart-aoas ver. 2007/09/18 file: revised_version_0818.tex date: August 24, 2008

4 J. FAN, Y. FENG AND Y. WU

other is the adaptive LASSO penalty due to Zou (2006). In this work, we will study precision

matrix estimation using these two penalty functions. The same bias problem is demonstrated in

the theoretical work by Lam and Fan (2007), who studied the estimation of sparse covariance

matrices and sparse precision matrices via a general penalty function, satisfying the properties in

Fan and Li (2001). Through the local linear approximation (Zou and Li, 2007) to the non-concave

penalty function, the non-concave penalized likelihood can be recast as a sequence of weighted

L1 penalized likelihood problems, where the weighting scheme is governed by the derivative

of the penalty function, depending on the magnitude of the current estimated coefficient: the

larger magnitude the smaller weight. Therefore, the optimization of penalized likelihood with a

non-concave penalty subject to the positive-definiteness constraint of Ω can be elegantly solved

by the efficient algorithm of Friedman et al. (2008). In this way, we simultaneously solve the

bias issue and reduce the computational burden.

Other recent work on Gaussian concentration graph models includes that of Li and Gui (2006),

who introduced a threshold gradient descent (TGD) regularization procedure for sparse preci-

sion matrix estimation; Schafer and Strimmer (2005), who estimated the correlation matrix via

regularization with bootstrap variance reduction and used false discovery rate multiple testing to

select network based on the estimated correlation matrix; Bayesian approach considered in Wong

et al. (2003) and Dobra et al. (2004); Huang et al. (2006), who reparameterised a covariance

matrix through the modified Cholesky decomposition of it inverse and transferred covariance

matrix estimation to the task of model selection and estimation for a sequence of regression

models; among others.

The rest of the paper is organized as follows. Section 2 describes the algorithm for precision

matrix estimation and three types of penalty in detail. Our methods are applied to two real

datasets: telephone call center data (Shen and Huang, 2005) and pCR development of breast

cancer (Hess et al., 2006) in Section 3. Further Monte Carlo simulations in Section 4 compare

the performance of three kinds of penalty function under consideration. Theoretical properties of

the SCAD and adaptive LASSO penalized approach are used to justify our methods in Section

5. We conclude with a discussion given in Section 6, while the Appendix collects all the technical

imsart-aoas ver. 2007/09/18 file: revised_version_0818.tex date: August 24, 2008

NETWORK EXPLORATION VIA THE ADAPTIVE LASSO AND SCAD PENALTIES 5

proof.

2. Methods. Suppose we make n observations x1,x2, · · · ,xn from a Gaussian distribution

N(µ,Σ0) with unknown true covariance matrix Σ0, where xi = (xi1, xi2, · · · , xip)T . Denote the

sample covariance matrix by Σ, whose (j, k)-element σjk is given by∑ni=1(xij− xj)(xik− xk)/n,

where xj =∑ni=1 xij/n is the sample mean of the jth component. Note that we use n instead

of n− p in the definition of the sample covariance matrix so that the log-likelihood function of

the precision matrix can be written in a compact format as in (2.1).

2.1. Penalized likelihood estimation. Twice of the log-likelihood function for estimating the

precision matrix Ω = Σ−1 is given by

(2.1) 2l(Ω) = log det Ω− < Σ,Ω > +Constant,

where < Σ,Ω >= tr(ΣΩ) denotes the trace of the product matrix ΣΩ. When n > p, the global

maximizer of l(Ω) is given by Ω = Σ−1

.

Denote the generic penalty function on each element by p(·). The penalized likelihood method

for estimating sparse precision matrix tries to solve the following optimization problem

(2.2) maxΩ∈Sp

log det Ω− < Σ,Ω > −p∑i=1

p∑j=1

pλij(ωij),

where ωij is the (i, j)-element of matrix Ω.

A nice penalty to achieve sparsity in regression setting is the LASSO penalty proposed by

Tibshirani (1996). Essentially, the LASSO penalty uses the L1 penalty function: L1(x) = |x|.

Friedman et al. (2008) applied the LASSO penalty to (2.2) and proposed the graphical lasso

algorithm by using a coordinate descent procedure, which is remarkably fast. Moreover, this

algorithm allows a “warm” start, from which we can use the estimate for one value of the

penalty parameter as the starting point for the next value.

Numerical examples show that the LASSO penalty can produce a sparse estimate of the pre-

cision matrix. However, the LASSO penalty increases linearly in the magnitude of its argument.

As a result, it produces substantial biases in the estimates for large regression coefficients. To

address this issue, Fan and Li (2001) proposed a unified approach via non-concave penalties.

imsart-aoas ver. 2007/09/18 file: revised_version_0818.tex date: August 24, 2008

6 J. FAN, Y. FENG AND Y. WU

They gave necessary conditions for the penalty function to produce sparse solutions, to ensure

continuity of model selection, and to result in unbiased estimates for large coefficients. All these

three desirable good properties are simultaneously achieved by the SCAD penalty proposed by

Fan (1997) and many other functions. Mathematically, the SCAD penalty is symmetric and a

quadratic spline on [0,∞), whose first order derivative is given by

(2.3) SCAD′λ,a(x) = λI(|x| ≤ λ) +(aλ− |x|)+

(a− 1)λI(|x| > λ)

for x ≥ 0, where λ > 0 and a > 2 are two tuning parameters. When a =∞, it corresponds to the

L1 penalty. Based on an argument of minimizing the Bayes risk, Fan and Li (2001) recommended

to choose a = 3.7, which will be used in all of our numerical examples. Using the SCAD penalty,

we are seeking to solve the following optimization problem

(2.4) maxΩ∈Sp

log det Ω− < Σ,Ω > −p∑i=1

p∑j=1

SCADλ,a(|ωij |),

where we set λij = λ for convenience.

Zou (2006) proposed another method to achieve the aforementioned three desirable proper-

ties simultaneously. It is called the adaptive LASSO penalty, which requires a weight for each

component. The adaptive LASSO penalty is essentially a weighed version of the LASSO penalty

with some properly chosen weights. In the regression setting, Zou (2006) suggested using the

reciprocal of the absolute value of a consistent estimator raised to some power. For our setting,

we will take the same approach to derive the adaptive weights. Putting the adaptive LASSO

penalty into (2.1), we get

(2.5) maxΩ∈Sp

log det Ω− < Σ,Ω > −λp∑i=1

p∑j=1

wij |ωij |,

where wij = 1/|ωij |γ for some γ > 0 and any consistent estimator Ω = (ωij)1≤i,j≤p. The

estimation results does not differ much for different γ. So, for simplicity we fix γ = 0.5 in all our

numerical analysis. The initial estimate Ω can be chosen as the inverse sample covariance matrix

for the case p < n or the precision matrix estimate derived from the LASSO penalty for the

case p ≥ n. Note that the inverse sample covariance matrix when p < n may not be consistent

if we allow p grow with n. The requirement of a consistent initial estimate is a drawback of the

imsart-aoas ver. 2007/09/18 file: revised_version_0818.tex date: August 24, 2008

NETWORK EXPLORATION VIA THE ADAPTIVE LASSO AND SCAD PENALTIES 7

adaptive LASSO. In next subsection we elucidate the connection of the non-concave penalty to

the adaptive LASSO penalty.

2.2. Iterative reweighted penalized likelihood. To reduce the biases for estimating non-zero

components, Fan and Li (2001) pointed out a necessary condition that the penalty function

pλ(·) should be non-decreasing over [0,∞) and levels off near the right tail. This means that the

penalty function needs to be concave on [0,∞). At the time in the absence of the innovative

LARS algorithm (Efron, et al., 2004), they proposed the LQA algorithm, which conducts the

optimization iteratively and in each step approximates the SCAD penalty via a quadratic func-

tion. Hunter and Li (2005) studied the LQA in a more general framework in terms of the MM

(minorize-maximize) algorithm and showed its nice asymptotic properties. The SPICE of Roth-

man et al. (2008) is also based on the LQA algorithm. For both the LQA and MM algorithms, it

is not readily for us to introduce the Friedman et al. (2008)’s graphical lasso algorithm because

the penalty is locally approximated by a quadratic function.

In this work, to take advantage of the graphical lasso algorithm of Friedman et al. (2008), we

resort to the local linear approximation (LLA) proposed in Zou and Li (2007), an improvement

of LQA in Fan and Li (2001). In each step, the LLA algorithm locally approximates the SCAD

penalty by a symmetric linear function. For any ω0, by Taylor expansion, we approximate pλ(|ω|)

in a neighborhood of |ω0| as follows

pλ(|ω|) ≈ pλ(|ω0|) + p′λ(|ω0|)(|ω| − |ω0|),

where p′λ(ω) = ∂∂ωpλ(ω), which is non-negative for ω ∈ [0,∞) due to the monotonicity of pλ(·)

over this half real line. Denote the k-step solution by Ω(k)

. Consequently, at step k, we are

optimizing, up to a constant,

(2.6) maxΩ∈Sp

log det Ω− < Σ,Ω > −p∑i=1

p∑j=1

wij |ωij |,

where wij = p′λ(|ω(k)ij |) and ω(k)

ij is the (i, j)-element of Ω(k)

. Optimization problem (2.6) can be

easily solved by resorting to the graphical lasso algorithm proposed by Friedman et al. (2008).

At each step, (2.6) is equivalent to a weighted version of the L1-penalized likelihood, leading

to a sparse solution. The weighting scheme is governed by the derivative of the penalty function

imsart-aoas ver. 2007/09/18 file: revised_version_0818.tex date: August 24, 2008

8 J. FAN, Y. FENG AND Y. WU

and the magnitude of the current estimate: the larger magnitude the smaller weight. Due to the

sparsity in each iteration, Zou and Li (2007) studied the one-step LLA algorithm and showed

that asymptotically the one-step algorithm performs as good as the fully iterative LLA algorithm

as long as the initial solution is good enough. Enlighted by this nice observation, we simply

use the one-step LLA algorithm in this work. In Theorem 5.1, we show that the penalized

likelihood objective function is increasing through each iteration in the LLA algorithm. In our

implementation, the initial value is taken as either the inverse sample covariance matrix or the

LASSO estimate of the precision matrix. The latter is equivalent to use (2.6) twice starting

with the primitive initial value Ω(0)

= 0, resulting the LASSO estimate Ω(1)

in the first step

as SCAD′λ,a(0) = λ. This also demonstrates the flexibility of SCAD penalty: an element being

estimated zero can escape from zero in the next iteration, whereas the adaptive LASSO absorbs

zeros in each application (the estimate is always sparser than the initial value).

2.3. Tuning parameter selection. As in every regularization problem, the tuning parameter

λ controls the model complexity and has to be tuned for each penalty function. In this work,

we use the popular K-fold cross-validation method to do the tuning parameter selection. First

divide all the samples in the training dataset into K disjoint subgroups, also known as folds, and

denote the index of subjects in k−th fold by Tk for k = 1, 2, · · · ,K. The K-fold cross-validation

score is defined as:

CV (λ) =K∑k=1

(nk log |Ω−k(λ)| −∑i∈Tk

(x(i))T Ω−k(λ)x(i)),

where nk is the size of the k−th fold Tk and Ω−k(λ) denotes the estimate of the precision

matrix based on the sample (∪Kk=1Tk)\Tk with λ as the tuning parameter. Then, we choose

λ∗ = argmaxλCV (λ) as the best tuning parameter, which is used to obtain the final estimate of

the precision matrix based on the whole training set ∪Kk=1Tk. Here the maximization of CV (λ)

with respect to λ is achieved via a grid search.

3. Application to real data. In this section, we apply our estimation scheme to two real

datasets and compare the performance of three different penalty functions: the LASSO, adaptive

LASSO and SCAD.

imsart-aoas ver. 2007/09/18 file: revised_version_0818.tex date: August 24, 2008

NETWORK EXPLORATION VIA THE ADAPTIVE LASSO AND SCAD PENALTIES 9

3.1. Telephone Call Center Data. In this example, our method is applied to forecast the call

arrival pattern of a telephone call center. The data come from one call center in a major U.S.

northeastern financial organization, containing the information about the arrival time of every

call at the service queue. Phone calls are recorded from 7:00AM until midnight for each day in

2002, except 6 days when the data-collecting equipment was out of order. More details about

this data can be found in Shen and Huang (2005). We take the same data preprocessing as in

Huang et al. (2006): 1) divide the 17-hour period into 102 10-minute intervals; 2) count the

number of calls arriving at the service queue during each interval; 3) focus on weekdays only; 4)

use the singular value decomposition to screen out outliers that include holidays and days when

the recording equipment was faulty. Finally we have observations for 239 days. Denote the data

for day i by N i = (Ni1, · · · , Ni,102)′, for i = 1, · · · , 239, where Nit is the number of calls arriving

at the call center for the t-th 10-minute interval on day i. Let yit =√Nit + 1/4, the variance

stabilization transform, for i = 1, · · · , 239 and t = 1, · · · , 102. We apply the penalized likelihood

estimation method with three different penalty functions: the LASSO, adaptive LASSO and

SCAD, to estimate the 102×102 precision matrix. As in Huang et al. (2006), we use the estimated

precision matrix to forecast the number of arrivals later in the day using arrival patterns at earlier

times of the day. Denote yi = (yi1, · · · , yi,102)′. Then form the partition yi = (y(1)′

i ,y(2)′

i ), where

y(1)i and y(2)

i represent the arrival patterns in the early and the later time of day i. Here we

can take y(1)i = (yi1, · · · , yi,51)′ and y(2)

i = (yi,52, · · · , yi,102)′. The corresponding partition of the

mean and covariance matrix is

µ =

(µ1

µ2

),Σ =

(Σ11,Σ12

Σ21,Σ22

).

With the multivariate normality assumption, the best mean squared error forecast of y(2)i using

y(1)i is

E(y(2)i |y

(1)i ) = µ2 + Σ21Σ−1

11 (y(1)i − µ1),

which is also the best linear predictor for non-gaussian data.

To evaluate the forecasting performance, we split the 239 days into training and testing days.

The data from the first 205 days, corresponding to January to October, is used as the training

dataset to estimate the mean vector µ and the precision matrix Ω = Σ−1. The remaining 34

imsart-aoas ver. 2007/09/18 file: revised_version_0818.tex date: August 24, 2008

10 J. FAN, Y. FENG AND Y. WU

Table 1Average Result of call center prediction

sample LASSO adaptive LASSO SCAD

average AAFE 1.465 1.39 1.342 1.319

Nonzero elements in Σ−1

11 10394 2788 1417 684

Fig 1. Average absolute forecast error using the sample estimate and using three penalties: LASSO, adaptiveLASSO, and SCAD.

days are used for testing. We define the average absolute forecast error (AAFE) by

AAFEt =134

239∑i=206

|yit − yit|,

where yit and yit are the observed and the predicted values respectively. In Figure 1, we compare

the AAFE performance when using the sample covariance matrix, the penalized estimates using

the LASSO, adaptive LASSO, and SCAD penalty, respectively. In Table 1, we give the average

AAFE of the 34 days we set aside for testing and also the number of the nonzero elements in the

precision matrix estimate of the four methods. Here and in all following numerical studies, we

claim the element ωij of precision matrix be zero if |ωij | < 10−3, because the default threshold

for convergence in graphical lasso algorithm is 10−4. We have tried several other thresholds such

as 10−2 and 10−4, and obtained similar conclusion both in real data analysis and simulations.

Figure 1 and Table 1 show clearly that the forecasts based on the penalized estimates are

better than that based on the sample covariance matrix. Among the three penalized estimates,

the estimate associated with the SCAD penalty performs the best, followed by the adaptive

LASSO, and finally the LASSO forecast. Moreover, we can see that the sample precision matrix

imsart-aoas ver. 2007/09/18 file: revised_version_0818.tex date: August 24, 2008

NETWORK EXPLORATION VIA THE ADAPTIVE LASSO AND SCAD PENALTIES 11

has a non-sparse precision matrix and leads to a much more complex network than the penalized

ones. Comparing to the LASSO, the adaptive LASSO leads to a simpler network and the SCAD

provides an even simpler network, resulting in the smallest forecasting errors. The reason is

that the SCAD penalty results in the least biased estimate among three penalized schemes. The

SCAD penalty allows the data the choose a larger penalty parameter λ and set more spurious

zeros to zeros. This phenomenon will also be observed and demonstrated in the simulation

studies.

3.2. Breast Cancer Data. According to Jemal et al. (2005), breast cancer is the most common

type of cancer among women in the industrialized world and is the second leading cause of female

mortality from malignant diseases. According to “Cancer Facts and Figures 2008” (available at

http://www.cancer.org), an estimated 182,460 new cases of invasive breast cancer are expected

to occur among women in the US during 2008; about 1,990 new cases are expected in men. Among

them, an estimated 40,930 breast cancer deaths (40,480 women, 450 men) are expected in 2008.

As a second example, we focus on selecting gene expression profiling as a potential tool to

predict who may achieve pathologic Complete Response (pCR), which is defined as no evidence

of viable, invasive tumor cells left in surgical specimen. As in Kuerer et al. (1999), pathologic

Complete Response (pCR) after neoadjuvant chemotherapy has been described as a strong

indicator of survival, justifying its use as a surrogate marker of chemosensitivity. Therefore,

considerable interest has developed in finding methods to predict which patients will have a

pCR to preoperative therapy. In this study, we use the normalized gene expression data of 130

patients with stage I-III breast cancers analyzed by Hess et al. (2006). Among the 130 patients,

33 of them are from class 1 (achieved pCR), while the other 97 belong to class 2 (did not achieve

pCR). To evaluate the performance of the penalized precision matrix estimation using three

different penalties, we randomly divide the data into training (109) and testing (21) sets and

repeat the whole process 100 times. To maintain similar class proportion for the training and

testing datasets, each time we randomly select 5 subjects from class 1 and 16 subjects from

class 2 (both are roughly 1/6 of their corresponding total class subjects) and these 21 subjects

make up the testing data set; the remaining will be used as the training dataset. From each

imsart-aoas ver. 2007/09/18 file: revised_version_0818.tex date: August 24, 2008

12 J. FAN, Y. FENG AND Y. WU

training data, we first perform a two-sample t-test between the two groups and select the most

significant 110 genes that have the smallest p-values. In this case, the dimensionality p = 110

is slightly larger than the sample size n = 109 for training datasets in our classification study.

Due to the noise accumulation demonstrated in Fan and Fan (2008), p = 110 is may be larger

than needed for optimal classification, but allows us to examine the performance when p > n.

Second, we perform a gene-wise standardization by dividing the data with the corresponding

standard deviation estimated from the training dataset. Finally, we estimate the precision matrix

and consider the linear discriminant analysis (LDA). LDA assumes that the normalized gene

expression data in class-k is normally distributed as N(µk,Σ) with the same covariance matrix,

where k = 1, 2. The linear discriminant scores are as follows:

δk(x) = xT Σ−1µk −

12µTk Σ

−1µk + log πk,

where πk = nk/n is the proportion of the number of observations in the training data belonging

to the class k, and the classification rule is given by argmaxkδk(x). Details for LDA can be found

in Mardia et al. (1979). Based on each training dataset, we can estimate the with-in class mean

vectors by

µk =1nk

∑i∈class-k

xi for i = 1, 2

and precistion matrix Σ−1 using the penalized loglikelihood method with three different penalty

functions: the LASSO, adaptive LASSO and SCAD. Tuning parameters in different methods

are chosen via six-fold cross-validation based on the training data. Note that the sample size n

is smaller than the dimensionality p in this case. As a result, the sample covariance matrix is

degenerate and cannot be used in the LDA.

To compare the prediction performance, we used specificity, sensitivity and also Matthews

Correlation Coefficient(MCC). They are defined as follows:

Specificity =TN

TN + FP, Sensitivity =

TPTP + FN

,

MCC =TP× TN− FP× FN√

(TP + FP)(TP + FN)(TN + FP)(TN + FN),

where TP, TN, FP, and FN are the numbers of true positives, true negatives, false positives,

and false negatives, respectively. MCC is widely used in machine learning as a measure of the

imsart-aoas ver. 2007/09/18 file: revised_version_0818.tex date: August 24, 2008

NETWORK EXPLORATION VIA THE ADAPTIVE LASSO AND SCAD PENALTIES 13

Fig 2. Gene networks derived using three penalties: the LASSO(left panel), the adaptive LASSO(middle panel),and the SCAD(right panel).

Table 2Result of pCR classification over 100 repetitions

specificity sensitivity MCC Nonzero elements in ΩLASSO 0.7675(0.0957) 0.6300(0.2134) 0.3656(0.1762) 3923(18)

adaptive LASSO 0.7869(0.0928) 0.6220(0.2182) 0.3810(0.1832) 1233(8)SCAD 0.7944(0.0982) 0.6340(0.2203) 0.4018(0.1964) 674(12)

quality of binary classifiers. It takes true and false positives and negatives into account and

is generally regarded as a balanced measure which can be used even if the classes are of very

different sizes. The larger the MCC is, the better the classification is. More details can be found

in Bladi et al (2000). Means and standard deviations (in parentheses) of specificity, sensitivity,

MCC, and number of non-zero elements in Ω over 100 repetitions are reported in Table 3.2. To

visually interpret the gene network derived by our penalized likelihood methods, we applied our

whole estimation scheme to all the 130 datasets: 1) use a two sample t-test to select 110 genes;

2) use the penalized likelihood estimation scheme to derive the precision matrix estimates. Next

we try to show the corresponding gene networks derived by using three different penalties. To

gain a better view, we only plot the gene networks of the 60 genes with the smallest p-values

among the 110 genes in Figure 2.

From the table, we can see that the adaptive LASSO and SCAD improve over the LASSO in

terms of the specificity and MCC while all three penalties give similar sensitivity. Furthermore,

when we look at the number of non-zero elements of the precision matrix estimates using three

imsart-aoas ver. 2007/09/18 file: revised_version_0818.tex date: August 24, 2008

14 J. FAN, Y. FENG AND Y. WU

different penalties, we can see again that by using the adaptive LASSO and SCAD penalties,

we can get much simpler models which are often more desirable. From Figure 2, it is clear that

compared with the network derived using LASSO penalty, the ones derived using the adaptive

LASSO and SCAD penalties both show some small clusters, indicating block diagonal precision

matrices. This is worthwhile for further study.

4. Monte Carlo simulation. In this section, we use simulations to examine the perfor-

mance of the penalized log-likelihood approach proposed in Section 2 to estimate the precision

matrix with different penalties. In the first three examples, we set the dimensionality p = 30.

Three different data generating settings for the 30 × 30 precision matrix Ω are considered in

Examples 4.1, 4.2 and 4.3. In Example 4.4 and Example 4.5, we consider the corresponding

high dimensional case with p = 200 for Example 4.1 and Example 4.2, respectively. In each

example, we first generate a true precision matrix Ω which will be fixed for the whole example.

Next we generate a data set of n = 120 i.i.d. random vectors distributed as N(0,Ω−1). For

each simulated dataset and each penalty, a 6-fold cross-validation scheme is used to tune the

regularization parameter as discussed in Section 2.3.

To compare the performance of different estimators corresponding to three penalty functions

under consideration: the LASSO, adaptive LASSO and SCAD, we use two types of loss functions:

the entropy loss and the quadratic loss (Lin and Perlman, 1985) defined by

loss1(Ω, Ω) = trΩ−1Ω− log |Ω−1Ω| − n and loss2(Ω, Ω) = tr(Ω−1Ω− I)2,

respectively, where Ω is an estimate of the true precision matrix Ω. To evaluate the performance

of the three different penalties concerning sparsity, we report two types of error regarding zero

elements: zero1 means the number of type-I errors (i.e., the true entry of the precision matrix

is non-zero but the corresponding estimate is zero) and zero2 the number of type-II errors (i.e.,

the true entry is zero but its estimator is non-zero). Ideally, we would like to have small zero1

and zero2. We also calculate the relative error rates: rate1 = zero1/N1 and rate2 = zero2/N2,

where N1 and N2 are the number of zeros and non-zeros of the true precision matrix respectively.

Results of loss1, loss2, zero1, zero2, rate1 and rate2 over 100 simulations are reported for each

simulation example. We will summarize the performance at the end of this section.

imsart-aoas ver. 2007/09/18 file: revised_version_0818.tex date: August 24, 2008

NETWORK EXPLORATION VIA THE ADAPTIVE LASSO AND SCAD PENALTIES 15

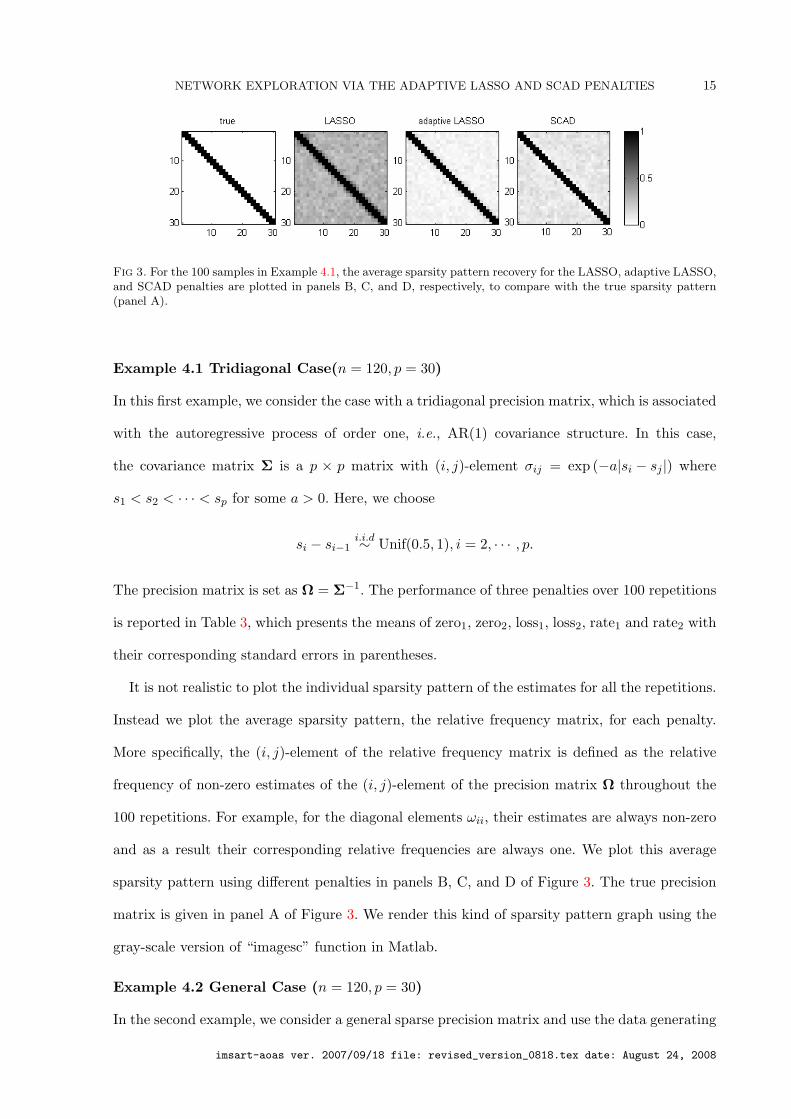
Fig 3. For the 100 samples in Example 4.1, the average sparsity pattern recovery for the LASSO, adaptive LASSO,and SCAD penalties are plotted in panels B, C, and D, respectively, to compare with the true sparsity pattern(panel A).

Example 4.1 Tridiagonal Case(n = 120, p = 30)

In this first example, we consider the case with a tridiagonal precision matrix, which is associated

with the autoregressive process of order one, i.e., AR(1) covariance structure. In this case,

the covariance matrix Σ is a p × p matrix with (i, j)-element σij = exp (−a|si − sj |) where

s1 < s2 < · · · < sp for some a > 0. Here, we choose

si − si−1i.i.d∼ Unif(0.5, 1), i = 2, · · · , p.

The precision matrix is set as Ω = Σ−1. The performance of three penalties over 100 repetitions

is reported in Table 3, which presents the means of zero1, zero2, loss1, loss2, rate1 and rate2 with

their corresponding standard errors in parentheses.

It is not realistic to plot the individual sparsity pattern of the estimates for all the repetitions.

Instead we plot the average sparsity pattern, the relative frequency matrix, for each penalty.

More specifically, the (i, j)-element of the relative frequency matrix is defined as the relative

frequency of non-zero estimates of the (i, j)-element of the precision matrix Ω throughout the

100 repetitions. For example, for the diagonal elements ωii, their estimates are always non-zero

and as a result their corresponding relative frequencies are always one. We plot this average

sparsity pattern using different penalties in panels B, C, and D of Figure 3. The true precision

matrix is given in panel A of Figure 3. We render this kind of sparsity pattern graph using the

gray-scale version of “imagesc” function in Matlab.

Example 4.2 General Case (n = 120, p = 30)

In the second example, we consider a general sparse precision matrix and use the data generating

imsart-aoas ver. 2007/09/18 file: revised_version_0818.tex date: August 24, 2008

16 J. FAN, Y. FENG AND Y. WU

Fig 4. For the 100 samples in Example 4.2, the average sparsity pattern recovery for the LASSO, adaptive LASSO,and SCAD penalties are plotted in panels B, C, and D, respectively, to compare with the true sparsity pattern(panel A).

scheme of Li and Gui (2006). More specifically, we generate p points randomly on the unit square

and calculate all their pairwise distances. For each point, define its k nearest neighbors as those

with k smallest distances to this point. By choosing different number k, we can obtain graphs

for this model with different degrees of sparsity. For each “edge”, the corresponding element in

the precision matrix is generated uniformly over [−1, 0.5]∪ [0.5, 1]. The value of the ith diagonal

entry is set as a factor of the sum of the absolute values of ith row elements excluding the

diagonal entry. Here, we chose a factor of 2 to ensure that the obtained precision matrix is

positive definite. Finally, each row is divided by the corresponding diagonal element so that the

final precision matrix has diagonal elements of ones. Numerical results are summarized in Figure

4 and Table 4.

Example 4.3 Exponential Decay Matrix (n = 120, p = 30)

In this example, we consider the case that no element of the precision matrix is exactly zero.

The (i, j)-element of the true precision matrix is given by ωij = exp(−2|i − j|), which can be

extremely small when |i− j| is large. Numerical results over 100 repetitions in the same format

as Example 4.1 are reported in Table 5 and Figure 5. Notice in Figure 5, panel A shows sparsity

pattern since we apply the threshold to the true precision matrix as to the three estimates.

Example 4.4 High Dimensional Tridiagonal Case (n = 120, p = 200)

The previous three examples belong to the classical setting with dimensionality p smaller than

the sample size n. Next we investigate the high dimensional case with p > n. In this example, we

keep all the data generation setting of Example 4.1 except that we increase the dimensionality

imsart-aoas ver. 2007/09/18 file: revised_version_0818.tex date: August 24, 2008

NETWORK EXPLORATION VIA THE ADAPTIVE LASSO AND SCAD PENALTIES 17

Fig 5. For the 100 samples in Example 4.3, the average sparsity pattern recovery for the LASSO, adaptive LASSO,and SCAD penalties are plotted in panels B, C, and D, respectively, to compare with the true sparsity pattern(panel A).

Fig 6. For the 100 samples in Example 4.4, the average sparsity pattern recovery for the LASSO, adaptive LASSO,and SCAD penalties are plotted in panels B, C, and D, respectively, to compare with the true sparsity pattern(panel A).

p to 200. The simulation result is reported in Table 6 and Figure 6.

Example 4.5 High Dimensional General Case (n = 120, p = 200)

In this example, we use the same setting of Example 4.2 but increase p to 200 as we did in

Example 4.4. The simulation results are summarized in Table 7 and Figure 7.

Throughout all these different examples, we can see that, the LASSO penalty in general pro-

duces more non-zero elements in the estimated precision matrix than the adaptive LASSO and

SCAD penalties. Based on Tables 3-7, improvements are observed for the adaptive LASSO and

SCAD penalties over the LASSO penalty in terms of the two types of loss functions (especially

the second type) and as well as the two types of errors regarding zero elements.

imsart-aoas ver. 2007/09/18 file: revised_version_0818.tex date: August 24, 2008

18 J. FAN, Y. FENG AND Y. WU

Fig 7. For the 100 samples in Example 4.5, the average sparsity pattern recovery for the LASSO, adaptive LASSO,and SCAD penalties are plotted in panels B, C, and D, respectively, to compare with the true sparsity pattern(panel A).

5. Theoretical properties. In this section, we provide some theoretical justifications. We

first prove that the penalized log-likelihood function is increasing in each iteration using the LLA

algorithm.The oracle properties of the SCAD and adaptive LASSO penalties will be established

in our context.

Without loss of generality, we may consider the case that the random vector is normally

distributed with mean zero, i.e., X ∼ N(0,Σ0), where 0 is a vector of zeros and Σ0 is the true

unknown p × p covariance matrix. The corresponding true precision matrix is Ω0 = Σ−10 . Our

sample consists of n independent and identically distributed observations x1,x2, · · · ,xn. In this

case, the sample covariance matrix is defined by

(5.1) Σ =n∑i=1

xixTi /n.

Theorem 5.1. For a differentiable concave penalty function pλ(.) on [0,∞], the penalized

log-likelihood function is increasing through each iteration in the LLA approximation.

See Appendix for the proof of Theorem 5.1.

Theorem 5.2. For n i.i.d. observations x1,x2, · · · ,xn from N(0,Σ0), the optimizer Ω of

the SCAD penalized log-likelihood function (2.4) with sample covariance given by (5.1) has the

oracle property in the sense of Fan and Li (2001) when λ → 0 and√nλ → ∞ as n → ∞.

Namely,

(1) Asymptotically, the estimate Ω has the same sparsity pattern as the true precision matrix

Ω0.

imsart-aoas ver. 2007/09/18 file: revised_version_0818.tex date: August 24, 2008

NETWORK EXPLORATION VIA THE ADAPTIVE LASSO AND SCAD PENALTIES 19

(2) The non-zero entries of the Ω are√n-consistent and asymptotically normal.

See Appendix for the proof of Theorem 5.2.

Theorem 5.3. When√nλ = Op(1) and λ

√naγn → ∞ as n → ∞, the oracle property also

holds for the adaptive LASSO penalty with weights specified by wij = 1/|wij |γ for some γ > 0

and any an-consistent estimator Ω = (ωij)1≤i,j≤p, i.e., an(Ω−Ω0) = Op(1).

See Appendix for the proof of Theorem 5.3.

6. Discussion. In this work, we study the estimation of sparse precision matrices. To at-

tenuate bias issue, we introduce the adaptive LASSO and SCAD penalties. Through the local

linear approximation to the non-concave penalty function like SCAD, the graphical glasso algo-

rithm of Friedman et al. (2008) is used to solve the penalized likelihood problem with a weighted

L1 penalty. Simulation and real data analysis show improvement of the adaptive LASSO and

SCAD over the LASSO. Theoretical justification is provided as well.

APPENDIX A: APPENDIX

Proof of Theorem 5.1. Define

(A.1) Qλ(Ω) = log det Ω− < Σ,Ω > −n∑i=1

n∑j=1

pλ(|ωij |)

and

(A.2) Φλ(Ω|Ω) = log det Ω− < Σ,Ω > −n∑i=1

n∑j=1

[pλ(|ωij |) + p′λ(|ωij |)(|ωij | − |ωij |)]

Then, given estimate Ω(k)

, we have

(A.3) Ω(k+1)

= argmaxΩ∈SpΦλ(Ω|Ω(k)

)

We want to prove that Qλ(Ω(k+1)

) ≥ Qλ(Ω(k)

). At the kth-step, consider

(A.4) Qλ(Ω)− Φλ(Ω|Ω(k)) =

n∑i=1

n∑j=1

pλ(|ω(k)ij |) + p′λ(|ω(k)

ij |)(|ωij | − |ω(k)ij |)− pλ(|ωij |)

imsart-aoas ver. 2007/09/18 file: revised_version_0818.tex date: August 24, 2008

20 J. FAN, Y. FENG AND Y. WU

By the concavity of pλ(.), we have pλ(|ω(k)ij |) + p′λ(|ω(k)

ij |)(|ωij | − |ω(k)ij |)− pλ(|ωij |) ≥ 0. Then, we

have Qλ(Ω) ≥ Φλ(Ω|Ω(k)). Finally, by noticing that Qλ(Ω

(k)) = Φλ(Ω

(k)|Ω(k)) and using (A.3),

(A.5) Qλ(Ω(k+1)

) ≥ Φλ(Ω(k+1)|Ω(k)

) ≥ Φλ(Ω(k)|Ω(k)

) = Qλ(Ω(k)

)

Proof of Theorem 5.2. It is enough to check Conditions (A-C) of Fan and Li (2001). Since

xi is i.i.d. as X ∼ N(0,Σ0). The probability density function for X is given by f(x,Ω0) =

exp(−xTΩ0x/2)√

det Ω0/(2π). The log-likelihood function of the precision matrix is given by

n∑i=1

12

(log det Ω− xTi Ωxi) =n

2(log det Ω− 1

n

n∑i=1

xTi Ωxi)

=n

2(log det Ω− tr(ΩΣ))

up to a constant, where tr(·) denotes the trace operator. This justifies the log-likelihood function

given in Section 2 as well.

Notice that

EΩ0(∂ log f(x,Ω)

∂ωij) |Ω=Ω0=

12EΩ

∂ωij(log det Ω− xTΩx) |Ω=Ω0

which reduces to (−1)i+j det Ω0,−ij/(det Ω0)−σ0,ij when i 6= j and 12(det Ω0,−ii/(det Ω0)−σ0,ii)

when i = j, where Ω0,−ij denotes the matrix after removing the ith row and jth column

from Ω0 and σ0,ij is the (i, j)-element of the covariance matrix Σ0. Note that Ω0 = Σ−10 .

So (−1)i+j det Ω0,−ij/(det Ω0) − σ0,ij = 0 for i 6= j and 12(det Ω0,−ii/(det Ω0) − σ0,ii) = 0

when i = j, as we desired. That is, EΩ0(∂ log f(x,Ω)∂ωij

) |Ω=Ω0= 0. Similarly, we can show that

EΩ0

(∂

∂ωijlog f(x,Ω) ∂

∂ωkllog f(x,Ω)

)|Ω=Ω0= EΩ0(− ∂2

∂ωij∂ωkllog f(x,Ω)) |Ω=Ω0 . So Condition

(A) is satisfied by noting that f(x,Ω) has a common support and the model is identifiable.

To prove Condition (B), it is sufficient to prove that the log-det function is concave. More

explicitly, for the log-det function h(Ω) = log det Ω, we can verify concavity by considering an

arbitrary line, give by Ω = Z + tV , where Z, V ∈ Sp. We define g(t) = h(Z + tV ), and restrict g

to the interval of values of t for which Z + tV ∈ Sp. Without loss of generality, we can assume

imsart-aoas ver. 2007/09/18 file: revised_version_0818.tex date: August 24, 2008

NETWORK EXPLORATION VIA THE ADAPTIVE LASSO AND SCAD PENALTIES 21

t = 0 is inside the interval, i.e. Z ∈ Sp. We have

g(t) = log det(Z + tV )

= log det(Z1/2(I + tZ−1/2V Z−1/2)Z1/2)

=p∑i=1

log(1 + tλi) + log detZ

where λ1, · · · , λp are the eigenvalues of Z−1/2V Z−1/2. Therefore, we have

g′(t) =p∑i=1

λi1 + tλi

, g′′(t) = −p∑i=1

λ2i

(1 + tλi)2

Since g′′(t) ≤ 0, we conclude that h is concave.

Condition (C) is easy to satisfy because the third order derivative does not involve x.

Proof of Theorem 5.3. First of all, to simplify our notation, we write Ω as a vector in the

following way: divide the indexes of Ω0 = (ω0ij), i, j = 1, · · · , p to two parts: A = (i, j), ω0ij 6=

0 & i ≤ j and B = (i, j), ω0ij = 0 & i ≤ j. Denoting Ω in a vector format, we write

β = (β1,β2), where β1 = (ωij , (i, j) ∈ A) and β2 = (ωij , (i, j) ∈ B). As a result, β has the

length of d = p(p+1)/2. In this way, Ω can be considered as a function of β: Ω = Ω(β). Denote

the true value of β as β0 = (β10,β20) = (β10,0), where the nonzero part β10 has the length of

s.

In the adaptive LASSO penalty setting, we define

Q(β) = L(β)− nλn(|β|−γ)T |β|,

where L(β) =∑ni=1 li(Ω(β)) = n

2 log |Ω|−n2 log(2π)−

∑ni=1

12x

Ti Ωxi is the log-likelihood function

and β = (β1, β2, · · · , βd) is a an-consistent estimator of β, i.e., an(β−β0) = Op(1). In addition,

we denote I(β) = E[ ∂∂β l(β)][ ∂∂β l(β)]T be the Fisher information matrix.

Let τn = n−1/2, we want to show that for any given ε > 0, there exists a large constant C

such that

(A.6) P

sup‖u‖=C

Q(β0 + τnu) < Q(β0)

≥ 1− ε

This implies that with probability at least 1 − ε that there exists a local maximum in the ball

β0 + τnu : ‖u‖ ≤ C. Hence there exists a local maximizer such that ‖β − β0‖ = Op(τn).

imsart-aoas ver. 2007/09/18 file: revised_version_0818.tex date: August 24, 2008

22 J. FAN, Y. FENG AND Y. WU

From the fact that only the first s elements of β0 are non-zero, we have

Dn(u) = Q(β0 + τnu)−Q(β0)

≤ L(β0 + τnu)− L(β0)− nλns∑j=1

|βj |−γ(|βj0 + τnu| − |βj0|)

= τnL′(β0)Tu− 1

2nτ2

nuT I(β0)u1 + op(1) − nλnτn

s∑j=1

|βj |−γsgn(βj0)uj

= n−1/2L′(β0)Tu− 12uT I(β0)u1 + op(1) − n1/2λn

s∑j=1

|βj |−γsgn(βj0)uj(A.7)

Note that n−1/2L′(β0) = Op(1). Thus the first term on the right hand side of (A.7) is on the

order Op(1). For the third term of (A.7), we have |βj |−γ = Op(1) for j = 1, · · · , s since β is

a consistent estimator of β0 and βj0 6= 0. Thus, the third term is also on the order of Op(1)

from the assumption that n1/2λn = Op(1). By choosing a sufficiently large C, the second term

dominates the first term and the third term uniformly in ‖u‖ = C. Then (A.6) holds.

Now, we want to show that with probability tending to 1 as n → ∞, for any β1 satisfying

β1 − β10 = Op(n−1/2) and any constant C,

(A.8) Q

(β1

0

)= max‖β2‖≤Cn−1/2

Q

(β1

β2

).

Denote β∗ =(β1

0

), and β =

(β1β2

)= β∗+ n−1/2u, where ‖u‖ ≤ C and uj = 0 for all j = 1, · · · , s.

Follow the same reasoning before,

Q(β∗ + n−1/2u)−Q(β∗)

= n−1/2L′(β∗)Tu− 12uT I(β∗)u1 + op(1) − n1/2λn

d∑j=s+1

|βj |−γ |uj |(A.9)

Since C is a fixed constant, the second term on the right hand side of (A.9) will be at the

order of Op(1). For j = s + 1, · · · , d, we have βj0 = 0. Again, by an consistency of β, we have

an|βj | = Op(1) as n → ∞. Thus, the order of the third term of (A.9) is n1/2λnaγn → ∞ as

n → ∞ by our assumption. Hence (A.8) holds. This completes the proof of the sparsity part.

The asymptotic normality of the estimator can be derived from Fan and Li (2001).

REFERENCES

Akaike, H. (1973). Information theory as an extension of the maximum likelihood principle. Second international

symposium on information theory 267–281.

imsart-aoas ver. 2007/09/18 file: revised_version_0818.tex date: August 24, 2008

NETWORK EXPLORATION VIA THE ADAPTIVE LASSO AND SCAD PENALTIES 23

Baldi, P, Brunak, S., Chauvin, Y., Andersen, C. A. F. and Nielsen, H. Assessing the accuracy of prediction

algorithms for classification: an overview. Bioinformatics, 16, 412-424.

Banerjee, O., Ghaoui, L. E. and d’Aspremont, A. (2007). Model selection through sparse maximum likelihood

estimation. Journal of Machine Learning Research, to appear.

Breiman, L. (1996). Heuristics of instability and stablizition in model selection. The Annals of Statistics, 24

2350–2383.

d’Aspremont, A., Banerjee, O. and Ghaoui, L. E. (2005). First-order methods for sparse covariance selection.

SIAM Journal on Matrix Analysis and its Applications, to appear.

Dempster, A. P. (1972). Covariance selection. Biometrics, 28 157–175.

Dobra, A., Hans, C., Jones, B., Nevins, J. R., Yao, G. and West, M. (2004). Sparse graphical models for

exploring gene expression data. Journal of Multivariate Analysis, 90 196–212.

Drton, M. and Perlman, M. (2004). Model selection for gaussian concentration graphs. Biometrika, 91 591–602.

Edwards, D. M. (2000). Introduction to Graphical Modelling. Springer, New York.

Efron, B., Hastie, T., Johnstone, I. and Tibshirani, R. (2004). Least angle regression (with discussions). The

Annals of Statistics, 32 409-499.

Fan, J. (1997). Comments on ”wavelets in statistics: A review,” by A. Antoniadis. Journal of Italian Statisitcal

Society, 6 131–138.

Fan, J. and Li, R. (2001). Variable selection via nonconcave penalized likelihood and its oracle properties. Journal

of the American Statistical Association, 96 1348–1360.

Fan, J. and Peng, H. (2004). Nonconcave Penalized Likelihood with a Diverging Number of Parameters. The

Annals of Statistics, 32 928-961.

Fan, J. and Fan, Y.(2008). High Dimensional Classification Using Features Annealed Independence Rules. The

Annals of Statistics, to appear.

Friedman J., Hastie, T. and Tibshirani, R.(2008) Sparse inverse covariance estimation with the graphical

lasso. Biostatistics, 9,3 432-441.

Hess, R.K., Anderson, K., Symmans, W.F., Valero, V., Ibrahim, N., textscMejia, J.A., Booser, D., The-

riault, R.L., Buzdar, A.U., Dempsey, P.J., Rouzier, R., Sneige, N., Ross, J.S., Vidaurre, T., Go’mez,

H.L., Hortobagyi, G.N., and PUsztai, L.(2006). Pharmacogenomic Predictor of Sensitivity to Preopera-

tive Chemotherapy With Paclitaxel and Fluorouracil, Doxorubicin, and Cyclophosphamide in Breast Cancer.

Journal of Clinical Oncology, 24 4236-4244.

Huang, J., Liu, N., Pourahmadi, M., and Liu, L.(2006). Covariance matrix selection and estimation via

penalised normal likelihood. Biometrika, 93 85-98.

Hunter, D. R. and Li, R. (2005). Variable selection using mm algorithm. The Annals of Statistics, 33 1617-1642.

Jemal, A., Murray, T., Ward, E., et al.(2005) Cancer Statistics. CA Cancer J Clin 2005, 55(1) 10-30.

Kuerer HM, Newman LA, Smith TL, et al. 1999;17:460C9.

imsart-aoas ver. 2007/09/18 file: revised_version_0818.tex date: August 24, 2008

24 J. FAN, Y. FENG AND Y. WU

Kuerer H.M., Newman L.A., Smith. T.L., et al..(1999). Clinical course of breast cancer patients with complete

pathologic primary tumor and axillary lymph node response to doxorubicin-based neoadjuvant chemotherapy.

J Clin Oncol, 17 460-469.

Lam, C and Fan, J (2007). Consistency and Oracle Properties in Large Covariance Matrices Estimation.

Manuscript.

Levina, E., Zhu, J. and Rothman, A.J. (2007). Sparse Estimation of Large Covariance Matrices via a Nested

Lasso Penalty. The Annals of Applied Statistics, to appear.

Li, H. and Gui, J. (2006). Gradient directed regularization for sparse gaussian concentration graphs, with

applications to inference of genetic networks. Biostatistics, 7 302–317.

Lin, S. P. and Perlman, M. D. (1985). A monte carlo comparison of four estimators of a covariance matrix.

Multivariate Analysis, 6 411–429.

Mardia, K.V., Kent, J.T., and Bibby, J.M.(1979) Multivariate Analysis. Academic Press, New York.

Meinshausen, N. and Buhlmann, P. (2006). High-dimensional graphs with the lasso. The Annals of Statistics,

34 1436–1462.

Rothman, A.J., Bickel, P.J., Levina, E., and Zhu, J(2008). Sparse Permutation Invariant Covariance Esti-

mation. Electronic Journal of Statistics, 2 494-515.

Schafer, J. and Strimmer, K. (2005). An empirical bayes approach to inferring large-scale gene association

networks. Bioinformatics, 21 754–764.

Shen, H., Huang, J.(2005). Analysis of call centre arrival data using singular value decomposition. Applied

Stochastic Models in Business and Industry, 21 251-263.

Tibshirani, R. J. (1996). Regression shrinkage and selection via the lasso. Journal of the Royal Statistical

Society, Series B, 58 267–288.

Vandenberghe, L., Boyd, S. and Wu, S.-P. (1998). Determinant maximization with linear matrix inequality

constraints. SIAM Journal of Matrix Analysis and Applications, 19 499–533.

Wong, F., Carter, C. K. and Kohn, R. (2003). Efficient estimation of covariance selection models. Biometrika,

90 809–830.

Yuan, M. and Lin, Y. (2007). Model election and estimation in the gaussian graphical model. Biometrika

pp.1–17.

Zou, H. (2006). The adaptive lasso and its oracle properties. Journal of the American Statistical Association,

101 1418–1429.

Zou, H. and Li, R. (2007). One-step sparse estimates in nonconcave penalized likelihood models (with discussion).

The Annals of Statistics, To appear.

imsart-aoas ver. 2007/09/18 file: revised_version_0818.tex date: August 24, 2008

NETWORK EXPLORATION VIA THE ADAPTIVE LASSO AND SCAD PENALTIES 25

Jianqing Fan, Yang Feng, Yichao Wu

Department of Operations Research and Financial Engineering

Princeton University

Princeton, NJ 08544

imsart-aoas ver. 2007/09/18 file: revised_version_0818.tex date: August 24, 2008

26 J. FAN, Y. FENG AND Y. WU

Table 3Simulation result of Example 4.1

loss1 loss2 zero1 zero2 rate1 rate2

LASSO 1.6402(0.1453) 11.0553(6.6401) 248.48(60.021) 0.02(0.2) 0.306(0.0739) 2e-04(0.0023)adaptive LASSO 1.1434(0.1581) 7.441(4.4481) 42.58(28.7129) 0.16(0.5453) 0.0524(0.0354) 0.0018(0.0062)

SCAD 0.8306(0.2476) 2.4944(3.7753) 76.89(23.58) 0.18(0.5752) 0.0947(0.029) 0.002(0.0065)

Table 4Simulation result of Example 4.2

loss1 loss2 zero1 zero2 rate1 rate2

LASSO 1.1132(0.1078) 9.0545(4.352) 125.66(39.7945) 34.62(8.2814) 0.1599(0.0506) 0.3037(0.0726)adaptive LASSO 1.1449(0.101) 2.9867(2.1677) 11.28(10.3495) 66.8(8.5328) 0.0144(0.0132) 0.586(0.0748)

SCAD 1.0415(0.1048) 0.81(1.1161) 62.72(26.7884) 45.96(9.3462) 0.0798(0.0341) 0.4032(0.082)

Table 5Simulation result of Example 4.3

loss1 loss2 zero1 zero2 rate1 rate2

LASSO 0.8804(0.0934) 10.7202(4.93) 88.54(34.3315) 126.94(12.5737) 0.1261(0.0489) 0.6411(0.0635)adaptive LASSO 0.8091(0.0717) 4.2482(2.9318) 5.08(6.7055) 161.62(6.1608) 0.0072(0.0096) 0.8163(0.0311)

SCAD 0.7535(0.0796) 0.7677(1.0677) 35.6(23.0327) 145.28(12.0923) 0.0507(0.0328) 0.7337(0.0611)

Table 6Simulation result of Example 4.4

loss1 loss2 zero1 zero2 rate1 rate2

LASSO 19.3101(0.4254) 1065.3699(82.5634) 4009.75(117.6035) 0.64(1.2352) 0.1018(0.003) 0.0011(0.0021)adaptive LASSO 12.4379(0.9165) 664.4575(129.345) 269.86(61.9744) 7.76(4.1124) 0.0068(0.0016) 0.013(0.0069)

SCAD 10.5493(0.4842) 288.2603(62.3401) 3478.76(106.7267) 1.1(1.6667) 0.0883(0.0027) 0.0018(0.0028)

Table 7Simulation result of Example 4.5

loss1 loss2 zero1 zero2 rate1 rate2

LASSO 8.2416(0.2705) 1082.6086(112.6144) 796.16(264.663) 255.22(13.5703) 0.0202(0.0067) 0.4674(0.0249)adaptive LASSO 6.5035(0.2088) 316.953(53.9925) 6.58(4.9179) 336.24(4.5062) 2e-04(1e-04) 0.6158(0.0083)

SCAD 6.6458(0.3991) 32.3339(23.0641) 224.98(247.4514) 298.12(21.2438) 0.0057(0.0063) 0.546(0.0389)

imsart-aoas ver. 2007/09/18 file: revised_version_0818.tex date: August 24, 2008


Recommended