82
Network Troubleshooting Identifying and Solving Problems on the Network
| Date post: | 25-Dec-2015 |
| Category: |
Documents |
| Upload: | morris-short |
| View: | 220 times |
| Download: | 2 times |

Network Troubleshooting
Identifying and Solving Problems on the Network

CAN5105 2
Focus: Basics and Standard Tools
Solving network problems depends a lot on your understanding
Simple tools can tell you what you need to know
Example: pingping is incredibly useful! What does ping stand for? What are the switches available…

CAN5105 3
Troubleshooting Avoid it by:
redundancy documentation training
Try quick fixes first simple problems often have big effects: is the power on? is the network cable plugged into the right socket? Is LED flashing? has anything changed recently?
Change only one thing at a time test thoroughly after the change
Be familiar with the system maintain documentation
Be familiar with your tools before trouble strikes
CAN5105 4
Troubleshooting: Learn as you go Study and be familiar with the normal
behaviour of your network Monitoring tools can tell you when things
are wrong if you know what things look like when they
are right
Using tools such as Ethereal can help you understand your network, and TCP/IP — better

CAN5105 5
Documentation
Maintain an inventory of equipment and software a list mapping MAC addresses to hostnames can be very
helpful Maintain a change log for each major system, recording:
each significant change each problem with the system each entry dated, with name of person who made the entry
Two categories of documentation: Configuration information
• describes the system• use system tools to obtain a snapshot, e.g., sysreport in Red Hat
Linux Procedural information
• How to do things• use tools that automatically document what you are doing, e.g.,
script

CAN5105 6
Purchasing Equipment
Better to: spend enough for the short term (one or two years) or “invest for the long term?”
Moore’s Law: exponential growth… Maintenance costs more for older equipment Count all the costs (TCO vs. NCO) Conclusion: often (but not always), getting
cheaper equipment to cover needs for the next two years will save money
Buying excess capacity can waste a lot of money

CAN5105 7
Host Network Configuration tools
ps — information about processes top — dynamic information about processes netstat — show connections and services, routing ifconfig — shows and changes network interfaces route — shows, changes routing table ip — show, change, set network configuration arp — shows MAC addresses nmap — port scanner: shows open ports, identifies OS

CAN5105 8
netstat –tua shows all network connections, including those listening
netstat –tu shows only connections that are established
netstat –i is like ifconfig, shows info and stats about each interface
netstat –nr shows the routing table, like route –n
Windows provides netstat also.
Using netstat -tua

CAN5105 9
ifconfig
ifconfig eth0 — show stats on network interface eth0 sudo ifconfig lo 127.0.0.1 — configure the loopback
interface, start it up sudo ifconfig eth0 172.19.233.5 netmask
255.255.255.0 — configure eth0 with IP address 172.19.233.5/24
ifconfig — show all configured network interfaces ifconfig –a — show all interfaces, including those not
configured yet.

CAN5105 10
route
route –n — print routing tableroute add 127.0.0.1 — add a route to localhost; should have been done automatically by ifconfig
route add –net 172.19.233.0 — add a route to the eth0 configured on previous slide should have been done automatically by ifconfig
route add 172.19.64.0 gw 172.19.233.254 — add a static route to network 172.19.64.0 through router 172.19.233.254
route add default gw 172.19.233.253 — add a default route to 172.19.233.253 through eth0

CAN5105 11
Connectivity Testing: Cabling
Label cables clearly at each end Cable testers
ensure wired correctly, check: attenuation length — is it too long?
• 100BaseT: less than 100m
Is the activity light on the interface blinking?

CAN5105 12
Software tools: ping
Most useful check of connectivity Universal If ping hostname, includes a rough check of DNS Sends an ICMP (Internet Control Message
Protocol) ECHO_REQUEST Waits for an ICMP ECHO_REPLY Most pings can display round trip time Most pings can allow setting size of packet Can use to make a crude measurement of
throughput

CAN5105 13
Example:
ping with packet size = 100 bytes, round-trip time = 30ms ping with packet size = 1100 bytes, round-trip time =
60ms So takes 30ms extra (15ms one way) to send additional
1000 bytes, or 8000 bits Throughput is roughly 8000 bits per 15ms, or about
540,000 bits per second A very crude measurement: no account for other traffic,
treats all links on path, there and back, as one.
Ping:Roughly Estimating Throughput

CAN5105 14
This can be expressed as a simple formula:
packet smallfor timeping tripround
packet largefor timeping tripround
packet small of size
packet large of size
wheresecond,per bits 16
s
l
s
l
sl
sl
t
t
P
P
tt
PPTP
Ping:Roughly Estimating Throughput

CAN5105 15
What ping Result is Good, Bad? A steady stream of consistent replies
indicates probably okay Usually first reply takes longer due to ARP
lookups at each router After that, ARP results are cached
ICMP error messages can help understand results: Destination Network Unreachable indicates the
host doing ping cannot reach the network Destination Host Unreachable may come from
routers further away

CAN5105 16
How to Use ping?
Ensure local host networking is enabled first: ping localhost, local IP address
ping a known host on local network ping local and remote interfaces on router ping by IP as well as by hostname if
hostname ping fails confirm DNS with dig (or nslookup) — see
later
ping from more than one host

CAN5105 17
fping: flood ping
Designed to test a large number of hosts more efficient than ping Used extensively by monitoring software
such as mon: http://www.kernel.org/software/mon/, nagios: http://www.nagios.org/
take care not to flood too much!

CAN5105 18
arping: uses ARP requests
Limited to local network Can work with MAC or IP addresses use to probe for ARP entries in router
(very useful!) packet filtering
can block ICMP pings, but won't block ARP requests

CAN5105 19
Path Discovery: traceroute
Sends UDP packets (Microsoft tracert sends ICMP packets)
increments Time to Live (TTL) in IP packet header
Sends three packets at each TTL records round trip time for each increases TTL until enough to reach
destination

CAN5105 20
traceroute: How it Works
As IP packets pass through each router, TTL in IP header is decremented
Packet is discarded when TTL decrements to 0
ROUTER sends ICMP TIME_EXCEEDED message back to traceroute host
When UPD packet reaches destination, gets ICMP PORT_UNREACHABLE, since uses an unused high UDP port

CAN5105 21
traceroute limitations
Each router has a number of IP addresses but traceroute only shows the one it
used get different addresses when run traceroute from other end
sometimes route is asymmetric router may be configured to not send
ICMP TIME_EXCEEDED messages get stars: * instead of round-trip time in traceroute output

CAN5105 22
Three main sources of delay: transmission delay — time to put signal
onto cable or media depends on transmission rate and size of
frame
propagation delay — time for signal to travel across the media determined by type of media and distance
queuing delay — time spent waiting for retransmission in a router or switch
Performance Measurements - Delay

CAN5105 23
Performance Measurements
bandwidth — the transmission rate through the link relates to transmission time
throughput — amount of data that can be sent over link in given time relates to all causes of delay is not the same as bandwidth
Other measurements needed i.e., for quality of service for multimedia

CAN5105 24
Measure throughput between two remote hosts: may use tools like ping
ping two locations with two packet sizes (4 pings altogether, minimum)
Example:
Address RTT 100 bytes RTT 1100 bytes
205.153.61.1 1.380 ms 5.805 ms
205.153.60.2 4.985 ms 12.823 ms
165.166.36.17 8.621 ms 26.713 ms
Throughput – Measuring with ping

CAN5105 25
Time difference / 2 (round trip time (RTT) -> one way) Divide by size difference in bits: 8000 Multiply by 1000 (ms -> seconds) Convert bps to Mbps
Address RTT 100 bytes RTT 1100 bytes
205.153.61.1 1.380 ms 5.805 ms
205.153.60.2 4.985 ms 12.823 ms
165.166.36.17 8.621 ms 26.713 ms
Near link Far Link Time difference Est. Throughput
205.153.61.1 205.153.60.2 3.413 ms 4.69 Mbps
205.153.60.2 165.166.36.17 10.254 ms 1.56 Mbps
Throughput – Measuring with ping

CAN5105 26
linkfar packet tomaller for timeping
linkfar packet toarger for timeping
linknear packet tomaller for timeping
linknear packet toarger for timeping
sizepacket maller
sizepacket arger
)/()(16
2
2
1
1
1122
st
lt
st
lt
sP
lP
ttttPPTP
s
l
s
l
s
l
slslsl
Throughput – Measuring with ping

CAN5105 27
32
32
31
31
1122
10985.4
10823.12
10380.1
10805.5
100
1100
)/()(16
s
l
s
l
s
l
slslsl
t
t
t
t
P
P
ttttPPTP
Throughput – Measuring with ping

CAN5105 28
Completing calculation for throughput between 205.153.61.1 and 205.153.61.2:
Mbps 69.4
958,687,4
10)380.1805.5985.4823.12/(()1001100(16
:ist throughpuso
10413.3
10)380.1805.5985.4823.12(
:difference timeThe
100
1100
3
3
31122
TP
tttt
P
P
slsl
s
l
Throughput – Measuring with ping

CAN5105 29
Path Performance: Other tools
Could use a tool like pathchar, bing, clink, pchar, or tmetric that performs this calculation for you
Use http://www.google.com to locate these tools
pathchar is only available in binary form Others in source form, need compile with
commands something like this:$ cd bing-1.1.3$ make$ sudo make install
CAN5105 30
Path Performance: measuring
May use ftp to transfer a large file, measure time tests whole path problem: affected by disk I/O
Use ttcp (test TCP), not affected by disk I/O
Consists of a client and server Need have installed at both ends Part of Red Hat Linux, Cisco IOS

CAN5105 31
Example of use of ttcp
First, start receiver:$ ttcp -r -sttcp-r: buflen=8192, nbuf=2048, align=16384/0, port=5001 tcpttcp-r: socketttcp-r: accept from 172.19.32.30ttcp-r: 16777216 bytes in 1.45 real seconds = 11285.88 KB/sec +++ttcp-r: 9704 I/O calls, msec/call = 0.15, calls/sec = 6684.46ttcp-r: 0.0user 0.2sys 0:01real 14% 0i+0d 0maxrss 0+2pf 0+0csw
Second, start transmitter:$ ttcp -t -s ictlabttcp-t: buflen=8192, nbuf=2048, align=16384/0, port=5001 tcp -> ictlabttcp-t: socketttcp-t: connectttcp-t: 16777216 bytes in 1.45 real seconds = 11335.64 KB/sec +++ttcp-t: 2048 I/O calls, msec/call = 0.72, calls/sec = 1416.95ttcp-t: 0.0user 0.0sys 0:01real 4% 0i+0d 0maxrss 0+2pf 0+0csw

CAN5105 32
The netstat program can show statistics about network interfaces
Linux netstat shows lost packets in three categories: errors, drops (queue full: shouldn’t happen!) overruns (last data overwritten by new data before old data
was read: shouldn’t happen!) drops and overruns indicate faulty flow control — bad!
These values are cumulative (since interface was up) Could put a load on interface to see current condition, with
ping –l, to send large number of packets to destination See the difference in values
Traffic Measurements: netstat -i

CAN5105 33
Here we run netstat –i (only in Unix)$ netstat -i
Iface MTU Met RX-OK RX-ERR RX-DRP RX-OVR TX-OK TX-ERR TX-DRP TX-OVR Flg
eth0 1500 0 407027830 0 0 0 1603191764 0 0 3 BMRU
lo 16436 0 2858402 0 0 0 2858402 0 0 0 LRU
Notice that of the 1.6 billion bytes transmitted, there were 3 overuns.
Next, blast the path you want to test with packets using ping –l or the spray program, and measure again.
Traffic Measurements: netstat -i

CAN5105 34
ifconfig give more information than netstat –i:
$ ifconfig eth0eth0 Link encap:Ethernet HWaddr 00:00:E2:35:AF:EE inet addr:172.19.64.52 Bcast:172.19.127.255
Mask:255.255.192.0 IPX/Ethernet 802.2 addr:33001601:0000E235AFEE UP BROADCAST RUNNING MULTICAST MTU:1500
Metric:1 RX packets:407579600 errors:0 dropped:0
overruns:0 frame:0 TX packets:1605655688 errors:0 dropped:0
overruns:3 carrier:0 collisions:0 txqueuelen:100 RX bytes:3055300191 (2913.7 Mb) TX
bytes:2048217058 (1953.3 Mb) Interrupt:18 Base address:0xd000
Traffic Measurements: ifconfig

Packet Capture
tcpdump, Ethereal (WireShark), ntop
CAN5105 36
What is Packet Capture?
Real time collection of data as it travels over networks
Tools called: packet sniffers packet analysers protocol analysers, and sometimes even traffic monitors

CAN5105 37
When Packet Capture?
Most powerful technique When need to see what client and server
are actually saying to each other When need to analyze type of traffic on
network Requires understanding of network
protocols to use effectively
CAN5105 38
Warning: Don’t Get Sacked!
Be sure that your boss agrees with you capturing packets on your company’s network
People have been sacked for doing this without permission!
Do not invade the privacy of others Capturing passwords with insecure
protocols such as telnet, ftp, http (that is not encrypted with TLS) is very easy DON’T DO IT!
CAN5105 39
tcpdump
Available everywhere Windows: http://windump.polito.it/ Syntax also used by other programs (such as
Ethereal) Often it is the only tool available, so good to
know Works by putting network interface into
promiscuous mode normal ethernet interface will ignore packets not
addressed to it in promiscuous mode, will examine all packets that
arrive, even those not addressed to it
CAN5105 40
How to use tcpdump
Can just type its name (as root):$ sudo tcpdump ...but get a huge amount of data! Can restrict the data collected using a
filter A filter may select addresses, protocols,
port numbers,...

CAN5105 41
tcpdump: some options -c n — capture a count of n packets then stop -w file — write raw data to file.
Very useful — can filter and analyze this later with tcpdump, Ethereal or other tools
but you cannot see what you are capturing till later! -i interface — collect from interface instead of lowest
numbered network interface -s bytes — collect no more than bytes of data from each packet
instead of default 68 bytes -e — show link level info, e.g., Ethernet addresses -x — gives a hexadecimal dump of packets
excluding link level data -X — display ASCII as well as hexadecimal if have –x option too Many more options: man tcpdump

CAN5105 42
tcpdump Filters: host and port
Show all network traffic to and from 192.168.0.1:
tcpdump host 192.168.0.1 Show packets to 192.168.0.1:tcpdump dst 192.168.0.1 Show packets to port 68 on 192.168.0.1:tcpdump dst 192.168.0.1 and port 68

CAN5105 43
tcpdump filters: networks
Capture traffic to or from 205.153.60/24:tcpdump net 172.19.64/18 can specify network as source or
destination:tcpdump src net 205.153.60/24tcpdump dst net 172.19.64/18

CAN5105 44
tcpdump filters: protocol
tcpdump ip tcpdump tcp tcpdump ip proto ospf This will catch DNS name lookups, but not
zone transfers (which use tcp): tcpdump udp port 53

CAN5105 45
tcpdump filters: combining
This will not work as you might expect: tcpdump host horus and udp or arp Instead, need group with parentheses,
and quote: tcpdump “host horus and (udp or arp)”
many more ways of filtering: man tcpdump

Your data starts here
Padding
4
5
3
1
2
0 4 8 12 16 20 24 28 31
Bits
Identification Fragmentation Offset
Header ChecksumProtocolTime to Live
Source Address
Destination Address
Type of ServiceIHLVersion Total Length
Wor
ds
Options (0 to 40 bytes)
5-16D
FM
F
IPv4 Header

Source Port
Your data starts here
Padding
Urgent Pointer
WindowReserved
Sequence Number
Acknowledgement Number
Destination Port
4
5
3
1
2
Wor
ds
0 4 8 12 16 20 24 28 31
Bits
Checksum
Options (0 to 40 bytes)
header
5-15
FIN
SYN
RST
length AC
K
PSH
UR
G
TCP Header

CAN5105 48
UDP Header
Source Port Destination Port
0 16 31
Bits
Your data starts here
ChecksumLength

CAN5105 49
Writing data to a file
sudo tcpdump -c 1000 -w ~/tmp/tcpdump.pcaptcpdump: listening on eth01014 packets received by filter
0 packets dropped by kernel

CAN5105 50
Reading a dumped file$ tcpdump -nr ~/tmp/tcpdump.pcap arp22:32:41.751452 arp who-has 172.19.127.254 tell 172.19.127.2922:32:41.863173 arp who-has 172.19.64.52 tell 172.19.64.6322:32:41.863198 arp reply 172.19.64.52 is-at 0:0:e2:35:af:ee22:32:42.082584 arp who-has 172.19.65.16 tell 172.19.125.22922:32:43.113655 arp who-has 172.19.123.211 tell 172.19.65.222:32:44.635149 arp who-has 172.19.65.16 tell 172.19.127.10622:32:44.874117 arp who-has 172.19.65.6 tell 172.19.126.17422:32:45.147178 arp who-has 172.19.65.16 tell 172.19.126.24022:32:45.209507 arp who-has 172.19.127.254 tell 172.19.125.12722:32:45.212484 arp who-has 172.19.127.175 tell 172.19.125.12722:32:45.239445 arp who-has 172.19.127.254 tell 172.19.125.21222:32:45.455863 arp who-has 172.19.65.16 tell 172.19.126.19422:32:45.540507 arp who-has 172.19.126.50 (44:30:54:59:43:4d) tell
172.19.65.1022:32:45.562004 arp who-has 172.19.126.50 tell 172.19.65.2

CAN5105 51
HTTP
tcpdump -nr ~/tmp/tcpdump.pcap port http22:43:32.633636 192.168.25.9.14075 > 172.19.64.52.http: S
1015952778:1015952778(0) win 6144 <mss 1460> (DF)22:43:32.633693 172.19.64.52.http > 192.168.25.9.14075: S
1929920485:1929920485(0) ack 1015952779 win 5840 <mss 1460> (DF)
22:43:32.635828 192.168.25.9.14075 > 172.19.64.52.http: P 1:590(589) ack 1 win 6144 (DF)
22:43:32.635906 172.19.64.52.http > 192.168.25.9.14075: . ack 590 win 6479 (DF)
22:43:32.636758 172.19.64.52.http > 192.168.25.9.14075: P 1:217(216) ack 590 win 6479 (DF)
22:43:32.636982 172.19.64.52.http > 192.168.25.9.14075: F 217:217(0) ack 590 win 6479 (DF)
22:43:32.639080 192.168.25.9.14075 > 172.19.64.52.http: R 590:590(0) ack 217 win 0 (DF)

CAN5105 52
tcpdump: When reading TCP
format: src > dst: flags data-seqno ack window
urgent options Flags are some combination of S (SYN), F (FIN), P
(PUSH) or R (RST) or a single '.' (no flags). The first time tcpdump sees a tcp
'conversation', it prints the sequence number from the packet.
On subsequent packets of the conversation, the difference between the current packet's sequence number and this initial sequence number is printed.

CAN5105 53
Window
win nnn specifies data window the sending host will accept in future packets i.e., the maximum number of bytes
TCP flow-control: host reduces this number if congested or
overloaded will sometimes set to 0 to temporarily halt
incoming traffic in this connection

Ethereal (WireShark)
King of the Packet Analyzers!Available for Linux, Unix, Windows
CAN5105 55
Ethereal
Ethereal can read data captured by tcpdump, e.g.,
$ Ethereal –r tcpdump.pcap or File -> Open Can capture data itself Uses same filter language as tcpdump

CAN5105 56

CAN5105 57

CAN5105 58
You can expand any protocol:
If we click on the + next to Bootstrap Protocol, we can see the details of the DHCP Request:

CAN5105 59

CAN5105 60
Display Filters
Note the box at the bottom of Ethereal for display filters
Select only some of the packets captured for display
see man Ethereal and search for DISPLAY FILTER SYNTAX
Different syntax than the syntax for capture filters
Example:ip.src==172.19.64.52 and ip.dest==172.19.64.57

CAN5105 61
Tools -> Follow TCP Stream
Can view the contents of an entire TCP stream conversation, in ASCII or in hexadecimal.
Be careful not to invade your customers’ privacy.
Can use to check if a communications stream is really encrypted

CAN5105 62
ntop: monitoring data at a point The ntop program
listens on a network interface puts an Ethernet interface into promiscuous
mode and displays statistics through a web interface
Shows: percentages of protocols, which machines generate most traffic which traffic is purely local, which traffic
comes from outside, which traffic goes from inside to outside of network

CAN5105 63
Switched Networks
Problem: a switched network is really a point-to-point network
You cannot normally capture the unicast traffic from other hosts on a single switch port
Solution: many switches support port monitoring, where one port can monitor all traffic on a specified VLAN
Example: Cisco 3500XL switches provide the port monitor command:
port monitor vlan VLAN1
CAN5105 64
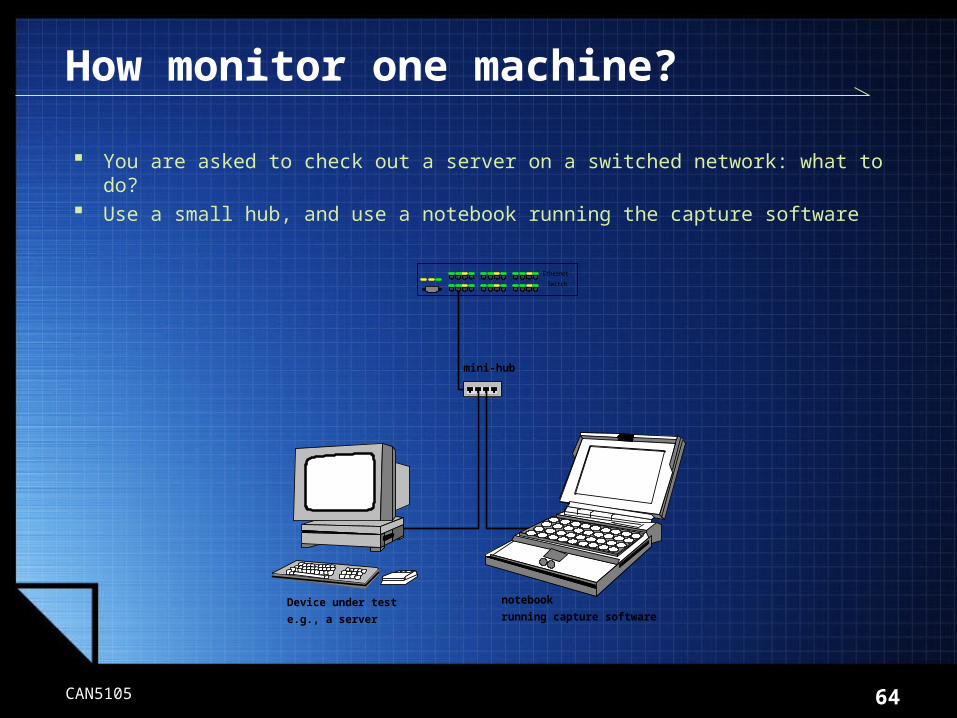
How monitor one machine?
You are asked to check out a server on a switched network: what to do? Use a small hub, and use a notebook running the capture software
Device under test notebookrunning capture softwaree.g., a server
mini-hub
SwitchEthernet

CAN5105 65
Are switched networks secure? Is all unicast traffic on one port of a switch
private? No, there are tools (dsniff) freely
available to temporarily make a switch behave like a hub, or that provide other ways to compromise switch security.

Port Scanning
Identify services offered by a remote computer

CAN5105 67
What is a port scanner?
Sends packets to various ports on a network device
Best one available everywhere is nmap can identify the OS of the target machine Do not port scan arbitrary machines in
your company's network without permission!
May be interpreted as a cracking attempt

CAN5105 68
How does nmap identify OS?
RFCs leave interpretation of some things up to the implementer
RFCs do not specify how should work if get contradictory flags, strange sequences of inconsistent packets
Most TCP/IP implementations are not complete Every implementation of TCP/IP is different; the
“grey areas” are different from one OS to another.
nmap sends “strange” packets to the machine, detects how reacts, matches this against a file of OS fingerprints

CAN5105 69
Running nmap: Use xnmap
$ sudo –v$ sudo xnmap & Enter the IP address of machine(s) to
identify select other choices from buttons press Start xnmap is simply a way to easily generate
command line options to nmap using a graphical interface

CAN5105 70
Uses of nmap
Identify the type of a computer that is causing trouble on the network
Check what network services a computer is really offering compare with netstat -tua output A cracked computer may be hiding some
services with trojaned utilities nmap can help you discover such services

Troubleshooting ProtocolsDNSEmailUsing telnet

CAN5105 72
DNS troubleshooting
Suspect DNS when get long timeouts before see any response
ping name, IP address, see if only IP address works
tools on Linux, Unix: dig, nslookup, host
tools on Windows: nslookup

CAN5105 73
DNS: dig
The people who write the most common name server (Bind) promote dig, deprecate nslookup
dig output is in form of DNS resource records can copy and paste straight into DNS database
files

CAN5105 74
C:\> nslookup www.utm.ac.mu
Server: dns1.intnet.mu
Address: 202.123.2.6
Name: www.utm.ac.mu
Address: 202.123.21.123
nslookup: An interactive Program

CAN5105 75
Email: testing with telnet
Email protocols SMTP, POP3 are text telnet a good tool to test them syntax:telnet server portnumber
SMTP: port 25 POP3: port 110 HTTP: port 80 FTP: port 21

Test Telecom Plus SMTP server:

CAN5105 77
SMTP commands for sending mail helo — identify your computer mail from — specify sender rcpt to — specify receiver data — indicates start of message body quit — terminate session Use names, not IP addresses, to specify
destination

CAN5105 78
pop3 commands: retrieving mail See RFC 1939 for easy-to-read details First, must authenticate: user username pass password stat — shows number of messages and total
size in bytes list — list all the message numbers and size in
bytes of each message retr messagenum — retrieve the message with
number messagenum dele messagenum — delete the message with
message number messagenum quit

CAN5105 79
Test Telecom Plus POP server:

CAN5105 80
Test pages.intnet.mu web server:

CAN5105 81
telnet: Other applications
Many network protocols are text. telnet can be helpful in checking:
IMAP servers: telnet hostname 143 e.g. telnet bow.intnet.mu 143
Web servers: telnet hostname 80 e.g. telnet www.utm.ac.mu 80
Ftp servers: telnet hostname 21 e.g. telnet intraweb 21
Even ssh (can check version, if responding): telnet hostname 22

CAN5105 82
Conclusion
Check the simple things first Document what you do Become familiar with common tools Use the tools to become familiar with your
network before troubles strike Know what is “normal” Get permission from the boss before using
packet sniffing and port scanners


