HAL Id: hal-01205822 https://hal.inria.fr/hal-01205822 Submitted on 7 Nov 2015 HAL is a multi-disciplinary open access archive for the deposit and dissemination of sci- entific research documents, whether they are pub- lished or not. The documents may come from teaching and research institutions in France or abroad, or from public or private research centers. L’archive ouverte pluridisciplinaire HAL, est destinée au dépôt et à la diffusion de documents scientifiques de niveau recherche, publiés ou non, émanant des établissements d’enseignement et de recherche français ou étrangers, des laboratoires publics ou privés. NetworkCube: Bringing Dynamic Network Visualizations to Domain Scientists Benjamin Bach, Nathalie Henry Riche, Roland Fernandez, Emmanoulis Giannisakis, Bongshin Lee, Jean-Daniel Fekete To cite this version: Benjamin Bach, Nathalie Henry Riche, Roland Fernandez, Emmanoulis Giannisakis, Bongshin Lee, et al.. NetworkCube: Bringing Dynamic Network Visualizations to Domain Scientists. Posters of the Conference on Information Visualization (InfoVis), Oct 2015, Chicago, United States. 2015. <hal- 01205822>
Transcript
HAL Id: hal-01205822https://hal.inria.fr/hal-01205822
Submitted on 7 Nov 2015
HAL is a multi-disciplinary open accessarchive for the deposit and dissemination of sci-entific research documents, whether they are pub-lished or not. The documents may come fromteaching and research institutions in France orabroad, or from public or private research centers.
L’archive ouverte pluridisciplinaire HAL, estdestinée au dépôt et à la diffusion de documentsscientifiques de niveau recherche, publiés ou non,émanant des établissements d’enseignement et derecherche français ou étrangers, des laboratoirespublics ou privés.
NetworkCube: Bringing Dynamic NetworkVisualizations to Domain Scientists
Benjamin Bach, Nathalie Henry Riche, Roland Fernandez, EmmanoulisGiannisakis, Bongshin Lee, Jean-Daniel Fekete
To cite this version:Benjamin Bach, Nathalie Henry Riche, Roland Fernandez, Emmanoulis Giannisakis, Bongshin Lee,et al.. NetworkCube: Bringing Dynamic Network Visualizations to Domain Scientists. Posters of theConference on Information Visualization (InfoVis), Oct 2015, Chicago, United States. 2015. <hal-01205822>
Microsoft Research - Inria Joint CentreNathalie Henry Riche†
Microsoft ResearchRoland Fernandez‡
Microsoft ResarchEmmanoulis Giannisakis§
Inria France
Bongshin Lee¶
Microsoft ResearchJean-Daniel Fekete‖
Inria France
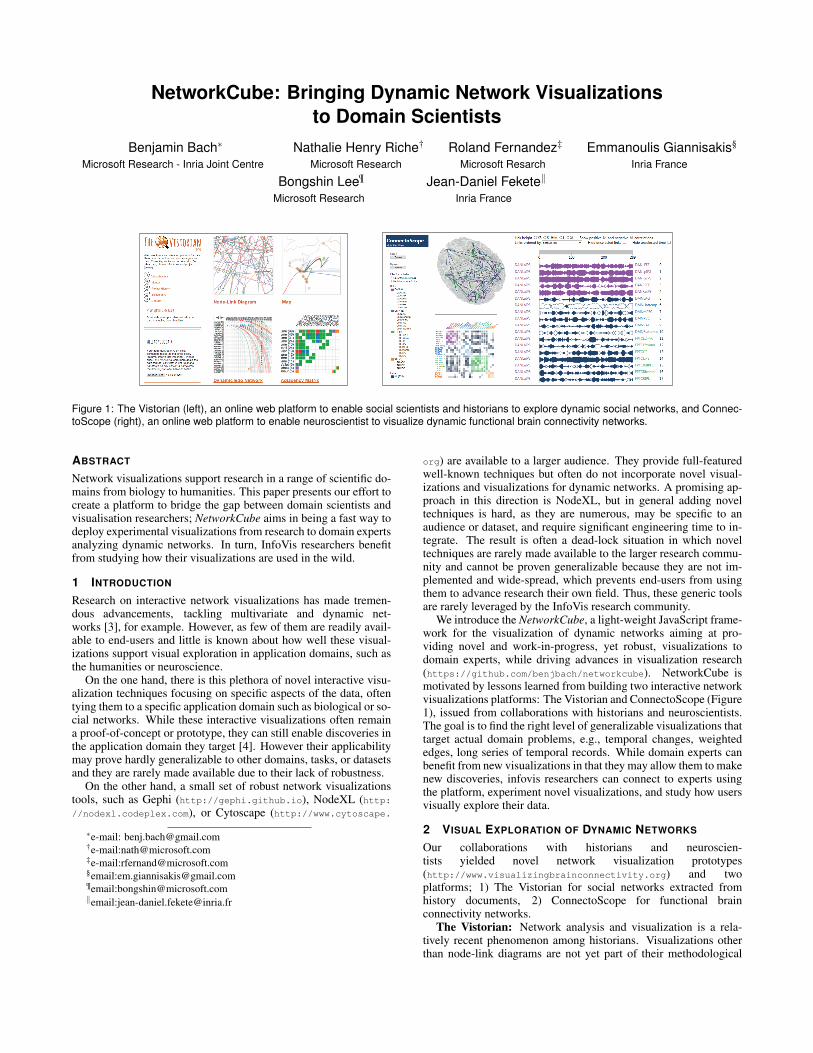
Figure 1: The Vistorian (left), an online web platform to enable social scientists and historians to explore dynamic social networks, and Connec-toScope (right), an online web platform to enable neuroscientist to visualize dynamic functional brain connectivity networks.
ABSTRACT
Network visualizations support research in a range of scientific do-mains from biology to humanities. This paper presents our effort tocreate a platform to bridge the gap between domain scientists andvisualisation researchers; NetworkCube aims in being a fast way todeploy experimental visualizations from research to domain expertsanalyzing dynamic networks. In turn, InfoVis researchers benefitfrom studying how their visualizations are used in the wild.
1 INTRODUCTION
Research on interactive network visualizations has made tremen-dous advancements, tackling multivariate and dynamic net-works [3], for example. However, as few of them are readily avail-able to end-users and little is known about how well these visual-izations support visual exploration in application domains, such asthe humanities or neuroscience.
On the one hand, there is this plethora of novel interactive visu-alization techniques focusing on specific aspects of the data, oftentying them to a specific application domain such as biological or so-cial networks. While these interactive visualizations often remaina proof-of-concept or prototype, they can still enable discoveries inthe application domain they target [4]. However their applicabilitymay prove hardly generalizable to other domains, tasks, or datasetsand they are rarely made available due to their lack of robustness.
On the other hand, a small set of robust network visualizationstools, such as Gephi (http://gephi.github.io), NodeXL (http://nodexl.codeplex.com), or Cytoscape (http://www.cytoscape.
org) are available to a larger audience. They provide full-featuredwell-known techniques but often do not incorporate novel visual-izations and visualizations for dynamic networks. A promising ap-proach in this direction is NodeXL, but in general adding noveltechniques is hard, as they are numerous, may be specific to anaudience or dataset, and require significant engineering time to in-tegrate. The result is often a dead-lock situation in which noveltechniques are rarely made available to the larger research commu-nity and cannot be proven generalizable because they are not im-plemented and wide-spread, which prevents end-users from usingthem to advance research their own field. Thus, these generic toolsare rarely leveraged by the InfoVis research community.
We introduce the NetworkCube, a light-weight JavaScript frame-work for the visualization of dynamic networks aiming at pro-viding novel and work-in-progress, yet robust, visualizations todomain experts, while driving advances in visualization research(https://github.com/benjbach/networkcube). NetworkCube ismotivated by lessons learned from building two interactive networkvisualizations platforms: The Vistorian and ConnectoScope (Figure1), issued from collaborations with historians and neuroscientists.The goal is to find the right level of generalizable visualizations thattarget actual domain problems, e.g., temporal changes, weightededges, long series of temporal records. While domain experts canbenefit from new visualizations in that they may allow them to makenew discoveries, infovis researchers can connect to experts usingthe platform, experiment novel visualizations, and study how usersvisually explore their data.
2 VISUAL EXPLORATION OF DYNAMIC NETWORKS
Our collaborations with historians and neuroscien-tists yielded novel network visualization prototypes(http://www.visualizingbrainconnectivity.org) and twoplatforms; 1) The Vistorian for social networks extracted fromhistory documents, 2) ConnectoScope for functional brainconnectivity networks.
The Vistorian: Network analysis and visualization is a rela-tively recent phenomenon among historians. Visualizations otherthan node-link diagrams are not yet part of their methodological
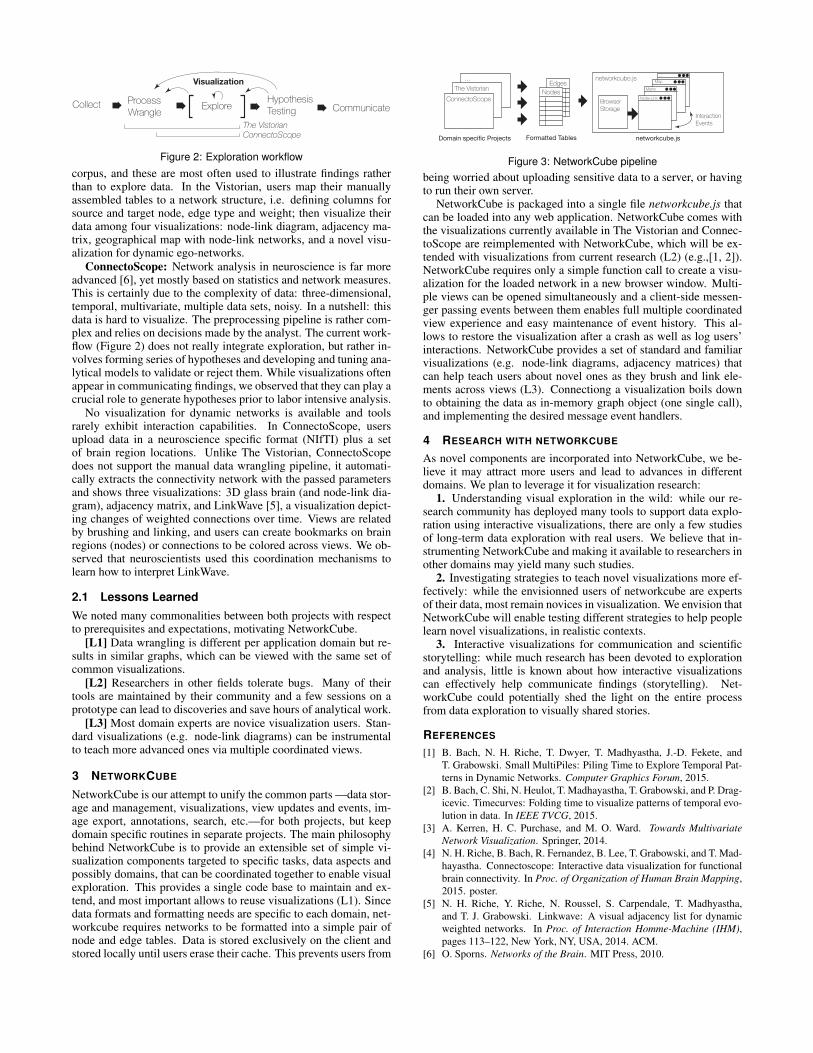
Collect ProcessWrangle Explore Hypothesis
Testing CommunicateThe VistorianConnectoScope
Visualization
Figure 2: Exploration workflow
corpus, and these are most often used to illustrate findings ratherthan to explore data. In the Vistorian, users map their manuallyassembled tables to a network structure, i.e. defining columns forsource and target node, edge type and weight; then visualize theirdata among four visualizations: node-link diagram, adjacency ma-trix, geographical map with node-link networks, and a novel visu-alization for dynamic ego-networks.
ConnectoScope: Network analysis in neuroscience is far moreadvanced [6], yet mostly based on statistics and network measures.This is certainly due to the complexity of data: three-dimensional,temporal, multivariate, multiple data sets, noisy. In a nutshell: thisdata is hard to visualize. The preprocessing pipeline is rather com-plex and relies on decisions made by the analyst. The current work-flow (Figure 2) does not really integrate exploration, but rather in-volves forming series of hypotheses and developing and tuning ana-lytical models to validate or reject them. While visualizations oftenappear in communicating findings, we observed that they can play acrucial role to generate hypotheses prior to labor intensive analysis.
No visualization for dynamic networks is available and toolsrarely exhibit interaction capabilities. In ConnectoScope, usersupload data in a neuroscience specific format (NIfTI) plus a setof brain region locations. Unlike The Vistorian, ConnectoScopedoes not support the manual data wrangling pipeline, it automati-cally extracts the connectivity network with the passed parametersand shows three visualizations: 3D glass brain (and node-link dia-gram), adjacency matrix, and LinkWave [5], a visualization depict-ing changes of weighted connections over time. Views are relatedby brushing and linking, and users can create bookmarks on brainregions (nodes) or connections to be colored across views. We ob-served that neuroscientists used this coordination mechanisms tolearn how to interpret LinkWave.
2.1 Lessons LearnedWe noted many commonalities between both projects with respectto prerequisites and expectations, motivating NetworkCube.
[L1] Data wrangling is different per application domain but re-sults in similar graphs, which can be viewed with the same set ofcommon visualizations.
[L2] Researchers in other fields tolerate bugs. Many of theirtools are maintained by their community and a few sessions on aprototype can lead to discoveries and save hours of analytical work.
[L3] Most domain experts are novice visualization users. Stan-dard visualizations (e.g. node-link diagrams) can be instrumentalto teach more advanced ones via multiple coordinated views.
3 NETWORKCUBE
NetworkCube is our attempt to unify the common parts —data stor-age and management, visualizations, view updates and events, im-age export, annotations, search, etc.—for both projects, but keepdomain specific routines in separate projects. The main philosophybehind NetworkCube is to provide an extensible set of simple vi-sualization components targeted to specific tasks, data aspects andpossibly domains, that can be coordinated together to enable visualexploration. This provides a single code base to maintain and ex-tend, and most important allows to reuse visualizations (L1). Sincedata formats and formatting needs are specific to each domain, net-workcube requires networks to be formatted into a simple pair ofnode and edge tables. Data is stored exclusively on the client andstored locally until users erase their cache. This prevents users from
networkcube.js ...
Edges
Domain specific Projects
The Vistorian ConnectoScope
...
NodesNode-Link
Matrix
Map
Interaction Events
Browser Storage
Formatted Tables networkcube.js
Figure 3: NetworkCube pipelinebeing worried about uploading sensitive data to a server, or havingto run their own server.
NetworkCube is packaged into a single file networkcube.js thatcan be loaded into any web application. NetworkCube comes withthe visualizations currently available in The Vistorian and Connec-toScope are reimplemented with NetworkCube, which will be ex-tended with visualizations from current research (L2) (e.g.,[1, 2]).NetworkCube requires only a simple function call to create a visu-alization for the loaded network in a new browser window. Multi-ple views can be opened simultaneously and a client-side messen-ger passing events between them enables full multiple coordinatedview experience and easy maintenance of event history. This al-lows to restore the visualization after a crash as well as log users’interactions. NetworkCube provides a set of standard and familiarvisualizations (e.g. node-link diagrams, adjacency matrices) thatcan help teach users about novel ones as they brush and link ele-ments across views (L3). Connectiong a visualization boils downto obtaining the data as in-memory graph object (one single call),and implementing the desired message event handlers.
4 RESEARCH WITH NETWORKCUBE
As novel components are incorporated into NetworkCube, we be-lieve it may attract more users and lead to advances in differentdomains. We plan to leverage it for visualization research:
1. Understanding visual exploration in the wild: while our re-search community has deployed many tools to support data explo-ration using interactive visualizations, there are only a few studiesof long-term data exploration with real users. We believe that in-strumenting NetworkCube and making it available to researchers inother domains may yield many such studies.
2. Investigating strategies to teach novel visualizations more ef-fectively: while the envisionned users of networkcube are expertsof their data, most remain novices in visualization. We envision thatNetworkCube will enable testing different strategies to help peoplelearn novel visualizations, in realistic contexts.
3. Interactive visualizations for communication and scientificstorytelling: while much research has been devoted to explorationand analysis, little is known about how interactive visualizationscan effectively help communicate findings (storytelling). Net-workCube could potentially shed the light on the entire processfrom data exploration to visually shared stories.
REFERENCES
[1] B. Bach, N. H. Riche, T. Dwyer, T. Madhyastha, J.-D. Fekete, andT. Grabowski. Small MultiPiles: Piling Time to Explore Temporal Pat-terns in Dynamic Networks. Computer Graphics Forum, 2015.
[2] B. Bach, C. Shi, N. Heulot, T. Madhayastha, T. Grabowski, and P. Drag-icevic. Timecurves: Folding time to visualize patterns of temporal evo-lution in data. In IEEE TVCG, 2015.
[3] A. Kerren, H. C. Purchase, and M. O. Ward. Towards MultivariateNetwork Visualization. Springer, 2014.
[4] N. H. Riche, B. Bach, R. Fernandez, B. Lee, T. Grabowski, and T. Mad-hayastha. Connectoscope: Interactive data visualization for functionalbrain connectivity. In Proc. of Organization of Human Brain Mapping,2015. poster.
[5] N. H. Riche, Y. Riche, N. Roussel, S. Carpendale, T. Madhyastha,and T. J. Grabowski. Linkwave: A visual adjacency list for dynamicweighted networks. In Proc. of Interaction Homme-Machine (IHM),pages 113–122, New York, NY, USA, 2014. ACM.
[6] O. Sporns. Networks of the Brain. MIT Press, 2010.