NEUJOBS WP12 Health care, goods and services for an ageing population Impact of demographic change on health care workforce Presentation at the 2nd NEUJOBS Validation Event Employment 2025: How will multiple transitions affect the European labor market? 9th April 2014 at IZA Bonn Dr. Erika Schulz, DIW
Transcript
NEUJOBS WP12 Health care, goods and services for an ageing population
Impact of demographic change on health care workforce
Presentation at the 2nd NEUJOBS Validation Event Employment 2025: How will multiple transitions affect the European labor market?
9th April 2014 at IZA Bonn
Dr. Erika Schulz, DIW
OBJECTIVES
Analyse the impact of socio-ecological transition, in particular the ageing of the population, on employment in health care sector taking into account the
framework assumptions defined in the two scenarios tough and friendly (WP1: SET),
results of the NEMESIS model for employment and growth in total and in non-market services (WP9: Economic and employment development)
two demographic scenarios tough and friendly (WP10)
Detailed analyses have been carried out for five countries:
Denmark, Germany, Italy, Poland, and Slovakia
Participants
DIW Berlin DR. ERIKA SCHULZ AND DR. JOHANNES GEYER responsible for DE and DK
SAVBA DR. MAREK RADVANSKÝ AND GABRIELA DOVÁĽOVÁ responsible for SK
CASE Prof. DR. STANISŁAWA GOLINOWSKA, DR. EWA KOCOT, AND DR. AGNIESZKA SOWA,
responsible for PL
CeRP DR. FLAVIA CODA MOSCAROLA (subcontract CeRP) responsible for IT
Health care - Tasks
A Current employment situation in EU countries and detailed analyses in selected countries (DE, DK, PL, SK, IT)
B Impact of ageing on the demand for health care services and its workforce (status-quo-projection for selected countries)
C Impact of changes in health workforce supply (selected countries)
D Employment and expected gap in the health care labour market (selected countries)
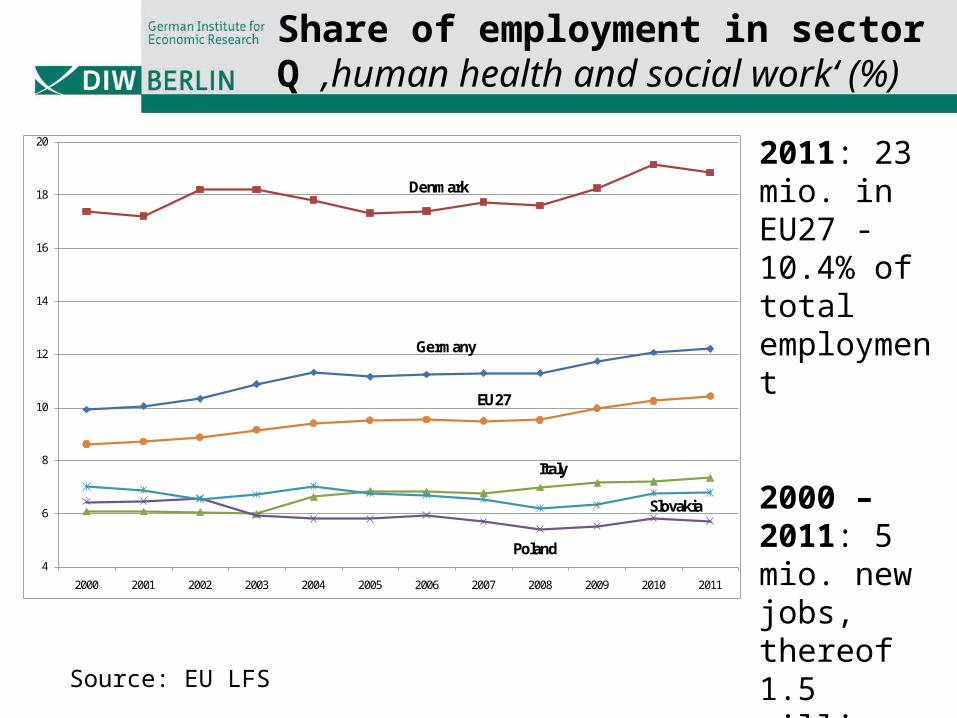
Share of employment in sector Q ‚human health and social work‘ (%)
2011: 23 mio. in EU27 - 10.4% of total employment
2000 – 2011: 5 mio. new jobs, thereof 1.5 million during the crisis (2008 -2011).
Social work activities without accommodation (Q88)
Hospital activities
Medical and dental practice activities
Other human health activities
Overview sector Q
Share of subsectors Q86, Q87, and Q88 (%)
12.4 mio. (EU27), 5.1 mio. (selected countries) employed in human health
75% female employment
32% elderly employment (50+); 18 % (55+)
0,37
0,58 0,590,68
0,75 0,76
0,24
0,20 0,230,17
0,13 0,100,39
0,22 0,18 0,16 0,12 0,13
0%
10%
20%
30%
40%
50%
60%
70%
80%
90%
100%
DK EU27 DE SK IT PL
Social work activities without accommodation
Residential care activities
Human health activities
Source: EU LFS
2011
More than half of health care workforce is employed in hospitals
Institutional and ambulatory health care 2010
High share of elderly employment in ambulatory care (22%)
Alarming signal: share of elderly practising physicians (55+) in DK 31.8%, DE 39.5%, IT 42.2% and SK 33.5%
6050
63 6168
57
31
31
27 2820
23
919
11 11 1220
0%
10%
20%
30%
40%
50%
60%
70%
80%
90%
100%
Denmark Germany Italy Poland Slovakia EU27*
Other human health activities
Medical and dental practice activities
Hospital activities
Changes in population size and age-structure
Increase in the number of elderly
and oldest old
Decline in working-age population
Impact on the demand for services
+ employees
Impact on the supply of health care
workforce
Impact of demographic change
Demand
Preferred Methods
Supply
Utilisation approach-Hospital admissions, length of stay-Contacts to doctors-Other services-Combined with popu- lation projections (tough and friendly scenarios)
Top down approach-Estimation of total labour force (WP10)-Estimation of employment and growth by sectors (WP9)-Calculation for subsectors
Estimation of future demand and supply
Data on utilization of hospital services are available for all selected countries; limited availability of data on utilization of ambulatory care services. Data from population surveys or insurance funds.
Hospital care Ambulatory care
DenmarkNational Patient Register published by National Statistical Office
National Statistical Office based on data collected by regions
GermanyHospital Diagnosis Statistics published by National Statistical Office
Data on health care utilization of insurants of one Social Health Insurance Funds (Barmer GEK)
Rehabilitation Diagnosis Statistics published by National Statistical office
ItalyEurostat data based on statistics of the Ministry of Health in Italy
Survey data collected by National Statistical Office every 5 years
PolandEurostat data based on statistics of the Central Statistical Office GUS: Health and Health care in 2010;
EHIS European health Information Survey
SlovakiaEurostat data based on statistics of the National Health Information Center
EHIS European health Information Survey
Source: Compilation by DIW Berlin.
Data sources (demand)
Utilization of hospital services
Utilization = number of patients and average length of stay by age-groups and gender
Past trends: increase in inpatients, but decline in length of stay
0
2
4
6
8
10
12
14
Day
s
Length of hospital stay of inpatients in 2010
Germany
Denmark
Italy
PolandSlovakia
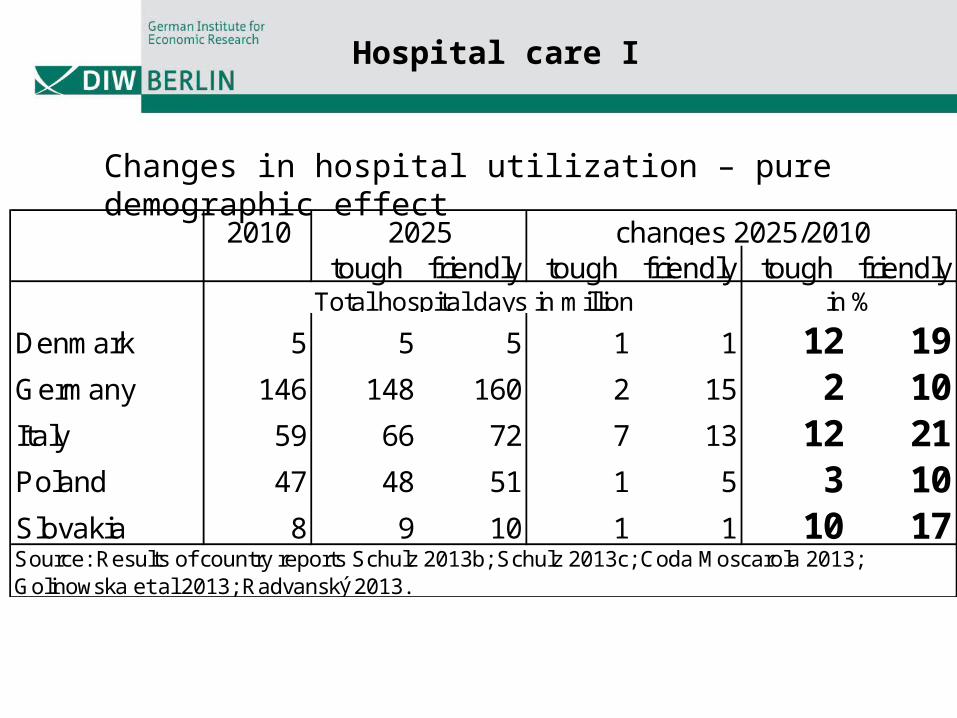
Changes in hospital utilization – pure demographic effect
Source: Results of country reports Schulz 2013b; Schulz 2013c; Coda Moscarola 2013; Golinowska et al 2013; Radvanský 2013.
changes 2025/2010
in %
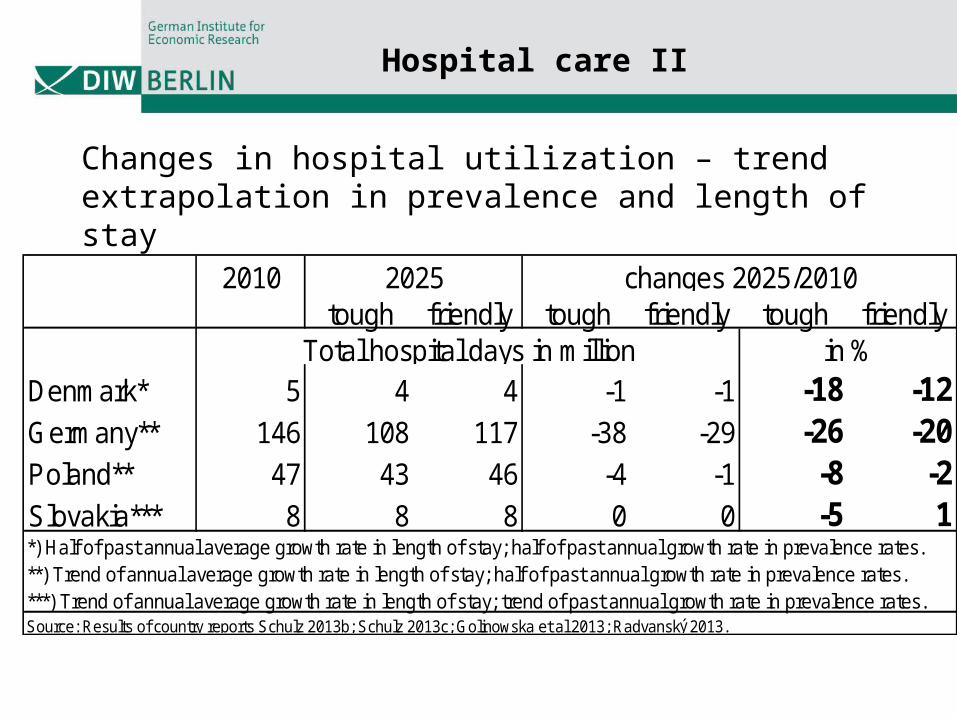
Changes in hospital utilization – trend extrapolation in prevalence and length of stay
Hospital care II
2010tough friendly tough friendly tough friendly
Denmark* 5 4 4 -1 -1 -18 -12Germany** 146 108 117 -38 -29 -26 -20Poland** 47 43 46 -4 -1 -8 -2Slovakia*** 8 8 8 0 0 -5 1*) Half of past annual average growth rate in length of stay; half of past annual growth rate in prevalence rates.**) Trend of annual average growth rate in length of stay; half of past annual growth rate in prevalence rates.***) Trend of annual average growth rate in length of stay; trend of past annual growth rate in prevalence rates.Source: Results of country reports Schulz 2013b; Schulz 2013c; Golinowska et al 2013; Radvanský 2013.
2025
Total hospital days in million
changes 2025/2010
in %
Changes in hospital employment – constant utilization rates
Source: Results of country reports Schulz 2013b; Schulz 2013c; Coda Moscarola 2013; Golinowska et al 2013; Radvanský 2013.
Hospital employment
Available utilization data on ambulatory care
GPs Specialists Dentists otherDenmark X X X XGermany* (X) (X) X someItaly** X (X) X somePoland X X X -Slovakia X X X -*) GPs and specialists; prescription of therapeutical measures, drugs, medical aids as dummies for utilization of other ambulatory care providers. **) Specialists working in hospitals and ambulatory care facilities. Other areas: rehabilitation measures, first aids, diagnostic examinations.Source: Results of country reports Schulz 2013b; Schulz 2013c; Coda Moscarola 2013; Golinowska et al 2013; Radvanský 2013.
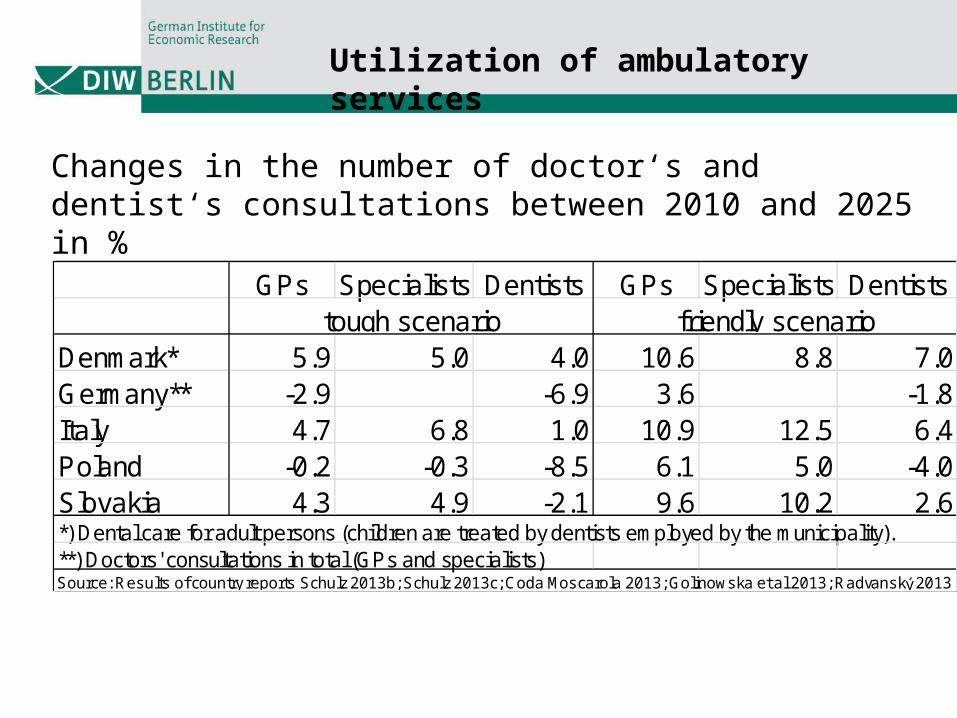
Utilization of ambulatory services
Changes in the number of doctor‘s and dentist‘s consultations between 2010 and 2025 in %
GPs Specialists Dentists GPs Specialists Dentists
Denmark* 5.9 5.0 4.0 10.6 8.8 7.0Germany** -2.9 -6.9 3.6 -1.8Italy 4.7 6.8 1.0 10.9 12.5 6.4Poland -0.2 -0.3 -8.5 6.1 5.0 -4.0Slovakia 4.3 4.9 -2.1 9.6 10.2 2.6*) Dental care for adult persons (children are treated by dentists employed by the municipality).**) Doctors' consultations in total (GPs and specialists)Source: Results of country reports Schulz 2013b; Schulz 2013c; Coda Moscarola 2013; Golinowska et al 2013; Radvanský 2013.
tough scenario friendly scenario
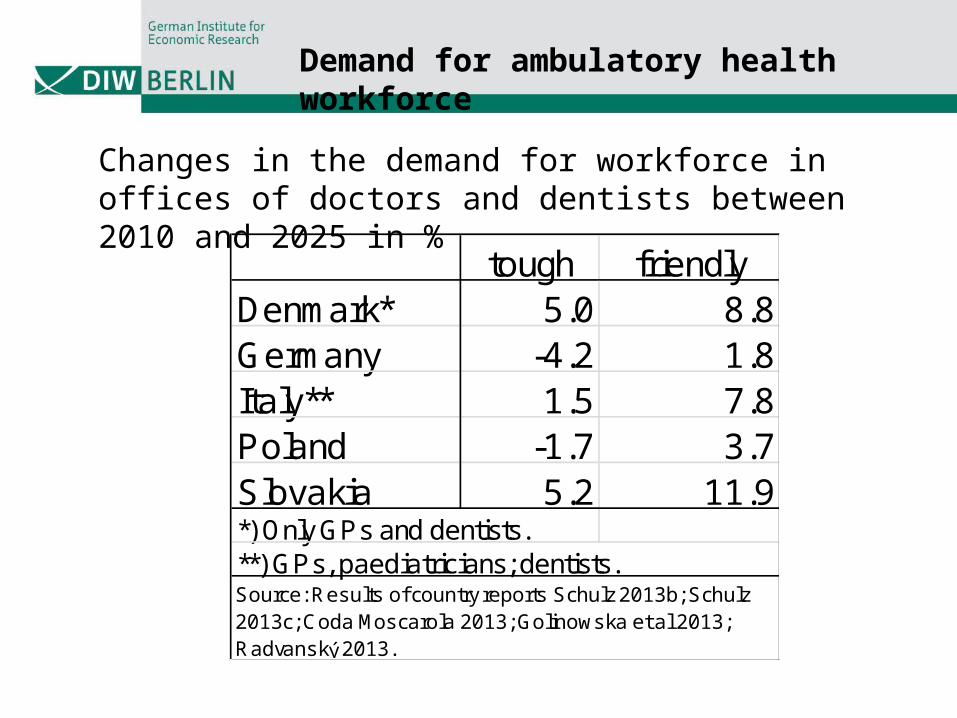
Demand for ambulatory health workforce
Changes in the demand for workforce in offices of doctors and dentists between 2010 and 2025 in %
tough friendlyDenmark* 5.0 8.8Germany -4.2 1.8Italy** 1.5 7.8Poland -1.7 3.7Slovakia 5.2 11.9*) Only GPs and dentists.**) GPs, paediatricians; dentists.Source: Results of country reports Schulz 2013b; Schulz 2013c; Coda Moscarola 2013; Golinowska et al 2013; Radvanský 2013.
Health care workforce supply
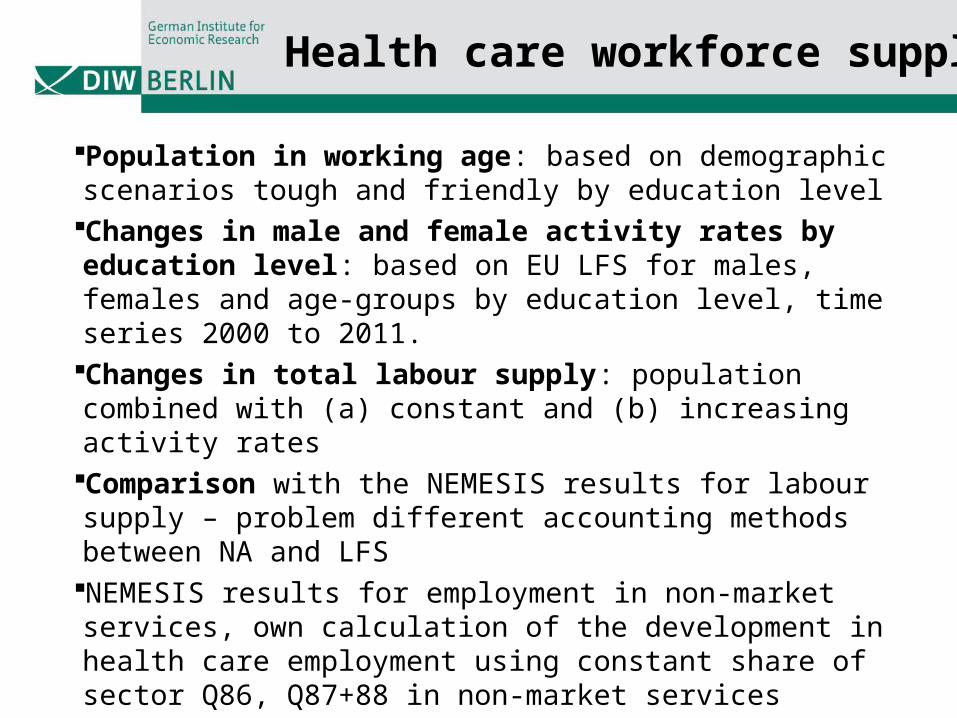
Population in working age: based on demographic scenarios tough and friendly by education levelChanges in male and female activity rates by education level: based on EU LFS for males, females and age-groups by education level, time series 2000 to 2011.Changes in total labour supply: population combined with (a) constant and (b) increasing activity ratesComparison with the NEMESIS results for labour supply – problem different accounting methods between NA and LFS NEMESIS results for employment in non-market services, own calculation of the development in health care employment using constant share of sector Q86, Q87+88 in non-market services
Changes in total labour force – comparing own calculations and NEMESIS results
Denmark 3.9 12.9 12.9 12.9 12.9Germany 0.4 17.4 11.8 5.4 20.9Italy 8.7 -0.3 -0.3 -0.3 -0.3Poland 5.1 28.1 28.1 28.1 28.1Slovakia 11.7 18.8 18.8 18.8 18.8total 4.1 14.5 11.3 7.9 17.1*) Estimation of DIW Berlin with the exception of Germany.
Changes in employment 2015/2010 in %
tough scenario
friendly scenario
Source: Boitier, B., Lancesseur, N. and Zagamé, P. "Global scenarios for European socio-ecological transition", NEUJOBS Deliverable D9.2, 2013, for scenarios results; calculations of DIW Berlin.
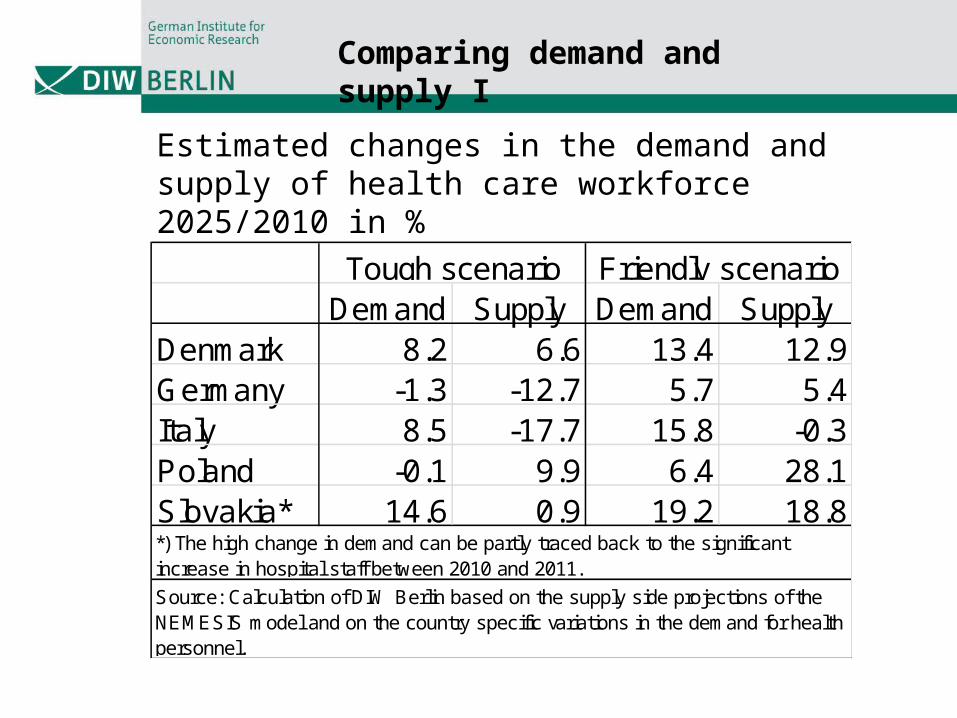
Estimated changes in the demand and supply of health care workforce 2025/2010 in %
Comparing demand and supply I
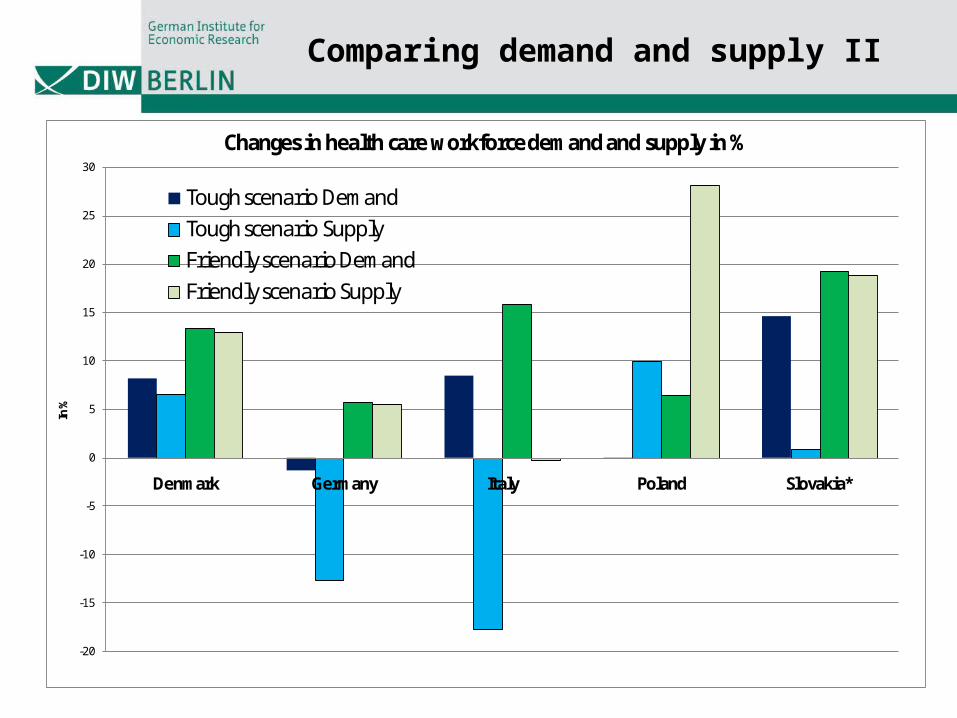
Demand Supply Demand SupplyDenmark 8.2 6.6 13.4 12.9Germany -1.3 -12.7 5.7 5.4Italy 8.5 -17.7 15.8 -0.3Poland -0.1 9.9 6.4 28.1Slovakia* 14.6 0.9 19.2 18.8*) The high change in demand can be partly traced back to the significant increase in hospital staff between 2010 and 2011.
Source: Calculation of DIW Berlin based on the supply side projections of the NEMESIS model and on the country specific variations in the demand for health personnel.
Friendly scenarioTough scenario
Comparing demand and supply II
-20
-15
-10
-5
0
5
10
15
20
25
30
Denmark Germany Italy Poland Slovakia*
In %
Changes in health care workforce demand and supply in %
• The pure demographic effect is expected to lead to high imbalances on the health care market in particular in Germany, Italy, and Slovakia in the tough scenario, and in Italy also in the friendly scenario.
• Other factors influencing demand which could not be taken into account:
• New medical and pharmaceutical treatments • Changes in health status, e.g. due to socio-ecological
transition• Changes in health behaviour• Factors influencing the health workforce supply: • Intensifying international recruitment strategies• Changing working conditions• Changes in health care organisation (patient-centred