International Journal of Automotive and Mechanical Engineering (IJAME)
ISSN: 2229-8649 (Print); ISSN: 2180-1606 (Online); Volume 11, pp. 2608-2621, January-June 2015
©Universiti Malaysia Pahang
DOI: http://dx.doi.org/10.15282/ijame.11.2015.39.0220
2608
NEURAL NETWORK MODELING OF GRINDING PARAMETERS OF
DUCTILE CAST IRON USING MINIMUM QUANTITY LUBRICATION
N.S.M. Sahid1, M.M. Rahman
1,2*and K. Kadirgama
1
1Faculty of Mechanical Engineering, Universiti Malaysia Pahang
26600 Pekan, Kuantan, Pahang, Malaysia
*Email: [email protected]
Phone: +6094246239; Fax: +6094246222 2Automotive Engineering Centre
Universiti Malaysia Pahang, 26600 Pekan, Pahang, Malaysia
ABSTRACT
This paper presents the optimization of the grinding parameters of ductile cast iron in
wet conditions and with the minimum quantity lubrication (MQL) technique. The
objective of this project is to investigate the performance of ductile cast iron during the
grinding process using the MQL technique and to develop artificial neural network
modeling. In this project we used the DOE method to perform the experiments.
Analysis of variance with the artificial neural network method is used to investigate
significant effects on the performance characteristics and the optimal cutting parameters
of the grinding process. Ductile cast iron was used in this experiment and the ethanol
glycol was applied in the conventional method and compared with the MQL method.
During conventional grinding, a dense and hard slurry layer was formed on the wheel
surface and the performance of the ductile cast iron was very low, threatening the
ecology and health of the workers. In order to combat the negative effects of
conventional cutting fluids, the MQL method was used in the process to formulate
modern cutting fluids endowed with user- and eco-friendly properties. Aluminum oxide
was used as the grinding wheel (PSA-60JBV). This model has been validated by the
experimental results of ductile cast iron grinding. Each method uses two passes -
single-pass and multiple-pass. The prediction model shows that depth of cut and table
speed have the greatest effect on the surface roughness and material removal rate for the
MQL technique with multiple-passes by showing improved surface roughness,
preventing workpiece burning and enabling a more friendly environment. Thus, various
other parameters need to be added for further experiments, such as the wheel speed,
distance from the wheel to the workpiece zone contact, and the geometry of the nozzle.
Keywords: Grinding; cast iron; minimum quantity lubrication; artificial neural network;
depth of cut.
INTRODUCTION
Grinding is a precision machining process which is widely used in the manufacture of
components requiring fine tolerances and smooth finishes [1]. Therefore, the negative
effect of high temperature on these parameters should be prevented [2]. The high heat
generation in the grinding process is the major part of the energy is due to the
workpiece. Abrasive interaction is addicted for elastic and plastic deformation of the
workpiece surface, and just a small portion of this energy is really used for cutting the
material and for chip formation. The coolant and lubricant medium, the topography of
Sahid et al. /International Journal of Automotive and Mechanical Engineering 11 (2015) 2608-2621
2609
the grinding wheel, and grinding parameters have a major role in increasing this cutting
portion of the total energy. Besides, the grinding parameters and grinding fluid
specifications should be considered so that the possibility of the grain’s interaction with
the workpiece to perform the cutting process with lower plastic deformation is
increased. In dry grinding, because of the lack of cutting fluid (in order to transfer the
heat from the contact zone), problems frequently occur in terms of thermal damage on
the workpiece surface, high grinding energy and forces, high wear rate of the grinding
wheel, low material removal rate (regarding relatively low depths of cut), as well as
poor surface integrity compared with conventional flood grinding. In MQL grinding, an
air–oil mixture called an aerosol is fed into the grinding contact zone. Compared with
dry grinding, MQL grinding considerably enhances cutting performance in terms of
increasing the wheel life and improving the surface quality of the ground parts [3].
Application of the MQL technique can reduce the grinding forces, energy consumption,
wheel wear, and production costs, as well as generating a finer surface finish and
improved surface integrity compared with dry and conventional flood conditions. Shen
and [4] studied the wheel wear and tribological characteristics in wet, dry, and MQL
grinding of a cast iron. The authors used water-based alumina and diamond nanofluids
in the MQL grinding process and compared the grinding results with those of pure
water. They verified the benefits of nanofluids in terms of reducing grinding forces,
improving surface roughness, and preventing burning of the workpiece. In contrast to
dry grinding, MQL grinding could substantially lower the grinding temperature [1].
Ethylene glycol is used to supply a minute quantity of cooling lubricant medium
to the contact point or to the zone so that the applied amount of grinding fluid can be
reduced dramatically while maintaining the cooling and lubrication effects that are lost
in dry machining. Furthermore, MQL is widely applied in cutting processes such as
turning, milling, and drilling, although MQL grinding is still a relatively new research
area. Traditionally, ethanol from corn has primarily been produced through dry- and
wet-milling processes. The traditional dry-grind process grinds the whole corn kernel
and mixes it with water and enzymes. The mash is then cooked to liquefy the starch
further, and is then cooled and mixed with more enzymes to convert the remaining sugar
polymers to glucose before fermenting to ethanol [5]. The components of the kernel that
are not fermented include the germ, fiber, and protein, and these are concentrated in the
distillers’ dried grains that are produced as co-products. While dry milling is less capital
intensive, it also yields less ethanol per bushel of corn than wet milling [6]. The
grinding process generates an extremely high input of energy per unit volume of
material removed. Almost all this energy is converted to heat, which can cause high
temperatures and thermal damage to the workpiece, such as workpiece burn, phase
transformations, undesirable residual tensile stresses, cracks, reduced fatigue strength,
and thermal distortion and inaccuracies. Besides that, the complete elimination of
grinding fluids always makes it difficult to keep the grinding wheel’s pores clean and
then the grinding wheel is easily clogged. Furthermore, the use of cutting fluid has some
drawbacks mainly concerning health hazards, since the worker is sometimes exposed to
direct skin contact or inhalation of cutting fluid vapors [7]. The angle and geometry of
the nozzle, if incorrectly positioned, causes the flow of fluids in areas other than the
surface of the workpiece. The alternative is to overcome this problem by using grinding
fluids that are often applied for flood or minimum quantity lubrication. The objectives
of this project are to investigate the performance of ductile cast iron during the grinding
process using the MQL technique and to optimize the grinding parameters of ductile
cast iron using the ANN method.
Neural network modeling of grinding parameters of ductile cast iron using minimum quantity lubrication
2610
METHODS AND MATERIALS
The overall work flow progress of the ductile cast iron using MQL during the grinding
process, based on design of experiment, and the development of an artificial neural
network to predict the surface roughness and material removal rate, are presented in this
section. Experiments have been performed in order to investigate the effects of
machining parameters (speed and depth of cut) on the surface roughness and material
removal rate of the machined surface. Nine specimens of ductile cast iron, 30 mm
length, 30 mm height and 5 mm width, were used for experimentation using grinding
machines. All experiments were done under conventional coolant and MQL systems.
Each experiment used the same machine with different flow rates of the system. The
flow rates used are 36 ml/hour, 72 ml/hour and 144 ml/hour. The concentration for
conventional coolant used was 5% of ethanol with fully synthetic, while for MQL the
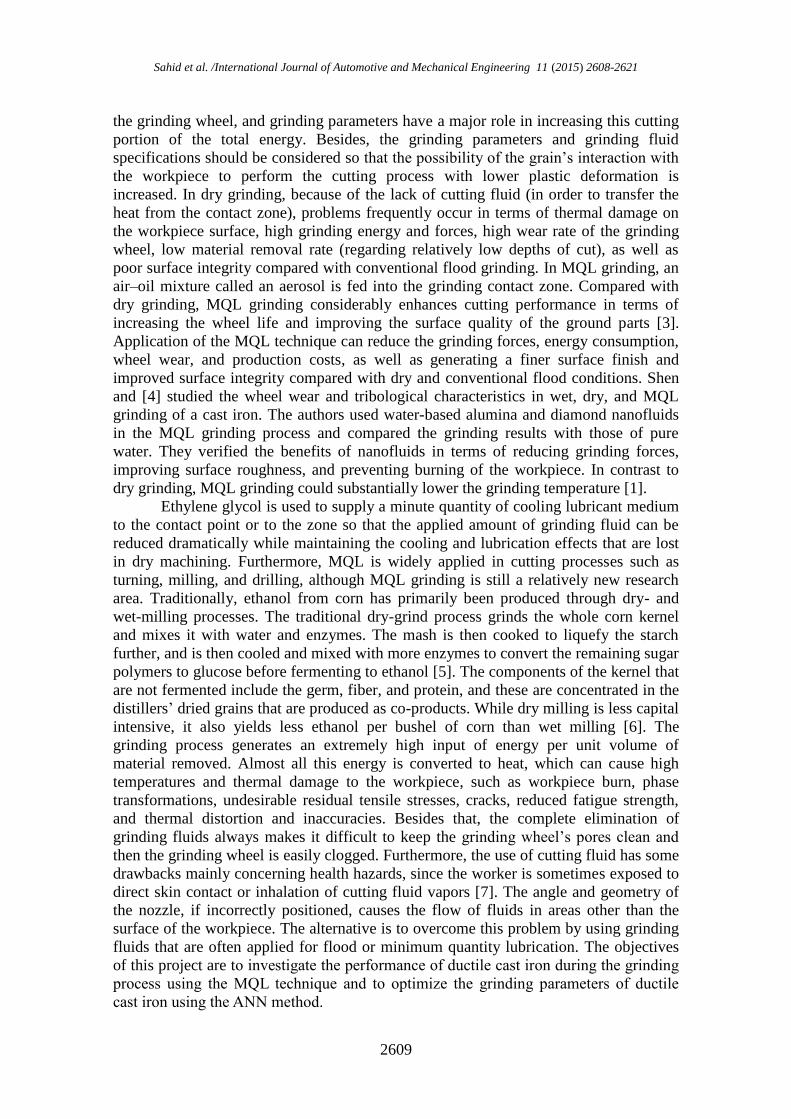
concentration used was 0.15%. Table 1 shows the design of experiment matrix for this
study.
Table 1. Design of experiment.
Sample Table speed (rpm) Depth of cut (µm)
1 25.2 2
2 25.2 4
3 25.2 6
4 12.5 2
5 12.5 4
6 12.5 6
7 8.7 2
8 8.7 4
9 8.7 6
During the grinding process, a Supertec precision machine was used, model
STP-102AADCII. A vitrified bond aluminum oxide was used as the grinding wheel
(PSA-60JBV), with the grain size as the average abrasive size. The workpiece used was
ductile cast iron with carbon content of 3.5%–3.9% and average hardness of 110-
Rockwell C. The dimensions of the specimens of cast iron were 30 mm × 30 mm × 5
mm. The two types of coolant used were conventional and minimum quantity
lubrication. In conventional coolants, the concentration of ethanol was 2.5%, at a flow
rate of 2.83 × 10⁻⁴
m3/s. The device for application of MQL is composed of an air
compressor, pressure regulator, flow rate meter and nozzle. In this experiment, the air
pressure was 0.6 MPa, and the fluid flow rate was 36 ml/hour, 72 ml/hour and 144
ml/hour. This device provides oil and allows control of oil/air flow rates individually.
The air flow rate was monitored using a turbine-type meter, calibrated to a pressure of
8.0 × 10⁵
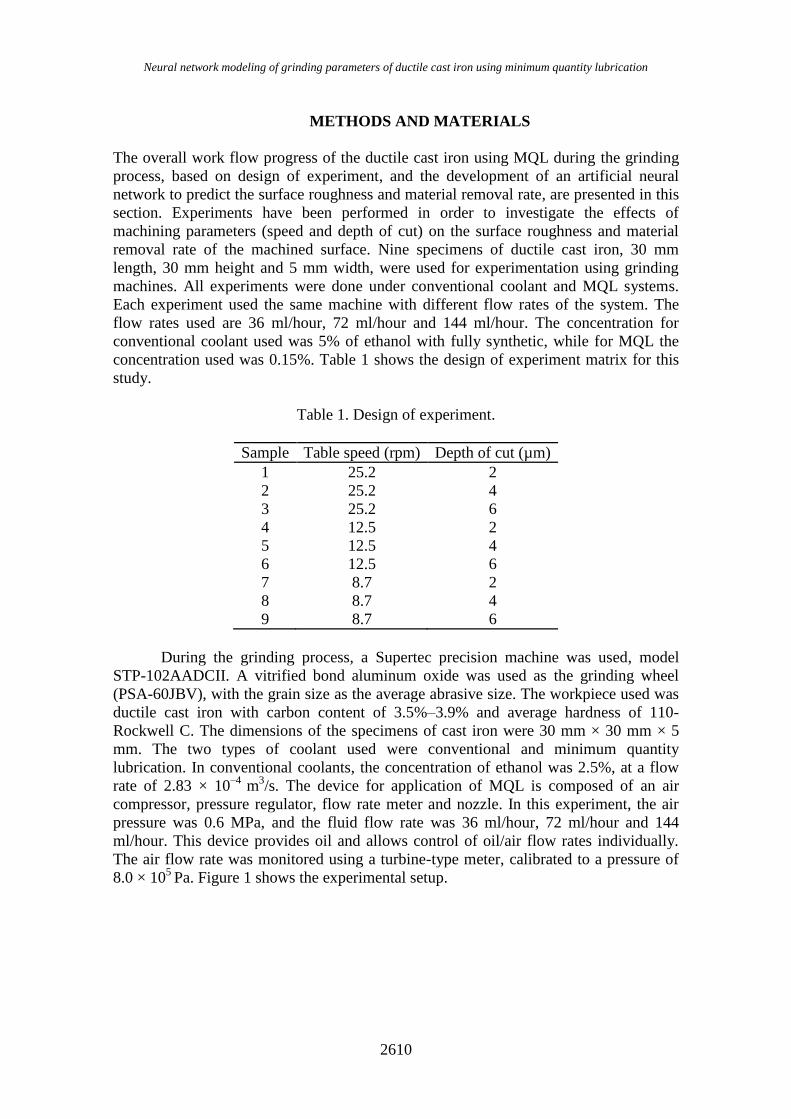
Pa. Figure 1 shows the experimental setup.
Sahid et al. /International Journal of Automotive and Mechanical Engineering 11 (2015) 2608-2621
2611
(a) (b)
(c) (d)
Figure 1. Experimental setup.
ANN Modeling
The experimental data consists of 27 samples with their respective grinding passes and
types of coolant. The ANN model was trained using 16 randomly selected data
(accounting for 60% of the total data), while the remaining 7 data (accounting for 25%
each) were utilized for testing and 15% for validation of the network performance.
There are many variations of the batch back-propagation algorithm. The simplest
implementation of batch back-propagation learning updates the network weights and
MQL coolant
MQL spray
nozzle
Ethanol
Compressor MQL
coolant
Tubes
Workpiece Grinding
wheel
Conventional
coolant
nozzle
Neural network modeling of grinding parameters of ductile cast iron using minimum quantity lubrication
2612
biases in the direction in which the function decreases most rapidly, the negative of the
gradient. The weights and biases of the network are updated after the entire training set
has been applied to the network. The gradients are calculated for each training example
and added together to determine the change in the weights and biases. The main purpose
of the batch back-propagation is to explain how to use the batch back-propagation
training functions in the toolbox to train the feed-forward neural networks to solve
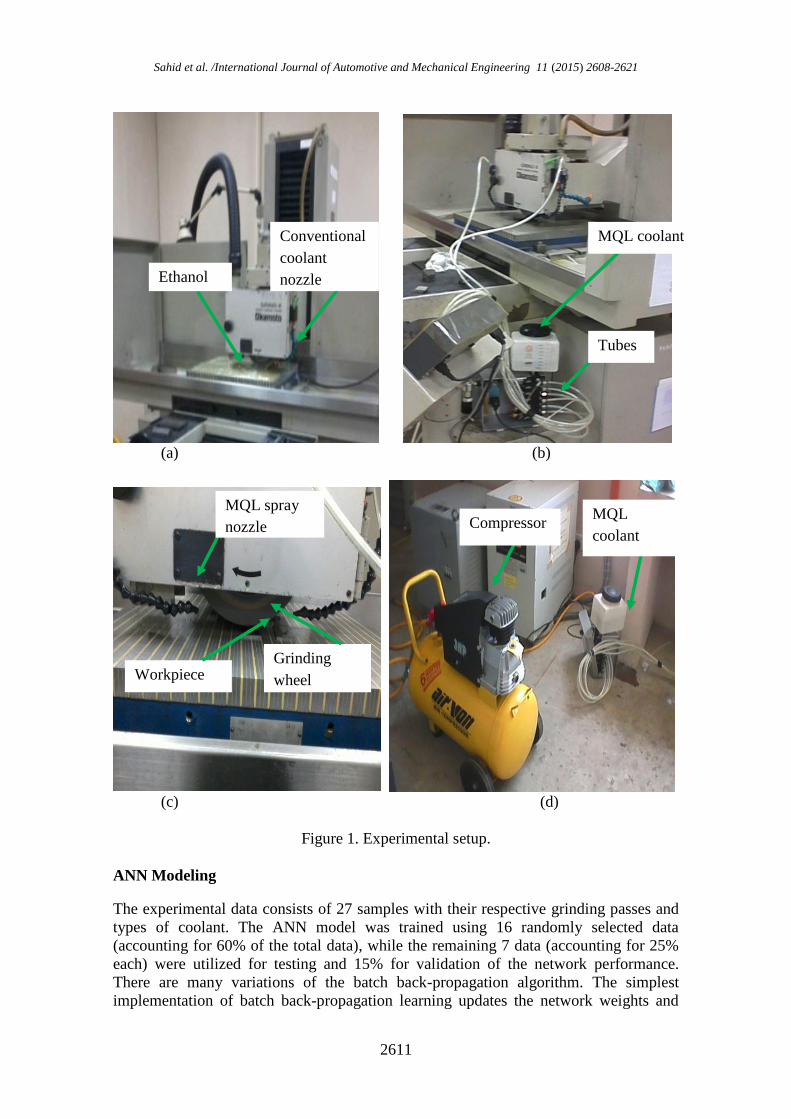
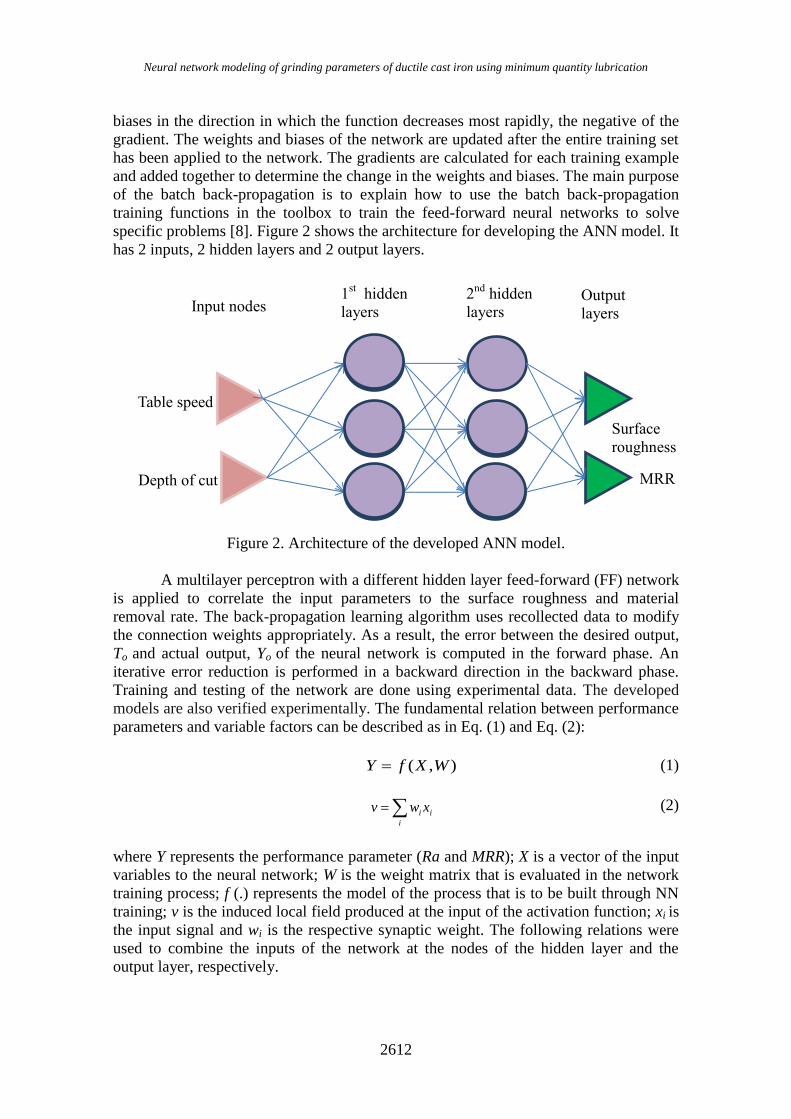
specific problems [8]. Figure 2 shows the architecture for developing the ANN model. It
has 2 inputs, 2 hidden layers and 2 output layers.
Figure 2. Architecture of the developed ANN model.
A multilayer perceptron with a different hidden layer feed-forward (FF) network
is applied to correlate the input parameters to the surface roughness and material
removal rate. The back-propagation learning algorithm uses recollected data to modify
the connection weights appropriately. As a result, the error between the desired output,
To and actual output, Yo of the neural network is computed in the forward phase. An
iterative error reduction is performed in a backward direction in the backward phase.
Training and testing of the network are done using experimental data. The developed
models are also verified experimentally. The fundamental relation between performance
parameters and variable factors can be described as in Eq. (1) and Eq. (2):
),( WXfY (1)
i
ii xwv (2)
where Y represents the performance parameter (Ra and MRR); X is a vector of the input
variables to the neural network; W is the weight matrix that is evaluated in the network
training process; f (.) represents the model of the process that is to be built through NN
training; v is the induced local field produced at the input of the activation function; xi is
the input signal and wi is the respective synaptic weight. The following relations were
used to combine the inputs of the network at the nodes of the hidden layer and the
output layer, respectively.
Table speed
Depth of cut
1st hidden
layers
2nd
hidden
layers Output
layers Input nodes
Surface
roughness
MRR
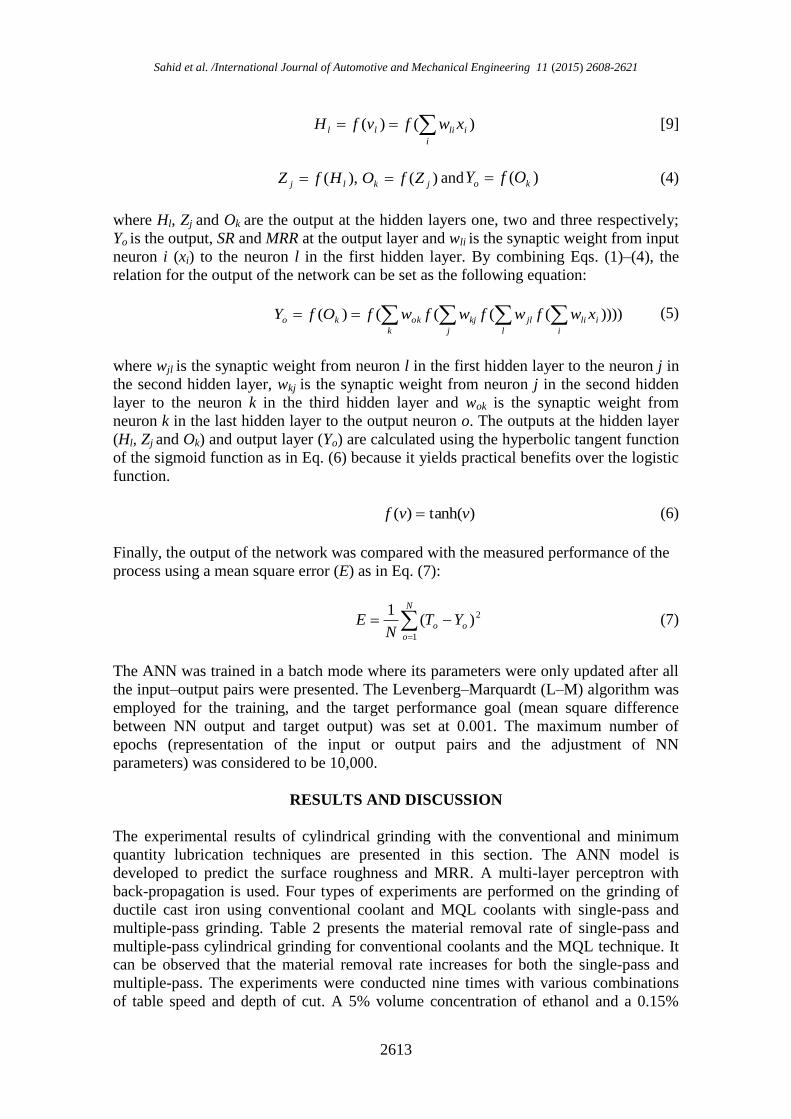
Sahid et al. /International Journal of Automotive and Mechanical Engineering 11 (2015) 2608-2621
2613
i
ilill xwfvfH )()( [9]
),( lj HfZ )( jk ZfO and )( ko OfY (4)
where Hl, Zj and Ok are the output at the hidden layers one, two and three respectively;
Yo is the output, SR and MRR at the output layer and wli is the synaptic weight from input
neuron i (xi) to the neuron l in the first hidden layer. By combining Eqs. (1)–(4), the
relation for the output of the network can be set as the following equation:
k j l i
ilijlkjokko xwfwfwfwfOfY ))))(((()( (5)
where wjl is the synaptic weight from neuron l in the first hidden layer to the neuron j in
the second hidden layer, wkj is the synaptic weight from neuron j in the second hidden
layer to the neuron k in the third hidden layer and wok is the synaptic weight from
neuron k in the last hidden layer to the output neuron o. The outputs at the hidden layer
(Hl, Zj and Ok) and output layer (Yo) are calculated using the hyperbolic tangent function
of the sigmoid function as in Eq. (6) because it yields practical benefits over the logistic
function.
)tanh()( vvf (6)
Finally, the output of the network was compared with the measured performance of the
process using a mean square error (E) as in Eq. (7):
N
o
oo YTN
E1
2)(1
(7)
The ANN was trained in a batch mode where its parameters were only updated after all
the input–output pairs were presented. The Levenberg–Marquardt (L–M) algorithm was
employed for the training, and the target performance goal (mean square difference
between NN output and target output) was set at 0.001. The maximum number of
epochs (representation of the input or output pairs and the adjustment of NN
parameters) was considered to be 10,000.
RESULTS AND DISCUSSION
The experimental results of cylindrical grinding with the conventional and minimum
quantity lubrication techniques are presented in this section. The ANN model is
developed to predict the surface roughness and MRR. A multi-layer perceptron with
back-propagation is used. Four types of experiments are performed on the grinding of
ductile cast iron using conventional coolant and MQL coolants with single-pass and
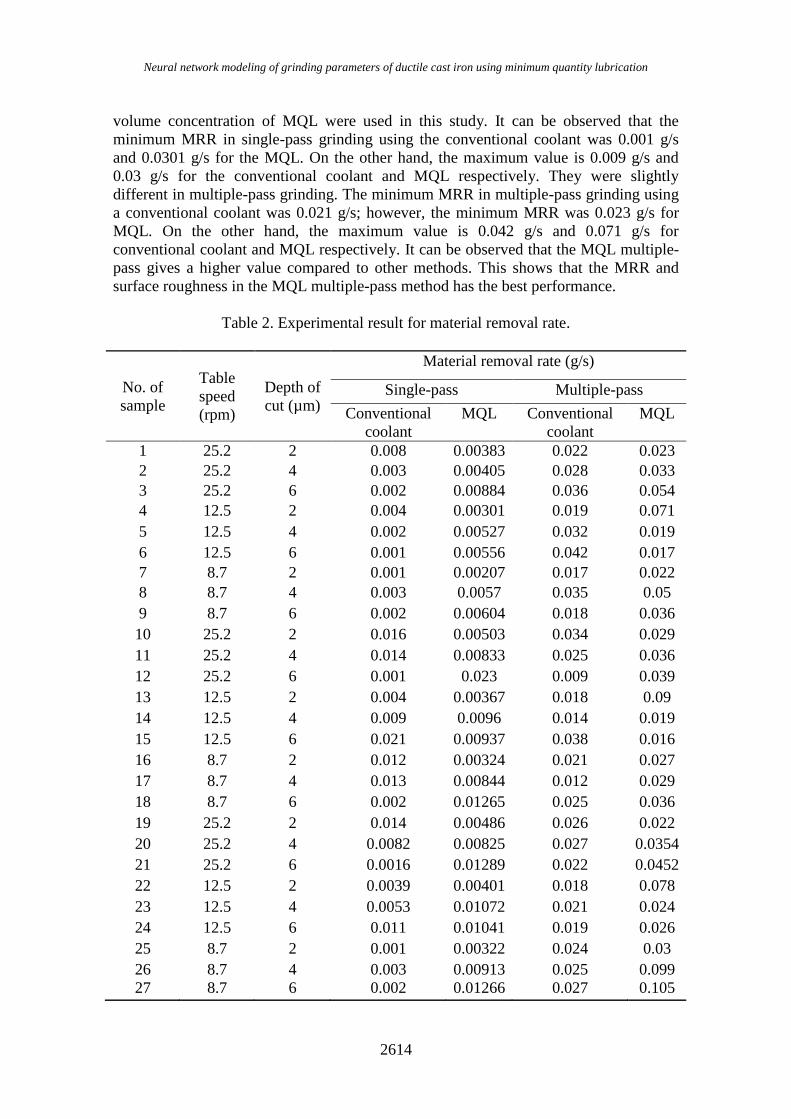
multiple-pass grinding. Table 2 presents the material removal rate of single-pass and
multiple-pass cylindrical grinding for conventional coolants and the MQL technique. It
can be observed that the material removal rate increases for both the single-pass and
multiple-pass. The experiments were conducted nine times with various combinations
of table speed and depth of cut. A 5% volume concentration of ethanol and a 0.15%
Neural network modeling of grinding parameters of ductile cast iron using minimum quantity lubrication
2614
volume concentration of MQL were used in this study. It can be observed that the
minimum MRR in single-pass grinding using the conventional coolant was 0.001 g/s
and 0.0301 g/s for the MQL. On the other hand, the maximum value is 0.009 g/s and
0.03 g/s for the conventional coolant and MQL respectively. They were slightly
different in multiple-pass grinding. The minimum MRR in multiple-pass grinding using
a conventional coolant was 0.021 g/s; however, the minimum MRR was 0.023 g/s for
MQL. On the other hand, the maximum value is 0.042 g/s and 0.071 g/s for
conventional coolant and MQL respectively. It can be observed that the MQL multiple-
pass gives a higher value compared to other methods. This shows that the MRR and
surface roughness in the MQL multiple-pass method has the best performance.
Table 2. Experimental result for material removal rate.
No. of
sample
Table
speed
(rpm)
Depth of
cut (µm)
Material removal rate (g/s)
Single-pass Multiple-pass
Conventional
coolant
MQL Conventional
coolant
MQL
1 25.2 2 0.008 0.00383 0.022 0.023
2 25.2 4 0.003 0.00405 0.028 0.033
3 25.2 6 0.002 0.00884 0.036 0.054
4 12.5 2 0.004 0.00301 0.019 0.071
5 12.5 4 0.002 0.00527 0.032 0.019
6 12.5 6 0.001 0.00556 0.042 0.017
7 8.7 2 0.001 0.00207 0.017 0.022
8 8.7 4 0.003 0.0057 0.035 0.05
9 8.7 6 0.002 0.00604 0.018 0.036
10 25.2 2 0.016 0.00503 0.034 0.029
11 25.2 4 0.014 0.00833 0.025 0.036
12 25.2 6 0.001 0.023 0.009 0.039
13 12.5 2 0.004 0.00367 0.018 0.09
14 12.5 4 0.009 0.0096 0.014 0.019
15 12.5 6 0.021 0.00937 0.038 0.016
16 8.7 2 0.012 0.00324 0.021 0.027
17 8.7 4 0.013 0.00844 0.012 0.029
18 8.7 6 0.002 0.01265 0.025 0.036
19 25.2 2 0.014 0.00486 0.026 0.022
20 25.2 4 0.0082 0.00825 0.027 0.0354
21 25.2 6 0.0016 0.01289 0.022 0.0452
22 12.5 2 0.0039 0.00401 0.018 0.078
23 12.5 4 0.0053 0.01072 0.021 0.024
24 12.5 6 0.011 0.01041 0.019 0.026
25 8.7 2 0.001 0.00322 0.024 0.03
26 8.7 4 0.003 0.00913 0.025 0.099
27 8.7 6 0.002 0.01266 0.027 0.105
Sahid et al. /International Journal of Automotive and Mechanical Engineering 11 (2015) 2608-2621
2615
Figure 3 shows the MRR value effects of various combinations of the factors:
table speed, depth of cut, type of grinding, and type of coolant. Multiple-pass grinding
has a higher MRR compared to the single-pass because the grinding wheel only passes
over the specimen once. On the other hand, for multiple-pass grinding, the grinding
wheel passes ten times. However, when using MQL, the MRR was slightly lower than
that of the conventional coolant. This is due to the particles having exceptional
tribological properties, which can reduce friction under extreme pressure conditions
[10].
Figure 3. Material removal rate for each coolant and type of grinding.
Figure 4. Surface roughness for each coolant and type of grinding.
Figure 4 shows the surface roughness value effects of various combinations of
the factors: table speed, depth of cut, type of grinding, and type of coolant. Multiple-
pass grinding has a higher surface roughness compared to the single-pass because the
grinding wheel only passes over the specimen once. From the results it was observed
that the increased number of cutting passes makes the surface roughness increase
0
0.02
0.04
0.06
0.08
0.1
0.12
1 2 3 4 5 6 7 8 9 10 11 12 13 14 15 16 17 18 19 20 21 22 23 24 25 26 27
Mat
eria
l re
mo
val
Rat
e (g
/s)
Sample
Conventional coolant (SP)MQL (SP)Conventional coolant (MP)MQL (MP)
0
0.1
0.2
0.3
0.4
0.5
0.6
0.7
0.8
1 2 3 4 5 6 7 8 9 10 11 12 13 14 15 16 17 18 19 20 21 22 23 24 25 26 27
Surf
ace
Ro
ughnes
s (µ
m)
Sample
Conventional coolant (SP) MQL (SP) Conventional coolant (MP) MQL (MP)
Neural network modeling of grinding parameters of ductile cast iron using minimum quantity lubrication
2616
consequently. There was a quite linear relationship between the number of cutting
passes and surface roughness. As the number of cutting passes increases, this results in
more material being removed and consequently a high grinding force. The grinding
forces are an important quantitative indicator to characterize the mode of material
removal because the specific grinding energy and the surface damage are strongly
dependent on the grinding forces. Higher grinding forces result in increased friction.
The friction of the grinding wheel increased the values of surface roughness [11].
(a) MQL multiple-pass for MRR (b) MQL multiple-pass for Ra
(c) MQL single-pass for MRR (d) MQL single-pass for Ra
(e) Conventional single-pass for MRR (f) Conventional single-pass for Ra
(g) MQL single-pass for MRR h) MQL single-pass for Ra
Figure 5. Predicted values for each coolant and type of grinding.
0
0.005
0.01
0.015
1 2 3 4 5 6
Ou
tpu
t
Sample
MRR MRR Output
0
0.1
0.2
0.3
0.4
0.5
0.6
1 2 3 4 5 6
Ou
tpu
t
Sample
Ra
Ra Output
0
0.01
0.02
0.03
0.04
0.05
1 2 3 4 5 6
Ou
tpu
t
Sample
MRR
MRROutput
0
0.1
0.2
0.3
0.4
0.5
0.6
1 2 3 4 5 6
Ou
tpu
t
Sample
Ra
Ra Output
0
0.02
0.04
0.06
0.08
0.1
1 2 3 4 5 6
Ou
tpu
t
Sample
MRR
MRR Output
0
0.05
0.1
0.15
0.2
0.25
0.3
1 2 3 4 5 6
Ou
tpu
t
Sample
SR
SR Output
0
0.005
0.01
0.015
1 2 3 4 5 6 7
Ou
tpu
t
Sample
MRR
MRROutput
0
0.1
0.2
0.3
0.4
0.5
0.6
0.7
1 2 3 4 5 6 7
Ou
tpu
t
Sample
SR
SR Output
Sahid et al. /International Journal of Automotive and Mechanical Engineering 11 (2015) 2608-2621
2617
The ANN model was developed for predicting the surface roughness and
material removal rate based on the multi-layer perceptron technique. The Levenberg–
Marquardt (L–M) algorithm was used for the training, and the target performance which
is MSE was set to 0.001 [12]. The maximum number of epochs for demonstration of the
input/output pairs and the modification of ANN parameters was considered to be
10,000. Figure 5 shows the actual versus predicted values for both systems, namely
conventional and MQL for multiple-pass and single-pass by ANN analysis. The ANN
model was trained on 60% of the total data, while 25% of the total data was used for
testing and the remaining 15% was used for validation. It can be observed that most of
the predicted data approximate with the actual data. The red line indicates the
experimental value and the dashed line indicates the actual value (target output).
Table 3. Error analysis for the network of surface roughness.
Conventional coolant MQL
Performance Surface roughness (µm)
Single-pass Multiple-pass Single-pass Multiple-pass
MSE 2.90176x10⁻⁵
0.00176 1.40126x10⁻⁵
0.00126
NMSE 0.008272871 0.32435 0.004375871 0.22335
MAE 0.003719542 0.02398 0.002712542 0.02138
Min Abs Error 0.000367596 0.00192 0.000164596 0.00132
Max Abs Error 0.010301721 0.10034 0.010101421 0.10002
r 0.998236328 0.89156 0.99823768 0.901236
Table 4. Error analysis for the network of material removal rate.
Conventional coolant MQL
Performance MRR(g/s)
Single-pass Multiple-pass Single-pass Multiple-pass
MSE 0.4716321 0.123632 0.4316321 0.134332
NMSE 0.46149965 0.00688 0.4216465 0.00548
MAE 0.00187113 0.00322 0.00177113 0.00102
Min Abs Error 0.00040576 0.0002 0.00041976 0.0001
Max Abs Error 0.00372336 0.00261 0.0021236 0.00222
r 0.99091562 0.99866 0.9923212 0.99826
Tables 3 and 4 present the error analysis for the network of surface roughness
and MRR within percentage relative errors in the verification cases. The tables show the
actual versus predicted values for the conventional and MQL methods with single-pass
and multiple-passes by ANN analysis. The ANN prediction yields the statistical
coefficients, giving the linear correlation coefficient (r) value of 0.99 for both cases. The
regression coefficients obtained from testing of the ANN were perfect and within the
acceptable limits in both cases. As the correlation coefficient approaches 1, the accuracy
of the prediction advances. Thus, the correlation coefficient range is very close to 1,
which consequently indicates excellent agreement between the experimental and the
ANN predicted results [13].
Neural network modeling of grinding parameters of ductile cast iron using minimum quantity lubrication
2618
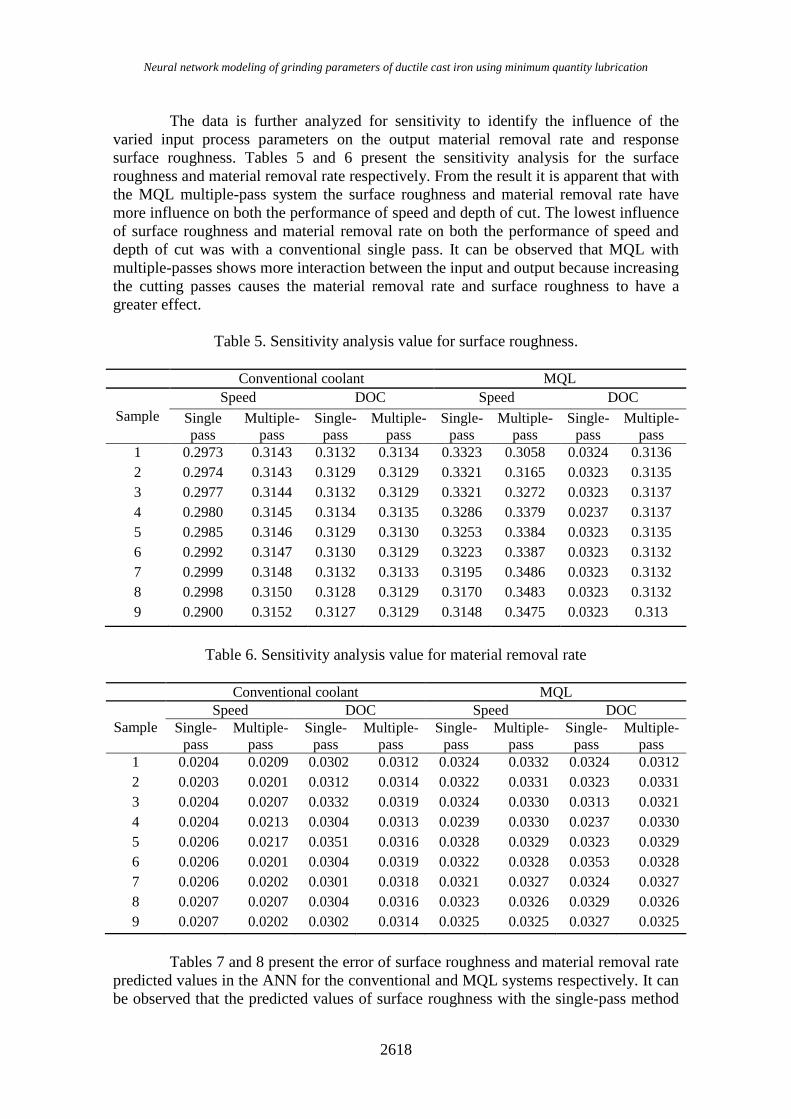
The data is further analyzed for sensitivity to identify the influence of the
varied input process parameters on the output material removal rate and response
surface roughness. Tables 5 and 6 present the sensitivity analysis for the surface
roughness and material removal rate respectively. From the result it is apparent that with
the MQL multiple-pass system the surface roughness and material removal rate have
more influence on both the performance of speed and depth of cut. The lowest influence
of surface roughness and material removal rate on both the performance of speed and
depth of cut was with a conventional single pass. It can be observed that MQL with
multiple-passes shows more interaction between the input and output because increasing
the cutting passes causes the material removal rate and surface roughness to have a
greater effect.
Table 5. Sensitivity analysis value for surface roughness.
Conventional coolant MQL
Sample
Speed DOC Speed DOC
Single
pass
Multiple-
pass
Single-
pass
Multiple-
pass
Single-
pass
Multiple-
pass
Single-
pass
Multiple-
pass
1 0.2973 0.3143 0.3132 0.3134 0.3323 0.3058 0.0324 0.3136
2 0.2974 0.3143 0.3129 0.3129 0.3321 0.3165 0.0323 0.3135
3 0.2977 0.3144 0.3132 0.3129 0.3321 0.3272 0.0323 0.3137
4 0.2980 0.3145 0.3134 0.3135 0.3286 0.3379 0.0237 0.3137
5 0.2985 0.3146 0.3129 0.3130 0.3253 0.3384 0.0323 0.3135
6 0.2992 0.3147 0.3130 0.3129 0.3223 0.3387 0.0323 0.3132
7 0.2999 0.3148 0.3132 0.3133 0.3195 0.3486 0.0323 0.3132
8 0.2998 0.3150 0.3128 0.3129 0.3170 0.3483 0.0323 0.3132
9 0.2900 0.3152 0.3127 0.3129 0.3148 0.3475 0.0323 0.313
Table 6. Sensitivity analysis value for material removal rate
Conventional coolant MQL
Sample
Speed DOC Speed DOC
Single-
pass
Multiple-
pass
Single-
pass
Multiple-
pass
Single-
pass
Multiple-
pass
Single-
pass
Multiple-
pass
1 0.0204 0.0209 0.0302 0.0312 0.0324 0.0332 0.0324 0.0312
2 0.0203 0.0201 0.0312 0.0314 0.0322 0.0331 0.0323 0.0331
3 0.0204 0.0207 0.0332 0.0319 0.0324 0.0330 0.0313 0.0321
4 0.0204 0.0213 0.0304 0.0313 0.0239 0.0330 0.0237 0.0330
5 0.0206 0.0217 0.0351 0.0316 0.0328 0.0329 0.0323 0.0329
6 0.0206 0.0201 0.0304 0.0319 0.0322 0.0328 0.0353 0.0328
7 0.0206 0.0202 0.0301 0.0318 0.0321 0.0327 0.0324 0.0327
8 0.0207 0.0207 0.0304 0.0316 0.0323 0.0326 0.0329 0.0326
9 0.0207 0.0202 0.0302 0.0314 0.0325 0.0325 0.0327 0.0325
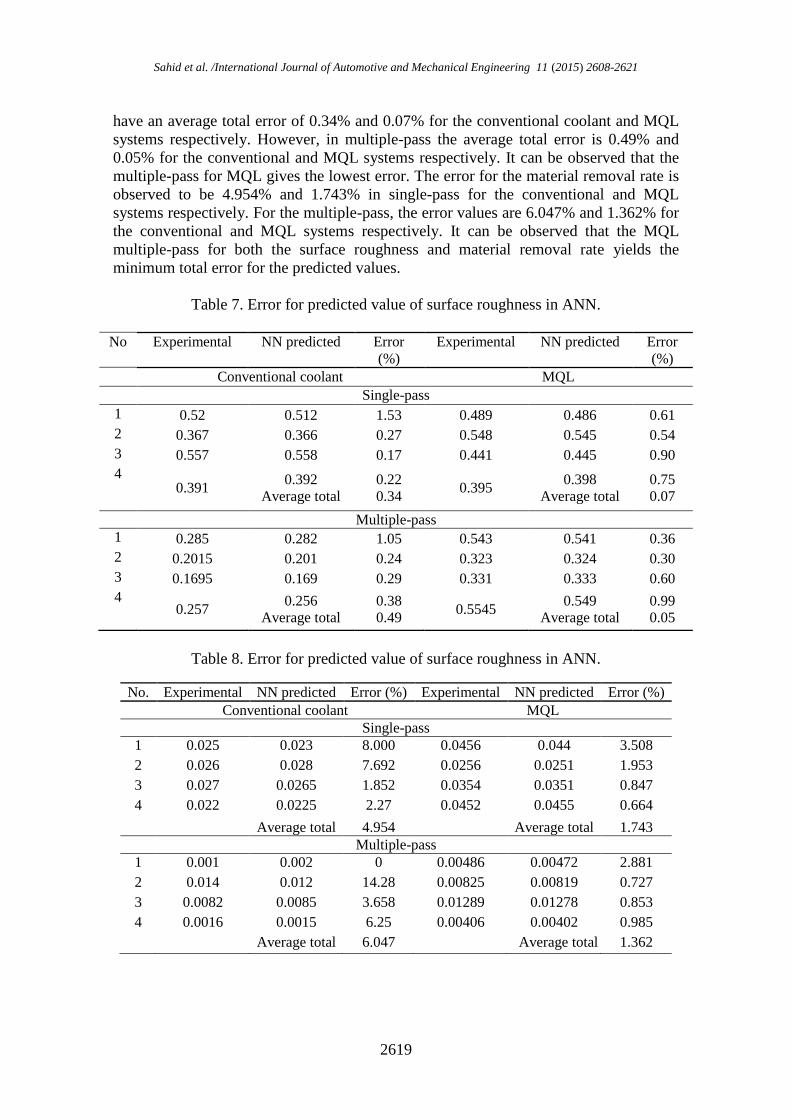
Tables 7 and 8 present the error of surface roughness and material removal rate
predicted values in the ANN for the conventional and MQL systems respectively. It can
be observed that the predicted values of surface roughness with the single-pass method
Sahid et al. /International Journal of Automotive and Mechanical Engineering 11 (2015) 2608-2621
2619
have an average total error of 0.34% and 0.07% for the conventional coolant and MQL
systems respectively. However, in multiple-pass the average total error is 0.49% and
0.05% for the conventional and MQL systems respectively. It can be observed that the
multiple-pass for MQL gives the lowest error. The error for the material removal rate is
observed to be 4.954% and 1.743% in single-pass for the conventional and MQL
systems respectively. For the multiple-pass, the error values are 6.047% and 1.362% for
the conventional and MQL systems respectively. It can be observed that the MQL
multiple-pass for both the surface roughness and material removal rate yields the
minimum total error for the predicted values.
Table 7. Error for predicted value of surface roughness in ANN.
No Experimental NN predicted Error
(%)
Experimental NN predicted Error
(%)
Conventional coolant MQL
Single-pass
1 0.52 0.512 1.53 0.489 0.486 0.61
2 0.367 0.366 0.27 0.548 0.545 0.54
3 0.557 0.558 0.17 0.441 0.445 0.90
4 0.391
0.392
Average total
0.22
0.34 0.395
0.398
Average total
0.75
0.07
Multiple-pass
1 0.285 0.282 1.05 0.543 0.541 0.36
2 0.2015 0.201 0.24 0.323 0.324 0.30
3 0.1695 0.169 0.29 0.331 0.333 0.60
4 0.257
0.256
Average total
0.38
0.49 0.5545
0.549
Average total
0.99
0.05
Table 8. Error for predicted value of surface roughness in ANN.
No. Experimental NN predicted Error (%) Experimental NN predicted Error (%)
Conventional coolant MQL
Single-pass
1 0.025 0.023 8.000 0.0456 0.044 3.508
2 0.026 0.028 7.692 0.0256 0.0251 1.953
3 0.027 0.0265 1.852 0.0354 0.0351 0.847
4 0.022 0.0225 2.27 0.0452 0.0455 0.664
Average total 4.954 Average total 1.743
Multiple-pass
1 0.001 0.002 0 0.00486 0.00472 2.881
2 0.014 0.012 14.28 0.00825 0.00819 0.727
3 0.0082 0.0085 3.658 0.01289 0.01278 0.853
4 0.0016 0.0015 6.25 0.00406 0.00402 0.985
Average total 6.047 Average total 1.362
Neural network modeling of grinding parameters of ductile cast iron using minimum quantity lubrication
2620
CONCLUSIONS
In order to optimize the two parameters to produce the minimum surface roughness and
maximize the MRR value in the experiment, the combination of table speed and depth
of cut influences the process. The grinding process with MQL coolants gives the best
performance compared to conventional coolants according to the output, which is the
material removal rate and surface roughness. From the sensitivity analysis, it is
concluded that MQL multiple-pass has the highest influence on depth of cut and table
speed compared to the conventional single pass, conventional multiple-pass and MQL
single pass. This is because the MQL multiple-pass method increases the number of
cutting passes so that the surface roughness and material removal rate will have a
greater influence on the table speed and depth of cut. Meanwhile, the conventional
multiple-pass method has less influence even though the cutting speed is increased,
because the coolants used in the conventional technique are less effective than the MQL
system.
ACKNOWLEDGMENTS
The authors would like to acknowledgements Ministry of Education Malaysia and
Universiti Malaysia Pahang for providing laboratory facilities and financial support
under project no. RDU120310.
REFERENCES
[1] Shen BS, Albert J and Tung, Simon C. Application of nanofluids in minimum
quantity lubrication grinding. Tribology Transactions. 2008;51:730-7.
[2] Hadad MH, Mostafa. An investigation on surface grinding of hardened stainless
steel S34700 and aluminum alloy AA6061 using minimum quantity of
lubrication (MQL) technique. The International Journal of Advanced
Manufacturing Technology. 2013;68:2145-58.
[3] Astakhov VP. Ecological machining: near-dry machining. Machining: Springer;
2008. p. 195-223.
[4] Shen BS, Albert J. Minimum quantity lubrication (MQL) grinding using vitrified
CBN wheels. The North American Manufacturing Research Institution of SME.
2009;37:129-36.
[5] Murthy GSS, Vijay Johnston, David B Rausch, Kent D Tumbleson, ME.
Evaluation and strategies to improve fermentation characteristics of modified
dry-grind corn processes. Cereal Chemistry. 2006;83:455-9.
[6] Rajagopalan SP, Elankovan McCalla, Darold Stowers, Mark. Enhancing
profitability of dry mill ethanol plants. Applied Biochemistry and
Biotechnology. 2005;120:37-50.
[7] Belentani RdMFJ, Hamilton Canarim, Rubens Chinali Diniz, Anselmo Eduardo
Hassui, Amauri Aguiar, Paulo Roberto Bianchi, Eduardo Carlos. Utilization of
minimum quantity lubrication (MQL) with water in CBN grinding of steel.
Materials Research. 2014;17:88-96.
[8] Rahman MK, Md Ashikur Rahman Kadirgama, K Bakar, Rosli A. Prediction of
material removal rate for Ti-5Al-2.5 Sn in EDM using multi-layered perceptron
neural network technique. Proceedings of the 12th WSEAS international
conference on Neural networks, fuzzy systems, evolutionary computing &
Sahid et al. /International Journal of Automotive and Mechanical Engineering 11 (2015) 2608-2621
2621
automation: World Scientific and Engineering Academy and Society; 2011. p.
17-23.
[9] Zhang H, Wu Q, Lin J, Chen J, 124304. ZXAP. Thermal conductivity of
polyethylene glycol nanofluids containing carbon coated metal nanoparticles.
Journal of Applied Physics. 2010;108:124304–9.
[10] Rahman MK, K. Performance of water-based zinc oxide nanoparticle coolant
during abrasive grinding of ductile cast iron. Journal of Nanoparticles.
2014;2014.
[11] Xu XY, YQ Xu, HJ. Effect of grinding temperatures on the surface integrity of a
nickel-based superalloy. Journal of Materials Processing Technology.
2002;129:359-63.
[12] Ashikur MK, Rahman Kadirgama, Kumaaran Rosli, A Bakar. Artificial
intelligence model to predict surface roughness of Ti-15-3 alloy in EDM
process. World Academiy of Science, Engineering and Technology. 2011;74.
[13] Rahman MK, K Ab Aziz, Azma Salwani. Artificial neural network modeling of
grinding of ductile cast iron using water based SiO2 nanocoolant. International
Journal of Automotive and Mechanical Engineering. 2014;9:1649-61.