39
NeuroEndocrine Tumors Diagnostic and therapeutic challenges: introduction Prof Eric Van Cutsem, MD, PhD Gastroenterology/Digestive Oncology Leuven, Belgium

NeuroEndocrine Tumors Diagnostic and therapeutic challenges:
introduction
Prof Eric Van Cutsem, MD, PhD
Gastroenterology/Digestive Oncology
Leuven, Belgium
Introduction to Neuroendocrine
Tumours
• Neuroendocrine tumours (NET) are relatively rare; this is
associated with limited knowledge on disease management
• The natural history of NET is poorly understood
• At least 40 different entities are described arising in different
organs; different terminologies have also caused confusion
Diagnostic & therapeutic
challenges in NET
Heterogeneous group of tumors
Wide variety of clinical presentations
Late presentation
Over 60% of NETs are advanced at the time of diagnosis
The median survival for patients with advanced NET is 33 months
Different terminology and classifications
Histologic diagnosis may be difficult
Variety of therapeutic options/approaches
Limited phase III evidence for chemotherapy and PRRT

• Neuroendocrine cells: migrated from the neural crest to the gut endoderm, from multipotent stem cells
• Tumors arising from enterochromaffin cells located in neuroendocrine tissue throughout the body
• NETs present with functional and nonfunctional symptoms and include a heterogeneous group of neoplasms1,2
– Multiple endocrine neoplasia (MEN)de, type 1 and type 2/medullary thyroid carcinoma
– Gastroenteropancrtic neuroendocrine tumors (GEP-NETs)
– Islet cell tumors
– Pheochromocytoma/paraganglioma
– Poorly differentiated/small cell/atypical lung carcinoid
– Small cell carcinoma of the lung
– Merkel cell carcinoma
Neuroendocrine Tumors (NETs): A Diverse
Group of Malignancies, a Clinical Challenge
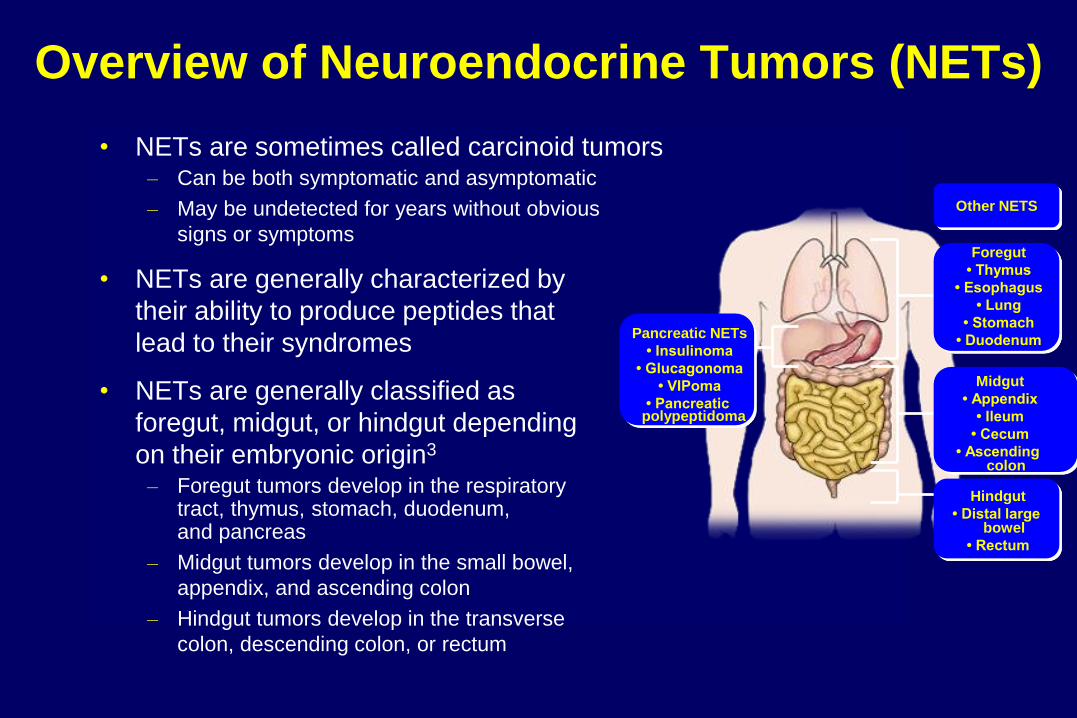
• NETs are sometimes called carcinoid tumors – Can be both symptomatic and asymptomatic
– May be undetected for years without obvious
signs or symptoms
• NETs are generally characterized by
their ability to produce peptides that
lead to their syndromes
• NETs are generally classified as
foregut, midgut, or hindgut depending
on their embryonic origin3 – Foregut tumors develop in the respiratory
tract, thymus, stomach, duodenum, and pancreas
– Midgut tumors develop in the small bowel,
appendix, and ascending colon
– Hindgut tumors develop in the transverse
colon, descending colon, or rectum
Overview of Neuroendocrine Tumors (NETs)
Pancreatic NETs
• Insulinoma
• Glucagonoma
• VIPoma
• Pancreatic polypeptidoma
Foregut
• Thymus
• Esophagus
• Lung
• Stomach
• Duodenum
Midgut
• Appendix
• Ileum
• Cecum
• Ascending colon
Hindgut
• Distal large bowel
• Rectum
Other NETS

19
73
19
74
19
75
19
76
19
77
19
78
19
79
19
80
19
81
19
82
19
83
19
84
19
85
19
86
19
87
19
88
19
89
19
90
19
91
19
92
19
93
19
94
19
95
19
96
19
97
19
98
19
99
20
00
20
01
20
02
20
03
20
04
0.00
1.00
2.00
3.00
4.00
5.00
6.00
0
100
200
300
400
500
600
Inci
de
nce
pe
r 1
00
,00
0 -
NET
s
Inci
de
nce
pe
r 1
00
,00
0 –
All
mal
ign
ant
ne
op
lasm
s
All malignant neoplasms
Neuroendocrine tumors
Yao JC et al. J Clin Oncol. 2008;26:3063-3072.
Incidence of NETs Increasing

US and European Incidence of NET
1Yao J, et al. J Clin Oncol. 2008;26:3063-3072. 2Taal BG, et al. Neuroendocrinology. 2004;80(suppl 1):3-7. 3Hauso O, et al. Cancer. 2008;113:2655-2664.
Men
Women
Study Period:
Inc
ide
nc
e r
ate
s p
er
100
,000
0.0
2.0
4.0
6.0
USA1 (SEER)
Netherlands2 Sweden2 Italy2 (Tuscany)
Switzerland2 (Vaud)
Norway3 Country:
2000-2004 1983-1998 1989-1996 1993-2004 1974-1997 1985-1991

Colon Neuroendocrine Stomach Pancreas Esophagus Hepatobiliary
0
100
1100
1200
103,312 cases (35/100,000)
Cas
es
(th
ou
san
ds)
29-year limited duration prevalence analysis based on SEER. SEER: Surveillance, Epidemiology, and End Results. Yao JC et al. J Clin Oncol. 2008;26:3063-3072.
NETs Are Second Most Prevalent
Gastrointestinal Tumor
NET Prevalence in the US, 2004
Median survival (1988 – 2004) • Localized 203 months • Regional 114 months • Distant 39 months

The GI Tract Is the Most Common Primary
Location of NET (US SEER Data)
Yao JC, et al. J Clin Oncol. 2008;26:3063-3072.
58%15%
27%Digestive
system
Lung
Other/ Unknown
Percent distribution (%)
17.2 Rectum
13.4 Jejunum/ileum
6.4 Pancreas
6.0 Stomach
4.0 Colon
3.8 Duodenum
3.2 Cecum
3.0 Appendix
0.8 Liver
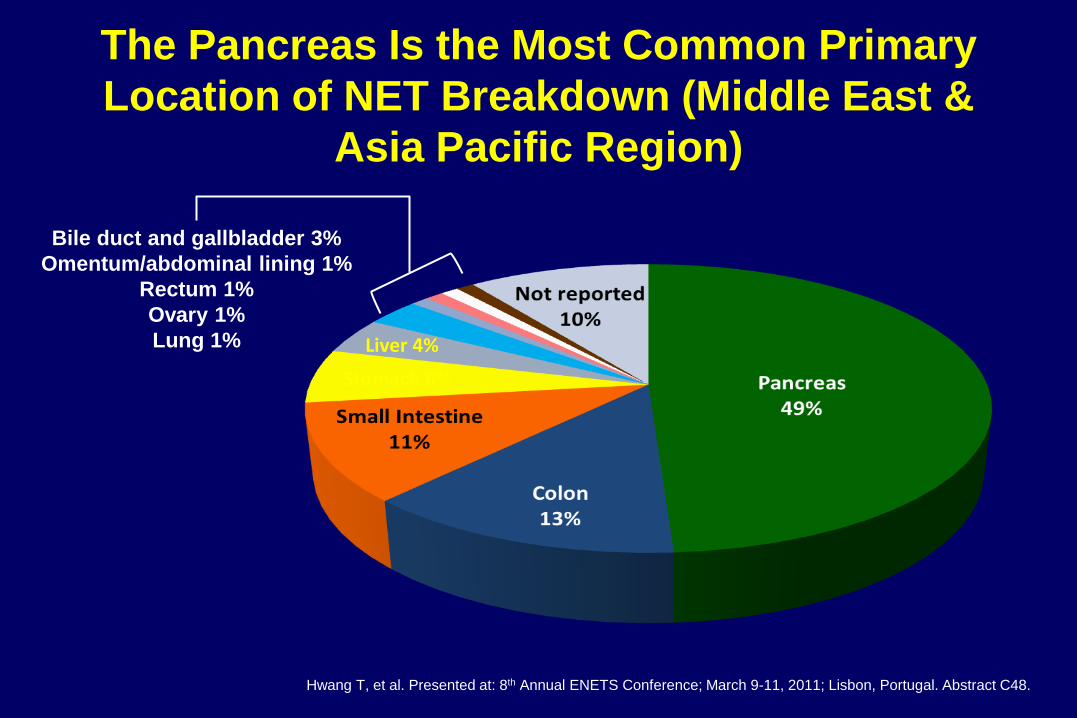
The Pancreas Is the Most Common Primary
Location of NET Breakdown (Middle East &
Asia Pacific Region)
Stomach 6%
Liver 4%
Bile duct and gallbladder 3%
Omentum/abdominal lining 1%
Rectum 1%
Ovary 1%
Lung 1%
Hwang T, et al. Presented at: 8th Annual ENETS Conference; March 9-11, 2011; Lisbon, Portugal. Abstract C48.
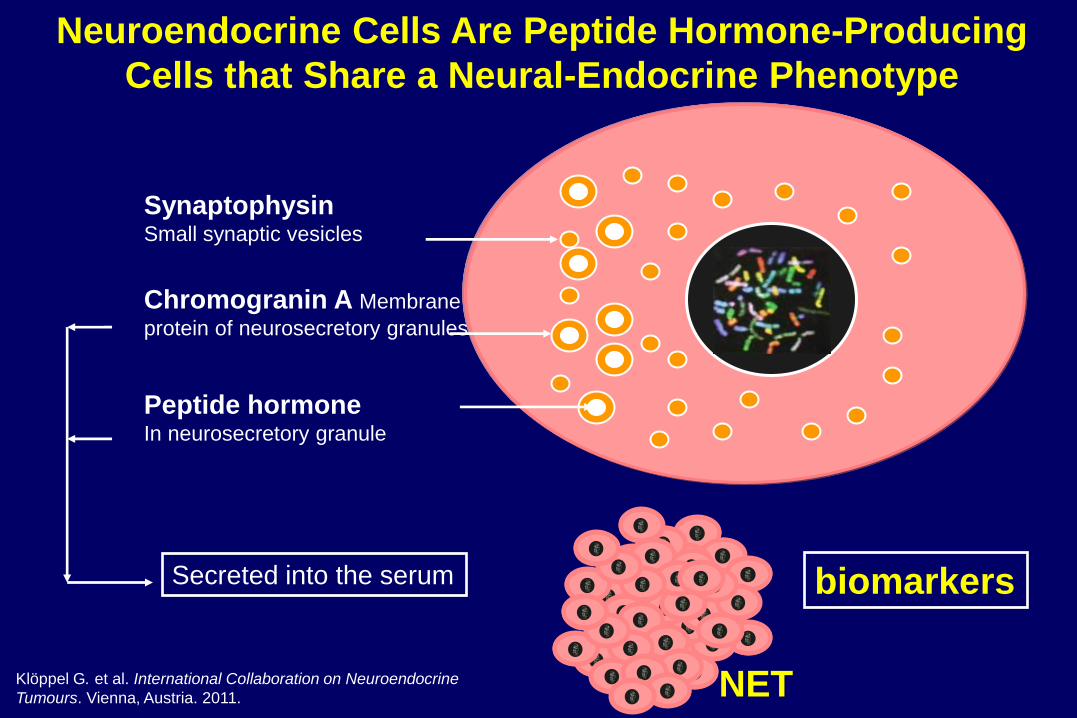
Neuroendocrine Cells Are Peptide Hormone-Producing
Cells that Share a Neural-Endocrine Phenotype
Klöppel G. et al. International Collaboration on Neuroendocrine
Tumours. Vienna, Austria. 2011.
Synaptophysin Small synaptic vesicles
Chromogranin A Membrane
protein of neurosecretory granules
Peptide hormone In neurosecretory granule
Secreted into the serum biomarkers
NET
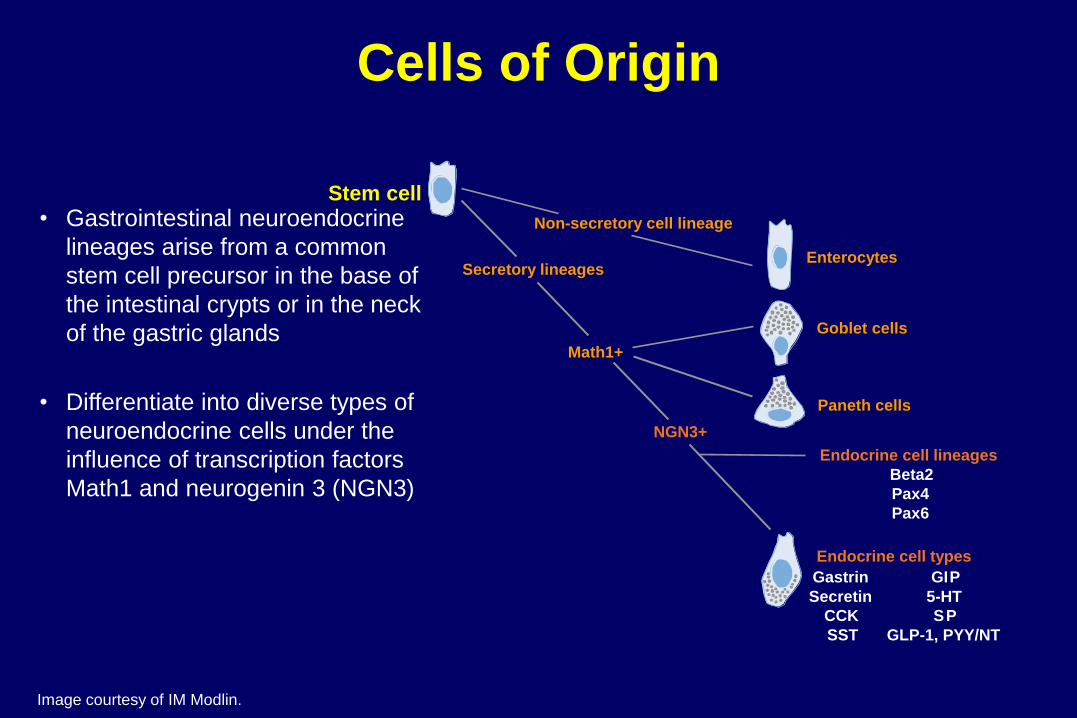
Endocrine cell types
Endocrine cell lineages
NGN3+
Math1+
Goblet cells
Stem cell
Non-secretory cell lineage
Secretory lineages Enterocytes
Paneth cells
Gastrin
Secretin
CCK
SST
Beta2
Pax4
Pax6
GI P
5-HT
S P
GLP-1, PYY/NT
• Gastrointestinal neuroendocrine
lineages arise from a common
stem cell precursor in the base of
the intestinal crypts or in the neck
of the gastric glands
• Differentiate into diverse types of
neuroendocrine cells under the
influence of transcription factors
Math1 and neurogenin 3 (NGN3)
Image courtesy of IM Modlin.
Cells of Origin
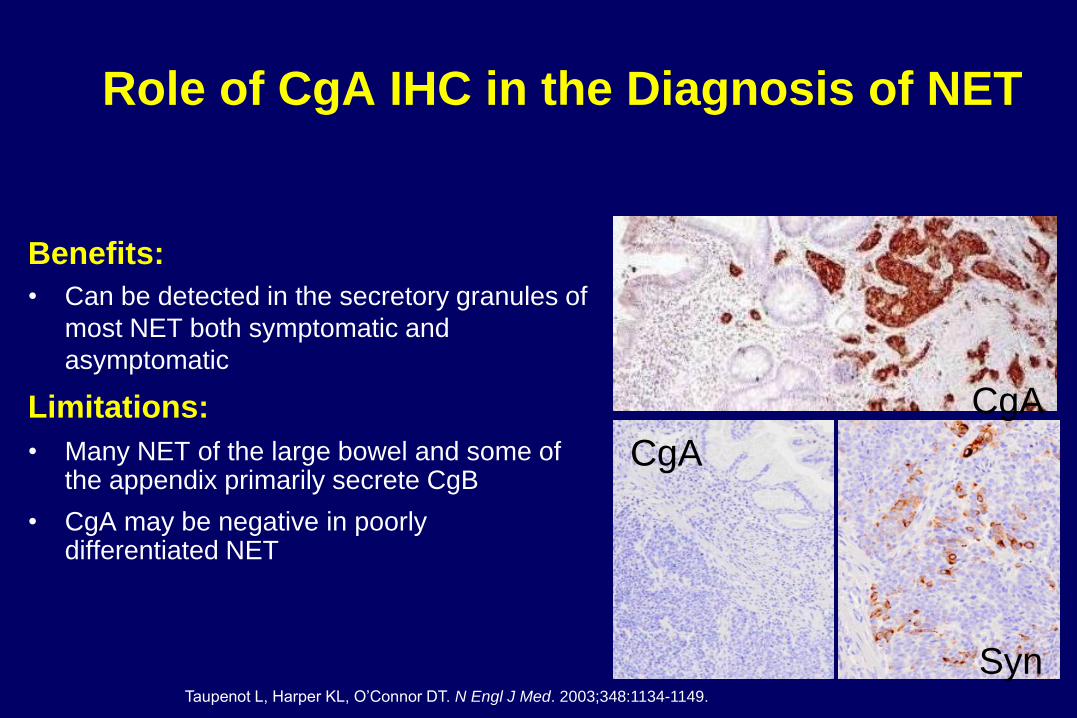
Role of CgA IHC in the Diagnosis of NET
Benefits:
• Can be detected in the secretory granules of
most NET both symptomatic and
asymptomatic
Limitations:
• Many NET of the large bowel and some of the appendix primarily secrete CgB
• CgA may be negative in poorly differentiated NET
Taupenot L, Harper KL, O’Connor DT. N Engl J Med. 2003;348:1134-1149.
CgA
Syn
CgA

Role of Synaptophysin IHC in the
Diagnosis of NET
Chetty R et al. Arch Pathol Lab Med 2008;132:1285-1289.
Benefits:
• Expressed independently of secretory
granules
• Useful in identifying poorly granulated and
poorly differentiated NET that may not
exhibit CgA staining
Limitations:
• Expression is not limited to neuroendocrine
cells
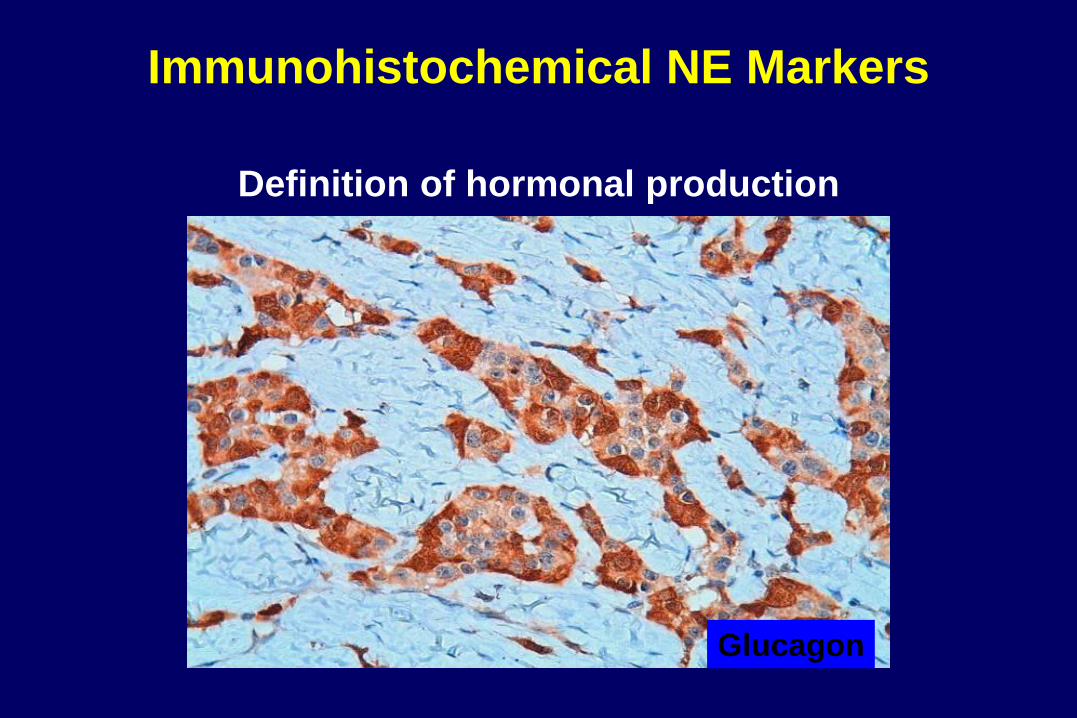
Glucagon
Definition of hormonal production
Immunohistochemical NE Markers
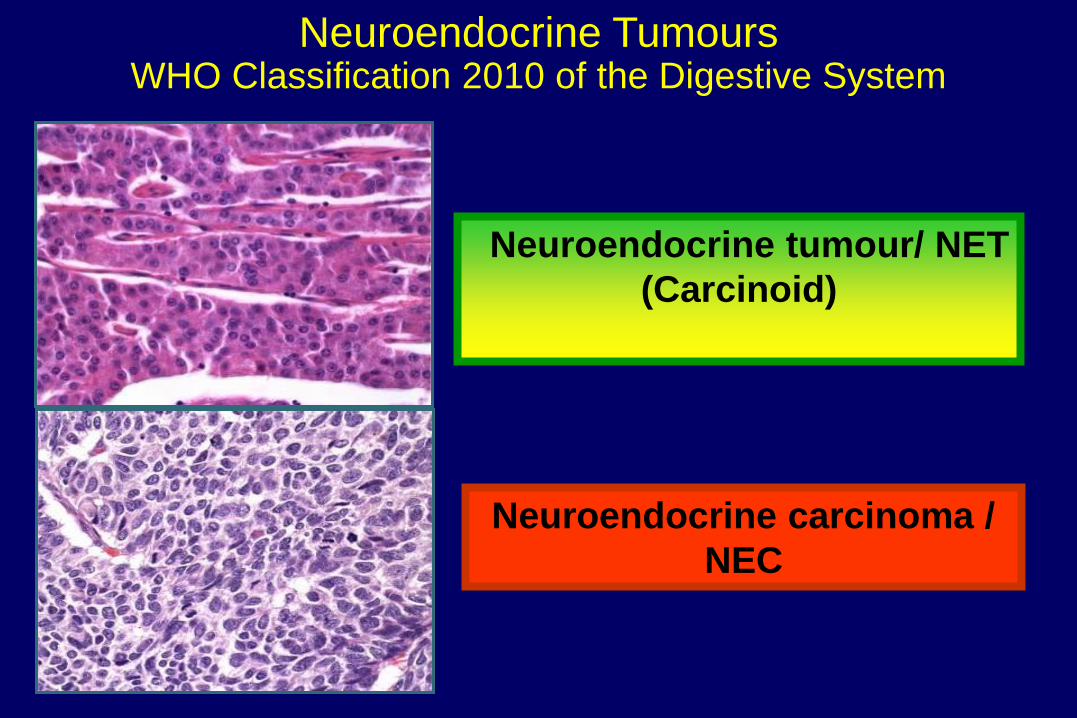
Neuroendocrine carcinoma /
NEC
Neuroendocrine tumour/ NET
(Carcinoid)
Neuroendocrine Tumours WHO Classification 2010 of the Digestive System
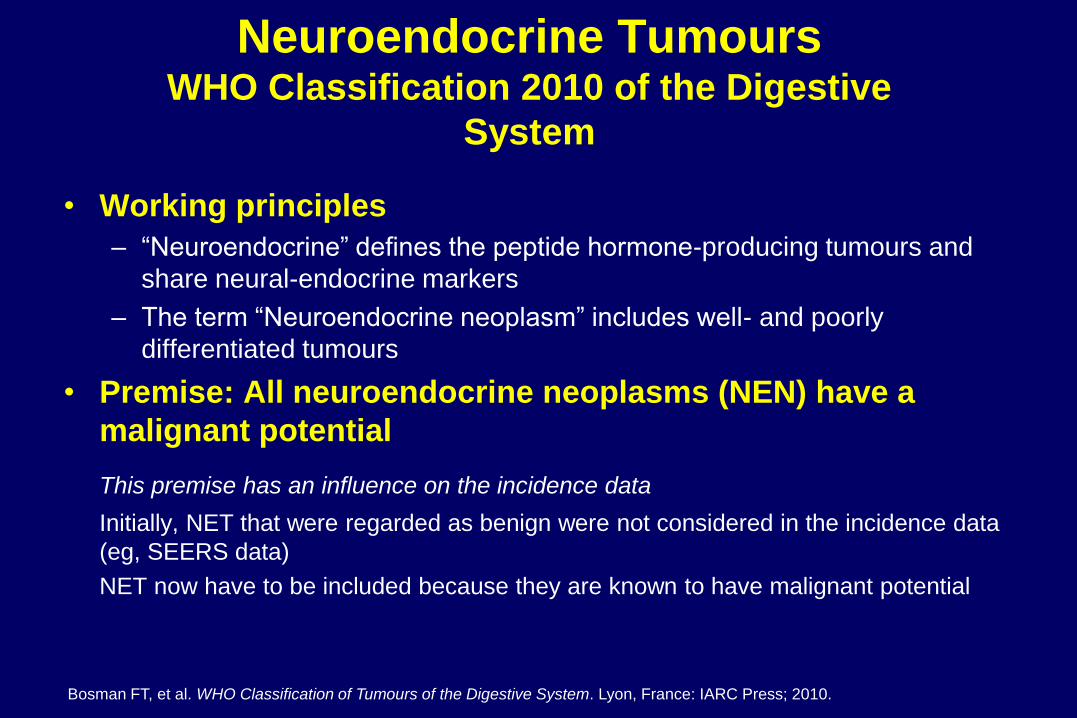
Bosman FT, et al. WHO Classification of Tumours of the Digestive System. Lyon, France: IARC Press; 2010.
Neuroendocrine Tumours WHO Classification 2010 of the Digestive
System
• Working principles
– “Neuroendocrine” defines the peptide hormone-producing tumours and
share neural-endocrine markers
– The term “Neuroendocrine neoplasm” includes well- and poorly
differentiated tumours
• Premise: All neuroendocrine neoplasms (NEN) have a
malignant potential
This premise has an influence on the incidence data
Initially, NET that were regarded as benign were not considered in the incidence data
(eg, SEERS data)
NET now have to be included because they are known to have malignant potential
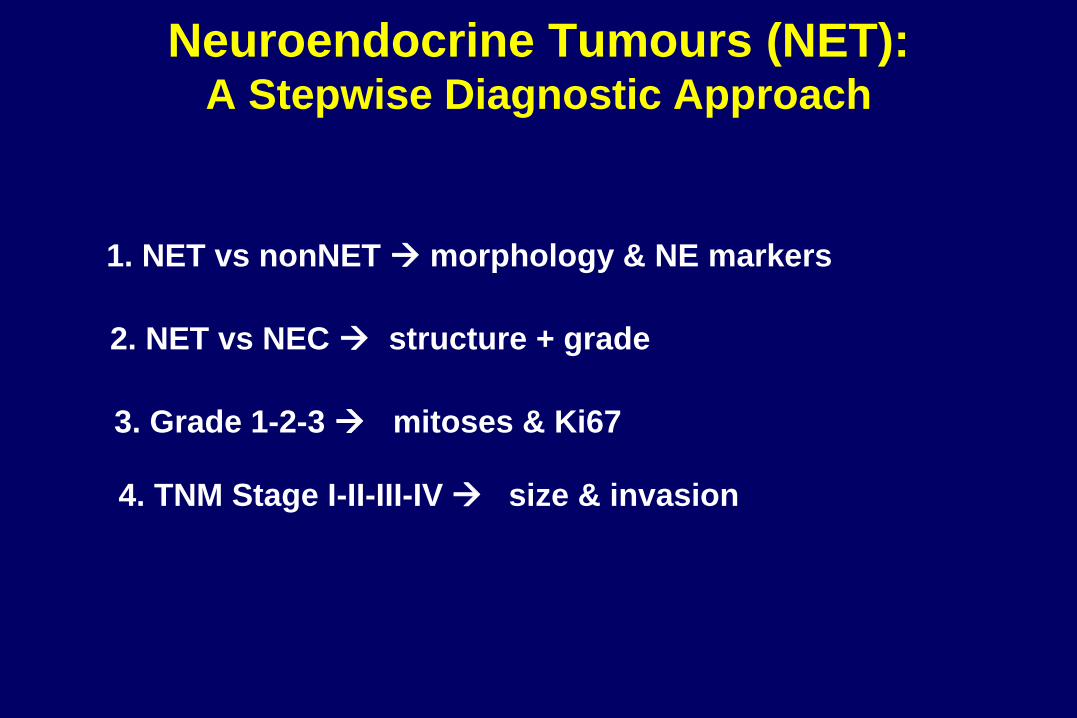
2. NET vs NEC structure + grade
3. Grade 1-2-3 mitoses & Ki67
1. NET vs nonNET morphology & NE markers
4. TNM Stage I-II-III-IV size & invasion
Neuroendocrine Tumours (NET): A Stepwise Diagnostic Approach
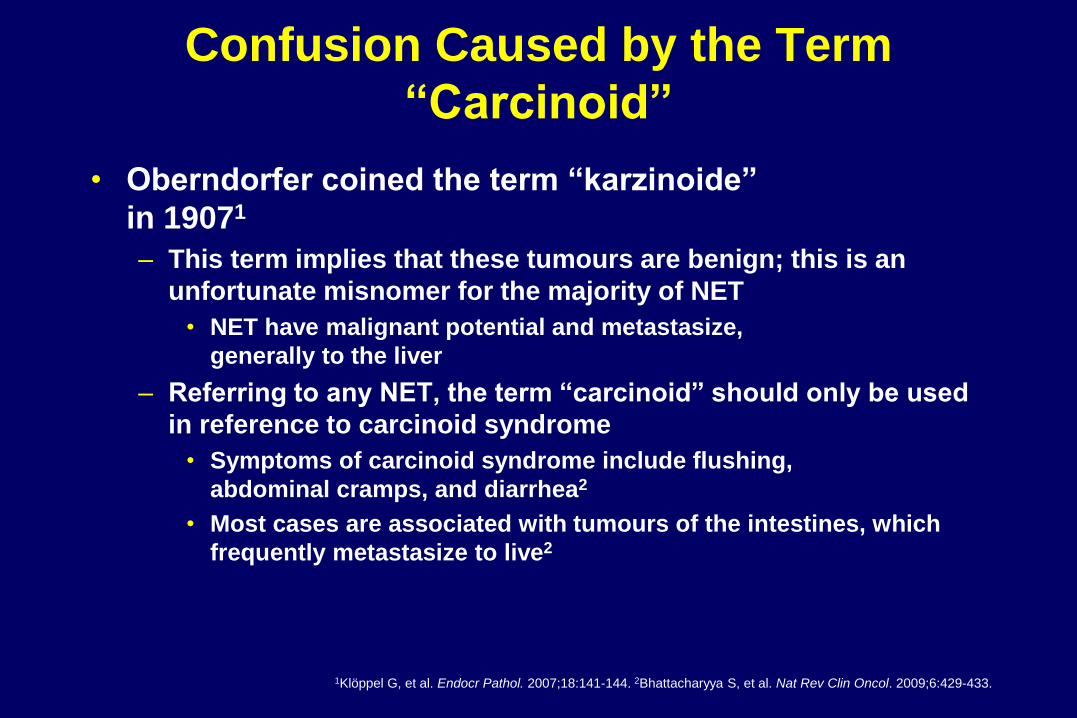
Confusion Caused by the Term
“Carcinoid”
• Oberndorfer coined the term “karzinoide”
in 19071
– This term implies that these tumours are benign; this is an
unfortunate misnomer for the majority of NET
• NET have malignant potential and metastasize,
generally to the liver
– Referring to any NET, the term “carcinoid” should only be used
in reference to carcinoid syndrome
• Symptoms of carcinoid syndrome include flushing,
abdominal cramps, and diarrhea2
• Most cases are associated with tumours of the intestines, which
frequently metastasize to live2
1Klöppel G, et al. Endocr Pathol. 2007;18:141-144. 2Bhattacharyya S, et al. Nat Rev Clin Oncol. 2009;6:429-433.
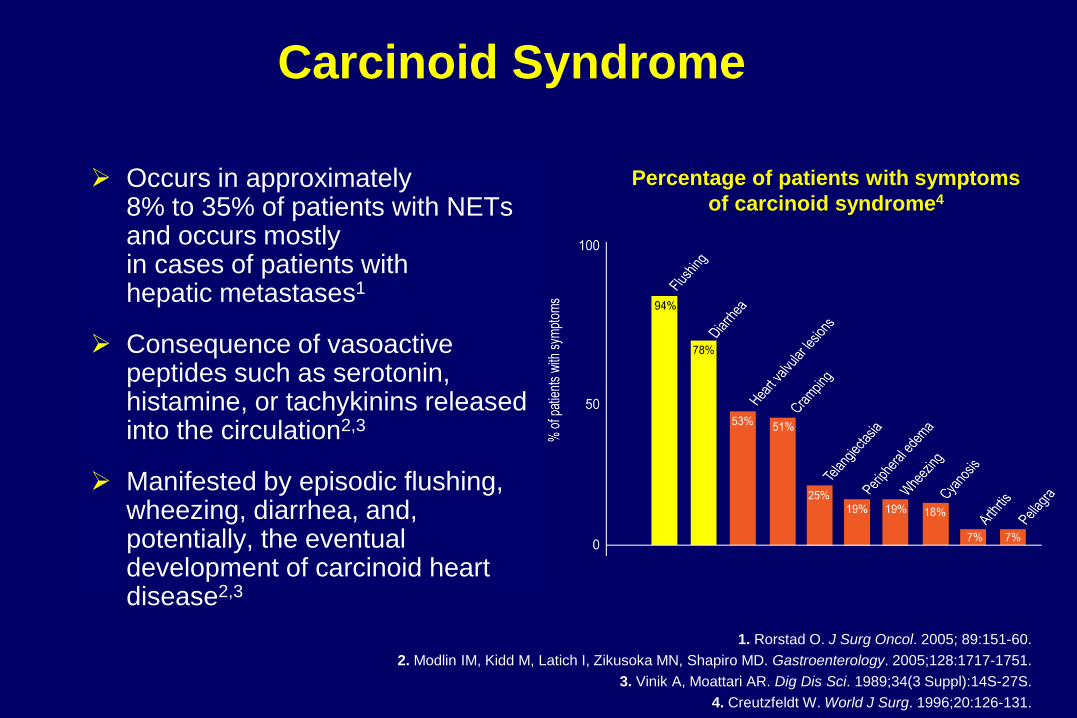
Carcinoid Syndrome
Occurs in approximately 8% to 35% of patients with NETs and occurs mostly in cases of patients with hepatic metastases1
Consequence of vasoactive peptides such as serotonin, histamine, or tachykinins released into the circulation2,3
Manifested by episodic flushing, wheezing, diarrhea, and, potentially, the eventual development of carcinoid heart disease2,3
1. Rorstad O. J Surg Oncol. 2005; 89:151-60.
2. Modlin IM, Kidd M, Latich I, Zikusoka MN, Shapiro MD. Gastroenterology. 2005;128:1717-1751.
3. Vinik A, Moattari AR. Dig Dis Sci. 1989;34(3 Suppl):14S-27S.
4. Creutzfeldt W. World J Surg. 1996;20:126-131.
Percentage of patients with symptoms
of carcinoid syndrome4

Bosman FT, et al. WHO Classification of Tumours of the Digestive System. Lyon, France: IARC Press; 2010.
WHO Classifications of Neuroendocrine
Neoplasms of the GEP System
WHO 1980 WHO 2000 WHO 2010
I. Carcinoid
Well-differentiated endocrine tumour (WDET)
Well-differentiated endocrine carcinoma (WDEC)
Poorly differentiated endocrine carinoma/small-cell carcinoma (PDEC)
Neuroendocrine tumours Grade 1 Grade 2
Neuroendocrine carcinoma Grade 3
II. Mucocarcinoid
III. Mixed forms carcinoid- adenocarcinoma
Mixed exocrine-endocrine carcinoma (MEEC)
Mixed adenoneuroendocrine carcinoma (MANEC)
IV. Pseudotumour lesions
Tumour-like lesions (TLL) Hyperplastic and preneoplastic lesions
Staging of NET According to
Tumour-Node-Metastasis (TNM)
• The European Neuroendocrine Tumour Society
(ENETS) and American Joint Committee on Cancer
(AJCC) have developed TNM
staging systems
• Staging systems are developed for the following
tumour locations:
– Gastric, duodenum/ampulla/proximal jejunum, pancreas1
– Lower jejunum and ileum, appendix, and colon and
rectum2
1Rindi G, et al. Virchows Arch. 2006;449:395-401; 2Rindi G, et al. Virchows Arch. 2007;451:757-762.

ENETS/AJCC TNM Staging Systems
ENETS = European Neuroendocrine Tumour Society
AJCC = American Joint Committee on Cancer
ENET/AJCC Classification Criteria – GI NET
Stage includes tumour location, size, lymph node involvement/distant metastasis
Stage I T1 N0 M0
Stage IIa T2 N0 M0
Stage IIb T3 N0 M0
Stage IIIa T4 N0 M0
Stage IIIb Any T N1 M0
Stage IV Any T Any N M1
1Rindi G, et al. Virchows Arch. 2006;449:395-401. 2Rindi G, et al. Virchows Arch. 2007;451:757-762. 3American Joint Committee On Cancer. AJCC Cancer Staging System. 7th ed.

Correlation of Tumour Stage and Cumulative
Survival (ENETS TNM Staging Proposal)
Pape UF, et al. Cancer. 2008;113:256-265.
I vs II P = .227
I vs III P = .048
I vs IV P<.001
II vs III P = .171
II vs IV P<.001
III vs IV P = .004
202 cases: gastric (48), duodenal (23), pancreatic (131)
Survival time (months)
0 50 100 150 200 250
0.0
0.2
0.4
0.6
0.8
1.0
Cu
mu
lati
ve s
urv
ival
Stage I
Stage II
Stage III
Stage IV

Grade G1 G2 G3
Ki67 index (%)** ≤2 3–20 >20
MI (mitotic count)* <2 2-20 >20
1. Rindi G, et al. Virchows Archiv. 2006;449:395-401. 2. Rindi G, et al. Virchows Archiv. 2007;451:757-762.
Grading of GEP-NET
According to ENETS/WHO/AJCC
*10 HPF (high power field) = 2 mm2, at least 40 fields (at 40× magnification) evaluated in areas of highest mitotic density.
** MIB1 antibody; % of 2,000 tumour cells in areas of highest nuclear labeling.
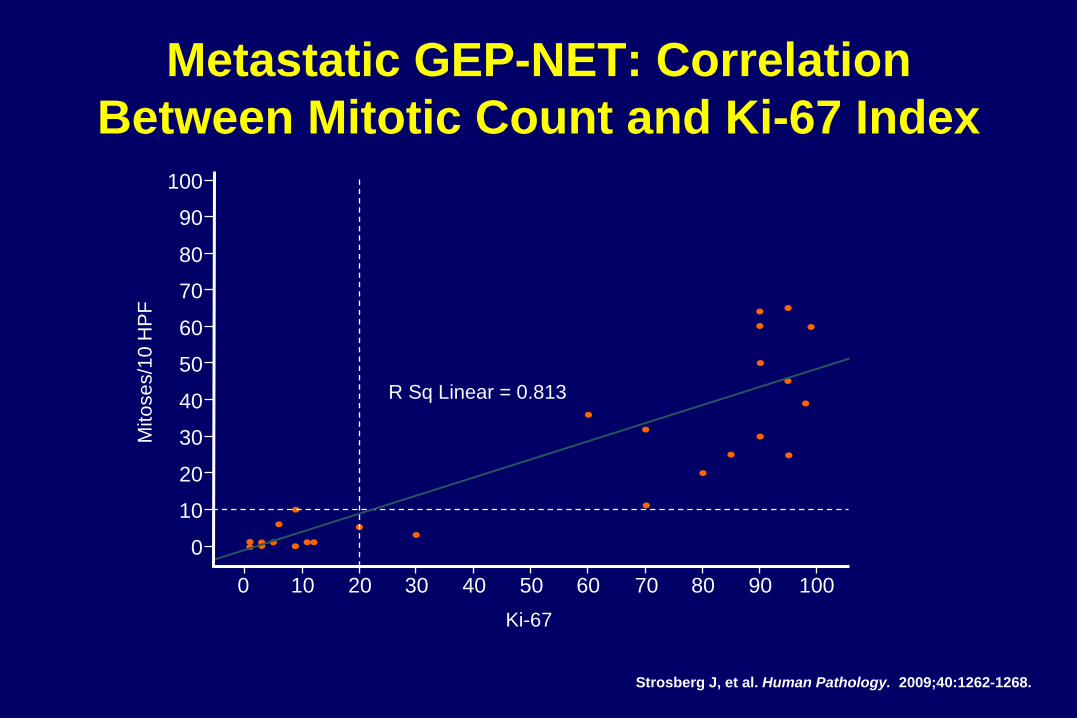
Metastatic GEP-NET: Correlation
Between Mitotic Count and Ki-67 Index
Strosberg J, et al. Human Pathology. 2009;40:1262-1268.
20
30
40
50
60
70
80
90
100
0
0
10
10 20 30 40 50 60 70 80 90 100
Ki-67
R Sq Linear = 0.813
Mito
se
s/1
0 H
PF

Correlation of Tumour Grade and Cumulative
Survival (ENETS Grading Proposal)
Pape UF, et al. Cancer. 2008;113:256-265.
1ENETS grading system. 210 HPF = 2 mm2 at least 40 fields (40 × magnification) evaluated in areas of highest mitotic density.
3Percentage of 2,000 tumour cells in areas of highest nuclear labeling with MIB1 antibody.
Grade1 Mitotic count (10 HPF)2
Ki-67 index (%)3
G1 2 ≤2
G2 2-20 3-20
G3 20 20 0.2
0 50 100 150 200 250
Time (months)
0.0
0.4
0.6
0.8
1.0
Cum
ula
tive s
urv
ival
G1
G2
G3
G1 vs G2
G1 vs G3
G2 vs G3
P = .040
P.001
P.001
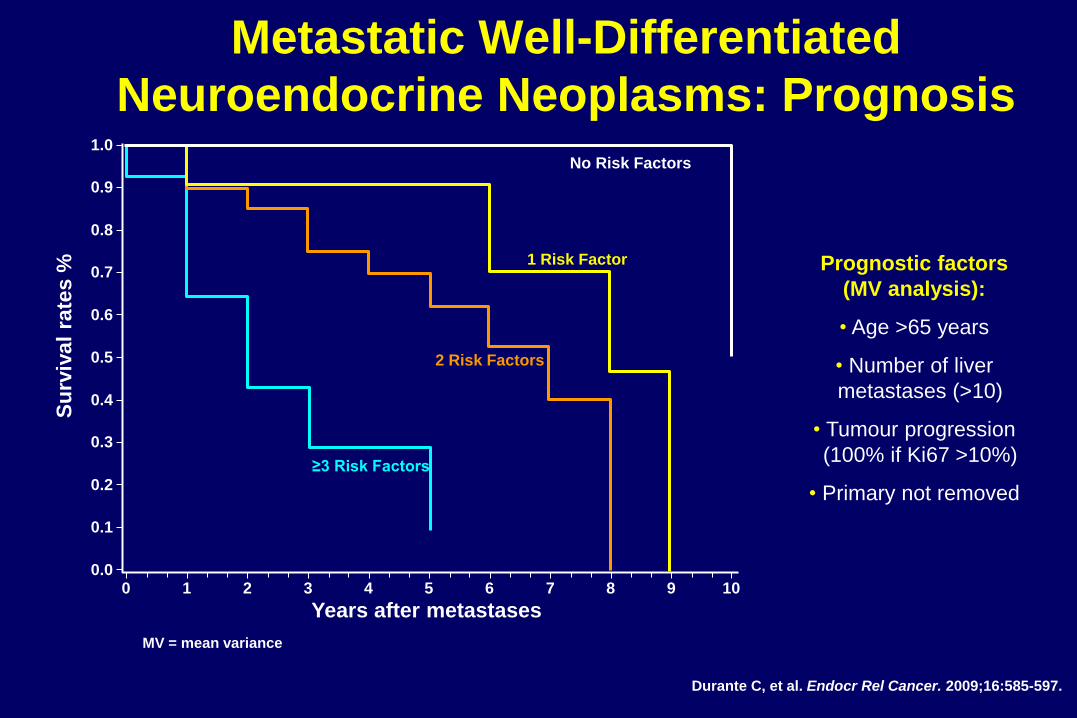
Metastatic Well-Differentiated
Neuroendocrine Neoplasms: Prognosis
Prognostic factors
(MV analysis):
• Age >65 years
• Number of liver
metastases (>10)
• Tumour progression
(100% if Ki67 >10%)
• Primary not removed
Durante C, et al. Endocr Rel Cancer. 2009;16:585-597.
No Risk Factors
1 Risk Factor
2 Risk Factors
≥3 Risk Factors
Su
rviv
al
rate
s %
Years after metastases
0.0
0.1
0.2
0.3
0.4
0.5
0.6
0.7
0.8
0.9
1.0
0 1 2 3 4 5 6 7 8 9 10
MV = mean variance

Correlation of Primary Tumour Site
with Survival
Known prognostic factors include:
• Location of primary tumour
• Extent of disease
• Tumour stage
• Degree of differentiation/
proliferative index (PI)
• Tumour grade
• Patient age
• Performance status
Yao JC, et al. J Clin Oncol. 2008;26:3063-3072.
65% of patients with advanced NET will not be alive in 5 years
Distant Metastases 1.0
0.8
0.6
0.4
0.2
Su
rviv
al p
rob
ab
ility
0 12 24 36 48 60 72 84 96 108 120
Time (months)
Colon Lung
Pancreas Rectum
Small bowel
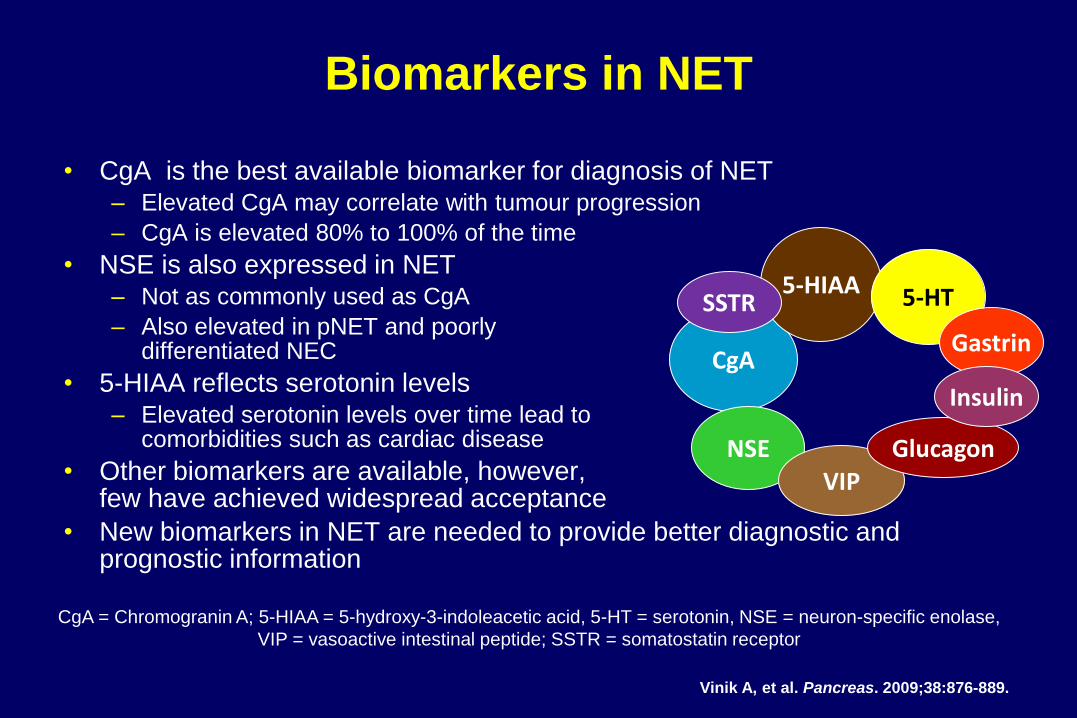
Biomarkers in NET
• CgA is the best available biomarker for diagnosis of NET – Elevated CgA may correlate with tumour progression
– CgA is elevated 80% to 100% of the time
• NSE is also expressed in NET – Not as commonly used as CgA
– Also elevated in pNET and poorly differentiated NEC
• 5-HIAA reflects serotonin levels – Elevated serotonin levels over time lead to
comorbidities such as cardiac disease
• Other biomarkers are available, however, few have achieved widespread acceptance
• New biomarkers in NET are needed to provide better diagnostic and prognostic information
CgA = Chromogranin A; 5-HIAA = 5-hydroxy-3-indoleacetic acid, 5-HT = serotonin, NSE = neuron-specific enolase,
VIP = vasoactive intestinal peptide; SSTR = somatostatin receptor
Vinik A, et al. Pancreas. 2009;38:876-889.
CgA
NSE VIP
Glucagon
5-HIAA 5-HT
Gastrin
Insulin
SSTR

Correlation of Baseline CgA Levels
with Survival
Korse C, et al. Neuroendocrinology. 2009;89:296-301.
<100 n = 6
100-1000 n = 16
>1000 n = 16
Chromogranin A μg/l
P = .02
Cum
ula
tive s
urv
ival
Survival time (months)
0 20 40 60 80 100
0.0
0.2
0.4
0.6
0.8
1.0
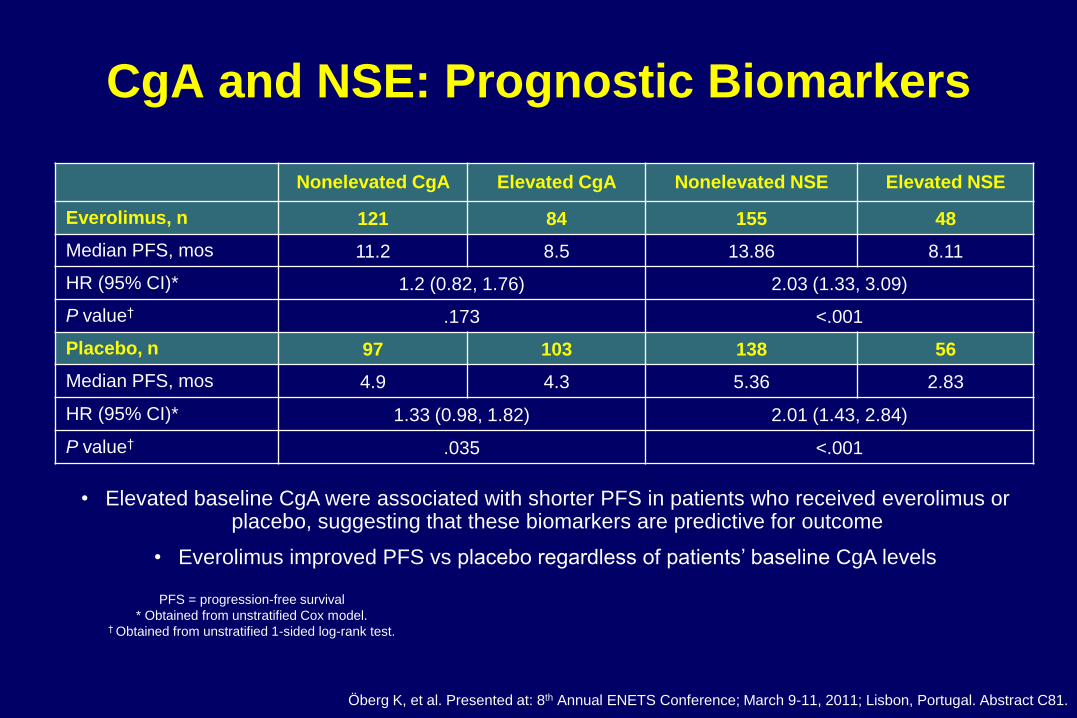
CgA and NSE: Prognostic Biomarkers
Nonelevated CgA Elevated CgA Nonelevated NSE Elevated NSE
Everolimus, n 121 84 155 48
Median PFS, mos 11.2 8.5 13.86 8.11
HR (95% CI)* 1.2 (0.82, 1.76) 2.03 (1.33, 3.09)
P value† .173 <.001
Placebo, n 97 103 138 56
Median PFS, mos 4.9 4.3 5.36 2.83
HR (95% CI)* 1.33 (0.98, 1.82) 2.01 (1.43, 2.84)
P value† .035 <.001
• Elevated baseline CgA were associated with shorter PFS in patients who received everolimus or placebo, suggesting that these biomarkers are predictive for outcome
• Everolimus improved PFS vs placebo regardless of patients’ baseline CgA levels
PFS = progression-free survival
* Obtained from unstratified Cox model. † Obtained from unstratified 1-sided log-rank test.
Öberg K, et al. Presented at: 8th Annual ENETS Conference; March 9-11, 2011; Lisbon, Portugal. Abstract C81.

CgA and NSE: Predictive Biomarkers*
Yao JC, et al. J Clin Oncol. 2010;28(1):69-76.
Time since study start (months)
PF
S (
%)
HR = 0.25
95% CI: 0.13-0.51
P = .00004
Median PFS (months)
Early response (n/N = 16/33) = 13.3
No early response (n/N = 26/38) = 7.5
24 0 6 3 12 9 18 15 21 24 0 6 3 12 9 18 15 21
HR = 0.25
95% CI: 0.10-0.58
P = .00062
CgA NSE
Time since study start (months)
Median PFS (months)
Early response (n/N = 17/28) = 8.6
No early response (n/N = 10/11) = 2.9
Censored observations
PF
S (
%)
0
20
40
60
80
100
0
20
40
60
80
100
Patients at Risk
0 33 26 29 12 19 3 5 2
0 38 12 26 1 5 0 1 0
Resp. Nonresp.
0 28 16 23 6 9 1 3 0
0 11 2 5 0 0 0 0 0
Censored observations
*Data from RADIANT-1 clinical trial.
An early CgA or NSE response was defined as normalization or ≥30% decrease at week 4.
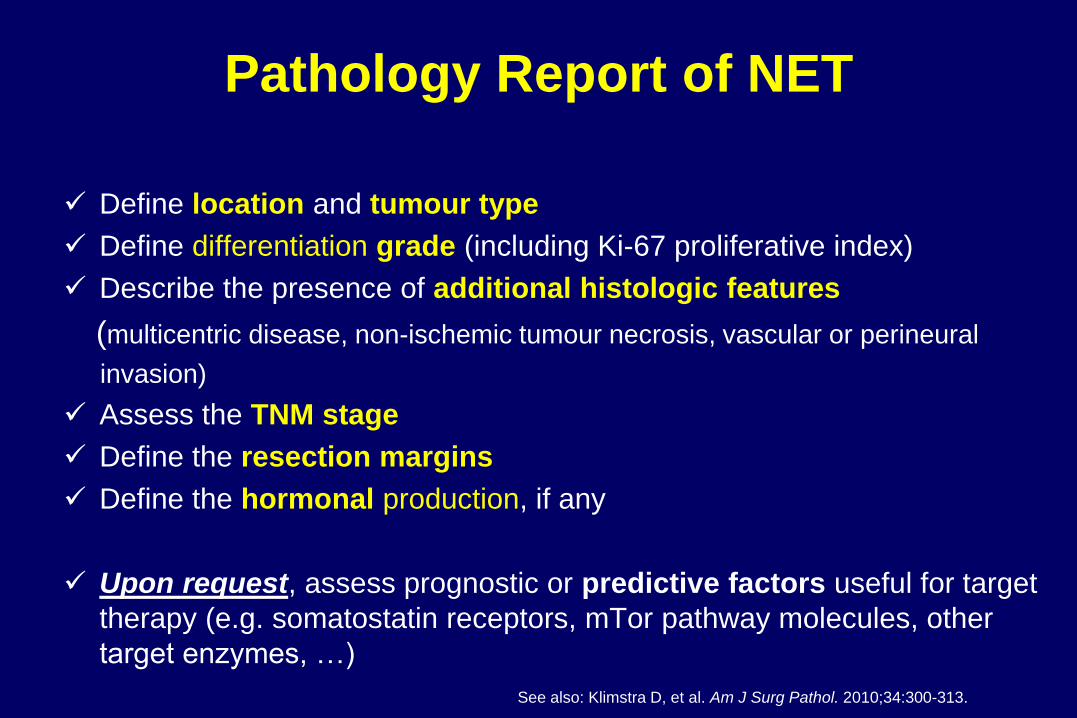
Pathology Report of NET
Define location and tumour type
Define differentiation grade (including Ki-67 proliferative index)
Describe the presence of additional histologic features
(multicentric disease, non-ischemic tumour necrosis, vascular or perineural
invasion)
Assess the TNM stage
Define the resection margins
Define the hormonal production, if any
Upon request, assess prognostic or predictive factors useful for target
therapy (e.g. somatostatin receptors, mTor pathway molecules, other
target enzymes, …)
See also: Klimstra D, et al. Am J Surg Pathol. 2010;34:300-313.
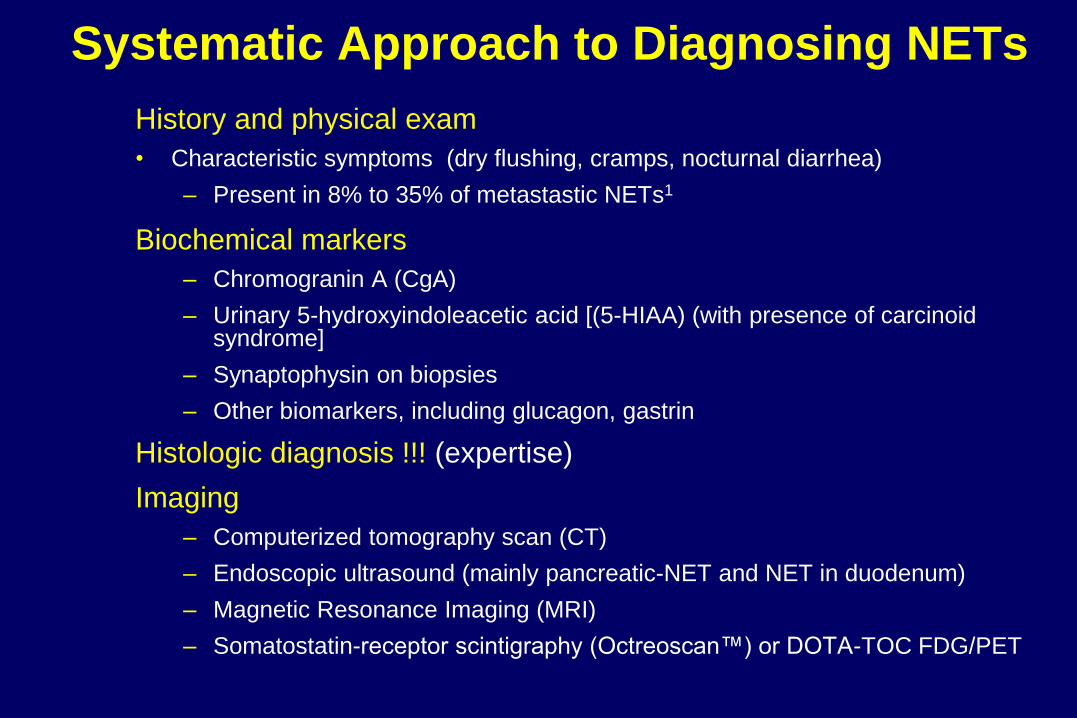
Systematic Approach to Diagnosing NETs
History and physical exam
• Characteristic symptoms (dry flushing, cramps, nocturnal diarrhea)
– Present in 8% to 35% of metastastic NETs1
Biochemical markers
– Chromogranin A (CgA)
– Urinary 5-hydroxyindoleacetic acid [(5-HIAA) (with presence of carcinoid syndrome]
– Synaptophysin on biopsies
– Other biomarkers, including glucagon, gastrin
Histologic diagnosis !!! (expertise)
Imaging
– Computerized tomography scan (CT)
– Endoscopic ultrasound (mainly pancreatic-NET and NET in duodenum)
– Magnetic Resonance Imaging (MRI)
– Somatostatin-receptor scintigraphy (Octreoscan™) or DOTA-TOC FDG/PET

Nomenclature – Summary
Neuroendocrine tumours originate from a wide variety of different cell types that can secrete their own peptide hormone
Site = Pancreas vs intestine – Organ of origin should be determined
– Nomenclature could be simplified by using location of origin
Classification = Give a name to the disease – WHO classification is based on morphology and clinical pathological
information (and is independent from presence and type of hormone secretion)
Staging = Measure the extent of the disease – TNM staging for ENETS and AJCC is same for GI NET but differ for pNET
(ENETS has proved preliminary clinical effectiveness while AJCC needs confirmation)
Grading = Measure the pace of NET growth – Mitosis count or Ki67 with cut-off at 5% and 20% discern prognosis
between diseases
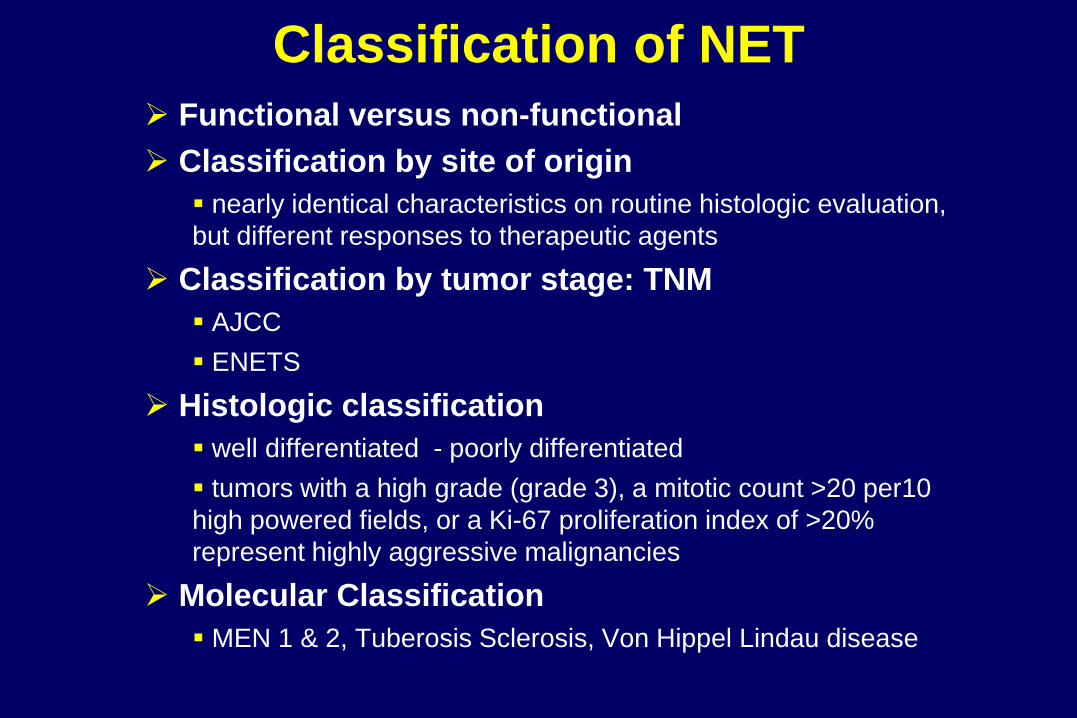
Classification of NET
Functional versus non-functional
Classification by site of origin
nearly identical characteristics on routine histologic evaluation,
but different responses to therapeutic agents
Classification by tumor stage: TNM
AJCC
ENETS
Histologic classification
well differentiated - poorly differentiated
tumors with a high grade (grade 3), a mitotic count >20 per10
high powered fields, or a Ki-67 proliferation index of >20%
represent highly aggressive malignancies
Molecular Classification
MEN 1 & 2, Tuberosis Sclerosis, Von Hippel Lindau disease
Collaboration for optimal patient management
Clinical research
team
Basic research
team
patient
Multidisciplinary patient
management
Expertise/network
ENETS Centers of Excellence University hospitals Leuven


