Neuroimaging and Genetics Carrie E. Bearden, Ph.D. Departments of Psychiatry and Biobehavioral Sciences and Psychology Semel Institute for Neuroscience and Human Behavior University of California, Los Angeles [email protected]
Transcript
Neuroimaging and Genetics
Carrie E. Bearden, Ph.D. Departments of Psychiatry and Biobehavioral
Sciences and Psychology Semel Institute for Neuroscience and Human
• A trait influenced by multiple genes and their interactions with each other and with the environment.
• Examples: autism, schizophrenia, Alzheimer’s, brain anatomy, BOLD signal
Genetics Terminology 1
• Quantitative Trait Locus (QTL), a location, usually a chromosomal region, implicated as containing one or more genes that influence a phenotype of interest
• Quantitative Trait Nucleotide (QTN), a specific sequence variation that has been implicated as having a functional effect on a phenotype of interest
• A QTL may contain multiple QTNs
Genetics Terminology 2
• Chromosome: a single long string of DNA, humans have two copies of each chromosome (diploid), one from mom, one from dad
• Autosome: chromosome not involved in sex determination (22 in humans)
• Sex chromosome: X or Y chromosome, females have 2X, males have 1X and 1Y
• Mitochondrial DNA: non-nuclear DNA, inherited only from the mother
Human Genome
23 Chromosomes ~25,000 genes, about half expressed in brain
~3 billion base pairs
Genetics Terminology 3
• Gene: a unit of DNA that codes for a protein (but the term may be used to include both coding and non-coding elements)
• Locus: location, sometimes used interchangably with gene
• Allele: the specific variant you have at a particular site in the genome
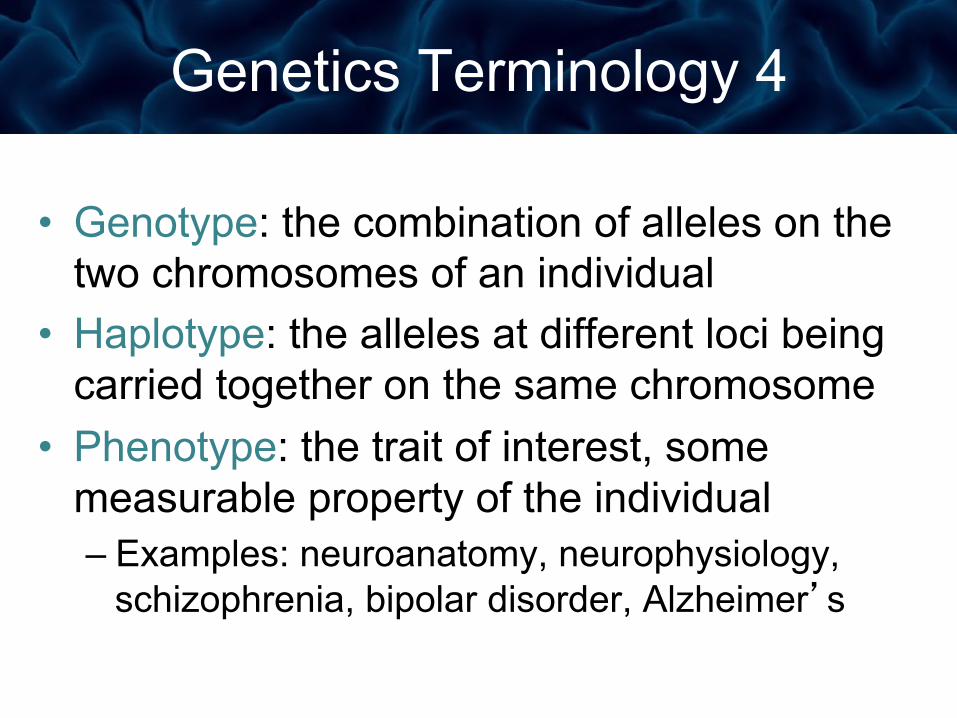
Genetics Terminology 4
• Genotype: the combination of alleles on the two chromosomes of an individual
• Haplotype: the alleles at different loci being carried together on the same chromosome
• Phenotype: the trait of interest, some measurable property of the individual – Examples: neuroanatomy, neurophysiology,
schizophrenia, bipolar disorder, Alzheimer’s
Loci, Alleles, Genotypes, Haplotypes
A
1
B
2
Two loci: letter locus & number locus Each locus has two alleles: A or B, 1 or 2
The genotype at the letter locus is AB The haplotype on the first chromosome shown is A1
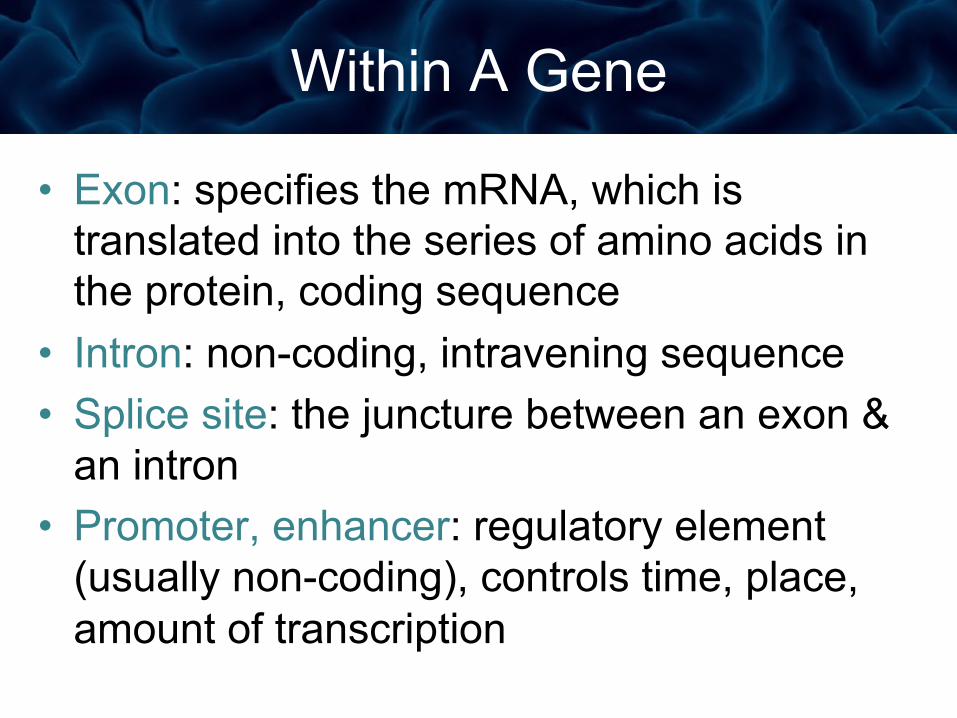
Within A Gene
• Exon: specifies the mRNA, which is translated into the series of amino acids in the protein, coding sequence
• Intron: non-coding, intravening sequence • Splice site: the juncture between an exon &
an intron • Promoter, enhancer: regulatory element
(usually non-coding), controls time, place, amount of transcription
The Gene
• Functional & physical unit of heredity passed from parent to offspring (pieces of DNA)
• Typically contain information to make a specific protein
• Composed of nucleotides, sequence of four organic bases (Adenine, Guanine, Cytocine, and Thyamine)
• Matching nucleotides on the complimentary DNA strands form a base-pair
Genetics Analysis
Question What do you want to know?
Sample Who do you need to study?
Method How will you use your data?
Outline: Questions for the Study of Complex Trait Genetics
1) Is this trait influenced by genetic factors? How strong are these genetic influences?
2) Which traits are influenced by the same genes?
3) Where are the genes that influence a trait?
4) What are the specific genes that influence the trait?
Subject Ascertainment Strategies
1. By phenotype: if you’re studying a rare disease, you must ascertain on phenotype. This is also necessary for some study designs (TDT, case/control).
2. Randomly: if you’re studying a common disease, you’ll find it in a random sample. If you’re interested in multiple traits, ascertaining on one improves power only for that one. May also want to study normal variation.
3. Ascertainment also depends on (and limits) method of analysis.
Types of Samples for Genetics 1. Adoptees: separating the effects of genes and family
environment
2. Unrelated individuals: association only, estimation of effect size after variants are identified
3. Parent-child triads: association in the presence of linkage (transmission disequilibrium test), heritability/relative risk
4. Twins: heritability, relative risk, genetic correlations, linkage, association
5. Relative pairs: heritability, relative risk, genetic correlations, linkage, association
6. Pedigrees: heritability, relative risk, genetic correlations, linkage, association
Question 1: Heritability
Is this trait influenced by genetic factors? How strong are these genetic influences?
Defining Heritability
Phenotype (P) = Genotype (G) + Environment (E)
Variance Decomposition
σp2= total phenotypic
σ g2= genetic
σ e2= environmental
σ d2= dominance
σ a2= additive genetic
σp2=σg2+σe2
σg2=σa2+σd2
σe2=σc2+σeu2
µ
σ2
µ = Σxi / nσ2 = Σ(x - µ)2 / n
^
^ ^
Almasy & Blangero, Am J Hum Genet, 1998
Broad-Sense Heritability (H2)
• Proportion of total variance in a population, taken at a particular time or age, attributable to genetic variation
• All possible genetic contributions – allelic variation (additive
If the heterozygote is half way between the two homozygotes, there’s a “dose-response” effect, d is zero, and there is no dominance.
Narrow-Sense Heritability (h2)
• Heritability (h2): the proportion of the phenotypic variance in a trait attributable to the additive effects of genes.
h2 =σa
2
σp2
Conceptualizing Heritability
• Heritability estimates vary between 0 and 1 0= genetic factors do not influence trait variance 1=trait variance is completely under genetic control
• If h2=0.5, then 50% of phenotypic variation is due to genetic variation. – Not that the trait is 50% caused by genetics
• Stronger heritability does not imply simple genetics
Estimating Heritability with Twins
h2=2*(rMZ-rDZ) rMZ= correlation between monozygotic co-twins rDZ= correlation between dizygotic co-twins
Falconer’s Method
Twin Concordances
Limitations of Twins
• Common Environment Unless Raised Apart • Twins reared apart are difficult to find, non-
representative • Common prenatal environment;
– intrauterine competition • Mother may be physically stressed
Simple Kinship Matrix
D M 1 2 3 D 1 0 ½ ½ ½
M 0 1 ½ ½ ½
1 ½ ½ 1 ½ ½
2 ½ ½ ½ 1 ½
3 ½ ½ ½ ½ 1
Dad
Mom
3
1
2
Limitations of Heritability Estimates
1. Heritability is a population level parameter, summarizing the strength of genetic influences on variation in a trait among members of the population. It doesn’t tell you anything about particular individuals.
2. Heritability is an aggregate of the effects of multiple genes. It tells you nothing about how many genes influence a phenotype. A high heritability is not necessarily more genetically tractable if it is due to many genes.
3. Heritability vs. Familiality- A trait can be familial without
being heritable.
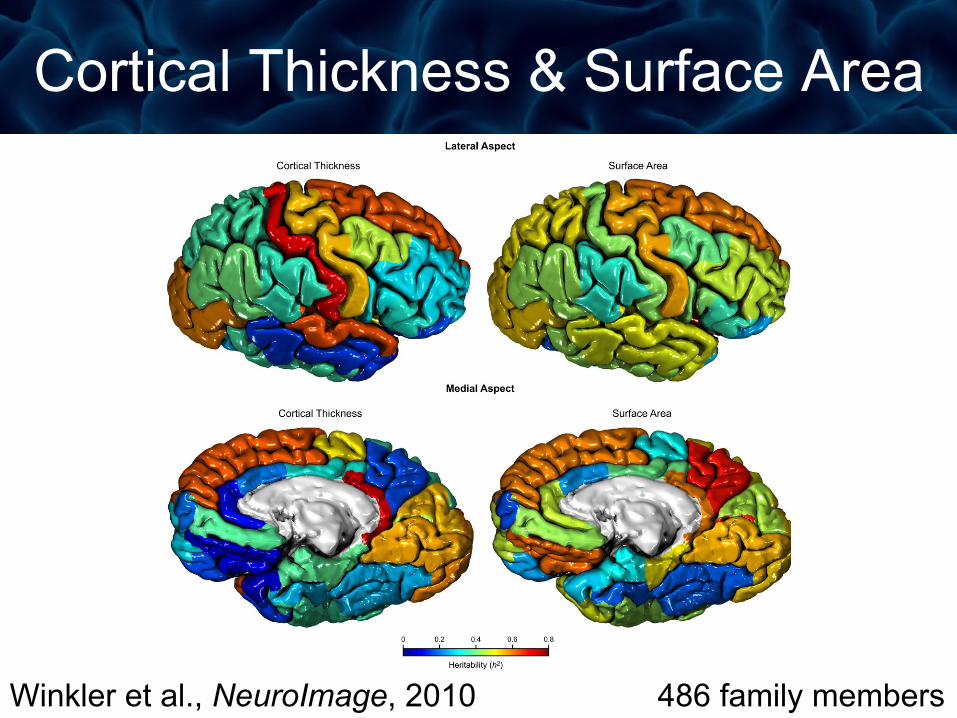
Cortical Thickness & Surface Area
Winkler et al., NeuroImage, 2010 486 family members
White-Matter Tracts (DTI) h2
Kochunov et al., NeuroImage, 2010 467 family members
Resting State fMRI Heritability
h2= 0.424
Glahn et al., Proc Nat Sci USA, 2010 333 family members
Pete
rs D
elusio
n In
vent
ory
Barro
n W
elsh
Art S
cale
Disli
ke
Barro
n W
elsh
Art S
cale
Like
TEM
PS A
nxiet
y
TEM
PS C
yclot
hym
ia
TEM
PS D
epre
ssive
TEM
PS H
yper
thym
iaytili bati rrI SP
MET Aggr
essio
n Qu
estio
nnair
eBa
rratt
Impu
lsivit
y Sca
leBA
R7�+LJKï
risk P
umps
BART
LoZ
ïrisk
Pum
psBA
R7�0HGLXPïr
isk P
umps
BART
Tota
l Pum
psSe
nsat
ion S
eekin
g Sc
aleAI
M A
bstra
ction
Mat
rix R
easo
ning
PCET
# C
orre
ctPC
ET C
ateg
ories
Ach
ieved
SST
Corre
ct Go
SST
Corre
ct St
op
667�,QWHUïVWL
mulus
Inter
val
Stro
op C
olor W
ord T
est E
rrors
Stroo
p Colo
r Word
Test
Time
TONI
# Co
rrect
WASI V
ocab
ulary
AIM Abs
tracti
on pl
us M
emory
IPCPT Hits
SCAP # Corr
ect 3
Dot Con
dition
SCAP # Corr
ect 5
Dot Con
dition
SCAP Mea
n # Corr
ect All T
rials
SCAP Reaction Time 3 Dot C
ondition
SCAP Reaction Time 5 Dot C
ondition
VWM Digits Backw
ard # Correct
VWM Digits Forward # Correct
9:0�/
HWWHUï1
XPEHU
�6HT���
�&RUUHFW
Digit Symbol Copy
Digit Symbol Percent Correct
Digit Symbol Recall
TrDLOPDNLQ
J�/HWWHU�
6HTXHF
LQJ�7LP
H
TrDLOPDNLQ
J�1XPEH
U�6HTXH
QFLQJ�7L
PH
TrDLOPDNLQ
J�1XPEH
Uï/HWWHU�6
HT��7LPH
CVLT Delayed Recall
CVLT Intrusions
CVLT Recognition
CVLT Repetitions
CVLT Total TrLDOV��ï�
Face Memory
WMS Logical Memory Delay
WMS Logical Memory Immediate
WMS Logical Memory Recognition
WMS Visual Reproduction Delay
WMS Visual Reproduction Immediate
Verbal Category FluencyVerbal Letter FluencyAmygdalaAnterior Corpus CallosumBrain StemCaudateCentral Corpus Callosum
Cerebellar CortexCerebellar Volume
Cerebellar White Matter
Cerebral CortexCerebral Volume
Cerebral White Matter
Cerebrospinal Fluid
Fourth Ventricle
Hippocampus
Inferior Lateral Ventricle
Lateral Ventricle
0LGï$QWHrior Corpus Callosum
0LGïPosterior Corpus Callosum
QRQï:KLWH�0DWWHU�+\SRLQWHQVLWLHV
Nucleus Accumbens
PallidumPosterior Corpus Callosum
Putamen
Thalamus
Third Ventricle
Total Brain Volume
Total Corpus Callosum
Ventral Diencephalon
White Matter Hypointensities
Caudal Anterior Cingulate Surf�
Caudal Middle Frontal Surf�
Cuneus Surf�
Entorhinal Surf�
Frontal Pole Surf�
Fusiform Surf�
Inferior Parietal Surf�
Inferior Temporal Surf�
Isthmus Cingulate Surf�
Lateral Occipital Surf�
Lateral Orbitofrontal Surf�
Lingual Surf�
Medial Orbitofrontal Surf�
Middle Tem
poral Surf�
Paracentral Surf��fr
uS la
pma
coppi
hara
P�fr
uS si
r aluc
r ep O
sr a
PPars Orbitalis Surf�Pars Triangularis Surf�Pericalcarine Surf�Postcentral Surf�Posterior Bank Sup��Tem
poral Sulcus Surf�
Posterior Cingulate Surf�Precentral Surf�
Precuneus Surf�Rostral Anterior Cingulate Surf�
Rostral Middle Frontal Surf�
Superior Frontal Surf�
Superior Parietal Surf�
Superior Temporal Surf�
Supramarginal Surf�
Temporal Pole Surf�
Total Surface Area
Transverse Temporal Surf�
Caudal AnterLRU�&LQJXODWH�7KLFN�
&DXGDO�0LGGOH�)URQWDO�7KLFN�
&XQHXV�7KLFN�
(QWRUKLQDO�7KLFN�
Frontal PROH�7KLFN�
FusiforP�7KLFN�
Inferior ParLHWDO�7KLFN�
Inferior TemporDO�7KLFN�
IsthmXV�&LQJXODWH�7KLFN�
LaterDO�2FFLSLWDO�7KLFN�
LaterDO�2UELWRIURQWDO�7KLFN�
/LQJXDO�7KLFN�
0HGLDO�2UELWRIURQWDO�7KLFN�
Middle TemporDO�7KLFN�
ParacentrDO�7KLFN�
ParDKLSSRFDPSDO�7KLFN�
Pars OpercularLV�7KLFN�
PDUV�2UELWDOLV�7KLFN�
Pars TriangularLV�7KLFN�
PericalcarLQH�7KLFN�
PostcentrDO�7KLFN�
Posterior Bank Sup��TemporDO�6XOFXV�7KLFN�
PosterLRU�&LQJXODWH�7KLFN�
PrecentrDO�7KLFN�
3UHFXQHXV�7KLFN�
Rostral AnterLRU�&LQJXODWH�7KLFN�
RostrDO�0LGGOH�)URQWDO�7KLFN�
SuperLRU�)URQWDO�7KLFN�
Superior ParLHWDO�7KLFN�Superior TemporDO�7KLFN�SuprDPDUJLQDO�7KLFN�Temporal PROH�7KLFN�Transverse TemporDO�7KLFN�Anterior Thalamic Radiation Genu Corpus Callosum InferLRU�)URQWR
ï2FFLSLWDO�Fasciculus
Inferior Longitudinal FasciculusSplenium Corpus Callosum
Uncinate Fasciculus Anterior Thalamic Radiation
Genu Corpus Callosum
InferLRU�)URQWR
ï2FFLSLWD
O�Fasciculus
Inferior Longitudinal Fasciculus
Splenium Corpus Callosum
Uncinate Fasciculus
Anterior Thalamic Radiation
Genu Corpus Callosum
InferLRU�)URQWRï2
FFLSLWD
O�Fasciculus
Inferior Longitudinal Fasciculus
Splenium Corpus Callosum
Uncinate Fasci
culus
AffectiveTemperament
,PSXOVLYLW\ï5LVNïWDNLQJ ExecutiveFunction
Working
Memory
Processing
Speed
Long Term
Mem
oryVerbal
Fluency
MRI Volume
CorticalSurface Area
Corti
cal
Thick
ness
Frac
tiona
lAn
isotro
pyAx
ialDi
ffusiv
ityRad
ialDiffu
sivity
0����
������
h2 es
timat
eGB
P-I e
stim
ate
������
������
������
����������������
h� estimateGBP-I SRVLWLYH�UHJUHVVLRQ�FRHI�GBP-I�QHJDWLYH�UHJUHVVLRQ�FRHI�Significant HeritabilitySignificant BP-I association
Fears et al JAMA Psych 2014
Question 2: Pleiotropy
Which traits are influenced by the same genes?
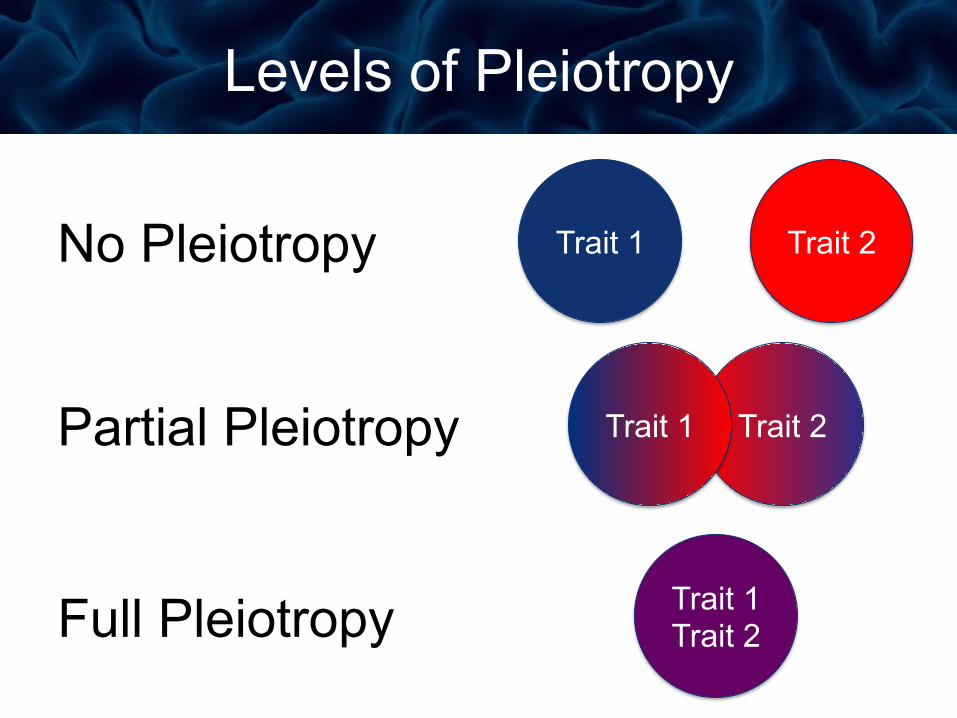
No Pleiotropy
Levels of Pleiotropy
Trait 1 Trait 2
Partial Pleiotropy
Full Pleiotropy Trait 1 Trait 2
Trait 2 Trait 1
Genetic Correlation (Pleiotropy)
• Genetic correlation (ρg): a measure of the overlap in genetic effects between traits.
• ρg varies from -1 to 1
• 0 = no pleiotropy; -1 or 1 = complete pleiotropy
White Matter Tracts & Working Memory
Karlsgodt et al., J Neurosci, 2010 467 family members
Superior longitudinal fasciculus – Spatial DRT: ρg = 0.593
All cognitive & imaging measures were heritable, but only WM performance and SLF integrity shared genetic factors
Neuroimaging Phenotypes in Bipolar Pedigrees
Fears et al JAMA Psychiatry 2014
Question 3: Localization
Where are the genes that influence a trait?
Two Common Methods for Gene Localization
Linkage analyses: test for co-segregation of phenotype and genotype within families - a function of physical connections of genes on chromosomes Association analyses: test for deviations of phenotype-genotype combinations from that predicted by their separate frequencies - a function of linkage disequilibrium created by population history
What is Association?
• Tests for correlation between genotype and phenotype
• Association analyses work when: – 1) your genotyped marker is a functional
polymorphism – 2) your genotyped marker is in linkage
disequilibrium with a functional polymorphism
Linkage Disequilibrium (LD)
• Linkage disequilibrium is the non-random association of alleles at two or more loci
• LD = presence of statistical associations between alleles at different loci that differ from what would be expected if alleles were independently, randomly sampled based on individual allele frequencies
• Level of LD is influenced by many factors-genetic linkage, selection, rate of recombination, rate of mutation, genetic drift, non-random mating, and population structure.
• LD is unpredictable
A 1 B 1 C 1
a mutation occurs
A 1 B 1 C 1 B 2 Complete disequilibrium
recombination occurs A 1 B 1 C 1 B 2 A 2 Incomplete
disequilibrium
time passes, more recombination occurs
Equilibrium
How do we get LD?
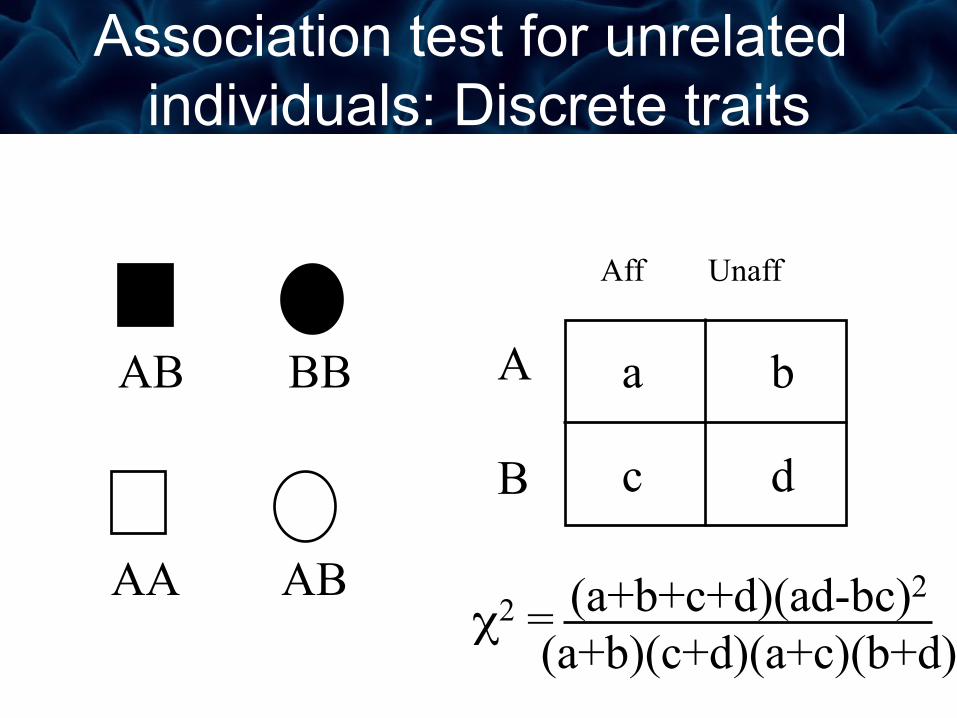
Association test for unrelated individuals: Discrete traits
AA AB
AB BB
Aff Unaff
A B
a b
c d
χ2 = (a+b+c+d)(ad-bc)2 (a+b)(c+d)(a+c)(b+d)
Association test for unrelated individuals: Quantitative traits
AA nAA µAA AB nAB µAB BB nBB µBB
Genotype N mean variance σAA
2
σAB 2
σBB 2
Assuming the trait values are
normally distributed
d =µAA -µBB
σAA 2
n AA +σBB
2
n BB
Transmission disequilibrium test (TDT): association
AB AB
??
Nontransmitted allele A B
A B
Tran
smitt
ed a
llele
a=0 b
c d=0
χ2 = (b-c) 2/(b+c)
-Family-based association test for presence of linkage between a genetic marker and a trait (only will detect linkage in the presence of association)
had increased neural activity during memory task; predicted cognitive decline
Bookheimer et al., N Engl J Med, 2000
Fear Response & Serotonin Transporter Gene (SLC6A4): Short allele hetero/homozygotes show greater amygdala reactivity to fearful stimuli
Hariri et al., Science, 2002
To obtain this degree of significance- locus must explain ~28% of phenotypic variance
Ioaniddis Arch Gen Psych 2012
21/41 meta-analyses found statistically significant associations; 142/461 (31%) data sets had positive results. Even if the summary effect sizes of the meta-analyses were unbiased, the expected number of positive results would have been only 78.5 compared with the observed number (142; P < .001).
“Excess significance bias in the literature on brain volume abnormalities”
-False positive problem -How can we appropriately minimize search space? -Target genes with association to disease-related quantitative trait (not necessarily disease itself) -Genes with known syndromic associations with high risk -Genes with known anatomic expression sites (e.g., fetal expression studies, knock-out models)
Approaches to Genotyping Candidate genes: genotype only markers in genes potentially related to the trait. • Pro: fast and easy, may be able to be more thorough with a higher density of markers • Con: must get lucky in choice of genes, lower potential for novel finding Genome screen: genotype anonymous markers spanning the genome at regular intervals • Pro: can identify previously unknown genes, covers all of the possibilities • Con: slower and more expensive, may have lower marker density which could translate to less power
Candidate Gene Controversy
But Flint argues that no one has yet shown that intermediate phenotypes have a tighter link to the genes responsible than the disease itself. “I just don’t buy that brain size or whatever will work better,” he says.
“Candidate genes are like packing your own lunch box and then looking in the box to see what’s in it.”
Positive predictive value as a function of the pre-study odds of association for different levels of statistical power.
Button et al 2013
Winner’s curse: effect size inflation as a function of statistical power.
Button et al 2013
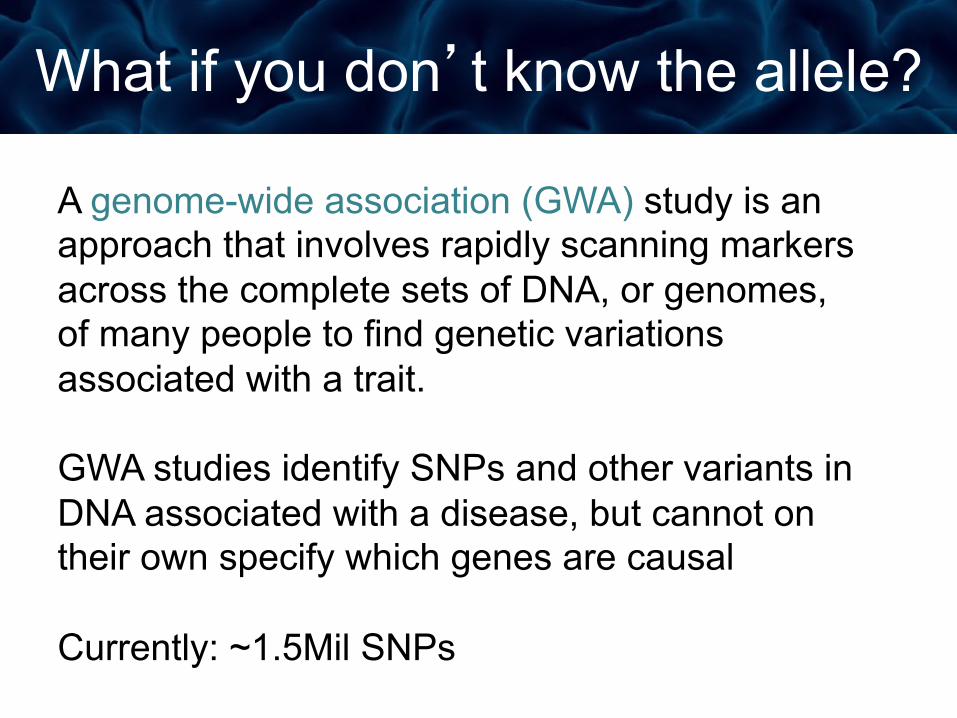
What if you don’t know the allele?
A genome-wide association (GWA) study is an approach that involves rapidly scanning markers across the complete sets of DNA, or genomes, of many people to find genetic variations associated with a trait. GWA studies identify SNPs and other variants in DNA associated with a disease, but cannot on their own specify which genes are causal Currently: ~1.5Mil SNPs
Multiple testing: p-values
• A p-value of 0.05 implies that 5% of the time we will reject the null hypothesis (i.e. conclude that we have an association) when the null hypothesis is actually correct
• If we test 100 SNPs and each time we use a p-value of 0.05 as our cutoff for significance, we would expect 5 of those SNPs to be significant (p < 0.05) just by chance
Multiple testing
• The simplest correction is the Bonferroni: multiply each p-value by the total number of tests, or divide the significance threshold required by the number of tests (0.05 / #).
• Genome-wide significance (~1.5 Mil SNPs) requires p=5x10⁻⁸
• This maintains an experiment-wide significance threshold, but may be too conservative when the tests are correlated, e.g. if some markers tested are in LD with each other.
Stein et al 2012
Hibar et al Nature 2015
P<7.1x10⁻⁹
Conclusions..?
Ø Strongest evidence for novel intergenic locus (rs945270; 14q22.3) near KTN1 gene which influences putamen volume; encodes kinectin (receptor involved in organelle transport)
Ø Pathway analysis- SNPs associated with putamen volume showed enrichment of genes involved in apoptosis and axon guidance pathways
Ø Functional validation study- looked for association with gene expression 1 Mb up/downstream. C allele associated with increased KTN1 expression in frontal cortex and in blood
Ø Kinectin only found in dendrites and soma, not cell bodies- volumetric effects may reflect genetic control of neuronal cell size and/or dendritic complexity
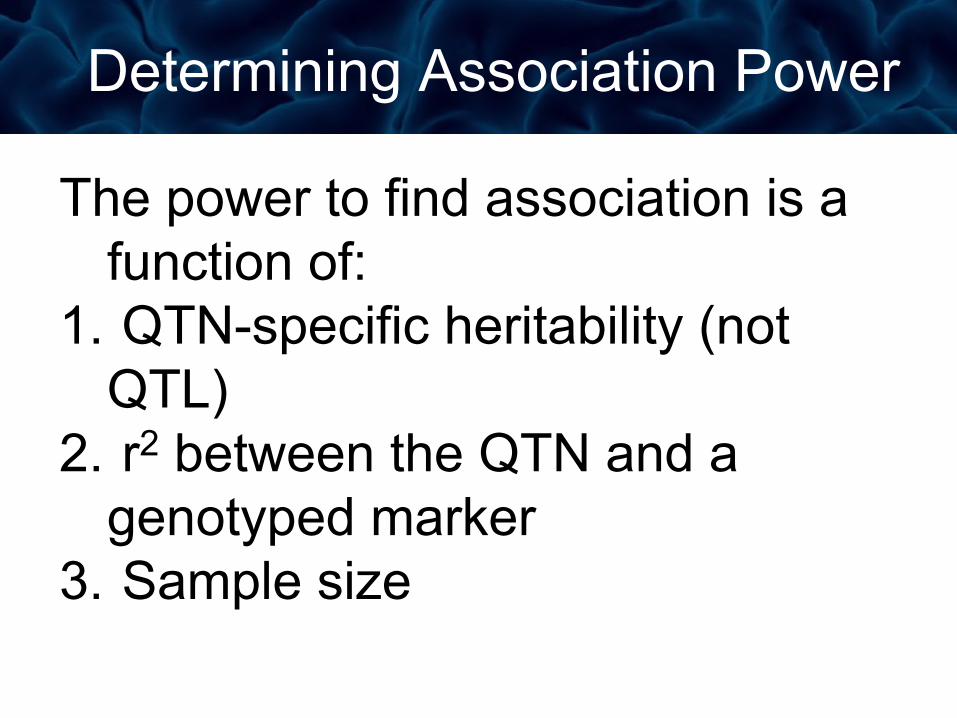
Determining Association Power
The power to find association is a function of:
1. QTN-specific heritability (not QTL)
2. r2 between the QTN and a genotyped marker
3. Sample size
Limitations of Association • A QTL may be in equilibrium with the other
polymorphisms surrounding it. Disequilibrium need not be present.
• Since LD need not be present, negative association results have implications only for the marker you have tested, lack of association does not exclude the gene or region.
• Population Stratification: If the sample contains multiple populations that differ in the trait of interest, any locus whose allele frequencies differ between the populations will show association
Example: Hypertension
AA AB AB AB
AB AA AA AB
AA AB AB BB
AB BB AA AB
African Americans 70% A, 30% B
European Americans 50% A, 50% B
Example: Hypertension
AA
AB
AB AB
AB AA
AA AB AA AB
AB
BB
AB
BB AA AB
Affected 64% A, 36% B
Unaffected 56% A, 44% B
Minimizing Limitations of Association
1. Match cases and controls carefully or try to obtain subjects from a single well defined population.
2. Use one of a variety of statistical approaches designed to deal with population stratification (e.g. TDT, genomic control)
Genetic Linkage Defined
Genetic loci that are physically close to one another tend to stay together during meiosis. Independent assortment occurs when the genes on different chromosomes are separated by a great enough distance on the same chromosome that recombination occurs at least half of the time. An exception to independent assortment develops when genes appear near one another on the same chromosome. When genes occur on the same chromosome, they are usually inherited as a single unit. Genes inherited in this way are said to be linked, and are referred to as "linkage groups.”
Measuring Linkage: Lod Score
LOD = statistical estimate of whether 2 genes (a gene and a disease gene) are likely to be located near each other & thus inherited together
LOD = log10((1-θ)NR x θR)/0.5NR+R
NR denotes the number of non-recombinant offspring, R denotes the number of recombinant offspring. Theta = recombinant fraction= R / (NR + R) A LOD score >=3.0 is considered evidence for linkage A LOD score of 3 indicates 1000 to 1 odds that the linkage being observed did not occur by chance A LOD score <=-2.0 is considered evidence to exclude linkage
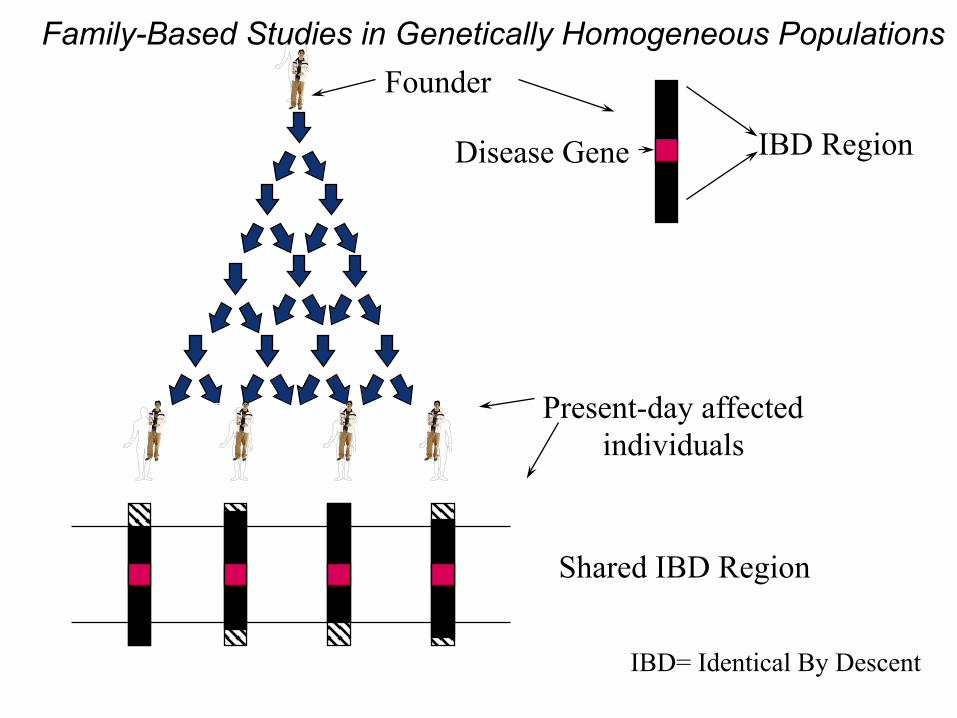
Disease Gene IBD Region
Shared IBD Region
Founder
Present-day affected individuals
IBD= Identical By Descent
Family-Based Studies in Genetically Homogeneous Populations
Example of Linkage Map
LOD score
Genetic distance (cM) Potash et al. AJP 2003
Determining Linkage Power
The power to map a QTL in a human linkage study is a function of:
Sample size required for 80% power to detect linkage to a QTL at a LOD of 3
Linkage vs. Association
Association: testing for an excess of a specific combination of alleles at two loci. The same alleles must be traveling together at a population level. Detects effects of common variants. Linkage: testing for an excess of the parental type. That parental type (i.e. the alleles traveling together) could be different in every family and you would still get linkage. Can detect cumulative effect of multiple variants (including rare variants).
Combined Linkage/Association Analysis
• Best of both worlds QTL localization approach
• Linkage can detect cumulative effect of multiple variants (including rare variants).
• Association detects effects of common variants.
• Joint test of linkage/association more powerful than association alone when there is linkage. Only minor loss of power in the absence of linkage.
• Implemented in SOLAR
Combined Linkage and Association Signal for Amygdala Volume in Latin American Pedigrees (n~580)
Fears et al in prep
Question 4: Identification
What specific genes influence the trait?
Identifying a Causal Gene
• Once a significant QTL is identified, additional genetic tests are needed to determine the exact identity of the gene – Association: identifies a genomic region of
~500kb (250kb to either side of the association) determined by the general extent of linkage disequilibrium
– Linkage: detect the cumulative additive genetic signal of all functional variants within a much larger genomic region (e.g. 10-15Mb)