Neuron, Vol. 37, 311–322, January 23, 2003, Copyright 2003 by Cell Press Mechanisms of Gamma Oscillations in the Hippocampus of the Behaving Rat and CA1 regions (Leung, 1979; Buzsa ´ ki et al., 1983; Bragin et al., 1995; Charpak et al., 1995; Penttonen et al., 1998), but much less is known about gamma oscilla- Jozsef Csicsvari, 1 Brian Jamieson, 2 Kensall D. Wise, 2 and Gyo ¨ rgy Buzsa ´ ki 1, * 1 Center for Molecular and Behavioral Neuroscience Rutgers, The State University of New Jersey tions in the CA3 hippocampal region. This information is critical because although both dentate and CA3 princi- 197 University Avenue Newark, New Jersey 07102 pal cells are innervated by the axon collaterals of layer II entorhinal cortical neurons (Tamamaki and Nojyo, 1993), 2 Department of Electrical Engineering and Computer Science the CA3 region has been postulated to generate gamma oscillations independent of cortical inputs (Bragin et al., The University of Michigan Ann Arbor, Michigan 48109 1995; Fisahn et al., 1998). Various in vitro models of gamma patterns have been tested to gain insight into the cellular-synaptic proper- ties of gamma oscillations. Tetanus- or drug-induced Summary oscillations in the gamma band have been described in each hippocampal region in vitro (Whittington et al., Gamma frequency oscillations (30–100 Hz) have been suggested to underlie various cognitive and motor 1995, 1997, 2001; Traub et al., 1996; Colling et al., 1998; Stanford et al., 1998; Stenkamp et al., 2001; Towers et functions. Here, we examine the generation of gamma oscillation currents in the hippocampus, using two- al., 2002; Fisahn et al., 1998, 2002), and putative mecha- nisms for the generation of gamma oscillations have dimensional, 96-site silicon probes. Two gamma gen- erators were identified, one in the dentate gyrus and been offered by computer models (Leung, 1982, 1998; Wang and Buzsa ´ ki, 1996; Traub et al., 1996, 1997, 2001; another in the CA3-CA1 regions. The coupling strength between the two oscillators varied during both theta Jensen and Lisman, 1996; Wallenstein and Hasselmo, 1997; Chow et al., 1998; White et al., 1998; Orban et al., and nontheta states. Both pyramidal cells and inter- neurons were phase-locked to gamma waves. Ana- 2001; Tiesinga et al., 2001). However, it is not known to what extent these models reflect gamma oscillation tomical connectivity, rather than physical distance, determined the coupling strength of the oscillating mechanisms in the intact brain and how the postulated mechanisms interact with each other during behavior. neurons. CA3 pyramidal neurons discharged CA3 and CA1 interneurons at latencies indicative of monosyn- Persistent (carbachol- and kainate-induced) gamma os- cillations require an intact CA3 region (Fisahn et al., aptic connections. Intrahippocampal gamma oscilla- tion emerges in the CA3 recurrent system, which en- 1998), whereas transient, tetanus-induced gamma oscil- lation can be elicited in the CA1 but not in the CA3 trains the CA1 region via its interneurons. region (Whittington et al., 1995, 1997). Furthermore, the various models provide different predictions about the Introduction timing of principal cells and interneurons and their rela- tionship to the extracellular field. Finally, various theoret- Oscillations in cortical structures are believed to provide temporal windows that bind coherently cooperating ical models postulate conflicting requirements for inter- regional synchronization (Lisman, 1998; Rolls, 1996). neuronal assemblies for the representation, processing, storage, and retrieval of information (cf. Engel et al., Quantitative evaluation of these issues in the behaving animal requires simultaneous recording of gamma cur- 2001; Traub et al., 1999; Buzsa ´ ki et al., 1994). Of the large family of brain oscillatory patterns, gamma oscillations rents from the various subregions along with concur- rently recorded neurons from each of these regions. have received special attention because of their alleged role in sensory binding (Singer, 1993; Gray, 1994), mem- To examine the interregional relationships of gamma oscillations and the network mechanisms of their gener- ory (Fell et al., 2001), attentional selection (Fries et al., 2001a), and “conscious” experience (Llina ´ s et al., 1998; ation, we used two-dimensional silicon probes with a large number of recording sites in freely moving rats Varela et al., 2001). Gamma oscillations are also preva- lent in the hippocampal formation, where they have been (Csicsvari et al., 2001). proposed to assist in encoding and retrieval of memory traces (Bragin et al., 1995; Lisman and Idiart, 1995; Chro- Results bak and Buzsa ´ ki, 1998; Hasselmo et al., 1996). In contrast to sensory cortical regions, where gamma In structures with regularly arranged neurons and affer- waves are induced by sensory stimulations (Gray et al., ents, such as the various layers of the hippocampus, 1989; Eckhorn, 1994; but see Roelfsema et al., 1997; extracellularly recorded currents provide information Fetz et al., 2000; Fries et al., 2001b), the conditions that about location of currents flowing into and out of neu- give rise to the persistent hippocampal gamma oscilla- rons. Simultaneously recorded extracellular unit activity tions (Stumpf, 1965; Buzsa ´ ki et al., 1983; Leung, 1992; can assist in the interpretation of currents, i.e., whether Solte ´ sz and De ´ schenes, 1993; Hirai et al., 1999) are not they are induced by coherent afferent activity and/or known. In vivo, they have been described in the dentate intrinsic membrane properties or reflect passive, “return” currents. In the present studies, local field potentials (i.e., voltage changes) were recorded simultaneously from 96 *Correspondence: [email protected]
Transcript
Neuron, Vol. 37, 311–322, January 23, 2003, Copyright 2003 by Cell Press
Mechanisms of Gamma Oscillations inthe Hippocampus of the Behaving Rat
and CA1 regions (Leung, 1979; Buzsaki et al., 1983;Bragin et al., 1995; Charpak et al., 1995; Penttonen etal., 1998), but much less is known about gamma oscilla-
Jozsef Csicsvari,1 Brian Jamieson,2
Kensall D. Wise,2 and Gyorgy Buzsaki1,*1Center for Molecular and Behavioral NeuroscienceRutgers, The State University of New Jersey tions in the CA3 hippocampal region. This information
is critical because although both dentate and CA3 princi-197 University AvenueNewark, New Jersey 07102 pal cells are innervated by the axon collaterals of layer II
entorhinal cortical neurons (Tamamaki and Nojyo, 1993),2 Department of Electrical Engineeringand Computer Science the CA3 region has been postulated to generate gamma
oscillations independent of cortical inputs (Bragin et al.,The University of MichiganAnn Arbor, Michigan 48109 1995; Fisahn et al., 1998).
Various in vitro models of gamma patterns have beentested to gain insight into the cellular-synaptic proper-ties of gamma oscillations. Tetanus- or drug-inducedSummaryoscillations in the gamma band have been described ineach hippocampal region in vitro (Whittington et al.,Gamma frequency oscillations (30–100 Hz) have been
suggested to underlie various cognitive and motor 1995, 1997, 2001; Traub et al., 1996; Colling et al., 1998;Stanford et al., 1998; Stenkamp et al., 2001; Towers etfunctions. Here, we examine the generation of gamma
oscillation currents in the hippocampus, using two- al., 2002; Fisahn et al., 1998, 2002), and putative mecha-nisms for the generation of gamma oscillations havedimensional, 96-site silicon probes. Two gamma gen-
erators were identified, one in the dentate gyrus and been offered by computer models (Leung, 1982, 1998;Wang and Buzsaki, 1996; Traub et al., 1996, 1997, 2001;another in the CA3-CA1 regions. The coupling strength
between the two oscillators varied during both theta Jensen and Lisman, 1996; Wallenstein and Hasselmo,1997; Chow et al., 1998; White et al., 1998; Orban et al.,and nontheta states. Both pyramidal cells and inter-
neurons were phase-locked to gamma waves. Ana- 2001; Tiesinga et al., 2001). However, it is not knownto what extent these models reflect gamma oscillationtomical connectivity, rather than physical distance,
determined the coupling strength of the oscillating mechanisms in the intact brain and how the postulatedmechanisms interact with each other during behavior.neurons. CA3 pyramidal neurons discharged CA3 and
CA1 interneurons at latencies indicative of monosyn- Persistent (carbachol- and kainate-induced) gamma os-cillations require an intact CA3 region (Fisahn et al.,aptic connections. Intrahippocampal gamma oscilla-
tion emerges in the CA3 recurrent system, which en- 1998), whereas transient, tetanus-induced gamma oscil-lation can be elicited in the CA1 but not in the CA3trains the CA1 region via its interneurons.region (Whittington et al., 1995, 1997). Furthermore, thevarious models provide different predictions about theIntroductiontiming of principal cells and interneurons and their rela-tionship to the extracellular field. Finally, various theoret-Oscillations in cortical structures are believed to provide
temporal windows that bind coherently cooperating ical models postulate conflicting requirements for inter-regional synchronization (Lisman, 1998; Rolls, 1996).neuronal assemblies for the representation, processing,
storage, and retrieval of information (cf. Engel et al., Quantitative evaluation of these issues in the behavinganimal requires simultaneous recording of gamma cur-2001; Traub et al., 1999; Buzsaki et al., 1994). Of the large
family of brain oscillatory patterns, gamma oscillations rents from the various subregions along with concur-rently recorded neurons from each of these regions.have received special attention because of their alleged
role in sensory binding (Singer, 1993; Gray, 1994), mem- To examine the interregional relationships of gammaoscillations and the network mechanisms of their gener-ory (Fell et al., 2001), attentional selection (Fries et al.,
2001a), and “conscious” experience (Llinas et al., 1998; ation, we used two-dimensional silicon probes with alarge number of recording sites in freely moving ratsVarela et al., 2001). Gamma oscillations are also preva-
lent in the hippocampal formation, where they have been (Csicsvari et al., 2001).proposed to assist in encoding and retrieval of memorytraces (Bragin et al., 1995; Lisman and Idiart, 1995; Chro- Resultsbak and Buzsaki, 1998; Hasselmo et al., 1996).
In contrast to sensory cortical regions, where gamma In structures with regularly arranged neurons and affer-waves are induced by sensory stimulations (Gray et al., ents, such as the various layers of the hippocampus,1989; Eckhorn, 1994; but see Roelfsema et al., 1997; extracellularly recorded currents provide informationFetz et al., 2000; Fries et al., 2001b), the conditions that about location of currents flowing into and out of neu-give rise to the persistent hippocampal gamma oscilla- rons. Simultaneously recorded extracellular unit activitytions (Stumpf, 1965; Buzsaki et al., 1983; Leung, 1992; can assist in the interpretation of currents, i.e., whetherSoltesz and Deschenes, 1993; Hirai et al., 1999) are not they are induced by coherent afferent activity and/orknown. In vivo, they have been described in the dentate intrinsic membrane properties or reflect passive, “return”
currents. In the present studies, local field potentials (i.e.,voltage changes) were recorded simultaneously from 96*Correspondence: [email protected]
Neuron312
Figure 1. Gamma Oscillatory Patterns in theHippocampus during REM Sleep
Two sets of single epochs (300 ms voltagetraces; 1 Hz–3 kHz) of simultaneously re-corded field potentials from five shanks (300�m distance between shanks) of the siliconprobe (each shank had 16 recording sites at100 �m vertical spacing) are shown. The sixthshank penetrated lateral to the CA3b pyrami-dal layer (data not shown). Color panels: aver-aged gamma field potentials (30–80 Hz; n �
1000 gamma epochs for each voltage trace)and the derived CSD maps. Hot and cold col-ors correspond to sources and sinks, respec-tively. The center of the averaged fieldgamma traces (superimposed on the CSDplots) corresponds to the recording sites. Thecorresponding single epochs are displacedto the left (note the difference in time andamplitude calibrations for single epochs andaverages). Either a CA1 pyramidal layer site(A) or a GC layer site (B) served as a referencefor averaging gamma epochs �2 SD at thereference site (asterisks; vertical lines). Theweak gamma currents in the rightmost shankin (A) are due to the oblique spacing of therecording sites relative to cell orientation.Note the absence of sink-source pairs in theCA1 pyramidal layer in (B). p, pyramidal layer;g, GC layer; r, stratum radiatum. The positionof recording sites was determined from theevoked potentials in response to commis-sural and perforant path input stimulation andfrom the histological sections containing theprobe.
sites in 6 freely moving rats. The 2-dimensional arrange- tween gamma currents was measured directly orestimated indirectly from the relative phase differencesment of the recording sites in the frontal plane allowed
for the monitoring of field potentials in the major hippo- between regions using frequency domain analysis. Therelative timing of currents and unit activity was refer-campal regions (Figure 1). The location of each recording
position was determined by the evoked potentials in enced to gamma waves recorded in the CA1 pyramidallayer, unless noted otherwise. Group data were calcu-response to stimulation of the perforant path and com-
missural inputs combined with histological verification lated from sessions of 10–15 min during sleep, wakingimmobility, and walking.of probe tracks (Bragin et al., 1995). The recorded volt-
ages were converted to current-source densities (CSD)to eliminate volume conduction of the voltage fields in Distribution of Gamma Currents in the
Dentate-CA3-CA1 Regionsthe extracellular medium. Because the distance be-tween the recording sites of the probe (100 �m) could We first addressed the amplitude and phase relation-
ships of gamma waves in the dentate gyrus, CA3, andnot reliably separate individual neurons (Gray et al.,1995; Harris et al., 2000), the relationship between CA1 regions of the hippocampus. Two short gamma
oscillation episodes (1 Hz–5 kHz), recorded during REMgamma field and unit activity was examined in an addi-tional six rats using independently movable wire tet- sleep, are illustrated in Figure 1. For determining the
regional distribution of gamma oscillation-associatedrodes (Csicsvari et al., 2001). The time relationship be-
Gamma Oscillations in the Hippocampus313
currents, the field (voltage) traces were first filtered behaviors (p � 0.01; paired t test). When gamma CSDrather than the voltage was used for comparison, the(30–80 Hz), and the peaks of the filtered gamma waves
(threshold � 2 SD from baseline mean), recorded from state-dependence of gamma power varied differentiallyin the different regions. On average, no significant differ-either the CA1 pyramidal layer or the granule cell (GC)
layer (reference sites), were used to construct gamma ences in gamma CSD power between nontheta andtheta epochs were observed in the CA1 strata pyrami-cycle averages. The mean voltage traces were then used
to construct one-dimensional CSD maps for each shank. dale (n � 63 sites) and radiatum (n � 73) or CA3 stratapyramidale (n � 96) and radiatum (n � 74; for all tests,The average wavelengths of the gamma waves were
similar in the two regions (CA1: 18.8 � 0.11 ms; GC: p � 0.4; paired t tests), but gamma currents were signifi-cantly larger (22.6%) during theta versus nontheta ep-18.9 � 0.21; p � 0.3; i.e., approximately 53 Hz; n � 6
rats). Gamma waves showed a phase reversal at the ochs in the GC layer (p � 0.01; n � 134). These findingsindicate that the presence of theta oscillation is notborder of strata radiatum and pyramidale in both CA1
and CA3 regions, associated with current sources (red a prerequisite for gamma oscillation, although gammapower is enhanced in the dentate gyrus during thetain CSD maps) in the pyramidal layer flanked by a larger
sink (blue) in stratum radiatum and a smaller one in behavioral states. In addition, these findings further sup-port the two-gamma generator hypothesis.stratum oriens/alveus. The current source maximum
preceded the positive peak of the local field (voltage) During theta epochs, the magnitude of gamma powervaried as a function of the theta cycle in all regions. Inby 0.73 � 0.09 ms in the CA1 pyramidal layer (n � 21
sites in 6 rats). The source maximum in the CA3 pyrami- the absence of theta, gamma epochs varied relativelyirregularly, with no or low amplitude gamma currentsdal layer occurred 1.36 � 0.15 ms earlier than in the
CA1 pyramidal layer (n � 96 pairs in 6 rats). The current alternating with “bursts” of gamma epochs that wereconsiderably larger in amplitude than during theta. Thesource in the GC layer, associated with the CA1 refer-
ence gamma waves, was relatively small (Figure 1A). In difference in gamma oscillation dynamics in the twostates is indicated quantitatively by the significantlycontrast, when the GC layer was used as the reference,
gamma waves reversed across the GC layer associated larger coefficient of variation of gamma power duringnontheta (CV � 0.36 � 0.024 in CA1 [n � 66]; 0.34 �with a large current source in this layer but not in the
CA3-CA1 regions (Figure 1B). 0.023 in CA3 [n � 102]; 0.38 � 0.030 in GC [n � 51])versus theta (CV � 0.27 � 0.019 in CA1; 0.26 � 0.013The use of CSD traces, instead of the extracellular
voltage field, also allowed us to remove spurious coher- in CA3; 0.29 � 0.016 in GC) epochs (for all tests, p �0.005; paired t tests).ence due to volume conduction of the field potentials.
Coherence values of gamma currents were highest be-tween a reference site in the CA1 pyramidal layer and Interregional Coupling of Gamma Oscillatorsother surrounding CA1 sites (Figures 2A and 2C; n � The low overall coherence values between currents in140 pairs), followed by pairs between CA1 and CA3 sites CA1 pyramidal layer and GC layer indicated that gamma(n � 278), and the lowest values were observed between oscillators in these respective regions are relatively in-the CA1 pyramidal layer and GC layer of the dentate dependent. On the other hand, continuous display ofgyrus (n � 161; p � 0.001; ANOVA tests). In agreement gamma current power and coherence as a function ofwith the time domain analysis (Figure 1), gamma cur- time suggested that the two generators do couple fromrents recorded in the CA3-CA1 pyramidal layer were in- time to time. Figure 3A shows a continuous display ofphase (27.3� � 7.5� with CA3 leading; i.e., 1.5 ms delay gamma current magnitude (root mean square of theat 53 Hz) and out-of-phase with signals recorded in signal in consecutive 102 ms windows) recorded in thestratum radiatum of CA3-CA1 (CA1: 160.6� � 8.3�; CA3: various cell layers. Power, as a function of time, fluctu-203.9� � 8.1�; Figure 2E). When the dentate GC layer ated similarly within the CA1 region (Figure 3B; r � 0.57 �was chosen as the reference site, coherent signals 0.02; n � 140 CA1 pairs in 6 rats). Gamma power fluctua-(�0.3) were observed within the dentate gyrus and be- tion in the CA1 region also strongly correlated withtween the granule cell layer and stratum lacunosum- power in CA3c (r � 0.44 � 0.02; n � 102) and progres-moleculare (Figures 2B and 2D). Current signals re- sively less so with CA3b (r � 0.37 � 0.02; n � 30) andcorded in the GC and molecular layers were phase re- CA3a (0.33 � 0.02; n � 57) regions. All these correlationsversed (Figure 2F). Gamma coherence between dentate were significant (for all tests, p � 0.001). The least, butgyrus and CA1 layers was lowest (�0.1), with somewhat nevertheless still significant, correlation of power waslarger values between current signals in dentate gyrus observed between CA1 and the GC layers (r � 0.24 �and CA3. These findings suggest that at least two 0.01, p � 0.001; n � 161). Coherence changes of gammagamma current generators reside in the hippocampal currents (gray traces in Figure 3A) in different regionsformation, one in the dentate gyrus and another one in faithfully reflected the changes in power correlations.the CA3-CA1 regions. They also indicate that gamma In addition to calculating correlations, a multilinearcoherence does not simply decrease with distance (Bul- regression method was used to examine how well multi-lock and McClune, 1989), but that the connectivity be- ple sites in the CA3 pyramidal layer or GC layer predicttween the recording sites plays an important role. the time-varying power changes in the CA1 region. A
cross-validation method was used in these calculations.The regression equation was calculated for the first partGamma Oscillations during Theta
and Nontheta Epochs of the recording session, and the correlation coefficient(“prediction”) was calculated for the second half. TheIn agreement with previous reports (Buzsaki et al., 1983;
Leung, 1992, 1998), the power of field gamma oscillation accuracy of prediction for a given CA1 site increasedwith the number of CA3 sites (n � 1 to 6; Figure 3C).in the CA1 region was larger during theta-associated
Neuron314
Figure 2. Coherence and Phase Maps of Gamma Oscillation Currents
(A and B) Single animal. Asterisk, reference site; color-coded rectangles, coherence and phase values of gamma currents. Phase values areshown only at sites with �0.1 coherence values. In (A), note that gamma currents are in phase in the CA1-CA3 pyramidal layers (with relativelyhigh coherence values; light blue to red) and phase-reversed in stratum radiatum (compare blue-green to yellow-red). In (B), note the highcoherence values and in-phase gamma currents mostly in the GC layer.(C–F) Group data from different sites in six animals (mean � SE; 10 min sleep epochs). Ref, reference site. Note similar phase in the CA1 andCA3 pyramidal layers (E) and out-of-phase currents in all layers outside the GC layer (F). Note also the low coherence values between CA1pyramidal layer and GC layer (C and D). CA1p, CA3 p, pyramidal layer; CA1r, CA3r, stratum radiatum; GC, granule cell layer; lm, stratumlacunosum-moleculare; mol, dentate molecular layer.
However, not all sites contributed equally. In all six rats, ferent from random (Figure 4C; p � 0.001; n � 161 pairsin six rats; Rayleigh test), with the GC source precedingone of the recording sites contributed �40% of the cor-
relation. Furthermore, the magnitude of correlation var- the CA1 source by 38� � 12.4� (mean � 2SE). Thesefindings indicate physiological coupling between theied substantially across animals, presumably reflecting
the variation of CA3-CA1 anatomical-functional connec- dentate and CA3-CA1 gamma generators.tions sampled by the 2-dimensional probe. The predic-tion of CA1 power by GC recording sites was poor (r � Gamma Oscillation-Related Discharge of Neurons
Tetrode recordings did not allow for the calculation of0.2 � 0.02) and did not increase significantly with anincreasing number of sites (p � 0.85; ANOVA; Figure 3C). CSD, and field recordings are subject to volume-con-
ducted contamination. Data from the probe recordingsTo gain further insight into the coupling mechanismof the two hypothesized gamma oscillators, gamma cur- indicated that only large amplitude gamma waves
(�5SD above the mean; 2% of all epochs), recordedrent epochs with high (�0.2; such as that shown inFigures 4A and 4B) and low (�0.05) CA1-GC coherence from the GC layer, contributed to the �2 SD gamma
waves in the CA1 pyramidal layer. Therefore, for all unit-values were grouped separately. Gamma power wassignificantly larger in both CA1 and GC layer sites during field analyses, only gamma epochs (filtered: 30–80 Hz)
with �2SD above the mean, recorded from the CA1epochs of high coherence relative to epochs of lowcoherence (for all tests, p � 0.001; t tests), indicating pyramidal layer, were included (trough � 0� reference).
Two approaches were used to relate unit dischargesthat simultaneous increase of power in the two oscilla-tors does not arise from the random coincidence of to the phase of the gamma cycle. First, the discharge
probability as a function of phase was calculated forthe two rhythms. Furthermore, we found that the phasedifference between CA1 and GC current signals de- each neuron, and the derived phase histograms were
averaged across neurons (Figure 5A). Second, the signif-pended on the magnitude of coherence (as illustratedfor a single animal in Figure 4C). During epochs of high icance of phase-locking to gamma waves was tested in
every cell (Rayleigh test, p � 0.05), and the circular mean(�0.2) coherence, the average phase difference be-tween CA1 and GC current signals was significantly dif- phases of the significantly modulated neurons were
Gamma Oscillations in the Hippocampus315
Figure 3. Dynamics of Power and CoherenceRelationships across Different Regions dur-ing Sleep
(A–C) Continuous display of instantaneousgamma current power (102 ms time win-dows). The corresponding recording sites areindicated in (C). Uppermost trace: theta/deltaratio. REM, REM sleep episode (between dot-ted vertical lines). Light gray traces: coher-ence values between the reference (1) andother sites. The marked period in (A) (thickbar) is shown at a faster time scale in (B).Note the strong similarity of power fluctuationof gamma currents in CA1 and the CA3c site(3) and modest relationship between CA1 andGC layer (4). The strongest similarity was ob-served between neighboring CA1 sites (datanot shown).(D) Average correlations (r) of instantaneouspower between recording sites in varioussubregions. Asterisks, significantly differentfrom CA3a sites (*p � 0.01; ANOVA post hoctests).(E) Reliability of gamma current power predic-tion in CA1 increases with the number of re-corded CA3 sites. Multiple regression wasused to calculate the relationship betweendifferent sites. Gamma current power in theGC layer poorly predicted power in CA1 pyra-midal layer. Group data from three rats.
used to construct frequency histograms (Figure 5B). All son-Williams test), corresponding to 1.5 ms time differ-ence at 53 Hz. The discharge probability of pyramidalinterneurons included in the analysis were recorded
from the pyramidal layer; therefore, most of them were neurons in the gamma cycle reached a maximum earlierthan interneurons in both CA3 (64� � 13.2�; n � 411either basket cells or chandelier cells. These neurons
provide perisomatic inhibition to the principal cells (cf. cells) and CA1 (45� � 7.6�; n � 294 cells; p � 0.02,Watson-Williams test) regions. These phase differencesFreund and Buzsaki, 1996).
The proportion of significantly phase-locked cells was translate to a 3.1 ms time difference between CA3 pyra-midal cells and CA3 interneurons, 3 ms between CA3higher for interneurons in both CA1 and CA3 regions
(�75%) compared to pyramidal cells (�43%; Figure 5B). pyramidal cells and CA1 interneurons, and 5.5 ms be-tween CA1 pyramidal cells and CA1 interneurons. TheCA3 interneurons (n � 68) fired significantly earlier
(121� � 32.4�, mean � 95% confidence interval) than criteria for distinguishing granule cells, interneurons,and mossy cells in the dentate gyrus are not well estab-CA1 interneurons (149� � 14.6�; n � 53; p � 0.01, Wat-
Figure 4. Synchronization of Gamma Cur-rents in the CA1-CA3 Regions and DentateGyrus
(A) A short epoch of gamma oscillation (CSDtraces) in the CA1-dentate axis (sink is down).The epoch was selected to show simultane-ous occurrence gamma currents in all cellbody layers. CA1p, CA1 pyramidal layer;CA3p, CA3 pyramidal layer; GC, granule celllayer.(B) Averaged CSD profile of gamma currentscalculated from epochs with �0.2 coherencebetween CA1p and GC layer sites from a 10min recording session. Note the source-sinkpairs in CA1p, GC, and CA3p.(C) Coherence versus phase difference be-tween gamma currents in CA1p and GC lay-ers. Each dot represents the phase differenceand coherence value between gamma ep-ochs (102 ms) recorded at CA1p and GC lay-ers (10 min immobility/sleep session). Twogamma cycles are shown to aid visibility.Right, sum of points. Note that maximum co-herence corresponds to 30� phase difference,with GC signal leading.
Neuron316
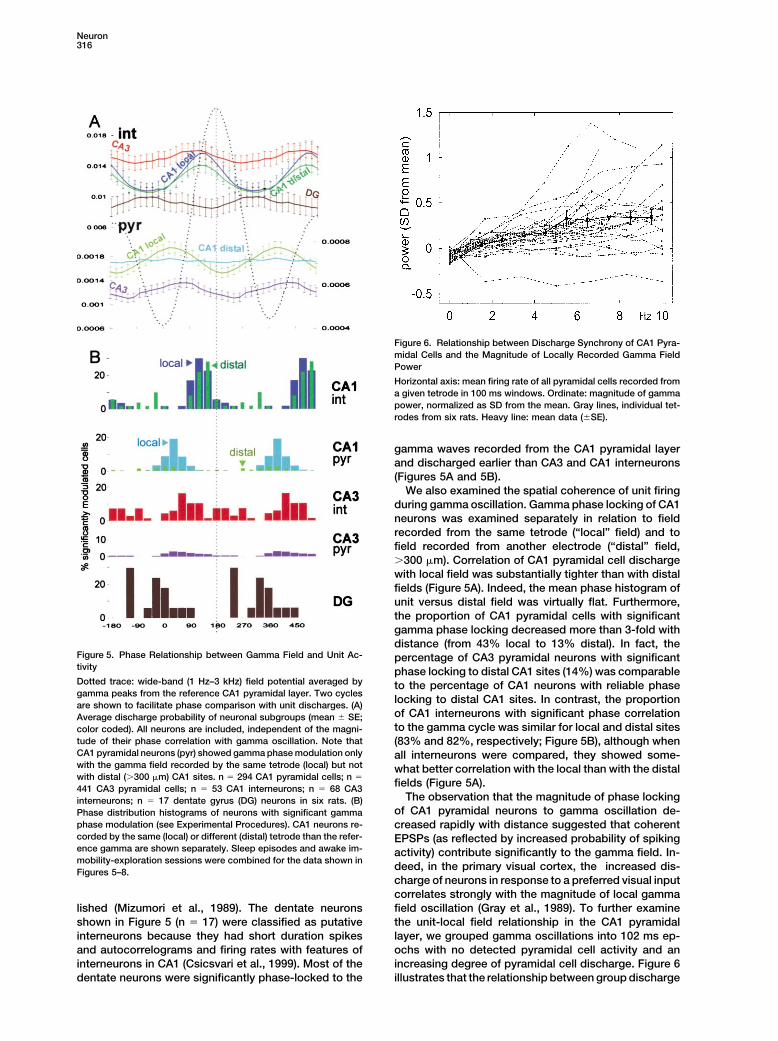
Figure 6. Relationship between Discharge Synchrony of CA1 Pyra-midal Cells and the Magnitude of Locally Recorded Gamma FieldPower
Horizontal axis: mean firing rate of all pyramidal cells recorded froma given tetrode in 100 ms windows. Ordinate: magnitude of gammapower, normalized as SD from the mean. Gray lines, individual tet-rodes from six rats. Heavy line: mean data (�SE).
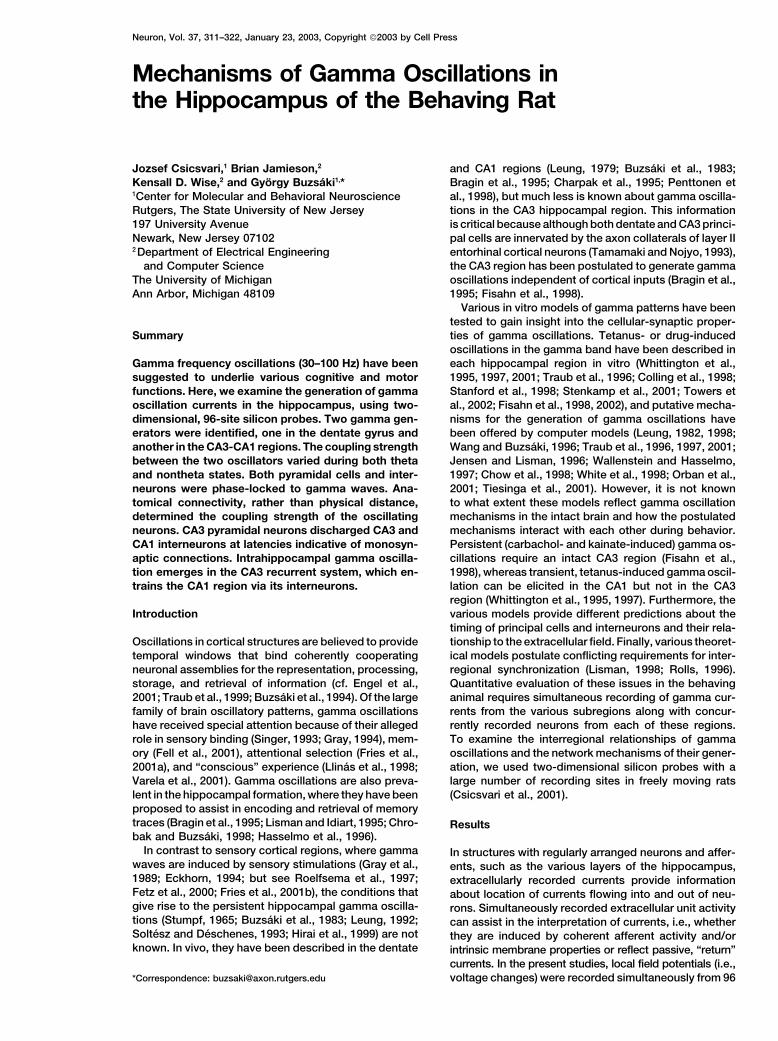
gamma waves recorded from the CA1 pyramidal layerand discharged earlier than CA3 and CA1 interneurons(Figures 5A and 5B).
We also examined the spatial coherence of unit firingduring gamma oscillation. Gamma phase locking of CA1neurons was examined separately in relation to fieldrecorded from the same tetrode (“local” field) and tofield recorded from another electrode (“distal” field,�300 �m). Correlation of CA1 pyramidal cell dischargewith local field was substantially tighter than with distalfields (Figure 5A). Indeed, the mean phase histogram ofunit versus distal field was virtually flat. Furthermore,the proportion of CA1 pyramidal cells with significantgamma phase locking decreased more than 3-fold withdistance (from 43% local to 13% distal). In fact, the
Figure 5. Phase Relationship between Gamma Field and Unit Ac- percentage of CA3 pyramidal neurons with significanttivity phase locking to distal CA1 sites (14%) was comparableDotted trace: wide-band (1 Hz–3 kHz) field potential averaged by to the percentage of CA1 neurons with reliable phasegamma peaks from the reference CA1 pyramidal layer. Two cycles
locking to distal CA1 sites. In contrast, the proportionare shown to facilitate phase comparison with unit discharges. (A)of CA1 interneurons with significant phase correlationAverage discharge probability of neuronal subgroups (mean � SE;to the gamma cycle was similar for local and distal sitescolor coded). All neurons are included, independent of the magni-
tude of their phase correlation with gamma oscillation. Note that (83% and 82%, respectively; Figure 5B), although whenCA1 pyramidal neurons (pyr) showed gamma phase modulation only all interneurons were compared, they showed some-with the gamma field recorded by the same tetrode (local) but not what better correlation with the local than with the distalwith distal (�300 �m) CA1 sites. n � 294 CA1 pyramidal cells; n �
fields (Figure 5A).441 CA3 pyramidal cells; n � 53 CA1 interneurons; n � 68 CA3The observation that the magnitude of phase lockinginterneurons; n � 17 dentate gyrus (DG) neurons in six rats. (B)
of CA1 pyramidal neurons to gamma oscillation de-Phase distribution histograms of neurons with significant gammaphase modulation (see Experimental Procedures). CA1 neurons re- creased rapidly with distance suggested that coherentcorded by the same (local) or different (distal) tetrode than the refer- EPSPs (as reflected by increased probability of spikingence gamma are shown separately. Sleep episodes and awake im- activity) contribute significantly to the gamma field. In-mobility-exploration sessions were combined for the data shown in
deed, in the primary visual cortex, the increased dis-Figures 5–8.charge of neurons in response to a preferred visual inputcorrelates strongly with the magnitude of local gammafield oscillation (Gray et al., 1989). To further examinelished (Mizumori et al., 1989). The dentate neurons
shown in Figure 5 (n � 17) were classified as putative the unit-local field relationship in the CA1 pyramidallayer, we grouped gamma oscillations into 102 ms ep-interneurons because they had short duration spikes
and autocorrelograms and firing rates with features of ochs with no detected pyramidal cell activity and anincreasing degree of pyramidal cell discharge. Figure 6interneurons in CA1 (Csicsvari et al., 1999). Most of the
dentate neurons were significantly phase-locked to the illustrates that the relationship between group discharge
Gamma Oscillations in the Hippocampus317
gram occurred at 2 ms, indicating a delay between thesingle CA3 and CA1 interneuron populations. When thereference event was the discharge of CA3 pyramidalcells, clear peaks were identified at 2 ms and 4–5 msin the CA3 pyramidal-CA3 interneuron pairs and CA3pyramidal-CA1 interneuron pairs, respectively (Figure7C). No identifiable peak was present in the CA3-CA1pyramidal cell pairs (Figure 7B). Taken together, thesefindings suggest that during gamma oscillations, CA3pyramidal neurons contribute to the firing of targetinterneurons in both the CA3 and CA1 regions.
This hypothesis was investigated further by examiningindividual cross-correlograms. As reported previously,monosynaptic connections between CA1 pyramidalcell-interneuron pairs could be identified by a significantpeak at 1–3 ms in their cross-correlograms (Csicsvariet al., 1998; Marshall et al., 2002). Putative monosynapticconnections were also observed in the CA3 region be-tween pyramidal cell-interneuron pairs recorded by boththe same (18 of 240 pairs) or different (27 of 889 pairs)tetrodes (Figure 8A). Importantly, we also identifiedmonosynaptic connections between CA3 pyramidalcells and CA1 interneurons (8 of 495 pairs), indicatedby significant peaks at 4–5 ms (Figure 8B). Finally, someCA3 interneuron pairs, recorded from two different elec-trodes, showed a large, significant peak in the zero binof the cross-correlogram (n � 8; Figure 8C). Such “su-persychronous” activation of interneurons (�1 ms)could have been brought about by a common inputor by gap junction coupling between the interneurons(Katsumaru et al., 1988; Galarreta and Hestrin, 1999;Tamas et al., 2000; Hormuzdi et al., 2001). The incidenceof electrical coupling between interneurons decreasesrapidly with distance (Deans et al., 2001; Bartos et al.,
Figure 7. Unit-Unit Correlations during Gamma Oscillation 2002). However, coupling between interneurons re-Neuron pairs in the same and different regions, recorded from differ- corded by the same electrode could not be studiedent tetrodes, are shown separately (insets). (A) Interneuron pairs because the spike detection program had a refractory(circles in inset). Side peaks of CA3 interneuron pairs (n � 344 pairs) period of 0.6 ms.indicate gamma frequency modulation (triangles). Note the timedelay (2 ms) between CA3-CA1 interneuron pairs (n � 212; arrow).
DiscussionCA1-CA1 pairs (n � 184). (B) Pyramidal cell pairs (n � 5300 CA1-CA1 pairs; n � 9524 CA3-CA3 pairs; n � 6618 CA3-CA1 pairs).(C) Pyramidal-interneuron pairs. Note peaks at 2 ms between CA3 Our findings suggest that two gamma current genera-pyramidal-CA3 interneuron pairs (n � 1700) and at 4–5 ms between tors reside in the hippocampus. The gamma oscillatorCA3 pyramidal-CA1 interneuron pairs (n � 988). n � 964 CA1 pyrami-
in the dentate gyrus requires an extrahippocampal drivedal-CA1 interneuron pairs.because, following surgical removal of the entorhinalcortex, the power of dentate gamma activity virtuallydisappears, whereas it increases several-fold in the CA1rate (pyramidal cell spikes in 102 ms windows recorded
by the tetrode) and the magnitude of local gamma activ- region (Bragin et al., 1995). A similar large increase inCA1 gamma power has been described after transientity for individual sites. The group level comparison re-
vealed a reliable and positive correlation between the impairment of the entorhinal cortex following afterdis-charges (Leung 1987). Furthermore, the discharge fre-discharge rate of pyramidal cells and gamma power (r �
0.50, p � 0.001). quency of layer II, III entorhinal cortical neurons is in-creased during theta-associated behaviors (Chrobakand Buzsaki, 1998), which may contribute to the selec-Unit versus Unit Correlations
Cross-correlation of units at the population level pro- tively increased gamma current power in the dentategyrus during theta relative to nontheta epochs. In con-vided independent support for the observations with
gamma oscillations in the time and frequency domain trast to the dentate oscillator, gamma rhythm generationin the CA3-CA1 regions does not require external inputs.analysis of CSD traces and unit-field correlations. Cross-
correlograms between CA3-CA3 interneurons had side The dentate and CA3-CA1 generators can be coupledunder physiological conditions as indicated by (1)peaks at gamma frequency. These side peaks are less
prominent in the group average (Figure 7A, arrows) be- phase-locked discharge of putative dentate interneu-rons to CA1 gamma waves, (2) the weak but significantcause of the varying dominant frequencies in the differ-
ent recording sessions. The peak of the CA3-CA1 histo- correlation of gamma power in CA1 and GC layers, and
Neuron318
Bracci et al., 1999; Colling et al., 1998; Stanford et al.,1998). We suggest that the following model can accountbest for our observations (Figure 9). We propose thatintrahippocampally generated gamma activity resultsfrom the interaction of CA3 pyramidal neurons andinterneurons and that the coherent coupling of the oscil-lating cell groups is responsible for the extracellulargamma fields.
A critical test of a model is to explain the spike timerelationships between participating neurons and thefield currents they produce. In our experiments, phase-reversed gamma fields and associated source-sink pairswere present in the strata pyramidale and radiatum ofboth CA3 and CA1 regions. The timing between pyrami-dal cells and putative basket/chandelier interneurons,however, was different in the two regions, suggestingthat the network mechanisms of gamma generation arenot identical in CA3 and CA1. In the CA3 region, peakactivity of the pyramidal cell population preceded thepeak of CA3 interneuron discharges by approximately2 ms, measured either by unit-unit correlations or bycomparing peak discharges relative to the referencegamma cycle in CA1 pyramidal layer. The dischargingpyramidal cells and interneurons can therefore providedendritic excitation and somatic inhibition of pyramidalcells. These events are suggested to give rise to thesink-source pair in strata radiatum and pyramidale. Al-though we do not have direct measurements of EPSPsand IPSPs, the timing scenario of unit discharges andfield potentials observed here is quite similar to thatdescribed in the hippocampal slice during carbachol-induced gamma oscillation and in an associated compu-tational model (Fisahn et al., 1998; Traub et al., 2000).In the slice experiment, the peak EPSC coincided with
Figure 8. Monosynaptic Activation of Interneuronsthe trough in stratum radiatum (peak in pyramidal layer)
Monosynaptic discharge of a CA3 interneuron (A) or CA1 interneuron followed by the peak IPSC 2–3 ms (i.e., 30�–60�) later.(B) by CA3 pyramidal cells. (A) and (B) are different cell pairs. Shuf-
Thus, observations in vitro and in vivo are in agreementfling-corrected cross-correlograms indicate significant (dotted lines,in the CA3 region, and the mechanisms suggested from3 SD, p � 0.002) peaks at 1 and 6 ms, respectively. Ordinate: proba-the in vitro observations may apply to the intact hippo-bility of interneuron discharge. 45 of 1129 CA3 pyramidal cell-CA3
interneuron pairs and 8 of 495 CA3 pyramidal cell-CA1 interneuron campus (Figure 9).pairs showed significant peaks at monosynaptic latency. (C) Shuf- We suggest further that the gamma phase-locked dis-fling-corrected cross-correlogram between two interneurons, re- charge of CA3 pyramidal cells is responsible for gammacorded by two nearby tetrodes. Note the large, significant peak at oscillations in the CA1 region as well. First, recordingstime 0 ms. 8 such pairs (out of 344 possible pairs) were identified.
from multiple CA3 sites predicted CA1 gamma powerSimultaneous activation of the interneurons can be brought aboutbetter than any single site. Second, in previous in vitroby either a common input or gap junction connections betweenexperiments, surgical lesion between the two regionsinterneurons.eliminated carbachol-induced gamma oscillation in CA1but left it intact in CA3 (Fisahn et al., 1998). Third, the
(3) the phase-lead of GC gamma currents relative to sink-source distribution of gamma oscillation in the CA1CA1. On average, the two oscillators are weakly syn- region was similar to the CSD profile evoked by stimula-chronized, and the strength of coupling fluctuates over tion of the commissural/associational affferents (dataa wide range. The precise behavioral conditions that not shown). Fourth, the time difference between sourcesspecifically enhance the coherence between the gamma in the CA3 and CA1 pyramidal layers, measured by bothoscillators at the input and output stages of the hippo- time and frequency domain analyses, is in register withcampus remain to be uncovered. the time difference between discharging CA3 and CA1
interneurons, calculated by both unit versus gammaCA3-CA1 Regions Sustain Gamma Oscillation field and unit versus unit correlations. Nevertheless, CA3Various in vivo, in vitro, and computational models have pyramidal neurons are not the immediate cause ofbeen put forward for the explanation of the emergence gamma-related discharge of CA1 pyramidal cells, be-of gamma frequency oscillations in cortical structures cause the peak of CA1 pyramidal cell activity occurred(Leung, 1982; Whittington et al., 1995; Traub et al., 1996, earlier than the peak in CA3 and at times when CA11997, 1999, 2001; Wang and Buzsaki, 1996; Chow et al., interneuron activity was at its minimum. We hypothesize1998; Fisahn et al., 1998, 2002; White et al., 1998; Fellous that the gamma cycle-related sink-source pair in CA1
strata radiatum and pyramidale corresponds to EPSPsand Sejnowski, 2000; Gray, 1994; Kopell et al., 2000;
Gamma Oscillations in the Hippocampus319
Figure 9. Proposed Mechanism of Gamma Oscillations
(A) Two major gamma oscillators are postulated. The oscillator in the dentate gyrus (DG) depends on an extrahippocampal input from theentorhinal cortex (EC). The CA3 circuit represents an intrahippocampal gamma oscillator. CA1 gamma depends primarily on CA3 input. TheDG and CA3 gamma oscillators are weakly coupled. Direct influence of the EC input on the intrahippocampal (CA3) gamma oscillator is notshown.(B) Averaged gamma field activity (voltage) recorded from the CA1 and CA3 pyramidal layers and GC layer. Recording sites and traces arecolor coded. The reference site was in the CA1 pyramidal layer. Note gradual latency shift in the CA3a, b, c direction (oblique dotted line).(C) Discharging CA3 pyramidal neurons excite each other and discharge basket and chandelier cells in both CA3 and CA1 regions. Feedforwardinhibition prevents CA1 pyramidal cells from discharging.(D) Averaged gamma current activity in the CA1 strata pyramidale and radiatum (upper two traces) and in the CA3 strata radiatum andpyramidale (bottom two traces). Preferred phases of pyramidal cells (CA1p, CA3p) and interneurons (CA3i, CA1i) are indicted by dotted lines.Extracellular gamma fields are assumed to derive from ensuing EPSPs and IPSPs in the dendritic and somatic regions, respectively.
(sink) and disynaptic IPSPs (source) in the dendrites and higher than between CA1-CA3a sites. It should be notedhere that in the curved portion of CA3b (fimbrial), thesomata of CA1 pyramidal cells, brought about by the
phase-locked discharge of CA3 pyramidal neurons. Un- absolute current power is not reflected faithfully be-cause of the vertical positioning of the recording sites.der average conditions, feedforward inhibition appears
to curtail the excitatory drive of CA1 pyramidal cells. Nevertheless, this does not affect the power variation orcoherence measurements. Finally, the latency betweenThe inability of the CA1 region to generate gamma
oscillations on its own may be due to the absence of gamma cycle peaks recorded in CA1 and CA3 regionsdecreased in the CA3a, b, and c direction (Figure 9B).an excitatory recurrent collateral system, the hallmark of
the CA3 region or other hitherto unidentified differences These observations can be attributed to the differentialconnectivity of the CA3 subregions. Most axon collater-between the two regions. Although CA1 pyramidal cells
are known to discharge their interneurons (Ali et al., als of CA3c pyramidal cells innervate CA1 neurons. Theratio of recurrent collaterals versus CA1 projecting ax-1998; Csicsvari et al., 1998; Marshall et al., 2002), the
long time difference between the peak discharge of CA1 ons of CA3 pyramidal neurons increases progressivelyin the CA3 c, b, a axis (Li et al., 1994). We hypothesizepyramidal cells and interneurons (104�, i.e., �5 ms) is in
favor of the interpretation that the CA3 output is the that intrahippocampal gamma oscillation emanatesfrom the recurrent collateral-dense CA3a-b subregions,major source of gamma cycle-related discharge of CA1
basket cells. Furthermore, CA1 basket cells receive whose activity recruits CA3c, which, in turn, entrainsCA1 neurons.many more synapses from CA3 than from CA1 pyramidal
cells (cf. Freund and Buzsaki, 1996). Other postulatedmechanisms of gamma oscillations, such as mutual in- Gamma Frequency Synchrony of Active
Principal Cellsteractions among interneurons via both inhibitory syn-apses and gap junctions (Whittington et al., 1995; Wang Axon terminals of single CA3 pyramidal neurons cover
as much as two thirds of the longitudinal extent of theand Buzsaki, 1996; Tamas et al., 2000; Hormuzdi et al.,2001; Deans et al., 2001; Traub et al., 1996, 1997, 2000, CA1 region (Ishizuka et al., 1990; Li et al., 1994). On the
basis of anatomy alone, therefore, one would expect a2001) or feedback inhibition (Leung, 1979, 1998; Lisman,1998), may also contribute to the above suggested highly coherent gamma activity throughout the entire
CA1 region. Indeed, interneurons at distal locations weremechanisms. The 0 ms discharge of interneuron pairsobserved in the present experiments is in support of highly coupled with each other as well as with both local
and distal fields. In contrast to this expectation, a rapidthe suggestion that gap junctions may assist gammaoscillations. decrease in pyramidal cell versus gamma wave coupling
with distance was observed. This may be so becauseOur experiments also revealed functional differenceswithin the CA3 region. The correlation of current power EPSPs may also significantly contribute to the gamma
field (Leung, 1979; 1982; Eeckman and Freeman, 1990;was better between CA1 and CA3c sites than betweenthe spatially more proximal CA1-CA3a sites. Similarly, Fisahn et al., 1998, 2002). Although we did not measure
EPSPs directly, we could indirectly assess their magni-gamma coherence between CA1 and CA3c sites was
Neuron320
distribution of sinks and sources (Holsheimer, 1987). CSD transfor-tude by the discharge probability of pyramidal cells.mation was carried out on the averaged field response. For averag-Increased discharge probability of pyramidal neuronsing, a reference electrode was chosen (either the CA1 pyramidalwas correlated with increased local gamma power, simi-layer or the granule cell layer), and peaks of gamma cycles, 2 SD
lar to the relationship between stimulus-driven unit ac- above the overall background power, were detected. The choice oftivity and increased amplitude of gamma oscillation in reference this way is biased to detect CSD of the signals coherent
with the events close to the reference site.the primary visual cortex (Gray et al., 1989). Becausevery few hippocampal pyramidal cells are active in the
Detection of Gamma and Theta Patternstime window of the gamma cycle during spatial behaviorFor the extraction of gamma oscillatory periods, the wide band (1(O’Keefe and Nadel, 1978; Csicsvari et al., 1999; HenzeHz–5 kHz) recorded data were digitally filtered (30–80 Hz). The digitalet al., 2000; Redish et al., 2001; Hirase et al., 2001), ourfiltering reliably excluded ripple (140–200 Hz) epochs. The power
prediction is that gamma current power at recording (root mean square) of the filtered signal was calculated for eachsites with active place neurons correlates with the spa- electrode within a 25 ms window. The mean and SD of power of a
given file were first calculated to determine the detection threshold.tial location of the animal. Similarly, temporally coordi-Gamma oscillatory periods with a power of 2 SD above the meannated discharge of place cells at different locations maywere detected and used for subsequent analysis. The beginningbe accompanied by an increased coherence betweenand the end of oscillatory periods were marked by time points atthe locally recorded gamma currents. The postulatedwhich the power decreased �1 SD. These gamma epochs repre-
granularity of gamma coherence is further supported by sented approximately 10% of the 10–15 min recording sessions.the observation that a single CA3 site was nearly as good Peaks and troughs of individual gamma cycles (�2 SD) were de-
tected. Theta epochs during exploration and REM sleep were de-a predictor of CA1 gamma power at a given location astected by calculating the ratio of the theta (5–10 Hz) and delta (2–4the sum of the remaining sites.Hz) frequency band in 2.0 s windows, followed by manual adjust-ment. A Hamming window was used during the power spectralExperimental Procedurescalculations. After digital filtering (5–28 Hz), the negative peaks ofindividual theta waves were identified (Csicsvari et al., 1999; J.The general surgical procedures, electrode preparation, implanta-Csicsvari et al., 2001, Soc. Neurosci., abstract).tion, and spike sorting methods have been described (Csicsvari et
al., 1998, 1999, 2000). All procedures conformed to the NIH GuideSpectral Analysisfor the Care and Use of Laboratory Animals. In short, 12 male ratsCoherence and spectral phase differences were calculated in suc-of the Sprague-Dawley strain (400–900 g) were anesthetized with acessive 102.4 ms (512 samples) windows. Hamming windows weremixture (4 ml/kg) of ketamine (25 mg/ml), xylazine (1.3 mg/ml), andused during the power spectrum estimations. For the estimation ofacepromazine (0.25 mg/ml) and placed in the stereotaxic apparatus.coherence and spectral phase difference within short time segmentsSix animals were implanted with silicon probes, and the remaining(e.g., Figures 3 and 4), Thomson’s multitaper method was usedsix animals with wire tetrodes. The silicon probes contained six(Thomson, 1982; Mitra and Pesaran, 1999). Circular standard errorsshanks (300 �m shank separation) and each shank had 16 recordingwere calculated for spectral phase differences (Fisher, 1993).sites (108 �m2 ) with 100 �m vertical spacing. The probes were
implanted at anterior-posterior, AP � �3.5 mm, and medio-lateral,Field-Unit and Unit-Unit CorrelationsML � 2.5 mm, position. During the experiment, the probe was movedThe phase relationship between unit activity and gamma oscillationgradually, and recordings were made at each depth location. A pairwas calculated by the following manner. Each spike was assignedof stainless steel wires (60 �m in diameter) was placed into theto a given phase (bin size of 20�) of the normalized gamma cycle,fimbria-fornix/hippocampal commissure (AP � �0.8, L � 0.5,and a phase histogram was calculated by summing unit dischargesV � �4.2 mm) to stimulate the commissural afferents to the CA1that occurred at different phases. Phase histograms were normal-region and another pair in the angular bundle (AP � �7.0, L �ized by dividing each bin by the number of gamma cycles, and the4.5, V � �3.5 mm) to stimulate the entorhinal input. The evokedprobability of unit discharge at each phase was computed. Circularresponses by these pathways helped the on-line identification ofstatistics of the unit-discharge gamma phases (i.e., Rayleigh test,the recording electrodes (Bragin et al., 1995). The remaining animalsp � 0.05) (Kanji, 1999) were used to test whether individual unitswere implanted with wire tetrodes (four 13 �m enamel-coated ni-showed significant phase locking to gamma waves. The Watson-chrome wires) (Gray et al., 1995). The “tetrodes” were attached toWilliams circular test was used to quantify differences of phasea multidrive array, and eight electrodes were independently movedlocking between neuron populations (Kanji, 1999). Cross-correlationduring the experiment. The physiological data were collected duringhistograms of unit discharges were calculated to assess monosyn-spontaneous exploration, immobility states, and slow wave sleepaptic connections between units, as described in Csicsvari et al.and REM sleep episodes in the home cage. Instrumentation amplifi-(1998).ers built into the female connector (Szabo et al., 2001) were used
to reduce cable movement artifacts. Two synchronized 64-channelDataMax systems (16-bit resolution; RC Electronics, Santa Barbara, Prediction of CA1 Gamma Power Based on CA3CA) continuously recorded electrical activity at 20 kHz to computer and Dentate Gamma Activityhard disk. Gamma power was estimated in consecutive 200 ms windows in
the CA1 pyramidal layer based on gamma power at multiple sitesin the CA3 or GC layers. For these calculations, cross-validationSpike Sortingprocedure was used; i.e., the regression equation was establishedThe continuously recorded wide-band signals were high-pass fil-based on the first half of the recordings, and the correlation coeffi-tered (0.8–5 kHz) digitally. Units were identified and isolated by acient was calculated for the second half. All possible combinationssemiautomatic “cluster cutting” algorithm (Csicsvari et al., 1998;of CA3 and GC sites were used to calculate the average correlationHarris et al., 2000). Auto- and cross-correlations were calculated tocoefficient (Csicsvari et al., 2000).verify the clustering procedure.
CSD Analysis Histological ProceduresFollowing completion of the experiments, the rats were deeply anes-One-dimensional CSD maps were calculated in one direction (depth)
as the second spatial derivative of the local field potentials (Bragin thetized and perfused through the heart, first with 0.9% saline solu-tion followed by a 10% buffered formalin phosphate solution. Theet al., 1995). This approach assumes that the resistivity of the extra-
cellular medium is similar at different depths. Although some resist- brains were sectioned by a Vibroslice at 100 �m in the coronalplane. The sections were mounted on slides, Nissl stained, andivity differences are present in the different hippocampal layers, in
practice these are not large enough to significantly modify the spatial coverslipped. The tracks of the tetrodes or silicon probes were
Gamma Oscillations in the Hippocampus321
reconstructed from multiple sections. The exact recording sites in Engel, A.K., Fries, P., and Singer, W. (2001). Dynamic predictions:oscillations and synchrony in top-down processing. Nat. Rev. Neu-the vertical direction for each session were determined by the
evoked responses. The derived electrical patterns then were super- rosci. 2, 704–716.imposed on the anatomical substrate that emanated them (e.g., Fell, J., Klaver, P., Lehnertz, K., Grunwald, T., Schaller, C., Elger,Figure 1). C.E., and Fernandez, G. (2001). Human memory formation is accom-
panied by rhinal-hippocampal coupling and decoupling. Nat. Neu-Acknowledgments rosci. 4, 1159–1160.
Fellous, J.M., and Sejnowski, T.J. (2000). Cholinergic induction ofWe thank D. Buhl, G. Dragoi, K. Harris, D. Henze, N. Kopell, L.S. oscillations in the hippocampal slice in the slow (0.5–2 Hz), thetaLeung, A. Sirota, and the anonymous referees for their constructive (5–12 Hz), and gamma (35–70 Hz) bands. Hippocampus 10, 187–197.comments on the manuscript. This work was supported by the NIH
Fetz, E.E., Chen, D., Murthy, V.N., and Matsumura, M. (2000). Synap-(NS34994, NS43157; MH54671; 1P41RR09754).tic interactions mediating synchrony and oscillations in primatesensorimotor cortex. J. Physiol. (Paris) 94, 323–331.
Received: July 10, 2002Fisahn, A., Pike, F.G., Buhl, E.H., and Paulsen, O. (1998). CholinergicRevised: November 26, 2002induction of network oscillations at 40 Hz in the hippocampus invitro. Nature 394, 186–189.ReferencesFisahn, A., Yamada, M., Duttaroy, A., Gan, J.W., Deng, C.X., McBain,C.J., and Wess, J. (2002). Muscarinic induction of hippocampalAli, A.B., Deuchars, J., Pawelzik, H., and Thomson, A.M. (1998). CA1gamma oscillations requires coupling of the M1 receptor to twopyramidal to basket and bistratified cell EPSPs: dual intracellularmixed cation currents. Neuron 33, 615–624.recordings in rat hippocampal slices. J. Physiol. 507, 201–217.Fisher, N.I. (1993). Statistical Analysis of Circular Data (Cambridge,Bartos, M., Vida, I., Frotscher, M., Meyer, A., Monyer, H., Geiger,UK: Cambrige Univeristy Press).J.R., and Jonas, P. (2002). Fast synaptic inhibition promotes syn-
chronized gamma oscillations in hippocampal interneuron net- Freund, T.F., and Buzsaki, G. (1996). Interneurons of the hippocam-works. Proc. Natl. Acad. Sci. USA 99, 13222–13227. pus. Hippocampus 6, 347–470.
Bracci, E., Vreugdenhil, M., Hack, S.P., and Jefferys, J.G. (1999). On Fries, P., Reynolds, J.H., Rorie, A.E., and Desimone, R. (2001a).the synchronizing mechanisms of tetanically induced hippocampal Modulation of oscillatory neuronal synchronization by selective vi-oscillations. J. Neurosci. 19, 8104–8113. sual attention. Science 291, 1560–1563.
Bragin, A., Jando, G., Nadasdy, Z., Hetke, J., Wise, K., and Buzsaki, Fries, P., Neuenschwander, S., Engel, A.K., Goebel, R., and Singer,G. (1995). Gamma (40–100 Hz) oscillation in the hippocampus of the W. (2001b). Rapid feature selective neuronal synchronizationbehaving rat. J. Neurosci. 15, 47–60. through correlated latency shifting. Nat. Neurosci. 4, 194–200.
Bullock, T.H., and McClune, M.C. (1989). Lateral coherence of the Galarreta, M., and Hestrin, S. (1999). A network of fast-spiking cells inelectrocorticogram: a new measure of brain synchrony. Elec- the neocortex connected by electrical synapses. Nature 402, 72–75.troencephalogr. Clin. Neurophysiol. 73, 479–498. Gray, C.M. (1994). Synchronous oscillations in neuronal systems:Buzsaki, G., Leung, L.W., and Vanderwolf, C.H. (1983). Cellular bases mechanisms and functions. J. Comput. Neurosci. 1–2, 11–38.of hippocampal EEG in the behaving rat. Brain Res. 287, 139–171. Gray, C.M., Konig, P., Engel, A.K., and Singer, W. (1989). OscillatoryBuzsaki, G., Llinas, R., Berthoz, A., and Christen, Y. (1994). Temporal responses in cat visual cortex exhibit inter-columnar synchroniza-Coding in the Brain (Berlin: Springer-Verlag). tion which reflects global stimulus properties. Nature 338, 334–337.
Charpak, S., Pare, D., and Llinas, R. (1995). The entorhinal cortex Gray, C.M., Maldonado, P.E., Wilson, M., and McNaughton, B.entrains fast CA1 hippocampal oscillations in the anaesthetized (1995). Tetrodes markedly improve the reliability and yield of multipleguinea-pig: role of the monosynaptic component of the perforant single- unit isolation from multi-unit recordings in cat striate cortex.path. Eur. J. Neurosci. 7, 1548–1557. J. Neurosci. Methods 63, 43–54.
Chow, C., White, J., Ritt, J., and Kopell, N. (1998). Frequency control Harris, K.D., Henze, D.A., Csicsvari, J., Hirase, H., and Buzsaki,in synchronous networks of inhibitory neurons. J. Comput. Neurosci. G. (2000). Accuracy of tetrode spike separation as determined by5, 407–420. simultaneous intracellular and extracellular measurements. J. Neu-
rophysiol. 84, 401–414.Chrobak, J.J., and Buzsaki, G. (1998). Gamma oscillations in theentorhinal cortex of the freely behaving rat. J. Neurosci. 18, 388–398. Hasselmo, M.E., Wyble, B.P., and Wallenstein, G.V. (1996). Encoding
and retrieval of episodic memories: role of cholinergic and GABAer-Colling, S.B., Stanford, I.M., Traub, R.D., and Jefferys, J.G. (1998).gic modulation in the hippocampus. Hippocampus 6, 693–708.Limbic gamma rhythms. I. Phase-locked oscillations in hippocampal
CA1 and subiculum. J. Neurophysiol. 80, 155–161. Henze, D.A., Borhegyi, Z., Csicsvari, J., Mamiya, A., Harris, K.D., andBuzsaki, G. (2000). Intracellular features predicted by extracellularCsicsvari, J., Hirase, H., Czurko, A., and Buzsaki, G. (1998). Reliabilityrecordings in the hippocampus in vivo. J. Neurophysiol. 84, 390–400.and state dependence of pyramidal cell-interneuron synapses in
the hippocampus: an ensemble approach in the behaving rat. Neu- Hirai, N., Uchida, S., Maehara, T., Okubo, Y., and Shimizu, H. (1999).ron 21, 179–189. Enhanced gamma (30–150 Hz) frequency in the human medial tem-
poral lobe. Neuroscience 90, 1149–1155.Csicsvari, J., Hirase, H., Czurko, A., Mamiya, A., and Buzsaki, G.(1999). Oscillatory coupling of hippocampal pyramidal cells and Hirase, H., Leinekugel, X., Csicsvari, J., Czurko, A., and Buzsaki,
G. (2001). Behavior-dependent states of the hippocampal networkinterneurons in the behaving rat. J. Neurosci. 19, 274–287.affect functional clustering of neurons. J. Neurosci. 21, RC145.Csicsvari, J., Hirase, H., Mamiya, A., and Buzsaki, G. (2000). Ensem-
ble patterns of hippocampal CA3-CA1 neurons during sharp wave- Holsheimer, J. (1987). Electrical conductivity of the hippocampalCA1 layers and application to current-source-density analysis. Exp.associated population events. Neuron 28, 585–594.Brain Res. 67, 402–410.Deans, M.R., Gibson, J.R., Sellitto, C., Connors, B.W., and Paul,
D.L. (2001). Synchronous activity of inhibitory networks in neocortex Hormuzdi, S.G., Pais, I., LeBeau, F.E., Towers, S.K., Rozov, A., Buhl,E.H., Whittington, M.A., and Monyer, H. (2001). Impaired electricalrequires electrical synapses containing connexin36. Neuron 31,
477–485. signaling disrupts gamma frequency oscillations in connexin 36-deficient mice. Neuron 31, 487–495.Eckhorn, R. (1994). Oscillatory and non-oscillatory synchronizations
in the visual cortex and their possible roles in associations of visual Ishizuka, N., Weber, J., and Amaral, D.G. (1990). Organization ofintrahippocampal projections originating from CA3 pyramidal cellsfeatures. Prog. Brain Res. 102, 405–426.in the rat. J. Comp. Neurol. 295, 580–623.Eeckman, F.H., and Freeman, W.J. (1990). Correlations between unit
firing and EEG in the rat olfactory system. Brain Res. 528, 238–244. Jensen, O., and Lisman, J.E. (1996). Theta/gamma networks with
Neuron322
slow NMDA channels learn sequences and encode episodic mem- doublets in oscillating subicular neurons. J. Neurophysiol. 80,162–171.ory: role of NMDA channels in recall. Learn. Mem. 3, 264–278.
Stenkamp, K., Palva, J.M., Uusisaari, M., Schuchmann, S., Schmitz,Kanji, G.K. (1999). 100 Statistical Tests (London: SAGE Publications).D., Heinemann, U., and Kaila, K. (2001). Enhanced temporal stabilityKatsumaru, H., Kosaka, T., Heizmann, C.W., and Hama, K. (1988).of cholinergic hippocampal gamma oscillations following respiratoryGap junctions on GABAergic neurons containing the calcium-bind-alkalosis in vitro. J. Neurophysiol. 85, 2063–2069.ing protein parvalbumin in the rat hippocampus (CA1 region). Exp.Stumpf, C. (1965). Drug action on the electrical activity of the hippo-Brain Res. 72, 363–370.campus. Int. Rev. Neurobiol. 8, 77–138.Kopell, N., Ermentrout, G.B., Whittington, M.A., and Traub, R.D.Szabo, I., Czurko, A., Csicsvari, J., Hirase, H., Leinekugel, X., and(2000). Gamma rhythms and beta rhythms have different synchroni-Buzsaki, G. (2001). The application of printed circuit board technol-zation properties. Proc. Natl. Acad. Sci. USA 97, 1867–1872.ogy for fabrication of multi-channel micro-drives. J. Neurosci. Meth-Leung, S.W. (1979). Potentials evoked by alvear tract in hippocampalods 105, 105–110.CA1 region of rats. II. Spatial field analysis. J. Neurophysiol. 42,Tamamaki, N., and Nojyo, Y. (1993). Projection of the entorhinal1571–1589.layer II neurons in the rat as revealed by intracellular pressure-Leung, L.S. (1982). Nonlinear feedback model of neuronal popula-injection of neurobiotin. Hippocampus 3, 471–480.tions in hippocampal CAl region. J. Neurophysiol. 47, 845–868.Tamas, G., Buhl, E.H., Lorincz, A., and Somogyi, P. (2000). ProximallyLeung, L.W. (1987). Hippocampal electrical activity following localtargeted GABAergic synapses and gap junctions synchronize corti-tetanization. I. After discharges. Brain Res. 419, 173–187.cal interneurons. Nat. Neurosci. 3, 366–371.
Leung, L.S. (1992). Fast (beta) rhythms in the hippocampus: a review.Thomson, D.J. (1982). Spectrum estimation and harmonic analysis.Hippocampus 2, 93–98.Proc. IEEE. 70, 1055–1096.
Leung, L.S. (1998). Generation of theta and gamma rhythms in theTiesinga, P.H., Fellous, J.M., Jose, J.V., and Sejnowski, T.J. (2001).hippocampus. Neurosci. Biobehav. Rev. 22, 275–290.Computational model of carbachol-induced delta, theta, and
Li, X.G., Somogyi, P., Ylinen, A., and Buzsaki, G. (1994). The hippo- gamma oscillations in the hippocampus. Hippocampus 11, 251–274.campal CA3 network: an in vivo intracellular labeling study. J. Comp.
Towers, S.K., LeBeau, F.E., Gloveli, T., Traub, R.D., Whittington,Neurol. 339, 181–208.M.A., and Buhl, E.H. (2002). Fast network oscillations in the rat
Lisman, J. (1998). What makes the brain’s tickers tock. Nature 394, dentate gyrus in vitro. J. Neurophysiol. 87, 1165–1168.132–133.
Traub, R.D., Whittington, M.A., Stanford, I.M., and Jefferys, J.G.Lisman, J.E., and Idiart, M.A. (1995). Storage of 7 �/� 2 short-term (1996). A mechanism for generation of long-range synchronous fastmemories in oscillatory subcycles. Science 267, 1512–1515. oscillations in the cortex. Nature 383, 621–624.Llinas, R., Ribary, U., Contreras, D., and Pedroarena, C. (1998). The Traub, R.D., Jefferys, J.G., and Whittington, M.A. (1997). Simulationneuronal basis for consciousness. Philos. Trans. R. Soc. Lond. B of gamma rhythms in networks of interneurons and pyramidal cells.Biol. Sci. 353, 1841–1849. J. Comput. Neurosci. 4, 141–150.Marshall, L., Henze, D.A., Hirase, H., Leinekugel, X., Dragoi, G., and Traub, R.D., Jefferys, J.G., and Whittington, M.A. (1999). Fast Oscilla-Buzsaki, G. (2002). Hippocampal pyramidal cell-interneuron spike tions in Cortical Circuits (Cambridge, MA: MIT Press).transmission is frequency dependent and responsible for place
Traub, R.D., Bibbig, A., Fisahn, A., LeBeau, F.E., Whittington, M.A.,modulation of interneuron discharge. J. Neurosci. 22, RC197.and Buhl, E.H. (2000). A model of gamma-frequency network oscilla-
Mitra, P.P., and Pesaran, B. (1999). Analysis of dynamic brain im- tions induced in the rat CA3 region by carbachol in vitro. Eur. J.aging data. Biophys. J. 76, 691–708. Neurosci. 12, 4093–4106.Mizumori, S.J., McNaughton, B.L., and Barnes, C.A. (1989). A com- Traub, R.D., Kopell, N., Bibbig, A., Buhl, E.H., LeBeau, F.E., andparison of supramammillary and medial septal influences on hippo- Whittington, M.A. (2001). Gap junctions between interneuron den-campal field potentials and single-unit activity. J. Neurophysiol. 61, drites can enhance synchrony of gamma oscillations in distributed15–31. networks. J. Neurosci. 21, 9478–9486.O’Keefe, J., and Nadel, L. (1978). Hippocampus as a Cognitive Map Varela, F., Lachaux, J.P., Rodriguez, E., and Martinerie, J. (2001).(Oxford: Clarendon). The brainweb: phase synchronization and large-scale integration.Orban, G., Kiss, T., Lengyel, M., and Erdi, P. (2001). Hippocampal Nat. Rev. Neurosci. 2, 229–239.rhythm generation: gamma-related theta-frequency resonance in Wallenstein, G.V., and Hasselmo, M.E. (1997). GABAergic modula-CA3 interneurons. Biol. Cybern. 84, 123–132. tion of hippocampal population activity: sequence learning, placePenttonen, M., Kamondi, A., Acsady, L., and Buzsaki, G. (1998). field development, and the phase precession effect. J. Neurophysiol.Gamma frequency oscillation in the hippocampus of the rat: intracel- 78, 393–408.lular analysis in vivo. Eur. J. Neurosci. 10, 718–728. Wang, X.J., and Buzsaki, G. (1996). Gamma oscillation by synapticRedish, A.D., Battaglia, F.P., Chawla, M.K., Ekstrom, A.D., Gerrard, inhibition in a hippocampal interneuronal network model. J. Neu-J.L., Lipa, P., Rosenzweig, E.S., Worley, P.F., Guzowski, J.F., Mc- rosci. 16, 6402–6413.Naughton, B.L., et al. (2001). Independence of firing correlates of White, J., Chow, C., Ritt, J., Soto-Trevino, C., and Kopell, N. (1998).anatomically proximate hippocampal pyramidal cells. J. Neurosci. Synchronization and oscillatory dynamics in heterogeneous, mutu-21, RC134. ally inhibited neurons. J. Comput. Neurosci. 5, 5–16.Roelfsema, P.R., Engel, A.K., Konig, P., and Singer, W. (1997). Visuo- Whittington, M.A., Traub, R.D., and Jefferys, J.G. (1995). Synchro-motor integration is associated with zero time-lag synchronization nized oscillations in interneuron networks driven by metabotropicamong cortical areas. Nature 385, 157–161. glutamate receptor activation. Nature 373, 612–615.Rolls, E.T. (1996). A theory of hippocampal function in memory. Whittington, M.A., Traub, R.D., Faulkner, H.J., Stanford, I.M., andHippocampus 6, 601–620. Jefferys, J.G. (1997). Recurrent excitatory postsynaptic potentialsSinger, W. (1993). Synchronization of cortical activity and its putative induced by synchronized fast cortical oscillations. Proc. Natl. Acad.role in information processing and learning. Annu. Rev. Physiol. 55, Sci. USA 94, 12198–12203.349–374. Whittington, M.A., Doheny, H.C., Traub, R.D., LeBeau, F.E., andSoltesz, I., and Deschenes, M. (1993). Low- and high-frequency Buhl, E.H. (2001). Differential expression of synaptic and nonsynap-membrane potential oscillations during theta activity in CA1 and tic mechanisms underlying stimulus-induced gamma oscillations inCA3 pyramidal neurons of the rat hippocampus under ketamine- vitro. J. Neurosci. 21, 1727–1738.xylazine anesthesia. J. Neurophysiol. 70, 97–116.
Stanford, I.M., Traub, R.D., and Jefferys, J.G. (1998). Limbic gammarhythms. II. Synaptic and intrinsic mechanisms underlying spike