International Journal of Neural Systems, Vol. 28, No. 10 (2018) 1850031 (20 pages) c World Scientific Publishing Company DOI: 10.1142/S0129065718500314 Neuronal Activation Detection Using Vector Phase Analysis with Dual Threshold Circles: A Functional Near-Infrared Spectroscopy Study Amad Zafar ∗ and Keum-Shik Hong † School of Mechanical Engineering Pusan National University, 2 Busandaehak-ro Geumjeong-gu, Busan 46241, Korea ∗ [email protected]† [email protected]Accepted 21 June 2018 Published Online 25 July 2018 In this paper, a new vector phase diagram differentiating the initial decreasing phase (i.e. initial dip) and the delayed hemodynamic response (HR) phase of oxy-hemoglobin changes (∆HbO) of functional near-infrared spectroscopy (fNIRS) is developed. The vector phase diagram displays the trajectories of ∆HbO and deoxy-hemoglobin changes (∆HbR), as orthogonal components, in the ∆HbO–∆HbR polar coordinates. To determine the occurrence of an initial dip, dual threshold circles (an inner circle from the resting state, an outer circle from the peak values of the initial dip and the main HR) are incorporated into the phase diagram for making decisions. The proposed scheme is then applied to a brain–computer interface scheme, and its performance is evaluated in classifying two finger tapping tasks (right-hand thumb and little finger) from the left motor cortex. Three gamma functions are used to model the initial dip, the main HR, and the undershoot in generating the designed HR function. In classifying two tapping tasks, the signal mean and signal minimum values during 0–2.5 s, as features of initial dip, are used. The linear discriminant analysis was utilized as a classifier. The experimental results show that the active brain locations of the two tasks were quite distinctive (p< 0.05), and moreover, spatially specific if using the initial dip map at 4 s in comparison to the map of HRs at 14 s. Also, the average classification accuracy was improved from 59% to 74.9% when using the phase diagram of dual threshold circles. Keywords : Functional near-infrared spectroscopy (fNIRS); initial dip; brain–computer interface (BCI); motor cortex; vector phase analysis; neuronal firing; designed hemodynamic response function. 1. Introduction To reduce erroneous detections of initial dips appear- ing in functional near-infrared spectroscopy (fNIRS) signals, this paper presents a systematic method using two threshold circles in the vector phase diagram. fNIRS is a noninvasive imaging method that uses near-infrared light within the 650–1000nm range to measure the variations of regional cere- bral blood flows (rCBFs) in the brain. 1,2 The two infrared light-absorbing chromophores in the blood are oxy-hemoglobin (HbO) and deoxy-hemoglobin (HbR). 3 Upon neuronal activities, 4 the concentra- tion level of HbO/HbR in the capillaries and venules accompanied by dilation of pial arteries and arteri- oles increases/decreases, which is called the hemody- namic response (HR) that reflects the introduction of more oxygen to the brain. 5,6 In contrast to the HR, however, the initial dip denotes the consumption of oxygen at the time of neuronal activities, which reflects the early decreasing phenomenon of HbO. 7 Recently, the improvement of temporal resolution of fNIRS through the early detection of initial dip † Corresponding author. 1850031-1
Accepted 21 June 2018Published Online 25 July 2018
In this paper, a new vector phase diagram differentiating the initial decreasing phase (i.e. initial dip)and the delayed hemodynamic response (HR) phase of oxy-hemoglobin changes (∆HbO) of functionalnear-infrared spectroscopy (fNIRS) is developed. The vector phase diagram displays the trajectories of∆HbO and deoxy-hemoglobin changes (∆HbR), as orthogonal components, in the ∆HbO–∆HbR polarcoordinates. To determine the occurrence of an initial dip, dual threshold circles (an inner circle from theresting state, an outer circle from the peak values of the initial dip and the main HR) are incorporatedinto the phase diagram for making decisions. The proposed scheme is then applied to a brain–computerinterface scheme, and its performance is evaluated in classifying two finger tapping tasks (right-handthumb and little finger) from the left motor cortex. Three gamma functions are used to model the initialdip, the main HR, and the undershoot in generating the designed HR function. In classifying two tappingtasks, the signal mean and signal minimum values during 0–2.5 s, as features of initial dip, are used. Thelinear discriminant analysis was utilized as a classifier. The experimental results show that the activebrain locations of the two tasks were quite distinctive (p < 0.05), and moreover, spatially specific ifusing the initial dip map at 4 s in comparison to the map of HRs at 14 s. Also, the average classificationaccuracy was improved from 59% to 74.9% when using the phase diagram of dual threshold circles.
To reduce erroneous detections of initial dips appear-ing in functional near-infrared spectroscopy (fNIRS)signals, this paper presents a systematic methodusing two threshold circles in the vector phasediagram. fNIRS is a noninvasive imaging methodthat uses near-infrared light within the 650–1000nmrange to measure the variations of regional cere-bral blood flows (rCBFs) in the brain.1,2 The twoinfrared light-absorbing chromophores in the bloodare oxy-hemoglobin (HbO) and deoxy-hemoglobin
(HbR).3 Upon neuronal activities,4 the concentra-tion level of HbO/HbR in the capillaries and venulesaccompanied by dilation of pial arteries and arteri-oles increases/decreases, which is called the hemody-namic response (HR) that reflects the introductionof more oxygen to the brain.5,6 In contrast to theHR, however, the initial dip denotes the consumptionof oxygen at the time of neuronal activities, whichreflects the early decreasing phenomenon of HbO.7
Recently, the improvement of temporal resolutionof fNIRS through the early detection of initial dip
using vector phase analysis was reported.8 The vec-tor phase analysis is a polar coordinate plane methoddefined by oxy-hemoglobin changes (∆HbO) anddeoxy-hemoglobin changes (∆HbR) as orthogonalvector components. Two other vector components,cerebral oxygen exchange (i.e. ∆COE = (1/
√2)
(∆HbR − ∆HbO)) and cerebral blood volume (i.e.∆CBV = (1/
√2)(∆HbO + ∆HbR)), can be defined
to analyze the cerebral oxygenation and hemoglobinchanges reflecting the neural activity at the sametime.9 Furthermore, to enhance the spatial resolutionof fNIRS, the use of bundled-optode configurationwas recently proposed.10,11 Therefore, fNIRS has agreat potential to be used as a viable neuroimagingtool, and its important applications include behav-ioral and cognitive neurodevelopment,12 perceptionand cognition,13 psychiatric conditions,14 experi-mental psychology for language studies,15 stroke andbrain injury,16 clinical and bedside imaging,17 andbrain–computer interfaces (BCIs).18–22
Hemodynamic signals (∆HbO and ∆HbR) con-sist of the following three parts: (i) initial dip, (ii)main HR, and (iii) undershoot period.23,24 Figure 1
Fig. 1. Schematic of a typical HR including the initialdip generated by three gamma functions assuming a 10 stask: t0, t1, and t2 are the times to the peaks of initialdip, main HR, and undershoot; p0, p1, and p2 are theirpeak values, and w0, w1, and w2 are the durations forhalf peak values, respectively.
shows the schematic of a typical normalized HR (i.e.generated by three gamma functions25 assuming a10 s task) depicting the initial dip, the main positiveHR period, and the undershoot period. To examinethe relative magnitudes of these responses, the peakvalues of initial dips and the main HRs from threebrain cortices (prefrontal, motor, and visual) werecompared in Ref. 26.
In the HR-based brain imaging, the detection ofa neuronal activation in a particular brain regionentails the determination of a specific time-seriesshape from the recorded hemodynamic signals.27,28
In fNIRS, the existence of such a waveform is deter-mined by the t-statistics analysis of the measureddata to the time-series profile known as the canoni-cal HR function (cHRF).29 In such statistical anal-yses, the cHRF plays a key role, as its shape mayvary among subjects, trials, and brain regions.30 Themost frequently utilized model of cHRF is the dif-ference between two gamma functions that charac-terize the overall positive shape and the secondaryundershoot in time series.31,32 Then, the cHRF isfurther convolved with an experimental paradigm togenerate the designed HR function (dHRF).33,34 ThedHRF is then fitted to measured HRs to find outthe active channels (i.e. a brain region) showing highcorrelation to the dHRF. Then, a functional map canbe drawn to depict a cortical brain region.35,36 How-ever, a key drawback in using two gamma functionsin the estimation of dHRF is that it cannot accountfor the characteristics of the initial dip. To the bestof our knowledge, no study has used a dHRF schemeincluding the initial dip for BCI purposes. Although,NIRS-SPM and functional optical signal analysis(fOSA) toolboxes provide three gamma functions asan option, it allows to incorporate the dynamics ofthe initial dip.36,37
The first focus in this paper is to develop a rig-orous method in detecting the initial dip systemat-ically, as it appears earlier in time than the con-ventional HR. Moreover, initial dips are spatiallymore specific to the neuron firing regions.38,39 Katoet al.40–43 carried out the first study in measur-ing the initial dips appearing in fNIRS signals fromthe motor, visual, and language areas. Later on,Jasdzewski et al.24 further confirmed the presenceof initial dips in fNIRS signals measured from themotor and visual cortices. They found that the HRwas delayed by 2 s, which entails that the peak of
1850031-2
October 22, 2018 14:30 1850031
Neuronal Activation Detection Using Vector Phase Analysis
the initial dip exists within 2 s. They also observedthat different parts in the brain behave differentlyin relation to the occurrence of initial dips. Kato7
showed that NIRS has a high sensitivity to oxygenexchanges in capillaries. On that basis, he demon-strated that NIRS has the ability to measure theneural-response-related fast-oxygen response in cap-illaries, which was named the fast-oxygen responsein capillary event (FORCE) rather than initial dip.Akiyama et al.44 also found, within 1 s to 3 s ofmotor task initiation, distinctive biphasic responsesin terms of cortical oxygenation (i.e. HbO) in the cen-ter of the primary motor cortex. Similarly, anotherstudy of Wylie et al.45 examined the spatiotempo-ral co-variations among ∆HbO, ∆HbR, and totalhemoglobin (∆HbT ≈ ∆CBV) in the visual cor-tex for their contrast-reversing checkerboard exper-imental paradigm. They observed a decrease or anincrease in ∆HbO/∆HbR at the start of the activitywhich also demonstrates the consumption of oxygenat the time of neuronal activity (initial dip) prior tothe main HR.
The first detection of an initial dip in fNIRSsignals using a vector phase analysis method hasbeen done by Yoshino and Kato.46 A problem intheir vector-based phase analysis is that an unre-lated large fluctuation might be interpreted as aninitial dip. Also, the detection time of an initialdip was not specified in the diagram. Hong andNaseer8 improved the vector phase diagram46 byintegrating a threshold circle having the radius ofmax(∆HbO2 + ∆HbR2)1/2 during the resting state.This circle has been used as a decision criterionfor the occurrence of an initial dip. They also pro-posed to use an auto-regressive moving averagemodel with exogenous input in combination withthe vector phase analysis method to predict, q-stepsahead, the occurrence of initial dips and, thereby,reduce the time lag in detecting an initial dip toabout 0.9 s. Recently, Zafar and Hong26 have appliedthe initial dip detection method, by changing thethreshold circle from max(∆HbO2 + ∆HbR2)1/2 tomax{∆HbO,∆HbR}, to the classification problemof three mental tasks originated from the prefrontalcortex for BCI. They demonstrated that the mov-ing window size in fNIRS-based BCI can be reducedto 2.5 s if using the proposed initial dip detectionmethod (the previously suggested window durationwas 5 s,18 that is, from 2 s to 7 s from the onset time
of a task). However, there still remains a possibil-ity that any large ∆HbO/∆HbR fluctuation greaterthan the threshold circle can be falsely interpretedas the occurrence of an initial dip.
In the present study, two disjoint regions (i.e. theinitial dip region and the HR region) in the phasediagram, see Fig. 2, are separately defined as deci-sion criteria to reduce possible false claims of ini-tial dips in BCI applications (see Sec. 2). The useof a secondary threshold circle in addition to theprimary threshold circle from the resting state isproposed. Furthermore, three gamma functions25 areincorporated to generate a cHRF including the ini-tial dip, the main HR, and the undershoot period tofind active channels and to draw the activation mapfor online BCI applications. Outlining the obtainedresults in this work briefly, first an average increaseof 15.9% in classification accuracy was observed byusing the proposed criteria in comparison to the caseof one threshold circle in the phase diagram. Sec-ond, the activation map drawn near the end of theinitial dip period (i.e. at 4 s) demonstrates that thelocations of the activated areas from two finger tap-ping tasks (i.e. right-hand thumb finger and right-hand litter finger) were more clearly distinguishablethan that obtained by using the conventional HRs(at 14 s).
Three research issues in the BCI field are (i) howto enhance the classification accuracy; (ii) how to
Fig. 2. Vector phase diagram with dual threshold cir-cles indicating the initial dip phase and the HR phase,respectively.
1850031-3
October 22, 2018 14:30 1850031
A. Zafar & K.-S. Hong
increase the number of brain commands for improv-ing the degrees of freedom of an external device,and (iii) how to quickly decode the brain commandsby reducing the delay. In this paper, two issues areaddressed: First, the initial dip detection will reducethe detection time. Second, since the initial dip isspatially specific to regional neuron firing, the gen-eration of brain commands from a restricted brainregion will become diverse, which consequentiallyresults in an increased number of commands froma wider brain region. To demonstrate the secondissue, a densely configured arrangement of optodesis applied to the left motor cortex, and a distinctivedetection of two fingers (thumb, little fingers) hasbeen experimented.
2. Methods
2.1. Phase diagram with dual thresholdcircles
The vector phase analysis is a systematic method uti-lizing the coordinates defined by the pair of ∆HbOand ∆HbR (or ∆CBV and ∆COE) for detectionof initial dips and HRs.46 The vector components∆CBV and ∆COE are obtained by rotating thevector coordinate system defined by ∆HbO and∆HbR by 45◦ counterclockwise using the followingequations47:
∆CBV =1√2(∆HbO + ∆HbR), (1)
∆COE =1√2(∆HbR − ∆HbO). (2)
The magnitude and phase of a vector, p =(∆HbO,∆HbR), in this plane can be calculated as
|p| =√
∆HbO2 + ∆HbR2, (3)
∠p = tan−1
(∆HbR∆HbO
)
= tan−1
(∆COE∆CBV
)+ 45◦. (4)
The ratio of ∆COE to ∆CBV (i.e. ∆COE/∆CBV)defines the degree of oxygen exchange. Therefore,∆COE represents the oxygen exchange in the bloodvessels and thus also the neuronal activities.48
∆COE > 0 representing deoxygenation in the cap-illaries as a result of oxygen consumption by thenerve cells. On the other hand, ∆COE < 0 indi-cates that the oxygen-containing red blood cells arebeing supplied by the arteries and, thus, a high levelof oxygenation in the blood vessels. The phase dia-gram is divided into eight phases/regions accord-ing to four components (∆HbO,∆HbR,∆CBV, and∆COE). Table 1 summarizes the decomposition ofthe phase plane into eight phases/regions and theirinterpretations. Phases 1 to 5 in Table 1 are consid-ered as initial dip phase as they are reflecting deoxy-genation (i.e. an increase in either ∆HbR or ∆COE).Therefore, an event-related vector residing in theseregions are defined as an initial dip.46 In Phases 1and 2, both ∆CBV and ∆HbR are increasing, whichare named as the canonical dip.46,49 Phases 3 to 5 arethe hypoxic dips with a decrease in ∆HbO togetherwith increase/decrease in ∆CBV. These Phases (3to 5) indicate the hypoxic change in blood vessels,thus representing deoxygenation in capillaries.46–48
In Phases 6 to 8, both ∆HbR and ∆COE are decreas-ing, therefore they are named as nondip phases.
The inner threshold circle in Fig. 2 (red solid cir-cle) is to detect the time instance of the occurrenceof an initial dip (in Phases 3–5) and the start of theHR (in Phases 7, 8) from the resting state. If there is
Neuronal Activation Detection Using Vector Phase Analysis
no threshold circle, a resting state fluctuation with∆COE > 0 can easily be interpreted as an initialdip. The radius of the first threshold circle is definedas follows:
r1 = max(∆HbO2resting + ∆HbR2
resting)1/2, (5)
which is the maximum value during the resting state.However, there still remains a possibility that largefluctuations of ∆HbO and ∆HbR above the thresh-old circle during the task period can be interpreted asan initial dip. For this reason, based on our previousdata,26 the use of a secondary threshold circle (i.e. anouter circle as a bound for eliminating those ∆HbOfluctuations departing the region surrounded by theinner and outer circles in Phases 3–5) is proposed. Todetermine the radius of the outer circle, an empiricalapproach is used. In the experimental data of Zafarand Hong,26 it was found that the ratio of the ampli-tude of initial dip (p0) and that of the conventionalHR amplitude (p1) was about 0.3, see Fig. 1. Simi-lar results were also reported in the previous stud-ies of optical imaging spectroscopy and fMRI.49–53
Therefore, once an experiment starts, the p1 valueand its standard deviation (SD) through the aver-aging over several trials from the most active chan-nel in the training stage is determined, in which themost active channel means the channel that showsthe largest difference between the maximum ∆HbOvalues during the resting state and the averaged HRduring the training stage. Now, the second thresholdcircle is defined as follows:
r2 = max(∆HbO2resting + ∆HbR2
resting)1/2
+ 0.3(p1 + SD). (6)
The main reason for selecting p1 in (6) for the sec-ondary threshold circle is to make it independentfrom the occurrence of initial dip. In contrast, ifwe select |p0| (or |p0| + SD) instead of 0.3p1 (or0.3(p1 + SD)), there exists a possibility that |p0| canbecome zero due to averaging. If |p0| becomes zero,the radius of the secondary circle will be r1 or r1+SD,which will result in overlapping (or too close) of theouter circle with the inner circle. Then, the role ofthe second circle is diminished by leading to a badconclusion that a genuine initial dip is regarded as afalse dip.
In the relevant previous research,46–48 it wasobserved that most of the initial dips were of thehypoxic type (i.e. decreased ∆HbO). In the present
analysis, Phases 3–5 represent the hypoxic dip phasein which ∆COE > 0. The hypoxic initial dip region isthen defined as the region between the two thresholdcircles in Phases 3–5, see Fig. 2. Similarly, the regionouter the first threshold circle in Phases 7 and 8 isdefined as the HR region. Therefore, the proposedcriteria for detection of hypoxic initial dips are thefollowing:
(i) the vector must lie in any of Phases 3–5, and(ii) the trajectory should remain within the two
threshold circles (i.e. the initial dip region). Any tra-jectory outside the initial dip region in Phases 3–5is concluded as a false dip or noise. Also, if the tra-jectory remains in Phases 3–5 within first 2 s to 4 speriod and it moves to either Phase 7 or 8, after 2 s to4 s, having a magnitude greater than the circle drawnby the resting state hemodynamics (the first thresh-old circle), the trajectory is considered as a correctHR upon the given trial including the initial dip.
2.2. BCI framework utilizing initial dipdetection
Figure 3 illustrates the proposed BCI frameworkincorporating the initial dip detection scheme dis-cussed in Sec. 2.1. The main difference from theconventional scheme that uses the HRs is that eventhough the initial dip detection procedure fails, theconventional scheme still backs up. It is importantto have a fail-tolerant loop in feature selection andclassification for online control command generation.The existing fNIRS-based BCI framework uses onlythe HR features for classification, in which a typ-ical window of 10 s from the stimulation onset isused to extract features. The commonly used HR fea-tures include the signal mean, signal peak, and signalslope during the 2–7 s duration, see details in Ref. 18.Though there are a few studies that have used theskewness, kurtosis, variance, SD, number of peaks,sum of peaks, and median for fNIRS-BCI, the use ofinitial dip does not exist yet. In the case of initialdip, the features should be extracted from the win-dow of 0–2 s or 0–2.5 s. In this case, the previouslymentioned features of HR may not work properlyin a reduced window. The authors’ previous work26
examined five features of ∆HbO during the initialdip phase: Signal mean, signal minimum, signal peak,skewness, and kurtosis to classify multiple tasks fromthe prefrontal cortex in an offline analysis. The studyfound that the signal mean and the signal minimum
1850031-5
October 22, 2018 14:30 1850031
A. Zafar & K.-S. Hong
(a) Training scheme
(b) Online scheme
Fig. 3. BCI framework using the vector phase diagram with dual threshold circles.
worked well with the 0–2.5 s window. Two other stud-ies54,55 have also investigated the early temporal fea-tures (signal minimum or signal mean) to utilize theinitial dips in their early classification of multiplebrain tasks. In this study, signal mean and signalminimum are used as features in the 0–2.5 s window,and the linear discriminant analysis (LDA) is usedas a classifier.
2.3. Subjects
Eleven male subjects (age: mean 28.5 ± 2.5 years,hair style: shaved or very short hair) participated inthe experiment. All were healthy and had normal or
corrected-to-normal vision, and none had a historyof any neurological or visual disorder. All were givena detailed description on the experimental procedureprior to the experiment, and informed consents wereobtained from all. The experiment was conducted inaccordance with the latest Declaration of Helsinki56
upon the approval of the Pusan National UniversityInstitutional Review Board.
2.4. Channel configuration and signalprocessing
The brain signals generated by the tapping of twofingers (thumb, little fingers) were acquired at a
1850031-6
October 22, 2018 14:30 1850031
Neuronal Activation Detection Using Vector Phase Analysis
Fig. 4. Schematic of densely configured emitter–detector pairs in the left motor cortex.
sampling rate of 9.19Hz from the left motor cortexusing the frequency domain fNIRS system (ISS Ima-gent, ISS Inc.). The system utilizes the near-infraredlight of two wavelengths (690 nm and 830nm). In thepresent study, 3 detectors and 12 emitters were usedin a dense emitter–detector configuration to exam-ine the C3 area of the left motor cortex. The denselyconfigured emitter–detector pairs helped to analyzethe data of multi-distance channels obtained at var-ious cortical depths resulting in an improved spatialresolution.11 The electrode placement and the cor-responding emitter-detector distances are shown inFig. 4. In accordance with the International 10–20System, the detectors were positioned by consideringC3 as the reference point. Thirty-six channels wereconfigured using emitter–detector combinations. ISSImagent data acquisition and analysis software (ISS-Boxy) were used to obtain the raw intensity data.The intensity data were then converted to ∆HbOand ∆HbR with the ISS-Boxy software, with extinc-tion coefficients εHbO = 0.95 mM−1cm−1, εHbR =4.93 mM−1cm−1 for 690nm wavelength and εHbO =2.135 mM−1cm−1, εHbR = 1.791 mM−1cm−1 for830nm wavelength, according to the modified Beer–Lambert law.57 The raw data (∆HbO & ∆HbR)were pre-processed to remove the physiological noisesrelated to the respiration, cardiac and low-frequencydrift signals: A fourth-order Butterworth low- andhigh-pass filter with a cutoff frequency of 0.15Hzand 0.01Hz, respectively, was used to filter the respi-ration, cardiac, and low frequency drift fluctuationsfrom the fNIRS signals.54,58,59
2.5. Experimental paradigm
Thumb and little finger tapping tasks associated withthe left motor cortex were investigated. The sub-jects were seated on a comfortable chair and wereinstructed to avoid a body movement as much aspossible during the experiment. The experiment wasconducted in a dark and quite room. Figure 5 showsthe experimental paradigm used in this study. Oneexperiment consists of two sessions of tasks (thumbtapping, little finger tapping) with pre- and post-rest periods of 60 s and 10 s, respectively. Each ses-sion is composed of six 30 s trials. Each trial has a10 s activity task followed by a 20 s rest. During thetask period, the subjects were instructed to tap their(right) thumb/little fingers as fast as they could,without paying attention to the number of taps. Acomputer screen indicating individual finger tappingwas displayed on a monitor placed in front of the
Fig. 5. Experimental paradigm for thumb and little fin-ger tapping tasks.
1850031-7
October 22, 2018 14:30 1850031
A. Zafar & K.-S. Hong
subject. During the rest period, a black screen wasshown. The subjects also were instructed to keeptheir eyes open during the experiment.
2.6. Initial-dip-based dHRF and t-mapgeneration
In the fNIRS data analysis, the estimation of corticalactivation and its localization are the most importantsteps. Cortical activation can be estimated by fittingthe measured HR to the predefined dHRF,60–62 andits existence can be concluded according to the t-values of the associated channels. In this paper, thet-values were computed using the robustfit functionavailable in MATLABTM. Let xq
p ∈ RM×1 be themeasured data at the pth channel for the qth trial,and M be the number of data per trial. Then, thelinear regression model is defined as follows34:
xqp = φq
pHr + ψqp · 1 + εq
p, (7)
where Hr ∈ RM×1 is the dHRF, 1 ∈ RM×1 is a col-umn vector of 1’s to correct the offset of the baseline,φ is the unknown coefficient indicating the activitystrength of the dHRF, ψ is the coefficient to compen-sate the baseline drift of the signal, and ε ∈ RM×1
denotes the white Gaussian noise. Then, the coeffi-cient φ is estimated as follows:
[φ̂qp, stats] = robustfit(Hr, x
qp), (8)
where φ̂qp denotes the estimate of φq
p and stats refersto the statistical data including t-value, p-value,standard error, etc. The basic idea is to test the nullhypothesis that the estimated parameter (φ̂q
p) of thebrain activity is equal to zero or not. In other words,to test whether the estimated value (φ̂q
p) of the brainactivity is greater or less than the critical t-value(tcrt) with statistical significance. The t-value63 iscalculated as follows:
t− value =φ̂q
p
SE(φ̂qp), (9)
where SE stands for the standard error. A higher t-value means that the signal is highly correlated withthe dHRF. In this study, tcrt was set to 1.65 accord-ing to the degrees of freedom (i.e. trial = 30 s, thenumber of data points M = 30×9.19 = 275,M−1 =274).
In this study, the dHRF was generated by con-volving the cHRF, denoted by h(k), with a stimulus
period, u(k), as follows:
dHRF(k) =k−1∑n=0
h(n)u(k − n), (10)
u(k) =
{1, if k ∈ task,
0, if k ∈ rest,(11)
where task and rest represent the task period andthe rest period, respectively (task = 10 s and rest =20 s in this study). The cHRF was generated as alinear combination of three gamma functions by theequation25
h(k) =3∑
i=1
Aikαi−1βαi
i e−βik
Γ(αi), (12)
where i represents the number of gamma functions,Ai is the amplitude, αi and βi tune the shape andthe scale, respectively, and k is the time step. In thisstudy, nine parameters of the cHRF were assumedas free parameters instead of using fixed parameters.For each subject, these free parameters were esti-mated in order to make the best fit of the dHRFshape to the HR data of the subject. The reason forusing the estimated parameters instead of some fixedparameters is that the fNIRS signals vary from sub-ject to subject due to their individual differences.64
The cHRF parameters were estimated using amodified constrained Nelder–Mead simplex algo-rithm that allows the use of constraints specified asparameter bounds.65,66 The advantage of using thisalgorithm is that it minimizes the function withoutany derivative information.67 We have used the fmin-searchbnd function for parameters estimation.68 Theobjective function was formulated as follows:
J =N∑
k=1
{yjHbO(k) − dHRF(k)}2, (13)
where j represents the channel number. The abovecost function was then minimized by applying theconstraints and using the initial values as follows25:
min J(A1, A2, A3, α1, α2, α3, β1, β2, β3) such that
−5 ≤ A1 ≤ 0, 0 ≤ A2 ≤ 15, −10 ≤ A3 ≤ 0,
0 ≤ α1 ≤ 3, 2 ≤ α2 ≤ 10, 6 ≤ α3 ≤ 25,
0.5 ≤ β1 ≤ 2, 0.5 ≤ β2 ≤ 2, 0 ≤ β3 ≤ 1.5,
(14)
A1 = −0.5, A2 = 6, A3 = −1,
α1 = 1.5, α2 = 7, α3 = 16,
β1 = 1, β2 = 1, β3 = 1.
(15)
1850031-8
October 22, 2018 14:30 1850031
Neuronal Activation Detection Using Vector Phase Analysis
One possible way to select the initial values of freeparameters, for finding the solution of (13), is tochoose the parameter values used to generate thefixed optimal dHRF.36,63 However, we have used theinitial values described in (15), because the conver-gence of the algorithm to the solution with these val-ues was already verified in the literature.25
Several previous studies69,70 have pointed outthat HbO is more sensitive and more reliable thanHbR. Therefore, we used only HbO signals for furtheranalysis. To locate the active regions based on thumband little finger tapping, the t-value for each chan-nel was calculated for the averaged HbO trial. Sim-ilarly, the used dHRF was the averaged one over allsubjects. The averaging was performed over all sub-jects and trials. The criteria for concluding active-ness were: (i) t-value > tcrt and (ii) p-value < 0.05.If the t-value < tcrt or p-value > 0.05, the t-valuewas set to zero. The obtained t-values were normal-ized within the 0–1 range and were displayed on at-map in order to illustrate an activation in the cov-ered brain region. The active regions (the region ofinterest, ROI) were then defined as a region consist-ing of those channels whose t-values were higher thanthe tcrt for the performed task. To further confirmthat the oxygen consumption was also increased dur-ing the initial dip phase, the t-maps for COEs werealso drawn by computing the t-values between themeasured ∆COE with the negative of dHRF (i.e.−dHRF). In this study, the t-values were computedfor two time intervals: 0–4 s and 0–14 s, respectively,to compare the activation map of the initial dip phaseand that of the conventional HR. The reason for dis-playing t-maps for two different time durations is toverify that the t-map obtained at 4 s is spatially morespecific than the t-map obtained at 14 s.
2.7. Features extraction andclassification
We have compared the classification accuracies intwo cases: (i) Using the vector phase analysis and (ii)using dHRFs. In case (i), in both single- and dual-threshold circle cases, the channels in which initialdips were detected were averaged for each given task.The mean and the minimum value of the averagedsignal during the 0–2.5 s period were obtained foreach task, in which the mean and min functions fromMATLABTM were used. It is noted that, in case (i),
the activated channels were obtained from the vec-tor phase analysis and dHRF was not used. In case(ii), the feature extraction is upon the fact that thethree-gamma-function based dHRF has been opti-mized in the training period by using active chan-nels (involving an initial dip), which were found bythe dual threshold scheme. The active channels incase (ii) are found through the t-test (t-value > tcritand the p-value < 0.05) between the best-fit dHRFand the measured HR during 0–2.5 s. To comparethe classification performance between the best-fit-initial-dip-based dHRF and the two-gamma-functionbased dHRF, the mean and the minimum value dur-ing the 0–2.5 s period were obtained for each task.In both cases (i) and (ii), the extracted featureswere then rescaled between 0 and 1 by the follow-ing equation71:
f ′ =f − min(f)
max(f) − min(f), (16)
where f ∈ Rn represents the original value of the fea-ture, f ′ is the rescaled value between 0 and 1, max(f)is the maximum value, and min(f) is the minimumvalue. The rescaled features were then classified usingthe LDA.72,73 To determine the classification accu-racies, six runs of six-fold cross-validation were used.Six-fold cross-validation randomly breaks the datainto six equal sets and uses five sets for trainingand one set for testing. The process was repeatedsix times, and the mean accuracy was obtained.74–76
3. Results
Figure 6 shows the vector phase analysis of thethumb and little finger tapping of Sub. 1 (Ch. 18)for all six trials using the proposed initial dip andHR regions. It can be seen that at the start of bothtasks, the trajectory moves to the initial dip regionand then goes to the HR region. The initial dip wasnot detected in Trials 5 and 6 of the thumb tap-ping and in Trial 5 of the little finger tapping tasks.But, it can be seen that their trajectories also crossthe inner circle in Phase 8 indicating that they arestill correct, which demonstrate the use of the regu-lar HRs. Figure 7 shows some examples of the tra-jectories of false and no initial dips (Sub. 1, thumbtapping): Without the outer circle, initial dips wouldhave been falsely identified. It is also observed that,in Ch. 7, see Fig. 7(a), the trajectory initially movedtoward the HR region, but later moved back to the
1850031-9
October 22, 2018 14:30 1850031
A. Zafar & K.-S. Hong
Fig. 6. (Color online) Trajectories of thumb and littlefinger tappings for a 10 s duration (Sub. 1, Ch. 18).
initial dip region causing a false signal. This kindof fluctuation might be due to artifacts (head move-ment, etc.); therefore, it would have been classifiedas an incorrect trial, but it was a correct trial with alarge undershoot. On the other hand, these false dipswould have been considered as initial dips accordingto the single threshold circle criterion. The channelsin which initial dips and false dips were detected forthe thumb tapping task of all the subjects are col-lected in Table 2.
(a) False dip (the trajectory touches (Ch. 1, upper panel)and crosses the outer circle (Ch. 7, lower panel))
(b) No initial dip
Fig. 7. Examples of false and no initial dips.
Table 2. Comparison of thumb tapping analyses (singleversus dual threshold circles).
Dual threshold circlesSingle
Correct False thresholdSubject channels channels circle
Neuronal Activation Detection Using Vector Phase Analysis
(a) Thumb tapping
(b) Little finger tapping
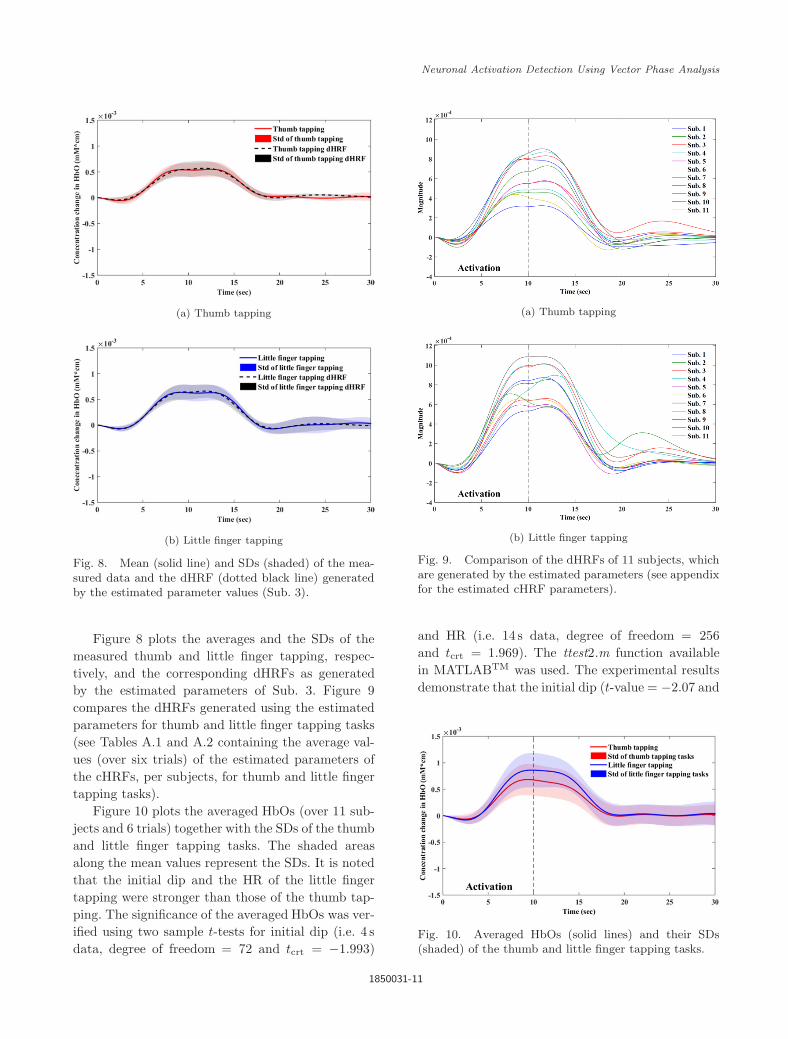
Fig. 8. Mean (solid line) and SDs (shaded) of the mea-sured data and the dHRF (dotted black line) generatedby the estimated parameter values (Sub. 3).
Figure 8 plots the averages and the SDs of themeasured thumb and little finger tapping, respec-tively, and the corresponding dHRFs as generatedby the estimated parameters of Sub. 3. Figure 9compares the dHRFs generated using the estimatedparameters for thumb and little finger tapping tasks(see Tables A.1 and A.2 containing the average val-ues (over six trials) of the estimated parameters ofthe cHRFs, per subjects, for thumb and little fingertapping tasks).
Figure 10 plots the averaged HbOs (over 11 sub-jects and 6 trials) together with the SDs of the thumband little finger tapping tasks. The shaded areasalong the mean values represent the SDs. It is notedthat the initial dip and the HR of the little fingertapping were stronger than those of the thumb tap-ping. The significance of the averaged HbOs was ver-ified using two sample t-tests for initial dip (i.e. 4 sdata, degree of freedom = 72 and tcrt = −1.993)
(a) Thumb tapping
(b) Little finger tapping
Fig. 9. Comparison of the dHRFs of 11 subjects, whichare generated by the estimated parameters (see appendixfor the estimated cHRF parameters).
and HR (i.e. 14 s data, degree of freedom = 256and tcrt = 1.969). The ttest2.m function availablein MATLABTM was used. The experimental resultsdemonstrate that the initial dip (t-value = −2.07 and
Fig. 10. Averaged HbOs (solid lines) and their SDs(shaded) of the thumb and little finger tapping tasks.
1850031-11
October 22, 2018 14:30 1850031
A. Zafar & K.-S. Hong
416, 8
28, 20, 1232, 24
36
315, 7
27, 19, 1131, 23
35
214, 6
26, 18, 1030, 22
34
113, 5
25, 17, 929, 21
33
(a) Channels numbers denote the mid-points of individual emitter-detector distance.
(b) Thumb ∆HbOat 4 s
(c) Thumb ∆COEat 4 s
(e) Thumb ∆COEat 14 s
(d) Thumb ∆HbOat 14 s
(f) Little finger ∆HbOat 4 s
(g) Little finger ∆COEat 4 s
(i) Little finger ∆COEat 14 s
(h) Little finger ∆HbOat 14 s
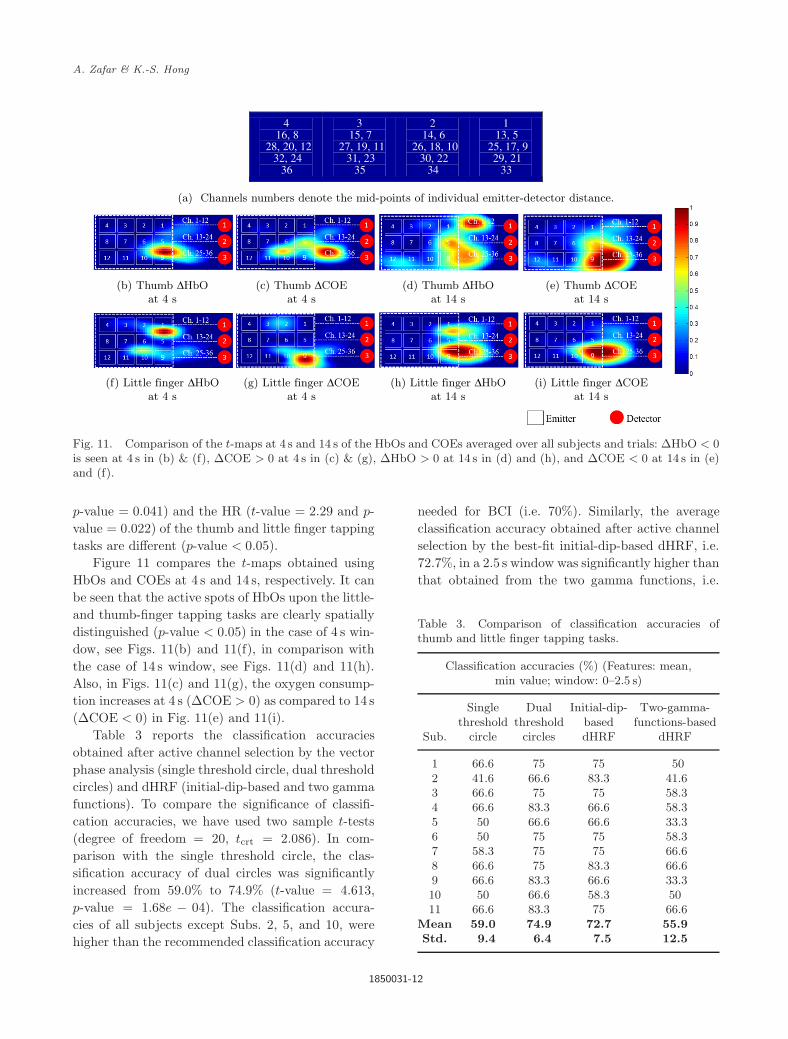
Fig. 11. Comparison of the t-maps at 4 s and 14 s of the HbOs and COEs averaged over all subjects and trials: ∆HbO < 0is seen at 4 s in (b) & (f), ∆COE > 0 at 4 s in (c) & (g), ∆HbO > 0 at 14 s in (d) and (h), and ∆COE < 0 at 14 s in (e)and (f).
p-value = 0.041) and the HR (t-value = 2.29 and p-value = 0.022) of the thumb and little finger tappingtasks are different (p-value < 0.05).
Figure 11 compares the t-maps obtained usingHbOs and COEs at 4 s and 14 s, respectively. It canbe seen that the active spots of HbOs upon the little-and thumb-finger tapping tasks are clearly spatiallydistinguished (p-value < 0.05) in the case of 4 s win-dow, see Figs. 11(b) and 11(f), in comparison withthe case of 14 s window, see Figs. 11(d) and 11(h).Also, in Figs. 11(c) and 11(g), the oxygen consump-tion increases at 4 s (∆COE > 0) as compared to 14 s(∆COE < 0) in Fig. 11(e) and 11(i).
Table 3 reports the classification accuraciesobtained after active channel selection by the vectorphase analysis (single threshold circle, dual thresholdcircles) and dHRF (initial-dip-based and two gammafunctions). To compare the significance of classifi-cation accuracies, we have used two sample t-tests(degree of freedom = 20, tcrt = 2.086). In com-parison with the single threshold circle, the clas-sification accuracy of dual circles was significantlyincreased from 59.0% to 74.9% (t-value = 4.613,p-value = 1.68e − 04). The classification accura-cies of all subjects except Subs. 2, 5, and 10, werehigher than the recommended classification accuracy
needed for BCI (i.e. 70%). Similarly, the averageclassification accuracy obtained after active channelselection by the best-fit initial-dip-based dHRF, i.e.72.7%, in a 2.5 s window was significantly higher thanthat obtained from the two gamma functions, i.e.
Table 3. Comparison of classification accuracies ofthumb and little finger tapping tasks.
55.9% (t-value =4.47, p-value = 2.31e − 04). Therewas no significant difference between the accura-cies obtained using vector phase analysis with dualthreshold circles and best-fit initial-dip-based dHRF(t-value = 0.75, p-value = 0.45). The processingtimes spent to process one to six trials using the dualvector phase analysis and initial-dip-based dHRF,respectively, are reported in Table 4. To further checkthe test–retest results of our proposed method, twosubjects (Subs. 4 and 7) were asked to participate inmore experiments. Four experiments were performedon each subject in two consecutive days (two sessionsat different times per day). The best-fit initial-dip-dHRF of each subject (see Fig. 9) was used to selectthe active channels. Table 5 reports the classificationaccuracies obtained for four different experiments.The classification accuracy of Sub. 7 was higher than60% in three sessions, which seems good enough andis acceptable for BCI.
4. Discussion
The novelties of this paper are the following: (i) newdefinitions of the initial dip and HR regions in the
vector phase diagram to reduce false identification ofinitial dips in fNIRS signals, (ii) the use of a linearcombination of three gamma functions to model thedHRF with initial dip to draw the initial-dip-basedbrain activation map and select active channels forfNIRS-BCI applications, and (iii) the demonstrationof the capability of classifying two finger movementswhich are originated from a small brain region. Thisis possible because the initial dip is more specific toa brain region than the hemodynamics.
In this paper, the use of dual threshold circlesto clarify the initial dip and HR regions in the vec-tor phase diagram to detect the occurrence of initialdips in fNIRS signals is proposed for the first time.The early fNIRS studies used a single threshold circlehaving a radius of either max(∆HbO2 + ∆HbR2)1/2
or max{∆HbO,∆HbR}, as a decision criterion, fromthe resting state hemodynamics. Our work has anadvantage over the early studies, as we were able toidentify whether the dips are false or motion-relatedartifacts, which enhanced the classification accuracyfor the BCI applications. We have used a 30% of themaximum value and its SD of the HR of an activechannel in the decision of the radius of the secondthreshold circle because we had found in our previousstudy that the amplitude of the initial dip is almost0.3 times that of the conventional HR.26 This find-ing is consistent with optical imaging spectroscopystudies in which the early response is about 1/3of the delayed response.49–52 Later, an fMRI studyreported that in the motor area, the ratio of the ear-lier response to the delayed response is roughly 0.3.53
However, in the case of fMRI, it was also found thatthe ratio of the initial dip peak to the HR peak varieswith the strength of the magnetic field of the fMRIsystem.52,77 Furthermore, we used only Phases 3–5to define the hypoxic initial dip region, because inthe previous fNIRS studies as well as in our cur-rent study, it was observed that hypoxic-ischemic-type (i.e. decreased ∆HbO) initial dips frequentlyoccurred.26,46–48 Our proposed criteria worked wellfor all subjects, trials, and activity tasks. The peaksof the initial dips of all subjects and tasks remainedwithin the initial dip region (see Fig. 6 of Sub. 1),which helped to identify and eliminate the false-dipchannels.
In this paper, the use of a linear combination ofthree gamma functions (instead of two) for the detec-tion of cortical activation as well as active channel
1850031-13
October 22, 2018 14:30 1850031
A. Zafar & K.-S. Hong
selection for BCI was also utilized. Several previ-ous studies used a modified version of the exist-ing two-gamma-function dHRF to analyze the fNIRStime series.29,60 The advantage of using three gammafunctions over two gamma functions is that it willalso include the initial dip in the dHRF model forbetter estimation of the fNIRS signal. Also, the exist-ing literature suggests that the fNIRS signals varyin their shape and characteristics from subject-to-subject and trial-to-trial.64 In fact, it is evident inFig. 9 that inter-subject differences existed in thecHRF parameters due to individual differences inanatomical factors. Therefore, the estimation of thedHRF shape of each subject for a better online-BCIchannel selection was useful.
With regard to the active brain regions upon indi-vidual finger movements, the activation maps weredrawn at the ends of 4 s and 14 s periods based onthe averaged HbO and the initial-dip-based dHRF.Recalling that several previous studies indicated thatthe initial dip peaks occurred at around 2 s andfinished at around 4 s,24,52,78,79 the first t-map wasdrawn at 4 s, see Figs. 11(b) and 11(f), and anotherone at 14 s, see Figs. 11(d) and 11(h), in order tocompare the active brain areas by using the initialdip and the conventional HR. It was found that thehighly active locations of HbOs upon thumb andlittle-finger tapping were more spatially specific at4 s than at 14 s. The 14 s t-map is more widely spreadover the region. But, very distinctive activation loca-tions for individual taps are shown in 4 s map. Sim-ilarly, in the case of COEs, the oxygen consumptionin 4 s was also higher (∆COE > 0) and distinctive forboth tasks in comparison to 14 s (∆COE < 0). Thisshows that the oxygen consumption during neuro-activation is higher in the dip phases as comparedto HR phases, which is consistent with the exist-ing literature.46 Also, the HR of little finger tappingwas stronger than that of thumb finger tapping. Theobtained results are quite consistent with the pre-vious relevant studies.10,80–83 Even though the cur-rent results in initial-dip-based dHRF are prelimi-nary, they will certainly contribute constructively tothe fNIRS brain-imaging community.
In this study, the window size was chosen as 0–2.5 s, and the features used to classify thumb andlittle finger tapping tasks were the signal mean andthe signal minimum value. Several previous stud-ies have reported the occurrence of the initial dip
peak at approximately 2–2.5 s.44–46,52 Therefore, a2.5 s window can provide the reliable classificationaccuracy in using the initial dips. The classificationaccuracy obtained by using the dual threshold circlesfor channel selection was significantly higher thanthat obtained with the single threshold circle (seeTable 3). The reason for the low accuracy with thesingle threshold circle criterion (i.e. 59% in our case)is that it used all of the channels showing a magni-tude greater than the maximum value in resting statehemodynamics. There is a possibility that during anactivity period, some channels will show unexpectedpeaks due to unknown fluctuations. In the previousmethod, there is no criterion to identify those chan-nels showing such false dips. The advantage of thesecond threshold circle is that it helps to eliminatethose channels before the channel averaging for BCIapplications, which results in a higher classificationaccuracy (i.e. 74.9% in this study). It is important tonote that, for a channel to be selected as an activechannel using the vector phase analysis with dualthreshold circles, we have to wait till the trajectoryenters the HR region (i.e. approximately 6 s to 7 s),which is too slow for the online applications. Also,it requires a computation time of 0.168 s and 0.806 sfor one trial and six trials, respectively.
Finally, to address the above issue (i.e. delayof approximately 6 s to 7 s), we suggest using thebest-fit initial-dip-based dHRF model for selection ofactive channels for the classification of the tappingtask. The best-fit initial-dip-based dHRF yieldeda higher classification accuracy, 72.7%, in a 2.5 swindow than that of two gamma functions, 55.9%.In comparison with the vector phase analysis ofdual threshold circles, the best-fit initial dip dHRFyielded a slightly lower classification accuracy (t-value = 0.75, p-value = 0.45), but it can reducethe delay time from 6 s to 2.5 s. Also, the computa-tion time needed for processing of six trials is almosthalf (i.e. 0.409 s) of the processing time taken bythe vector phase analysis (i.e. 0.806 s). The reduc-tion in delay and overall processing time are a signifi-cant improvement toward real-time BCI applicationsusing fNIRS.54,84–88
5. Limitations and Future Prospects
In this study, the value 0.3 for the ratio of |p0|to p1 was adopted from the literature, which is
1850031-14
October 22, 2018 14:30 1850031
Neuronal Activation Detection Using Vector Phase Analysis
from empirical data. This ratio may depend on thetasks, measured locations, subjects, definition of ini-tial dips, and the temporal resolution of the fNIRSsystem. Therefore, this ratio should be determinedin the training phase by performing several trials fora given task. Once the training data are obtained,the ratio can be calculated based on the averageddata and its SD for the specific tasks, measured loca-tions, and subjects. However, there exists a possibil-ity that the initial dip may disappear by averaging.Specifically, in the case of initial dip disappearance,the ratio will be kept to 0.3 for the second thresholdcircle. Moreover, an optimal value of the ratio mayexist, which can help to investigate the best possi-ble radius of the threshold circles. Thus, it furtherenables us to investigate the vector phase analysis tobe used as an independent classifier. We have con-sidered hypoxic initial dips, however, other types ofdips should also be considered in the future.
For the estimation of dHRF parameters, gammafunctions were used to model the cHRF. The useof three gamma functions provides an extra degreeof freedom in the estimation of dHRF including aninitial dip. Previously, Ye et al.36 had observed asignificant increase in the correlation between thehemodynamic components (HbO, HbR, and HbT)and the dHRF approximated with multiple gammafunctions (maximum 4 in their case). Therefore, mul-tiple gamma functions in the estimation of a dHRFshould be investigated for finding the best degree offreedom. Also, other functions like Gaussian model,half cosine functions, etc., deserve a further investi-gation.
It should also be noted that the densely con-figured emitter–detector pairs in our study containonly 12 emitters and 3 detectors, resulting in only36 channels that can record brain activities only ina local brain region of 2 cm × 4.9 cm area. However,if more emitter/detector combinations are availablefor forming more channels that cover a wider brainregion, more findings can be made. We have focusedonly on the activation map generated by the aver-aged signal over all subjects and trials. We wereable to see that the t-maps of thumb and littlefingers were distinguishable in some subjects, butnot from all subjects. This is possibly due to tworeasons: (i) the muscle motions of each finger areaffected by each other81 and (ii) the spatial res-olution of our configuration was not sufficient to
distinguish these overlapping regions. Therefore, afurther investigation to improve the spatial reso-lution with a densely configured arrangement ofoptodes with closely placed emitter–detector pairsshould be made.
In this study, we have used a Butterworth filterat a cutoff frequency of 0.15Hz to reduce physiolog-ical noise. In this case, the HR caused by skin bloodflow may be present, which may affect the features’value. However, it was shown in the previous study89
that the correlated or uncorrelated information couldenhance the overall classification accuracy as thesefeatures would work well for each other. In thefuture, it should be investigated that the improve-ment in classification accuracy can be achieved byusing a skin blood flow removal technique. Anothermain limitation of fNIRS is the inter-subject andintra-subject variations in HRs due to physiologi-cal/psychological individual differences and trial-to-trial variability.64,90,91 These individual differencescan variate the threshold circle radii and the classi-fication accuracies (as observed in Tables 3 and 5).For a clinical application, the variation in HRs can beminimized by averaging over trials per session. How-ever, in the case of BCI, the variation in individualsubjects (due to HRs variation) can be minimizedby introducing additional features from a secondarymodality (e.g. EEG). Therefore, the dip detectionand accuracy improvement should be investigated byemploying hybrid modalities.92–94 Finally, we haveused only temporal features from the HbO signals. Inthe future, other features (including HbR, COE, andCBV) should be investigated for further improve-ment of initial dip classification accuracy.
6. Conclusion
In this study, the vector phase analysis method withdual threshold circles was used to identify the falsedips in the fNIRS signals. Also, the use of a three-gamma function to model initial-dip-based dHRFfor active channel selection, identifying the activeregions for the initial dip, and their application forBCI were demonstrated. Right-hand thumb and lit-tle finger tapping tasks associated with the left motorcortex were performed. The initial dip region in thevector phase analysis revealed that the initial dip canindeed be detected successfully and remain withinthis region. Our results demonstrated that by using
1850031-15
October 22, 2018 14:30 1850031
A. Zafar & K.-S. Hong
the initial-dip-based dHRF, the activation map forthe initial dip (i.e. 4 s) can show highly active loca-tions of tapping tasks more specifically and distin-guishably than the activation map for the main HR(i.e. 14 s). We used temporal features with LDA-based classification to achieve 74.9% accuracy withinthe 0–2.5 s window with the dual threshold circles.In comparison with the single threshold circle, anaverage increase of 15.9% was observed. Also, theinitial-dip-based dHRF, due to its shorter delay andprocessing time than that of vector phase analy-sis, yielded a higher classification accuracy than the
commonly used two-gamma-function dHRF for anonline application. These encouraging results showa greater potential of the initial-dip-based classifica-tion method for fNIRS-based BCI applications.
Acknowledgments
This work was supported by the National ResearchFoundation (NRF) of Korea under the auspicesof the Ministry of Science and ICT, Republicof Korea (Grant Nos. NRF-2017R1A2A1A17069430and NRF-2017R1A4A1015627).
Appendix
Table A.1. Averages of the estimated parameters of cHRF for thumb tapping task (over six trials).
Neuronal Activation Detection Using Vector Phase Analysis
References
1. A. Pellicer and M. Del Carmen Bravo, Near-infraredspectroscopy: A methodology–focused review,Semin. Fetal Neonatal Med. 16(1) (2011) 42–49.
2. H. Santosa, M. J. Hong, S.-P Kim and K.-S. Hong,Noise reduction in functional near-infrared spec-troscopy signals by independent component analysis,Rev. Sci. Instrum. 84(7) (2013) 073106.
3. M. Cope and D. T. Delpy, System for long-term mea-surement of cerebral blood and tissue oxygenation onnewborn-infants by near-infrared trans-illumination,Med. Biol. Eng. Comput. 26(3) (1998) 289–294.
4. F. Montani, A. Oliynyk and L. Fadiga, Superlinearsummation of information in premotor neuron pairs,Int. J. Neural Syst. 27(2) (2017) 1650009.
5. T. Kato, A. Kamei, S. Takashima and T. Ozaki,Human visual cortical function during photic stimu-lation monitoring by means of near infrared spec-troscopy, J. Cereb. Blood Flow Metab. 13 (1993)516–520.
6. A. Villringer, J. Planck, C. Hock, L. Schleinkofer andU. Dirnagl, Near infrared spectroscopy (NIRS): Anew tool to study hemodynamic changes during acti-vation of brain function in human adults, Neurosci.Lett. 154(1–2) (1993) 101–104.
7. T. Kato, Principle and technique of NIRS imagingfor human brain FORCE: Fast-oxygen response incapillary event, Int. Cong. Ser. 1270 (2004) 85–90.
8. K.-S. Hong and N. Naseer, Reduction of delay indetecting initial dips from functional near-infraredspectroscopy signals using vector-based phase anal-ysis, Int. J. Neural Syst. 26(3) (2016) 1650012.
9. K. Yoshino, N. Oka, K. Yamamoto, H. Takahashiand T. Kato, Correlation of prefrontal corticalactivation with changing vehicle speeds in actualdriving: A vector-based functional near-infraredspectroscopy study, Front. Hum. Neurosci. 7 (2013)895.
10. H.-D. Nguyen, K.-S. Hong and Y.-I. Shin, Bundled-optode method in functional near-infrared spec-troscopy, PLoS One 11(10) (2016) e0165146.
11. H.-D. Nguyen and K.-S. Hong, Bundled-optodeimplementation for 3D imaging in functional near-infrared spectroscopy, Biomed. Opt. Express 7(9)(2016) 3491–3507.
12. H. Watanabe, Y. Shitara, Y. Aoki, T. Inoue, S.Tsuchida, N. Takahashi and G. Taga, Hemoglobinphase of oxygenation and deoxygenation in earlybrain development measured using fNIRS, Proc.Natl. Acad. Sci. USA 114(9) (2017) E1737–E1744.
13. S. Cutini, S. Basso Moro and S. Bisconti, Func-tional near infrared optical imaging in cognitive neu-roscience: An introductory review, J. Near InfraredSpectrosc. 20(1) (2012) 75–92.
14. K. Ohi, T. Shimada, H. Kihara, T. Yasuyama,K. Sawai, Y. Matsuda, K. Oshima, H. Okubo,Y. Nitta, T. Uehara and Y. Kawasaki, Impact of
familial loading on prefrontal activation in majorpsychiatric disorders: A near-infrared spectroscopy(NIRS) study, Sci. Rep. 7 (2017) 44628.
15. J. Gervain, Near-infrared spectroscopy: Recentadvances in infant speech perception and languageacquisition research, Front. Psychol. 5 (2014) 916.
16. P. E. Grant, N. Roche-Labarbe, A. Surova, G.Themelis, J. Selb, E. K. Warren, K. S. Krishnamoor-thy, D. A. Boas and M. A. Franceschini, Increasedcerebral blood volume and oxygen consumption inneonatal brain injury, J. Cereb. Blood Flow Metab.29(10) (2009) 1704–1713.
17. M. Ferrari, J. P. Culver, Y. Hoshi and H. Wabnitz,Clinical near-infrared spectroscopy and imaging ofthe brain, Neurophotonics 3(3) (2016) 031401.
18. N. Naseer and K.-S. Hong, fNIRS-based brain–computer interfaces: A review, Front. Hum. Neu-rosci. 9 (2015) 3.
19. A. Ortiz-Rosario and H. Adeli, Brain–computerinterface technologies: From signal to action, Rev.Neurosci. 24(5) (2013) 537–552.
20. A. Ortiz-Rosario, I. Berrios-Torres, H. Adeli andJ. A. Buford, Combined corticospinal and reticu-lospinal effects on upper limb muscles, Neurosci.Lett. 561 (2014) 30–34.
21. A. Burns, H. Adeli and J. A. Buford, Brain–computer interface after nervous system injury, Neu-roscientist 20(6) (2014) 639–651.
22. A. Ortiz-Rosario, H. Adeli and J. A. Buford, Waveletmethodology to improve single unit isolation inprimary motor cortex cells, J. Neurosci. Methods246 (2015) 106–118.
23. R. B. Buxton, E. C. Wong and L. R. Frank, Dynam-ics of blood flow and oxygenation changes duringbrain activation: The balloon model, Magn. Reson.Med. 39(6) (1998) 855–864.
24. G. Jasdzewski, G. Strangman, J. Warner, K. K.Kwong, R. A. Poldrack and D. A. Boas, Differ-ences in the hemodynamic response to event-relatedmotor and visual paradigms as measured by near-infrared spectroscopy, Neuroimage 20(1) (2003) 479–488.
25. Z. Y. Shan, M. J. Wright, P. M. Thompson, K. L.McMahon, G. G. Blokland, G. I. De Zubicaray, N. G.Martin, A. A. Vinkhuyzen and D. C. Reutens, Mod-eling of the hemodynamic responses in block designfMRI studies, J. Cereb. Blood Flow Metab. 34(2)(2014) 316–324.
26. A. Zafar and K.-S. Hong, Detection and classifica-tion of three-class initial dips from prefrontal cortex,Biomed. Opt. Express 8(1) (2017) 367–383.
27. K. Ciftci, B. Sankur, Y. P. Kahya and A. Akin, Con-straining the general linear model for sensible hemo-dynamic response function waveforms, Med. Biol.Eng. Comput. 46(8) (2008) 779–787.
28. T. J. Huppert, S. G. Diamond, M. A. Franceschiniand D. A. Boas, HomER: A review of time-series
29. A. F. Abdelnour and T. Huppert, Real-time imag-ing of human brain function by near-infrared spec-troscopy using an adaptive general linear model,Neuroimage 46(1) (2009) 133–143.
30. K.-S. Hong and H.-D. Nguyen, State-space mod-els of impulse hemodynamic responses over motor,somatosensory, and visual cortices, Biomed. Opt.Express 5(6) (2014) 1778–1798.
31. K. J. Friston, P. Fletcher, O. Josephs, A. Holmes,M. D. Rugg and R. Turner, Event-related fMRI:Characterizing differential responses, Neuroimage7(1) (1998) 30–40.
32. M. A. Lopez-Gordo, D. Sanchez-Morillo and M. A.J. Van Gerven, Spreading codes enables the blindestimation of the hemodynamic response with short-event sequences, Int. J. Neural Syst. 25(1) (2015)1450035.
33. M. A. Lindquist, L. J. Meng, L. Y. Atlas and T. D.Wager, Modeling the hemodynamic response func-tion in fMRI: Efficiency, bias and mis-modeling, Neu-roimage 45(1) (2009) S187–S198.
34. H. Santosa, M. J. Hong and K.-S. Hong, Lateraliza-tion of music processing with noise in the auditorycortex: An fNIRS study, Front. Behav. Neurosci. 8(2014) 418.
35. K.-S. Hong and H. Santosa, Decoding four differentsound categories in the auditory cortex using func-tional near-infrared spectroscopy, Hear. Res. 333(2016) 157–166.
36. J. C. Ye, S. Tak, K. E. Jang, J. W. Jung and J. D.Jang, NIRS-SPM: Statistical parametric mappingfor near-infrared spectroscopy, Neuroimage 44(2)(2009) 428–447.
37. P. H. Koh, D. Glaser, G. Flandin, S. Kiebel, B. But-terworth, A. Maki, D. T. Delpy and C. E. Elwell,Functional optical signal analysis: A software toolfor near-infrared spectroscopy data processing incor-porating statistical parametric mapping, J. Biomed.Opt. 12(6) (2007) 064010.
38. M. Watanabe, A. Bartels, J. H. Macke, Y. Murayamaand N. K. Logothetis, Temporal jitter of the BOLDsignal reveals a reliable initial dip and improved spa-tial resolution, Curr. Biol. 23(21) (2013) 2146–2150.
39. E. Yacoub and X. Hu, Detection of the early negativeresponse in fMRI at 1.5 Tesla, Magn. Reson. Med.41(6) (1999) 1088–1092.
40. T. Kato, A. Endo, M. Fukumizu, T. Kato, S.Takashima, F. Kawaguchi and N. Ichikawa, Ini-tial cerebral metabolism due to short visual stim-ulation using human functional near-infraredgraphy(fNIR): How it correlates with fMRI? in Proc. 7thAnnual Meeting of Int. Soc. Magnetic Resonance inMedicine (International Society of Magnetic Reso-nance in Medicine, Philadelphia, 1999), p. 762.
41. T. Kato, A. Endo, M. Fukumizu, T. Kato,S. Takashima, F. Kawaguchi and N. Ichikawa,
Real-time imaging of “Initial cerebral metabolism”using human functional near-infraredgraphy (fNIR),Neuroimage (1999) S309.
42. T. Kato, A. Endo, M. Fukumizu, J. Furusho, S.Takashima, F. Kawaguchi and N. Ichikawa, Singlefinger movement trial using human functional near-infraredgraphy (fNIR), Neuroimage (1999) S430.
43. T. Kato, Y. Yamashita, A. Maki, T. Yamamoto andH. Koizumi, Temporal behaviour of human func-tional near-infraredgraphy (fNIR) using single-wordspeaking trial, Neuroimage (1999) S1025.
44. T. Akiyama, T. Ohira, T. Kawase and T. Kato,TMS orientation for NIRS-functional motor map-ping, Brain Topogr. 19(1–2) (2006) 1–9.
45. G. R. Wylie, H. L. Graber, G. T. Voelbel, A. D.Kohl, J. DeLuca, Y. Pei, Y. Xu and R. L. Barbour,Using co-variations in the Hb signal to detect visualactivation: A near infrared spectroscopic imagingstudy, Neuroimage 47(2) (2009) 473–481.
46. K. Yoshino and T. Kato, Vector-based phase clas-sification of initial dips during word listeningusing near-infrared spectroscopy, Neuroreport 23(16)(2012) 947–951.
47. M. Sano, S. Sano, N. Oka, K. Yoshino and T. Kato,Increased oxygen load in the prefrontal cortex frommouth breathing: A vector-based near-infrared spec-troscopy study, Neuroreport 24(17) (2013) 935–940.
48. N. Oka, K. Yoshino, K. Yamamoto, H. Takahashi, S.Li, T. Sugimachi, K. Nakano, Y. Suda and T. Kato,Greater activity in the frontal cortex on left curves:A vector-base fNIRS study on left and right curvedriving, PLoS One 10(5) (2015) e0127594.
49. D. Malonek and A. Grinvald, Interactions betweenelectrical activity and cortical microcirculationrevealed by imaging spectroscopy: Implications forfunctional brain mapping, Science 272(5261) (1996)551–554.
50. R. D. Frostig, E. E. Lieke, D. Y. Ts’o and A. Grin-vald, Cortical functional architecture and local cou-pling between neuronal activity and the microcir-culation revealed by in vivo high-resolution opticalimaging of intrinsic signals, Proc. Natl. Acad. Sci.USA 87(16) (1990) 6082–6086.
51. A. Grinvald, R. D. Frostig, R. M. Siegel and E. Bart-feld, High-resolution optical imaging of functionalbrain architecture in the awake monkey, Proc. Natl.Acad. Sci. USA 88(24) (1991) 11559–11563.
52. X. Hu and E. Yacoub, The story of the initial dip infMRI, Neuroimage 62(2) (2012) 1103–1108.
53. E. Yacoub and X. Hu, Detection of the early decreasein fMRI signal in the motor area, Magn. Reson. Med.45(2) (2001) 184–190.
54. M. J. Khan and K.-S. Hong, Hybrid EEG-fNIRS-based eight-command decoding for BCI: Applica-tion to quadcopter control, Front. Neurorobot. 11(2017) 6.
55. R. Li, T. Potter, W. Huang and Y. Zhang, Enhancingperformance of a hybrid EEG-fNIRS system using
1850031-18
October 22, 2018 14:30 1850031
Neuronal Activation Detection Using Vector Phase Analysis
channel selection and early temporal features, Front.Hum. Neurosci. 11 (2017) 462.
56. B. Christie, Doctors revise declaration of Helsinki,Br. Med. J. 321(7266) (2000) 913–913.
57. D. T. Delpy, M. Cope, P. Van Der Zee, S. Arridge, S.Wray and J. Wyatt, Estimation of optical pathlengththrough tissue from direct time of flight measure-ment, Phys. Med. Biol. 33(12) (1988) 1433–1442.
58. T. Fekete, D. Rubin, J. M. Carlson and L. R. Mujica-Parodi, The NIRS analysis package: Noise reduc-tion and statistical inference, PLoS One 6(9) (2011)e24322.
59. J. M. Kainerstorfer, A. Sassaroli, K. T. Tgavalekosand S. Fantini, Cerebral autoregulation in themicrovasculature measured with near-infrared spec-troscopy, J. Cereb. Blood Flow Metab. 35(6) (2015)959–966.
60. X.-S. Hu, K.-S. Hong, S. S. Ge and M. Y. Jeong,Kalman estimator- and general linear model-basedonline brain activation mapping by near-infraredspectroscopy, Biomed. Eng. Online 9 (2010) 82.
61. K.-S. Hong, M. R. Bhutta, X. Liu and Y.-I. Shin,Classification of somatosensory cortex activites usingfNIRS, Behav. Brain Res. 333 (2017) 225–234.
62. X. Liu and K.-S. Hong, Detection of primary RGBcolors projected on a screen using fNIRS, J. Innov.Opt. Health Sci. 10 (2017) 1750006.
63. K. J. Friston, J. T. Ashburner, S. J. Kiebel, T. E.Nichols and W. D. Penny, Statistical ParametricMapping: The Analysis of Functional Brain Images(Elsevier, London, 2007).
64. X.-S. Hu, K.-S. Hong and S. S. Ge, Reduction oftrial-to-trial variability in functional near-infraredspectroscopy signals by accounting for resting-state functional connectivity, J. Biomed. Opt. 18(1)(2013) 017003.
65. M. A. Luersen and R. L. Riche, Globalized Nelder–Mead method for engineering optimization, Comput.Struct. 82(23–26) (2004) 2251–2260.
66. J. A. Nelder and R. Mead, A simplex method forfunctional minimization, Comput. J. 7 (1965) 308–313.
67. J. C. Lagarias, J. A. Reeds, M. H. Wright andP. E. Wright, Convergence properties of Nelder–Mead simplex method in low dimension, SIAM J.Optimiz. 9(1) (1998) 112–147.
68. Mathworks, Bound constrained optimization tool-box (2012). Retrieved from http://www.mathworks.com/matlabcentral/fileexchange/8277.
69. Y. Hoshi, Functional near-infrared optical imaging:Utility and limitations in human brain mapping,Psychophysiology 40(4) (2003) 511–520.
70. Y. Hoshi, Functional near-infrared spectroscopy:Current status and future prospects, J. Biomed. Opt.12(6) (2007) 062106.
71. M. J. Khan and K.-S. Hong, Passive BCI based ondrowsiness detection: An fNIRS study, Biomed. Opt.Express 6(10) (2015) 4063–4078.
72. N. Naseer, F. M. Noori, N. K. Qureshi and K.-S.Hong, Determining optimal feature-combination forLDA classification of functional near-infrared spec-troscopy signals in brain–computer interface appli-cation, Front. Hum. Neurosci. 10 (2016) 237.
73. M. P. Xu, J. Liu, L. Chen, H. Z. Qi, F. He, P.Zhou, B. K. Wan and D. Ming, Incorporation ofinter-subject information to improve the accuracy ofsubject-specific P300 classifiers, Int. J. Neural Syst.26(3) (2016) 1650010.
74. J. Shin, K.-R. Muller and H.-J. Hwan, Near-infrared spectroscopy (NIRS)-based eyes-closedbrain–computer interface (BCI) using prefrontal cor-tex activation due to mental arithmetic, Sci. Rep. 6(2016) 36203.
75. F. Z. Xu, W. D. Zhou, Y. L. Zhen, Q. Yuan andQ. Wu, Using fractal and local binary pattern fea-tures for classifcation of ECOG motor imagery tasksobtained from the right brain hemisphere, Int. J.Neural Syst. 26(6) (2016) 1650022.
76. Y. Zhang, Y. Wang, J. Jin and X. Y. Wang,Sparse Bayesian learning for obtaining sparsity ofEEG frequency bands-based feature vectors in motorimagery classification, Int. J. Neural Syst. 27(2)(2017) 1650032.
77. E. Yacoub, A. Shmuel, J. Pfeuffer, P.-F. Van DeMoortele, G. Adriany, K. Ugurbil and X. Hu, Inves-tigation of the initial dip in fMRI at 7 tesla, NMRBiomed. 14(7–8) (2001) 408–412.
78. T. Ernst and J. Hennig, Observation of a fastresponse in functional MR, Magn. Reson. Med. 32(1)(1994) 146–149.
79. D. S. Kim, T. Q. Duong and S. G. Kim, High-resolution mapping of iso-orientation columns byfMRI, Nat. Neurosci. 3(2) (2000) 164–169.
80. J. Diedrichsen, T. Wiestler and J. W. Krakauer,Two distinct ipsilateral cortical representations forindividuated finger movements, Cereb. Cortex 23(6)(2013) 1362–1377.
81. J. D. Meier, T. N. Aflalo, S. Kastner and M. S. A.Graziano, Complex organization of human primarymotor cortex: A high-resolution fMRI study, J. Neu-rophysiol. 100(4) (2008) 1800–1812.
82. C. A. Olman, K. A. Pickett, M. P. Schallmo and T. J.Kimberley, Selective BOLD responses to individualfinger movement measured with fMRI at 3T, Hum.Brain Mapp. 33(7) (2012) 1594–1606.
83. J. C. W. Siero, D. Hermes, H. Hoogduin, P. E. Lui-jten, N. F. Ramsey and N. Petridou, BOLD matchesneuronal activity at the mm scale: A combined 7 TfMRI and ECoG study in human sensorimotor cor-tex, Neuroimage 101 (2014) 177–184.
84. U. Chaudhary, B. Xia, S. Silvoni, L. G. Cohen andN. Birbaumer, Brain–computer interface-based com-munication in the completely locked-in state, PLoSBiol. 15(1) (2017) e1002593.
85. T. Gateau, G. Durantin, F. Lancelot, S. Scannellaand F. Dehais, Real-time state estimation in a
1850031-19
October 22, 2018 14:30 1850031
A. Zafar & K.-S. Hong
flight simulator using fNIRS, PloS One 10(3) (2015)e0121279.
86. M. F. Li, W. Li and H. H. Zhou, Increasing N200potentials via visual stimulus depicting humanoidrobot behavior, Int. J. Neural Syst. 26(1) (2016)1550039.
87. A. R. Sereshkeh, R. Trott, A. Bricout and T. Chau,Online EEG classification of covert speech brain–computer interfacing, Int. J. Neural Syst. 27(8)(2017) 1750033.
88. E. W. Yin, T. Zeyl, R. Saab, D. W. Hu, Z. T. Zhouand T. Chau, An auditory-tactile visual saccade-independent P300 brain–computer interface, Int. J.Neural Syst. 26(1) (2016) 1650001.
89. S. Fazli, S. J. Mehnert, J. Steinbrink, G. Curio, A.Villringer, K.-R. Muller and B. Blankertz, Enhancedperformance by a hybrid NIRS-EEG brain–computerinterface, Neuroimage 59(1) (2012) 519–529.
90. T. Yarkoni and T. S. Braver, Cognitive neuro-science approaches to individual differences in work-ing memory and executive control: Conceptual andmethodological issues, in Handbook of Individual
Differences in Cognition: Attention, Memory andExecutive Control eds. A. Gruszka, G. Matthews andB. Szymuyra (Springer, New York, 2010), pp. 87–107.
91. H. Sato, Y. Fuchino, M. Kiguchi, T. Katura, A.Maki, T. Yoro and H. Koizumi, Intersubject vari-ability of near-infrared spectroscopy signals duringsensorimotor cortex activation, J. Biomed. Opt. 10(2005) 44001.
92. K.-S. Hong and M. J. Khan, Hybrid-BCI techniquesfor improved classification accuracy and increasednumber of commands: A review, Front. Neurorobot.11 (2017) 35.
93. M. J. Khan, M. J. Hong and K.-S. Hong, Decodingof four movement directions using hybrid NIRS-EEGbrain–computer interface, Front. Hum. Neurosci. 8(2014) 244.
94. Y. Liu, H. Ayaz and P. A. Shewokis, Multisubject“learning” for mental workload classification usingconcurrent EEG, fNIRS, and physiological measures,Front. Hum. Neurosci. 11 (2017) 389.