Nevada Division of Minerals 2014 Nevada Mineral, Oil and Geothermal Production update Division of Minerals Activities Update Nevada Mining Association Board Presentation July 9, 2015 Richard Perry, Administrator
Transcript
Nevada Division of Minerals 2014 Nevada Mineral, Oil and Geothermal Production update
Division of Minerals Activities Update
Nevada Mining Association Board Presentation
July 9, 2015 Richard Perry, Administrator
NEVADA DIVISION OF MINERALS State Agency and part of the Commission on
Mineral Resources NRS 513 CMR is 7 members appointed by the
Governor from Minerals(5), OGG(2), Public(1) Offices in Carson City (8 employees) and Las
Vegas (2 employees) All fee revenues, no General Fund
$8.50 per claim fee on mining claims: 77 % AML securing fees: 5% OGG permitting/operating: 7 % federal AML assistance: 6% management of reclamation bond pool: 5 %
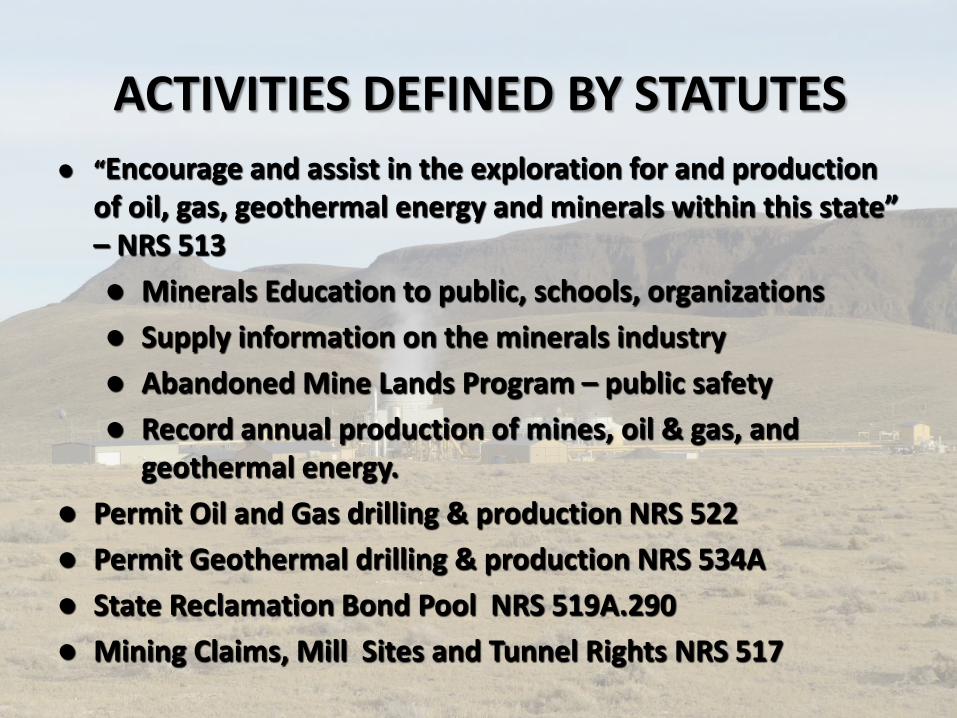
ACTIVITIES DEFINED BY STATUTES “Encourage and assist in the exploration for and production
of oil, gas, geothermal energy and minerals within this state” – NRS 513 Minerals Education to public, schools, organizations Supply information on the minerals industry Abandoned Mine Lands Program – public safety Record annual production of mines, oil & gas, and
geothermal energy. Permit Oil and Gas drilling & production NRS 522 Permit Geothermal drilling & production NRS 534A State Reclamation Bond Pool NRS 519A.290 Mining Claims, Mill Sites and Tunnel Rights NRS 517
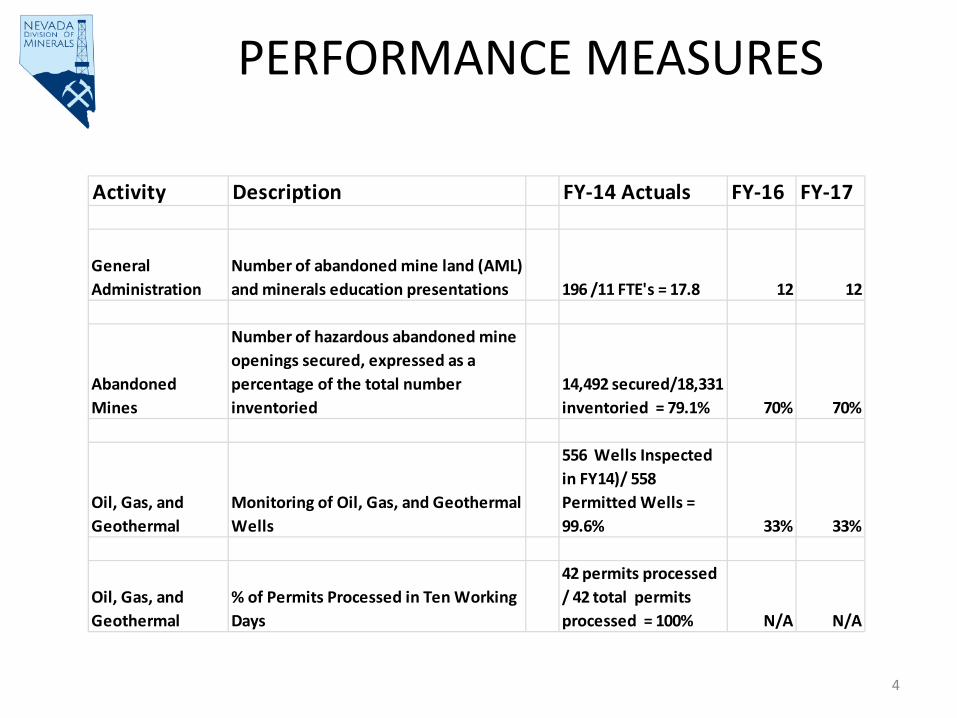
PERFORMANCE MEASURES
Activity Description FY-14 Actuals FY-16 FY-17
General Administration
Number of abandoned mine land (AML) and minerals education presentations 196 /11 FTE's = 17.8 12 12
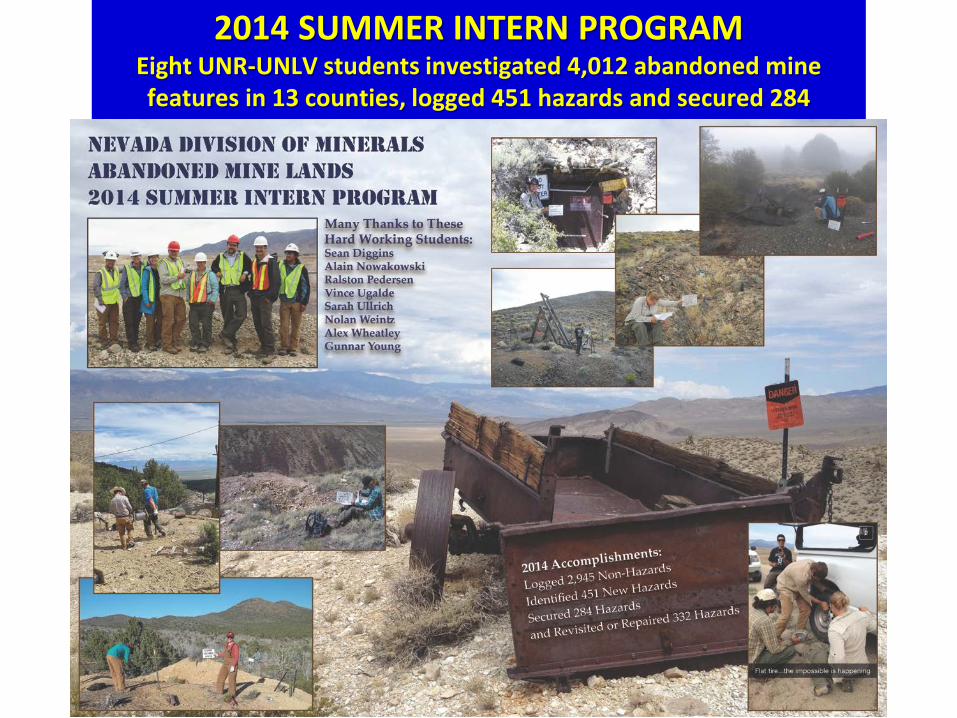
Abandoned Mines
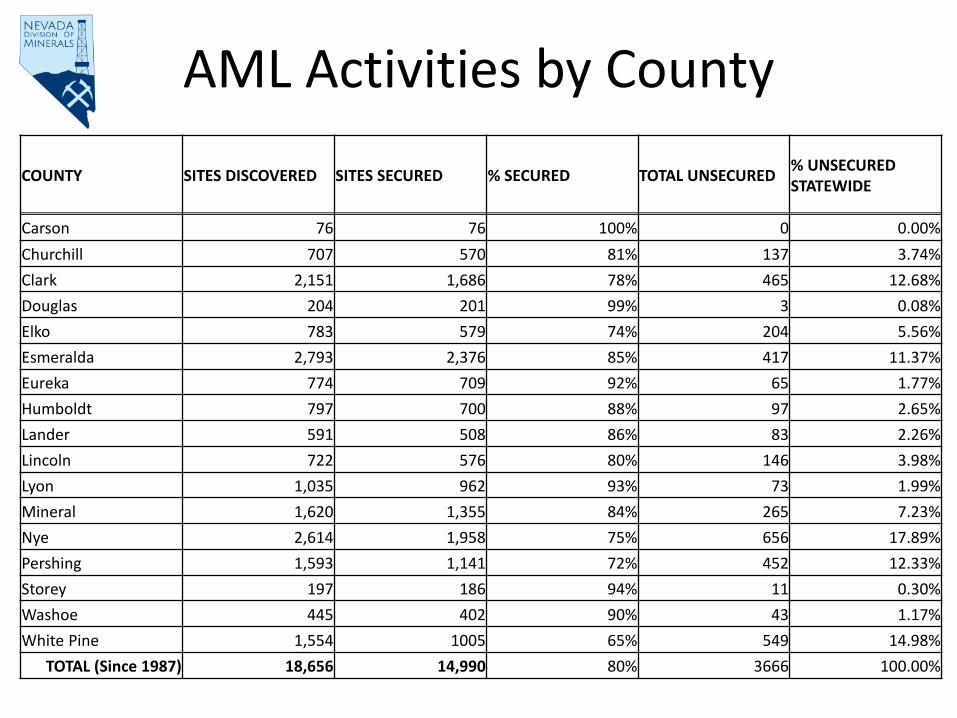
Number of hazardous abandoned mine openings secured, expressed as a percentage of the total number inventoried
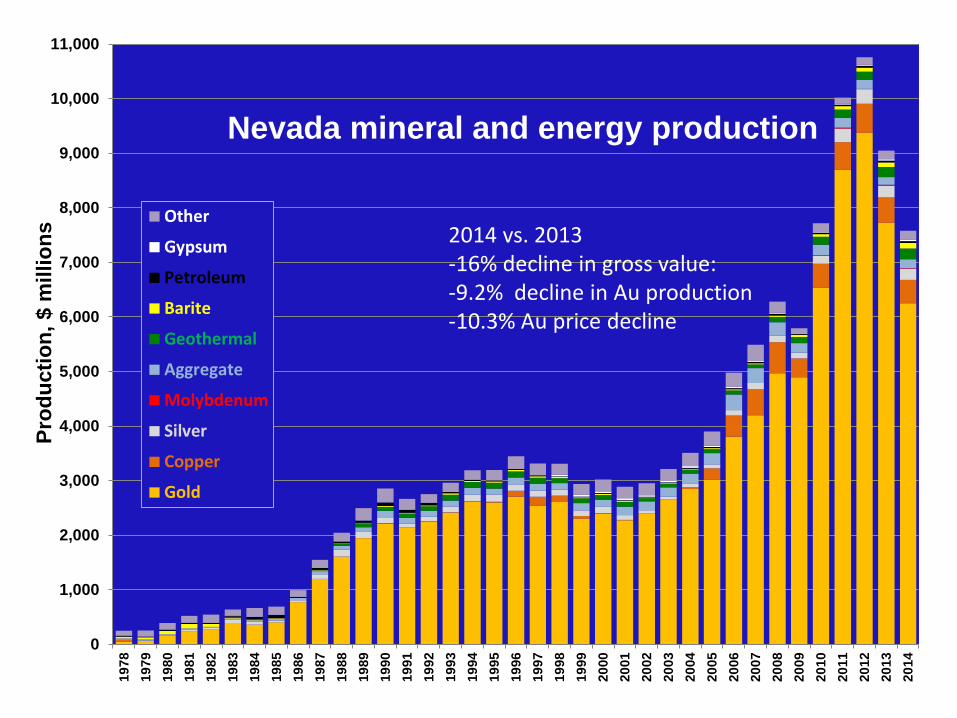
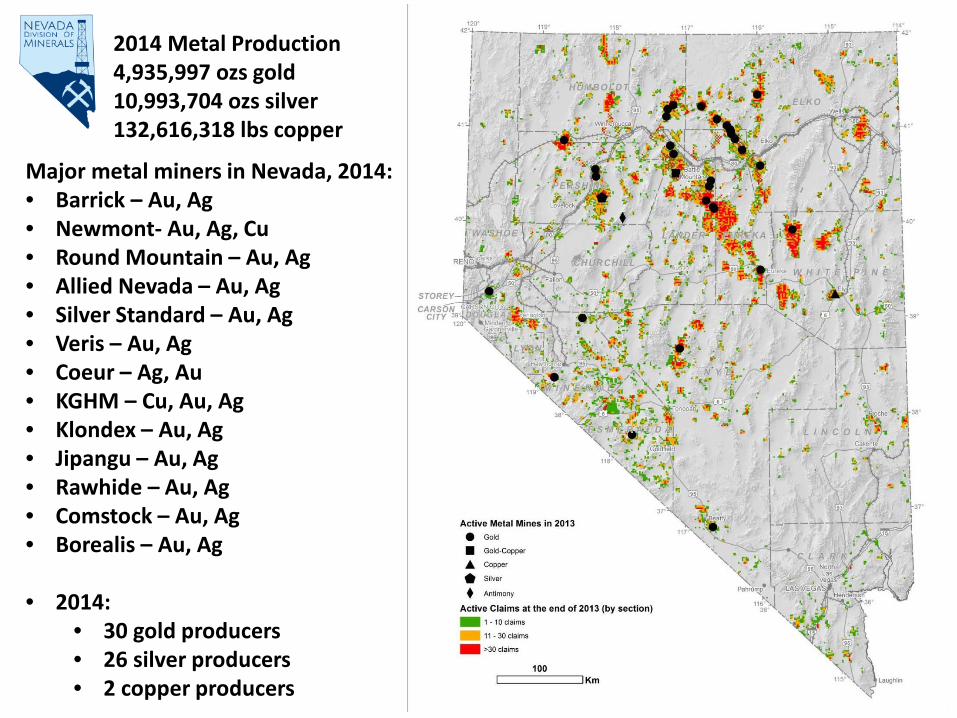
2014 vs. 2013 -16% decline in gross value: -9.2% decline in Au production -10.3% Au price decline
0
1
2
3
4
5
6
7
8
9
10
0
200
400
600
800
1,000
1,200
1,400
1,600
1,800
1978
1979
1980
1981
1982
1983
1984
1985
1986
1987
1988
1989
1990
1991
1992
1993
1994
1995
1996
1997
1998
1999
2000
2001
2002
2003
2004
2005
2006
2007
2008
2009
2010
2011
2012
2013
2014
Gol
d pr
oduc
tion,
mill
ions
of t
roy
ounc
es
Gol
d pr
ice,
$/tr
oy o
unce
Price
Production
Nevada gold 4.935 M Ozs >30% from UG >refractory <oxide
Major metal miners in Nevada, 2014: • Barrick – Au, Ag • Newmont- Au, Ag, Cu • Round Mountain – Au, Ag • Allied Nevada – Au, Ag • Silver Standard – Au, Ag • Veris – Au, Ag • Coeur – Ag, Au • KGHM – Cu, Au, Ag • Klondex – Au, Ag • Jipangu – Au, Ag • Rawhide – Au, Ag • Comstock – Au, Ag • Borealis – Au, Ag
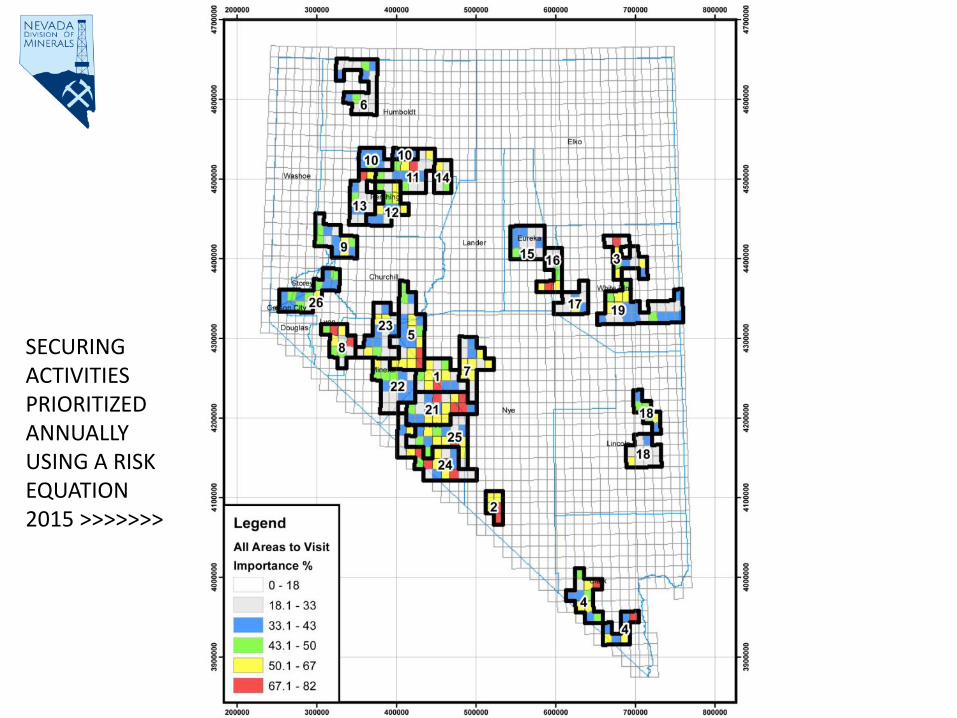
SECURING ACTIVITIES PRIORITIZED ANNUALLY USING A RISK EQUATION 2015 >>>>>>>
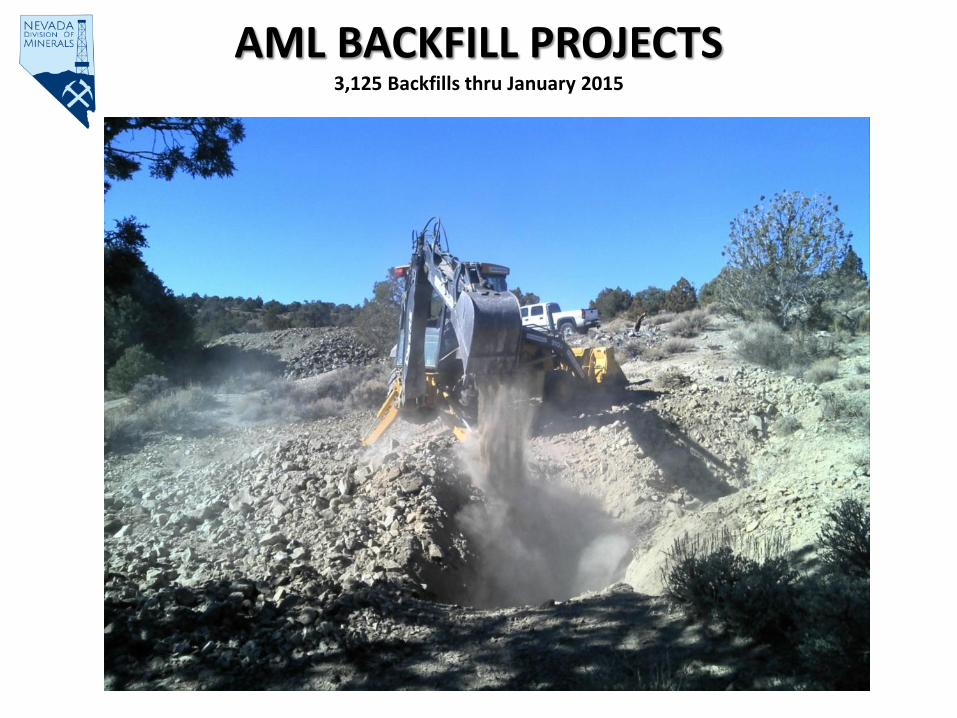
AML BACKFILL PROJECTS 3,125 Backfills thru January 2015
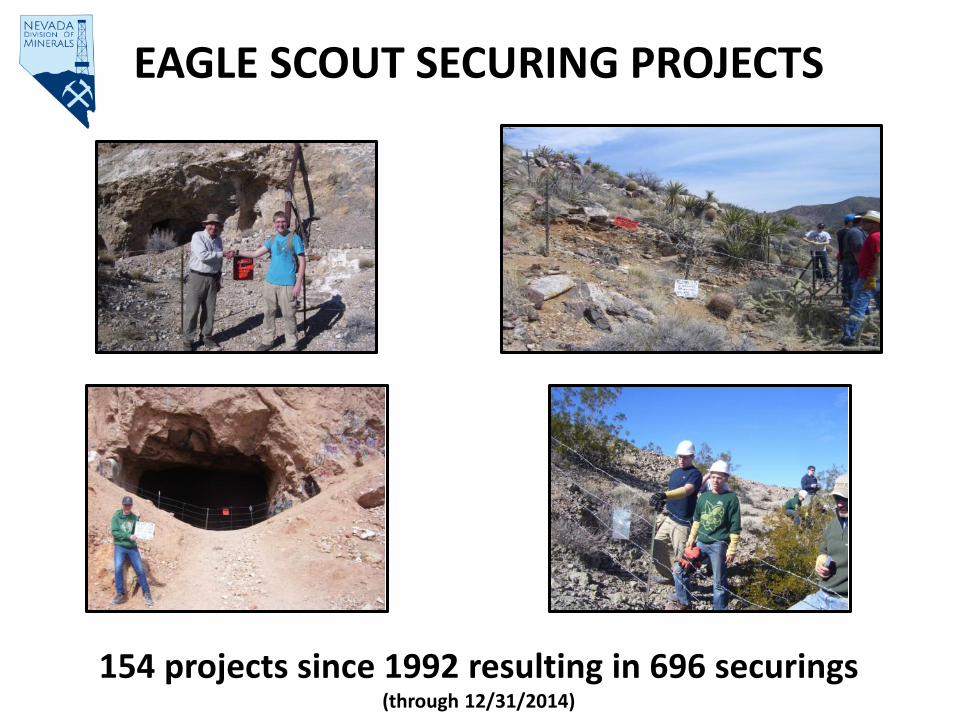
EAGLE SCOUT SECURING PROJECTS
154 projects since 1992 resulting in 696 securings (through 12/31/2014)
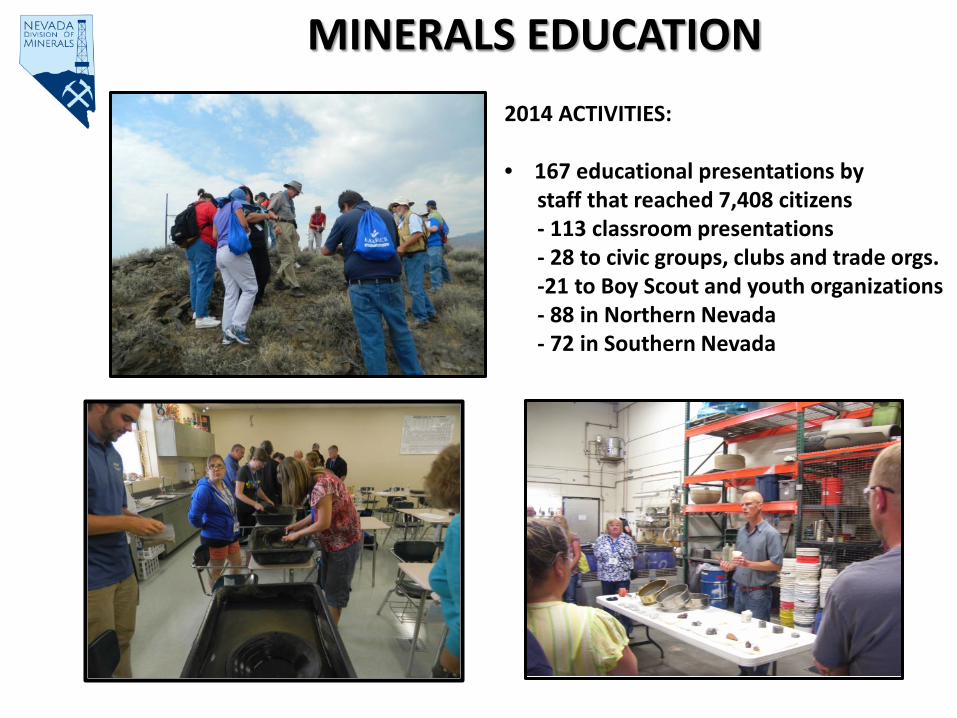
MINERALS EDUCATION 2014 ACTIVITIES: • 167 educational presentations by staff that reached 7,408 citizens - 113 classroom presentations - 28 to civic groups, clubs and trade orgs. -21 to Boy Scout and youth organizations - 88 in Northern Nevada - 72 in Southern Nevada
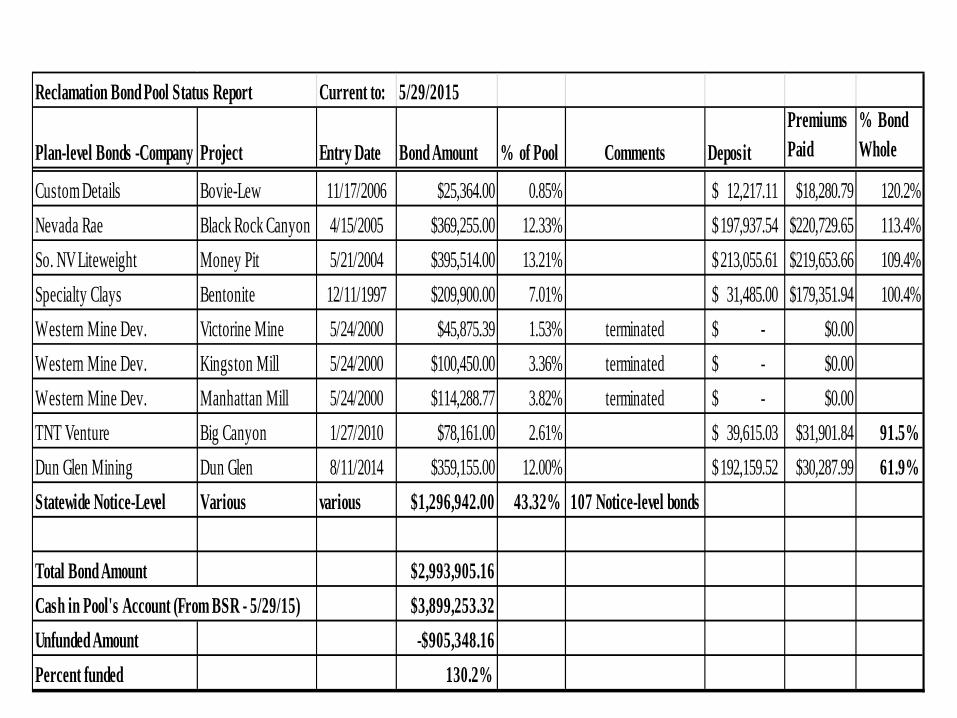
Reclamation Bond Pool Status Report Current to: 5/29/2015
Plan-level Bonds -Company Project Entry Date Bond Amount % of Pool Comments DepositPremiums Paid
Total Bond Amount $2,993,905.16Cash in Pool's Account (From BSR - 5/29/15) $3,899,253.32Unfunded Amount -$905,348.16Percent funded 130.2%
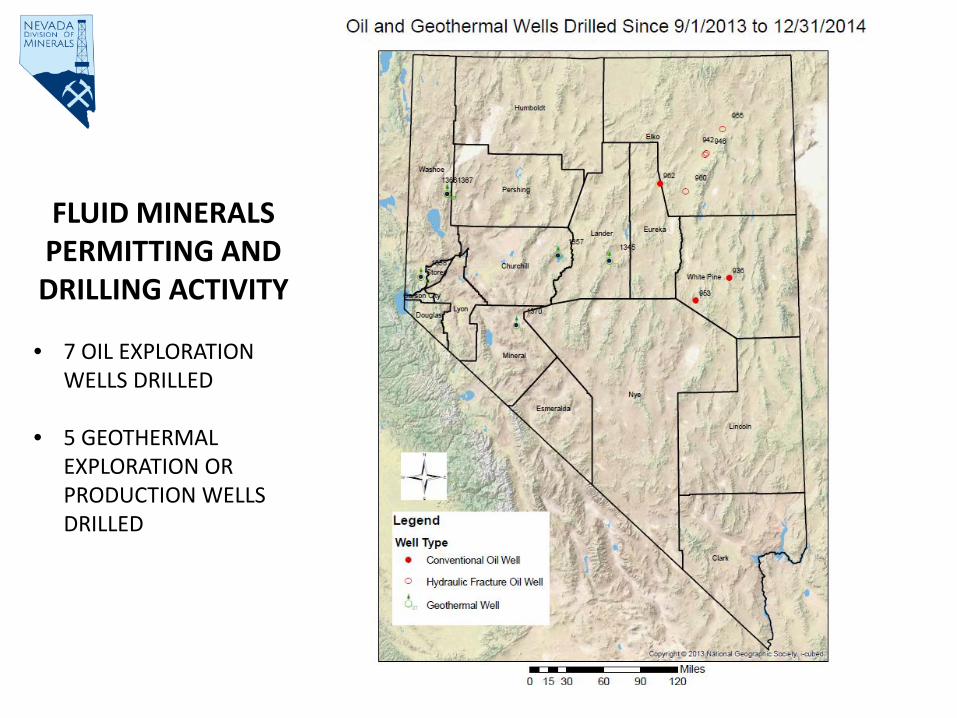
FLUID MINERALS PERMITTING AND DRILLING ACTIVITY • 7 OIL EXPLORATION
WELLS DRILLED
• 5 GEOTHERMAL EXPLORATION OR PRODUCTION WELLS DRILLED
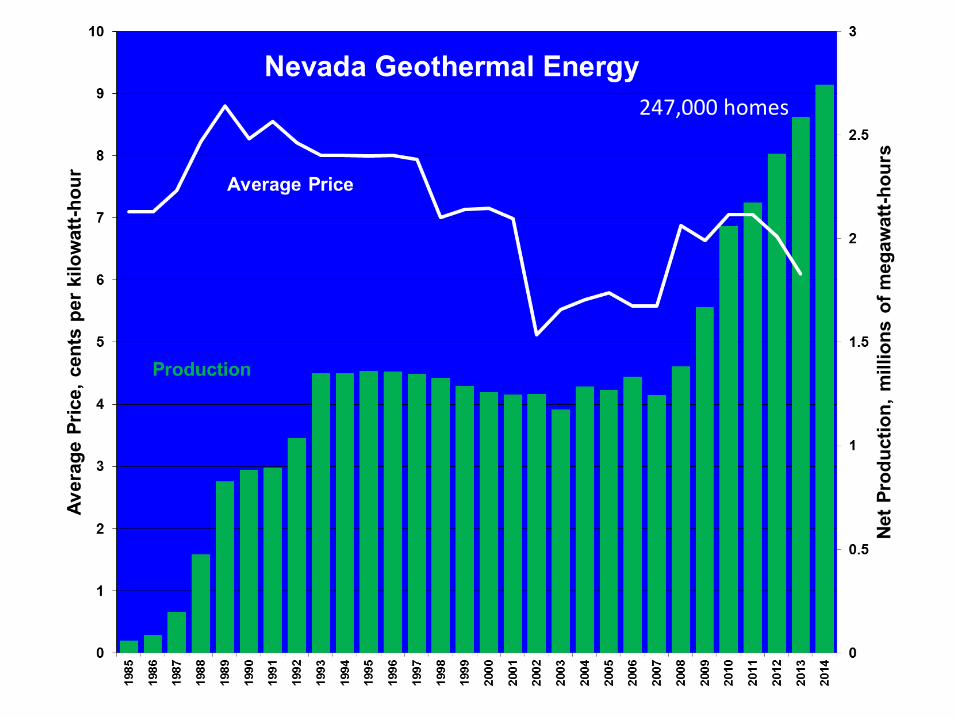
247,000 homes
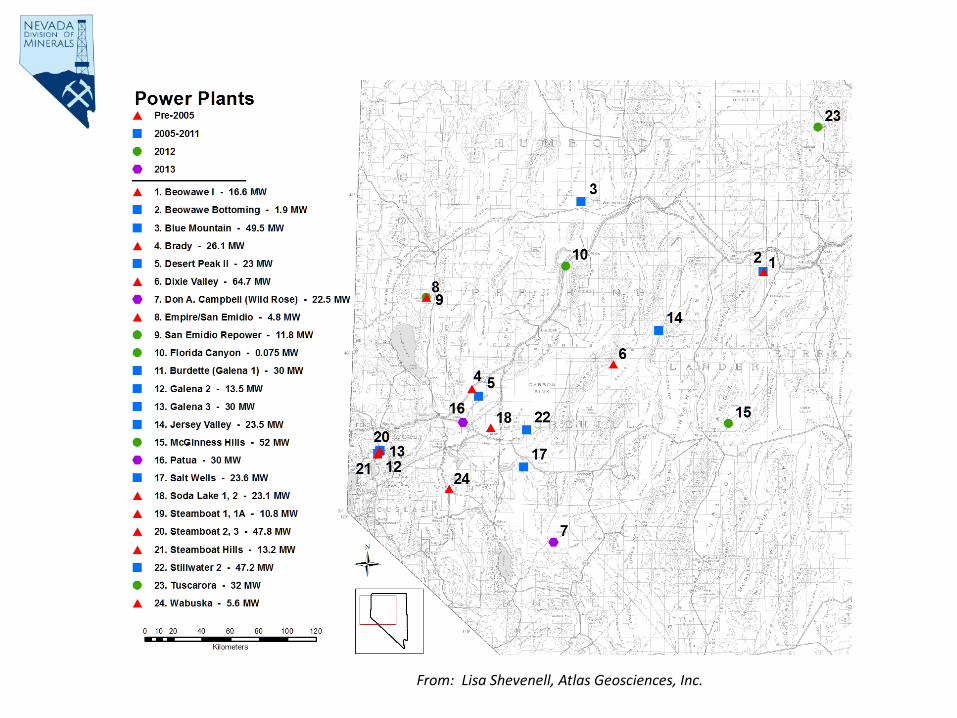
From: Lisa Shevenell, Atlas Geosciences, Inc.
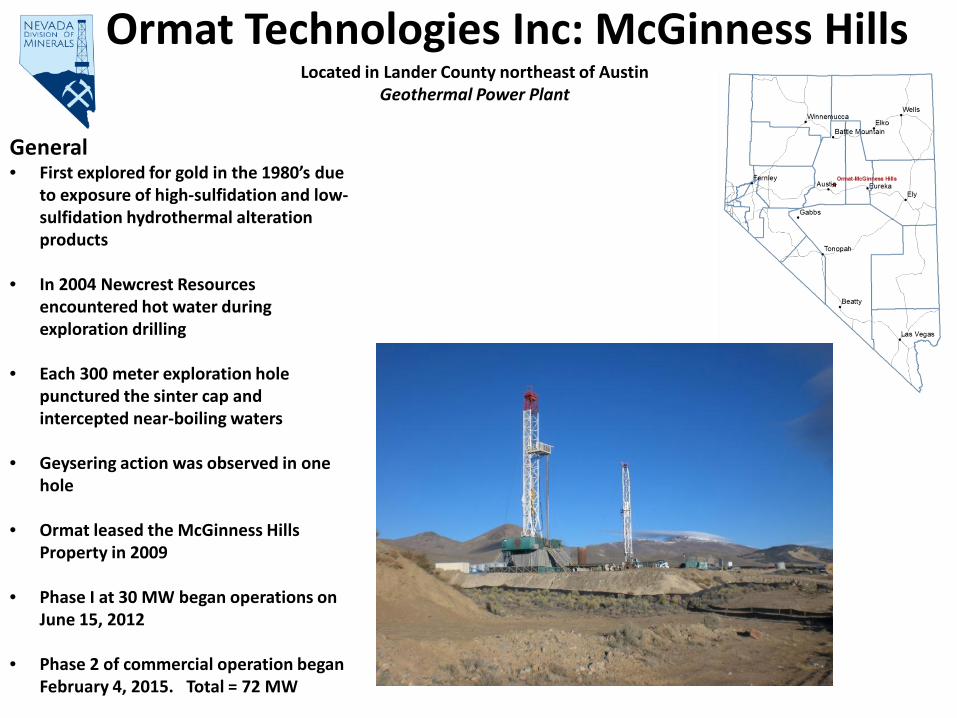
Ormat Technologies Inc: McGinness Hills Located in Lander County northeast of Austin
Geothermal Power Plant
General • First explored for gold in the 1980’s due
to exposure of high-sulfidation and low-sulfidation hydrothermal alteration products
• In 2004 Newcrest Resources encountered hot water during exploration drilling
• Each 300 meter exploration hole punctured the sinter cap and intercepted near-boiling waters
• Geysering action was observed in one hole
• Ormat leased the McGinness Hills Property in 2009
• Phase I at 30 MW began operations on June 15, 2012
• Phase 2 of commercial operation began
February 4, 2015. Total = 72 MW
0
500,000
1,000,000
1,500,000
2,000,000
2,500,000
3,000,000
3,500,000
4,000,000
4,500,00019
54
1956
1958
1960
1962
1964
1966
1968
1970
1972
1974
1976
1978
1980
1982
1984
1986
1988
1990
1992
1994
1996
1998
2000
2002
2004
2006
2008
2010
2012
2014
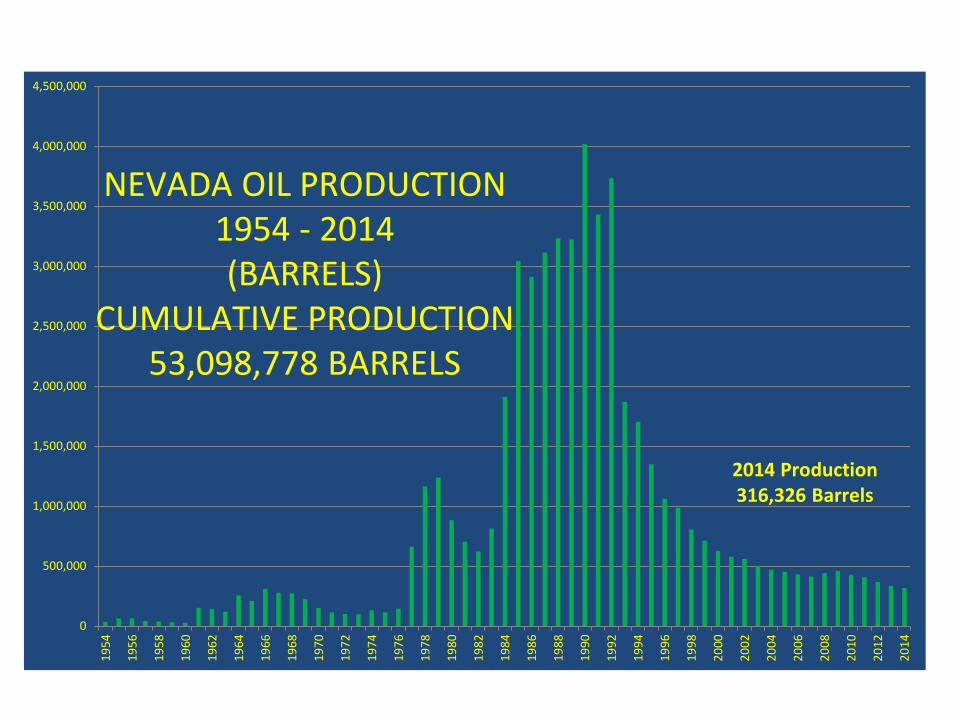
NEVADA OIL PRODUCTION 1954 - 2014 (BARRELS)
CUMULATIVE PRODUCTION 53,098,778 BARRELS
2014 Production 316,326 Barrels
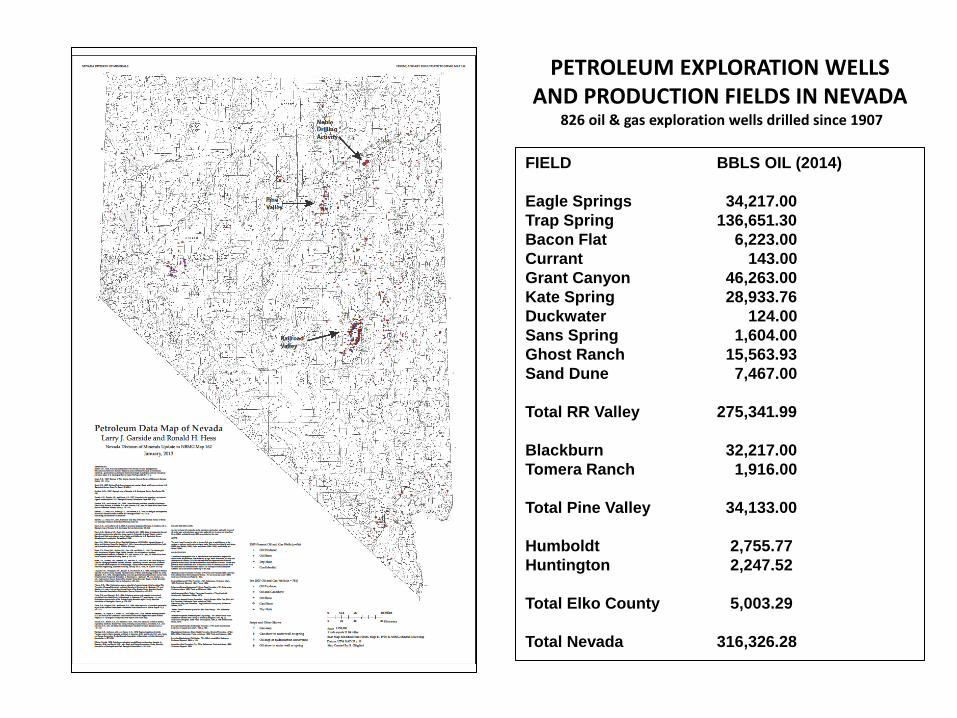
FIELD BBLS OIL (2014) Eagle Springs 34,217.00 Trap Spring 136,651.30 Bacon Flat 6,223.00 Currant 143.00 Grant Canyon 46,263.00 Kate Spring 28,933.76 Duckwater 124.00 Sans Spring 1,604.00 Ghost Ranch 15,563.93 Sand Dune 7,467.00 Total RR Valley 275,341.99 Blackburn 32,217.00 Tomera Ranch 1,916.00 Total Pine Valley 34,133.00 Humboldt 2,755.77 Huntington 2,247.52 Total Elko County 5,003.29 Total Nevada 316,326.28
PETROLEUM EXPLORATION WELLS AND PRODUCTION FIELDS IN NEVADA
826 oil & gas exploration wells drilled since 1907
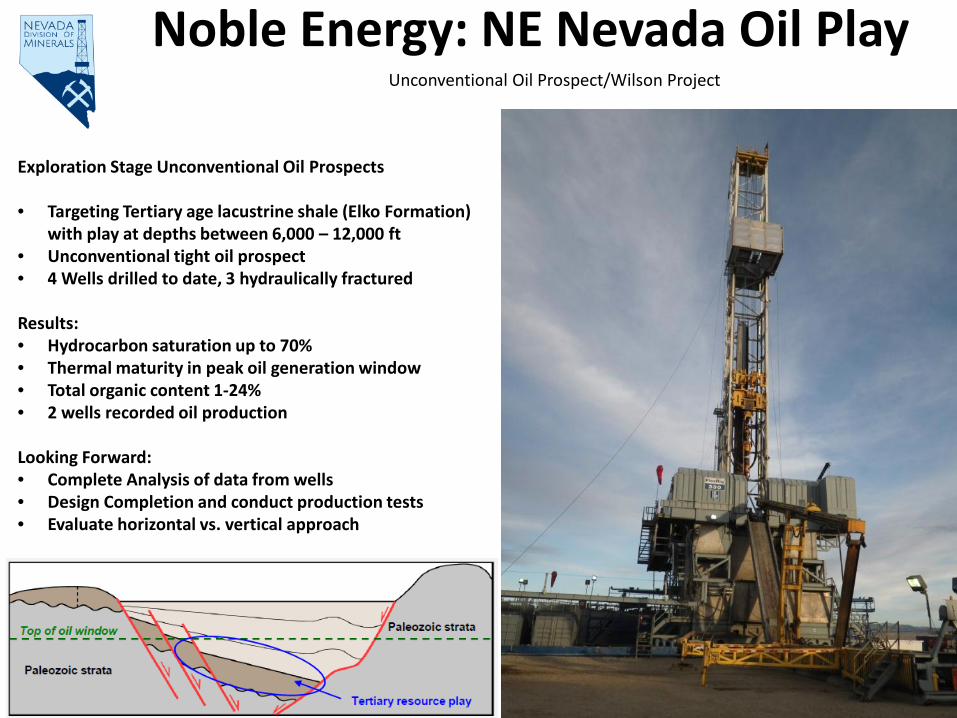
with play at depths between 6,000 – 12,000 ft • Unconventional tight oil prospect • 4 Wells drilled to date, 3 hydraulically fractured Results: • Hydrocarbon saturation up to 70% • Thermal maturity in peak oil generation window • Total organic content 1-24% • 2 wells recorded oil production Looking Forward: • Complete Analysis of data from wells • Design Completion and conduct production tests • Evaluate horizontal vs. vertical approach
Unconventional Oil Prospect/Wilson Project
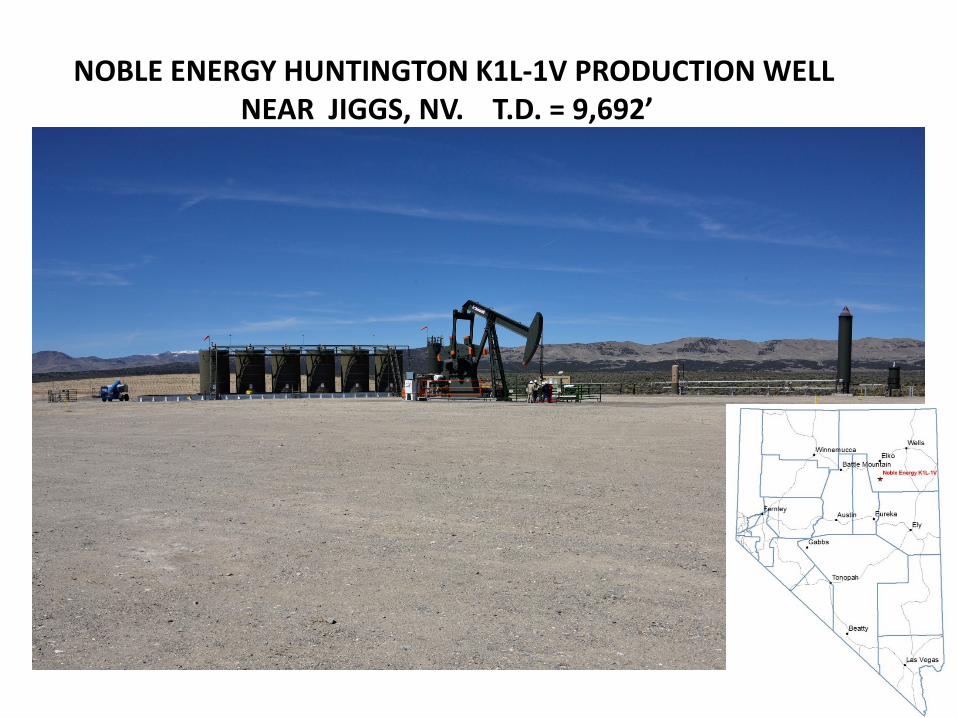
NOBLE ENERGY HUNTINGTON K1L-1V PRODUCTION WELL NEAR JIGGS, NV. T.D. = 9,692’
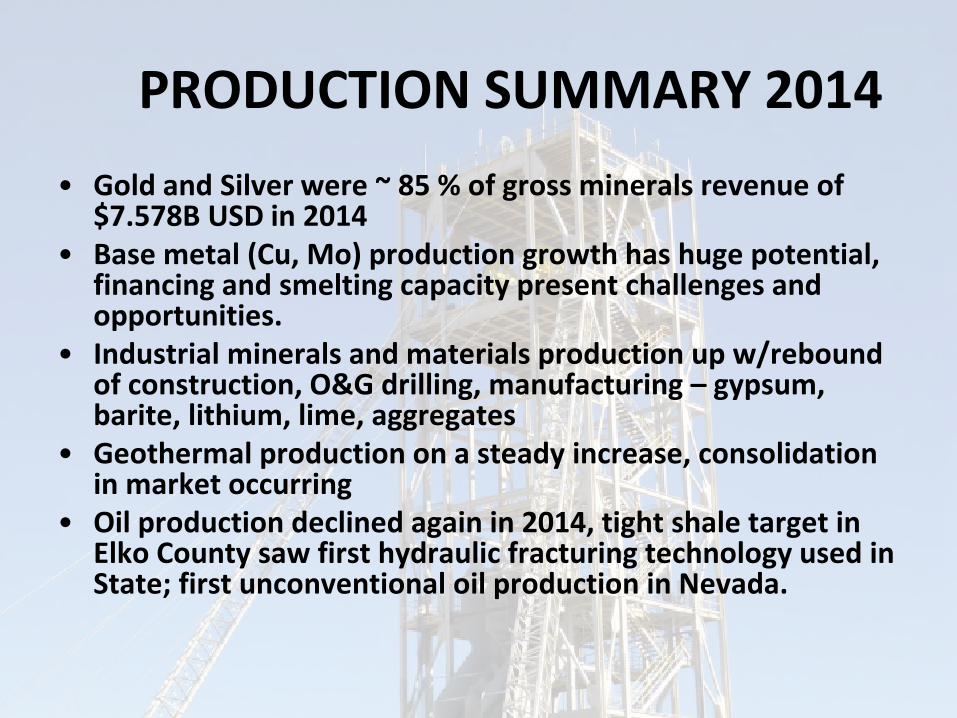
PRODUCTION SUMMARY 2014 • Gold and Silver were ~ 85 % of gross minerals revenue of
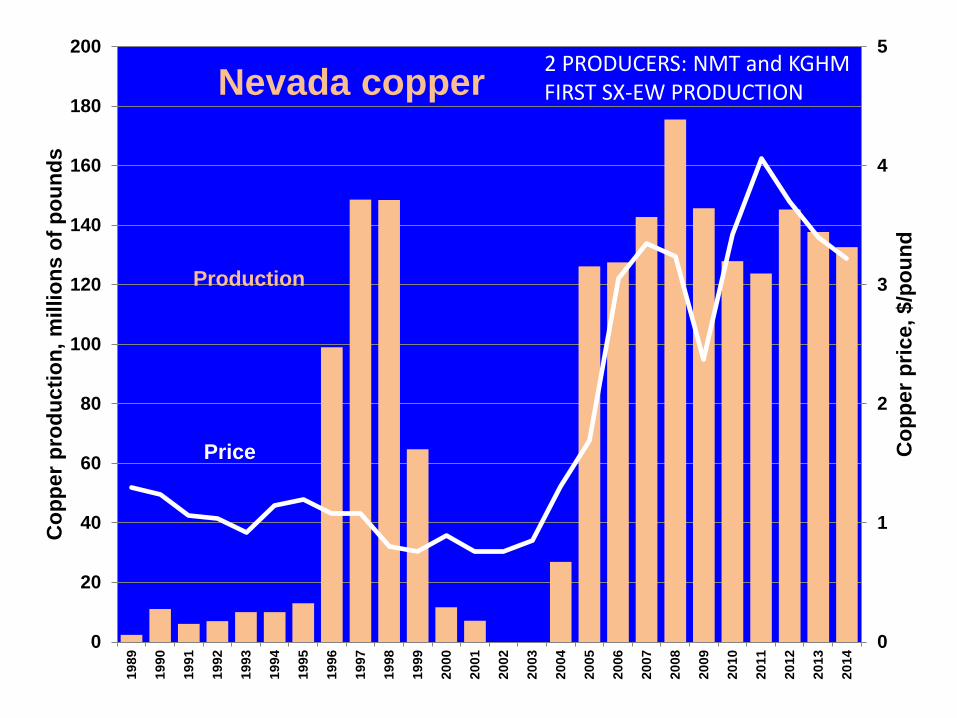
$7.578B USD in 2014 • Base metal (Cu, Mo) production growth has huge potential,
financing and smelting capacity present challenges and opportunities.
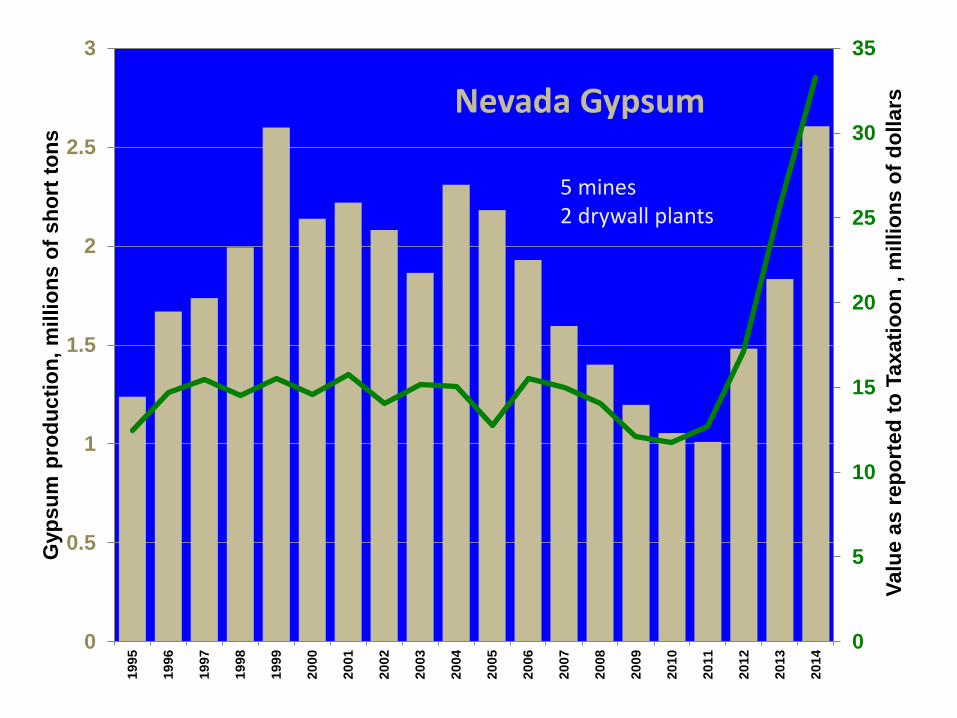
• Industrial minerals and materials production up w/rebound of construction, O&G drilling, manufacturing – gypsum, barite, lithium, lime, aggregates
• Geothermal production on a steady increase, consolidation in market occurring
• Oil production declined again in 2014, tight shale target in Elko County saw first hydraulic fracturing technology used in State; first unconventional oil production in Nevada.
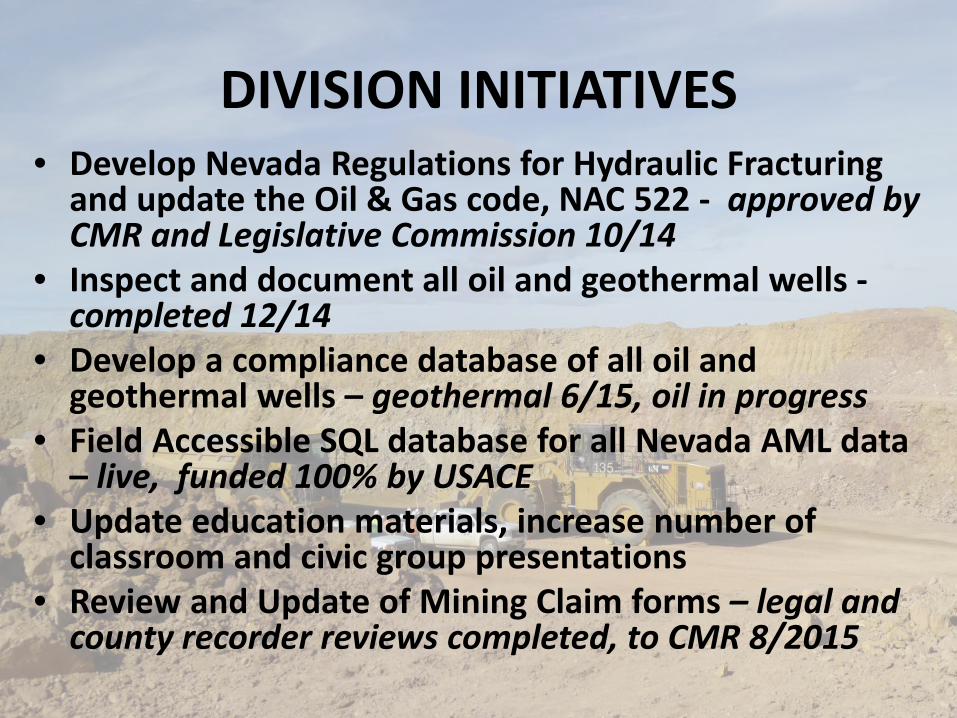
DIVISION INITIATIVES • Develop Nevada Regulations for Hydraulic Fracturing
and update the Oil & Gas code, NAC 522 - approved by CMR and Legislative Commission 10/14
• Inspect and document all oil and geothermal wells - completed 12/14
• Develop a compliance database of all oil and geothermal wells – geothermal 6/15, oil in progress
• Field Accessible SQL database for all Nevada AML data – live, funded 100% by USACE
• Update education materials, increase number of classroom and civic group presentations
• Review and Update of Mining Claim forms – legal and county recorder reviews completed, to CMR 8/2015
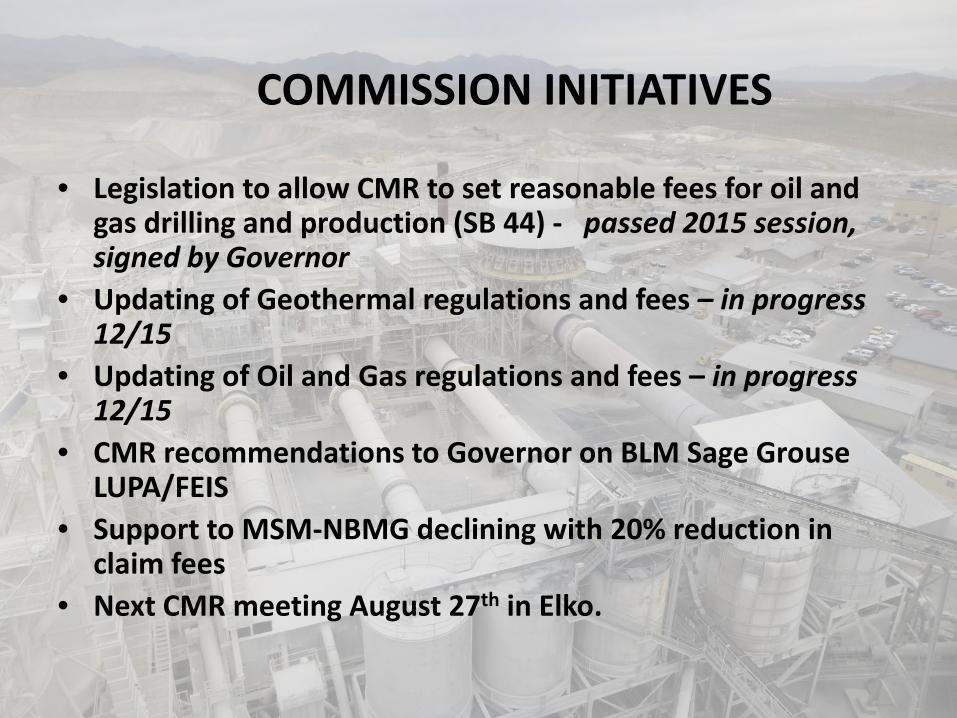
COMMISSION INITIATIVES
• Legislation to allow CMR to set reasonable fees for oil and gas drilling and production (SB 44) - passed 2015 session, signed by Governor
• Updating of Geothermal regulations and fees – in progress 12/15
• Updating of Oil and Gas regulations and fees – in progress 12/15
• CMR recommendations to Governor on BLM Sage Grouse LUPA/FEIS
• Support to MSM-NBMG declining with 20% reduction in claim fees